
Abstract
In electricity markets, ancillary services (AS) are vital to ensuring system reliability through the instantaneous balancing of supply and demand. An important current policy question is whether AS markets clear simultaneously or sequentially with wholesale markets. We develop a model to study the strategic implications of market timing. We demonstrate that a strategic incentive to reduce AS and, consequently, lower marginal cost in the wholesale market arises when markets clear sequentially. Using data from Alberta, we find that the strategic effect has a small impact on wholesale outcomes but a large impact on the AS market.
Introduction
Electricity markets require careful coordination of diverse resources to meet uncertain demand. In restructured markets, suppliers are compensated for providing both electricity and short-term reliability. This has led to the development of two key markets: a wholesale market to compensate for energy provision and an ancillary services market for reliability products. In this paper, we analyze a linkage between these markets that can serve as a strategic commitment mechanism when firms have the ability to exercise market power.
There are a multitude of ancillary service (AS) markets, with their precise details varying by jurisdiction. Common AS products include frequency regulation products that balance instantaneous changes in electricity supply and demand, various contingency reserves that manage larger changes (e.g., due to the loss of a generator), and increasingly ramping products that manage systematic large changes in market conditions (e.g., sunset and reduced solar supply) (Fournié et al., 2016; Pollitt & Anaya, 2020; Van den Bergh & Delarue, 2020). The dramatic growth of renewable resources and their associated variable electricity output has increased the importance of AS markets in ensuring a reliable supply of electricity (González et al., 2014).
A central feature of AS markets is the timing of market clearing in relation to wholesale electricity markets. There are two broad categories of market clearing. First, is joint clearing in which wholesale and AS markets clear simultaneously. This timing is adopted in a number of US markets. 1 Second is sequential clearing, under which the wholesale and AS markets clear sequentially with the AS market typically clearing first. 2 The EU provides numerous examples where AS and wholesale markets clear sequentially (Kumar & Singh, 2021; Papavasiliou et al., 2023).
The timing of AS and wholesale markets has been an important policy question; co-optimization through joint clearing has been argued to improve price signals and incentives, and to lower costs. However, much of the analysis of AS-wholesale market timing assume perfect competition. In contrast, market power in electricity markets is well documented, and its mitigation is a key concern in market design. This suggests a need to consider the potential for market power in AS markets, and particularly for the possibility that market power incentives might result in behaviour in one market in order to influence the degree of market power in another. As an example, strategic interplay between AS and wholesale markets was the subject of antitrust concern in Italy, where firms that were alleged to be colluding were accused of withholding plants in a certain geographic area from the day-ahead wholesale market on particular days (Sundays and holidays), in order to create demand for ancillary products from these plants on those days; the firms then colluded on high bids in the subsequent AS market (Samà & Luchetta, 2012).
To address this gap in the literature, in this paper, we incorporate market power into the discussion of market timing, by analyzing the strategic implications of simultaneous versus sequential market-clearing in wholesale-AS market competition. 3 We assume that generators compete via Cournot competition in wholesale and AS markets. Importantly, the provision of AS output impacts a generator’s cost of providing wholesale output because it precludes the use of a portion (or all) of a generation unit’s available capacity in the wholesale market. Consequently, this creates a linkage between the AS and wholesale market output choices.
We demonstrate that sequential market-clearing can introduce a strategic commitment effect when choosing AS output. When a firm supplies AS output, it increases its cost of providing output in the subsequent wholesale market, in turn committing the firm to compete less aggressively in the wholesale market. The presence of this strategic effect causes the oligopolists to produce less output in the AS market in the sequential timing setting. We show that the strategic effect causes AS market prices to increase and wholesale prices to decrease when the markets clear sequentially compared to simultaneous clearing.
We employ data from Alberta’s wholesale and AS market to demonstrate the quantitative implications of our findings. 4 We use this empirical setting to define our model parameters. Further, we relax a number of assumptions employed in our theoretical model, including allowing for more than two strategic firms, the presence of must-run generation (e.g., wind), import supply, and the presence of a competitive fringe.
Our numerical results demonstrate that the presence of the strategic commitment effect has a small impact on wholesale market outcomes, but a large impact on the equilibrium in the AS market, elevating AS prices. The large effect in the AS market is driven by the fact that the market is highly concentrated and fringe supply is highly inelastic. As a result, small changes in the output by large firms in the sequential setting can have a sizable impact on AS market outcomes. Alternatively, the wholesale market is larger and has a more elastic fringe supply function. This induces smaller differences in equilibrium outcomes in the sequential versus simultaneous market-clearing cases.
When looking across both markets, we find that total procurement costs only increase by a small margin in the sequential move setting. While the AS prices increase considerably, the AS market is relatively small compared to the wholesale market. Consequently, the small price reductions in the wholesale market counteract the large increases in the AS price. This demonstrates that looking only at the AS market outcomes in isolation may lead to conclusions that the elevated market power results in a considerable reduction in consumer surplus. However, this overlooks a key component of the overall market outcome, the impact on wholesale market competition.
Our analysis proceeds as follows. First, we provide an overview of the existing literature. We then describe our duopoly model of AS and wholesale competition, and presents the equilibrium outcomes. Subsequently, we summarize the numerical framework and empirical findings. Finally, we conclude and describe the policy implications.
Related literature
While the economic literature on electricity markets is vast, the majority of studies focus on wholesale and retail energy markets. 5 The literature on AS markets and their interaction with wholesale markets is more limited, although it has seen recent growth due to anticipated increased AS demand resulting from increased renewable generation, and because of the emergence of battery storage as a participant in AS provision; see for example Pandžić et al. (2020) and Khalilisenobari and Wu (2022) for recent optimization models of battery storage supplying into both AS and energy markets.
An important stream of the literature on AS markets considers the benefits of co-optimization of AS and energy, relative to sequential markets. As argued by Baldick (2017), co-optimization through the simultaneous and joint procurement of energy and AS has potential efficiency benefits and can send more valuable price signals, since the same units can potentially supply both AS and energy; an opportunity cost of using a unit to supply AS is that it may not then be available to supply energy. Baldick (2017) suggests that the tendency for AS markets to clear prior to the wholesale market arises because of the inclination of system operators to ensure that there are sufficient reserves secured before resources are used to supply wholesale output. As well, it has been observed that sequential market clearing may have been appropriate when electricity generation was dominated by conventional (coal and natural gas) technologies, but is less so under increased renewable generation (Dominguez et al., 2019). González et al. (2014) suggest that while co-optimization can provide for more efficient dispatch, sequential markets are better suited for simple quantity-price auction frameworks.
Stochastic optimization models designed to quantify the efficiency benefits of co-optimization over sequential markets can be found for example in Dominguez et al. (2019) and Smeers et al. (2022). However, a limiting assumption of many existing studies modeling co-optimization and the interaction between AS and energy markets is the absence of market power. The presence of market power in wholesale energy markets is well established (Borenstein et al., 2002; Brown & Olmstead, 2017; Bushnell et al., 2008), but this recognition has not carried over into modeling of AS. Further, it has been argued that AS markets cannot be as competitive as wholesale energy markets because of a lack of transparency, a disconnect between the demand for AS and who pays for it, and additional risk, suggesting that it is important to account for market power in AS markets (Pollitt & Anaya, 2020). González et al. (2014) survey approaches to jointly modeling energy and AS, and note the relative lack of models incorporating market power, observing (page 109) that “the degree of mathematical complexity turns out to be considerably higher” than in models of energy markets alone.
Empirical studies of AS markets have received less attention in the literature. Existing evidence highlights the importance of accounting for the interplay between these markets, and for considering market power and strategic interaction. Supporting the application of game-theoretical analysis in AS markets, Doraszelski et al. (2018) analyze the UK frequency response market over the first six years of its existence (November 2005 to October 2011), and find that behaviour converged on complete information Nash equilibrium play after approximately 3.5 years. Skytte (1999) analyzes the relationship between prices in the spot market and prices in the regulating (balancing) market in Nord-Pool; the author finds that premiums for regulating products are asymmetrically associated with day-ahead energy prices, creating incentives for firms to bid more aggressively in day-ahead markets. Zarnikau et al. (2019) conduct an empirical analysis of the determination of AS prices in ERCOT; the authors find that the expansion of wind generation has not been associated with increases in AS prices, but argue that continued expansions may lead to AS cost increases. Wang et al. (2011) analyze prices for reserves and regulation services in Ontario, New York, and Texas, and find that these products exhibit prices that are more volatile than energy prices. Buchsbaum et al. (2021) examine the impact of exogenous changes in AS markets on energy markets in the PJM jurisdiction. The authors find that increases in required frequency regulation capacity resulted in changes in the technology used in the energy market, with an increased reliance on combined cycle natural gas generators, and reduced generation from coal-based boiler units; they observe that ignoring interaction between the energy market and related markets such as AS can result in incorrect conclusions regarding policy.
More broadly, our paper is related to the literature considering strategic incentives across electricity markets that clear at different times. These strategic incentives are most commonly discussed in the context of forward contracting, that occurs prior to wholesale market clearing. Allaz and Vila (1993) analyze the potential strategic commitment effects associated with signing fixed-priced forward contracts prior to wholesale market competition. The authors find that strategic forward contracting commits firms to compete more aggressively in subsequent wholesale markets. Empirical evidence regarding the strategic incentives in forward contracting and the effect of forward contracting on subsequent electricity spot markets is presented in Ito and Reguant (2016) and Jha and Wolak (2020). To our knowledge, however, the potential for strategic behaviour in forward markets to influence spot markets has not yet been carried over to the analysis of AS markets, which are the topic of this paper.
Theoretical framework
We present a simple model of AS and wholesale markets to illustrate the strategic incentives firms face in choosing AS output and to highlight the effect of those incentives on market outcomes. 6 It is important to acknowledge that our analysis abstracts from technical engineering-focused aspects associated with the provision of AS products which have received considerable attention in the literature. This allows us to achieve our primary objective which is to understand the strategic implications of AS-wholesale market competition.
Our modeling framework is built on the features of Alberta’s restructured electricity market. 7 We believe the core incentives identified in our analysis extend more broadly to other market designs. We consider a setting where the AS market clears simultaneously or the day prior to the real-time wholesale market. There is no day-ahead wholesale market. Because the markets clear near the realization of demand, and to highlight the strategic incentives in a tractable way, we abstract away from the impacts of uncertainty. In the subsequent empirical analysis, we extend this model to include more than two strategic firms and incorporate additional real-world features such as the presence of must-run generation (e.g., wind) and a competitive fringe. We calibrate our analysis to data from Alberta’s electricity market. We consider an extension that includes forward contracts that are signed weeks or months in advance. Forward contracting has been shown to impact strategic behavior in wholesale markets (Bushnell et al., 2008).
We assume that firms compete as Cournot competitors. This modeling approach has been applied extensively in the literature (e.g., Bushnell et al. (2008)). An alternative modeling framework is the Supply Function Equilibrium (SFE) (Klemperer & Meyer, 1989). While the SFE has been argued to closely reflect reality given firms submit supply functions in practice, it comes at the cost of significant analytical complexity. In addition, it has been argued that the key advantage of the SFE arises in situations where firms submit offers that apply for an extended period of time (e.g., daily) where a wide range of demand is expected (Borenstein & Bushnell, 1999). We consider a setting where firms submit unique offers for each hour of the day.
Model
There are two strategic firms (1 and 2) that generate electricity. The firms compete to supply electricity in two markets: the wholesale and the AS market. In addition, in each market there is a competitive fringe of firms. The two strategic firms take the fringe supply functions in both markets as known and given when they make their production decisions. 8
Market demand in both the wholesale and AS markets are perfectly price-inelastic and denoted by

The residual market demand functions in the wholesale and AS markets faced by the two strategic firms are represented by the perfectly price-inelastic demand minus the supply of the competitive fringe in the relevant market. Consequently, this results in the two firms facing the following inverse residual AS demand function P AS (x1, x2) = A − B (x1 + x2), where A and B are positive constants. 10 Similarly, in the wholesale market, the inverse residual demand function is given by P (q1, q2) = a − b (q1 + q2), where a and b are positive constants. 11
Electricity generators typically own a portfolio of assets with multiple technologies, different marginal costs and limited capacities; for tractability, we approximate this with a linear increasing marginal cost curve. As a result, increased output in one market (either AS or wholesale) will move the firm up along its marginal cost curve, increasing the marginal cost of supplying the other market. To capture this, we suppose that generating firms have quadratic cost functions (with linear marginal costs). The cost function of firm i is given by:

Output sold in the AS market is a commitment to generate electricity as needed in the event of outages and market imbalances. For certain AS products, supplying AS requires the firm to not offer that capacity into the wholesale market; as a consequence, supplying AS can make the associated capacity ineligible for the wholesale market, and shift up the firm’s wholesale marginal cost regardless of whether the AS capacity is actually called upon to generate. To capture these features in a tractable way, we apply a weight η ∈ (0, 1] to AS output in the cost function. Greater values of η may reflect that it is more likely the AS electricity will be supplied; η may also be larger if the generation capacity intended for AS production must be made unavailable in the wholesale market regardless of whether it is ultimately called upon in the AS market. 12 Greater values of η imply that increases in AS output have a greater effect on marginal cost in the wholesale market.
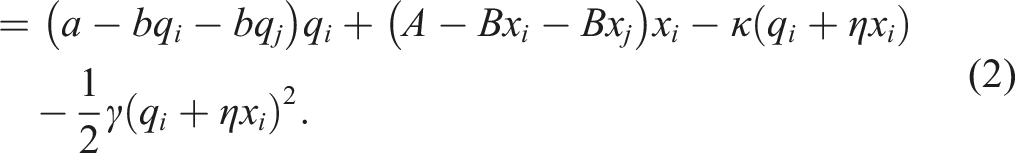
Firms earn revenues from their AS sales as well as their wholesale market output. Firm i’s profits, i = 1, 2, are specified as follows:

We consider two variations in model timing, designed to reflect different market design regimes used in practice. First, we assume that the firms choose their outputs in both markets simultaneously. For this timing, we characterize the pure strategy Nash Equilibrium (PSNE). 13 We then consider the case in which firms choose AS quantities simultaneously first, and then choose wholesale market quantities simultaneously in a second-stage. We solve this case via backwards induction to characterize the subgame perfect Nash Equilibrium (SPNE). Throughout our analysis, we will assume interior solutions. In our empirical application, we will allow for corner solutions.
Simultaneous market-clearing
We first consider a static game, in which firms simultaneously choose both their AS and wholesale market outputs. Firm i chooses q
i
and x
i
to maximize profits, holding q
j
and x
j
constant. Using the profit function specified in (2) yields the following first-order conditions:


These first-order conditions are linked through marginal costs; the greater is x i , the greater the marginal cost of q i , and vice versa. The magnitude of this connection depends on the magnitudes of γ and η. Greater values of γ correspond to a more steeply-sloped marginal cost curve, while increased η results from an increase in the likelihood that the generation required to produce the AS output will be unavailable in the spot market.
Solving these first-order conditions yields a symmetric Nash equilibrium:


In both equilibrium quantities, the third term in the numerator reflects the fact that the marginal cost of supplying output in one market is increasing in the amount supplied in the other market, which in turn is increasing in the demand intercept in the other market. For example, as a, the demand intercept in the wholesale market, increases, the firm’s output in the wholesale market will increase. This will raise the marginal cost of supplying output into the AS market, reducing the firm’s quantity in that market.
Sequential market-clearing
Next, we suppose that the AS market takes place before the wholesale market. In particular, suppose that x1 and x2 are simultaneously chosen in stage 1. The firms observe the AS quantities chosen in stage 1, and then choose q1 and q2 simultaneously in stage 2.
We look for SPNE using backward induction. We use (3) to solve for the second-stage Nash equilibrium in the wholesale market as a function of x1 and x2:


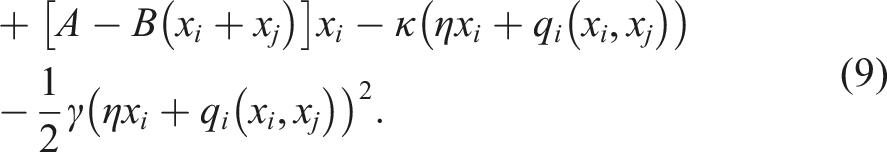
Given the second-stage solutions q1 (x1, x2) and q2 (x1, x2) in (7) and (8), firm i’s first-stage profit function becomes:

Using (9) and recognizing that in the second-stage q
i
will be chosen to set ∂π
i
/∂q
i
= 0, the first-stage first order condition for firm i is:
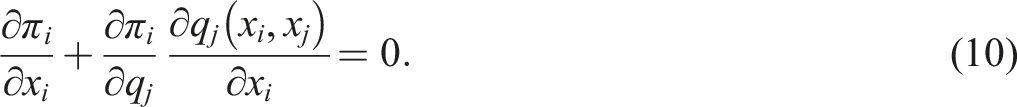
The first expression is the direct effect of x
i
, holding wholesale quantities constant. The second expression is the strategic effect that occurs through the effect of x
i
on firm i’s rival’s wholesale quantity q
j
in the second-stage. The strategic effect can be rewritten as:

The strategic effect is negative; increasing firm i’s AS output increases its second-stage wholesale marginal cost of output, causing its wholesale equilibrium output to decrease, and its rival’s equilibrium wholesale output to increase. An increase in firm i’s rival’s output reduces its profit. This effect will lead firm i to choose a lower AS market output. This suggests a key result: as a result of strategic considerations, in the sequential model firms reduce AS output relative to the simultaneous timing model, subsequently increasing output in the wholesale market as its marginal cost of wholesale production decreases.
The impact of AS output on wholesale market outcomes can be readily observed by investigating the second-stage wholesale output best-response function. Using (3) and holding x
i
as a constant, firm i best-response function in the wholesale market is given by:

A decrease in x i shifts firm i’s best response function outward. Because the (negative) strategic effect detailed above is faced by both firms, this creates incentives for each firm to reduce its AS output below the equilibrium level in the simultaneous model. This causes both firms’ second-stage wholesale market best-response functions to shift outward relative to the case of simultaneous timing. This results in an increase in wholesale market outputs for both firms. Therefore, our model predicts greater wholesale market output and lower AS output in the sequential model than under simultaneous timing. The effect of AS output on a firm’s second-stage best-response function is greater, the larger are η and γ.
Solving for the first-stage Nash Equilibrium

Combining (7), (8), and (13), we can write

To quantify the effect of sequential versus simultaneous timing, let Δq = q sequential − q simultaneous and Δx = x sequential − x simultaneous . It can be shown that at an interior solution, Δq > 0 and Δx < 0; with sequential timing, firms reduce AS market output because of the strategic effect in the wholesale market, resulting in increased wholesale market output. This results in a decrease in the wholesale price and an increase in the AS price.
Next, we consider how different model features affect the impact of changes in AS quantity on wholesale market price. Moving from simultaneous to sequential timing causes firms to decrease AS market output in order to reduce their marginal costs in the wholesale market. In the wholesale market, firm i’s marginal cost curve is given by κ + γ (ηx i + q i ). Reducing AS output by Δx i therefore shifts i’s marginal cost curve down by the amount γηΔx i . It can be shown that the rate of pass-through into the wholesale price due to the shift of the marginal cost curve is given in our context by 2b/3b + γ. Hence, the extent to which a marginal cost reduction in the wholesale market is passed through into the wholesale price will depend upon the slope of the wholesale market demand function and the slope of the marginal cost curve. A increase in the marginal cost parameter (γ) reduces the pass-through rate, while an increase in the slope demand curve (b) would expand the pass-through rate.
Finally, note that our model makes no assumption regarding the length of time between the AS and wholesale markets; we will discuss timing in Alberta’s AS and wholesale markets in the next section. In our simplified theoretical framework, the time lag would not affect the strategic effect, since it is assumed that there is full information about demand, and that under sequential timing, firms observe their rivals’ AS outputs before making decisions in the wholesale energy market. In reality, the likely effect on the strategic effect of the time lag between the two markets is unclear. On the one hand, if wholesale market demand is more uncertain, the further ahead the AS market clears, then there may be less incentive to act strategically. On the other hand, if AS contracts are long term and signed well in advance, then it may be more likely that these commitments are known by rivals, increasing the strategic value.
Numerical analysis
In this section, we employ data from Alberta’s electricity market. The objective of this empirical analysis is not to capture all features of AS and wholesale markets in practice, but rather illustrate our model’s results in a setting that reflects key features of real-world electricity markets. While we extend our theoretical model to capture a number of important features of Alberta’s electricity market, our numerical analysis abstracts away from actual electricity markets in certain ways, such as in the formulation of marginal cost curves.
Data
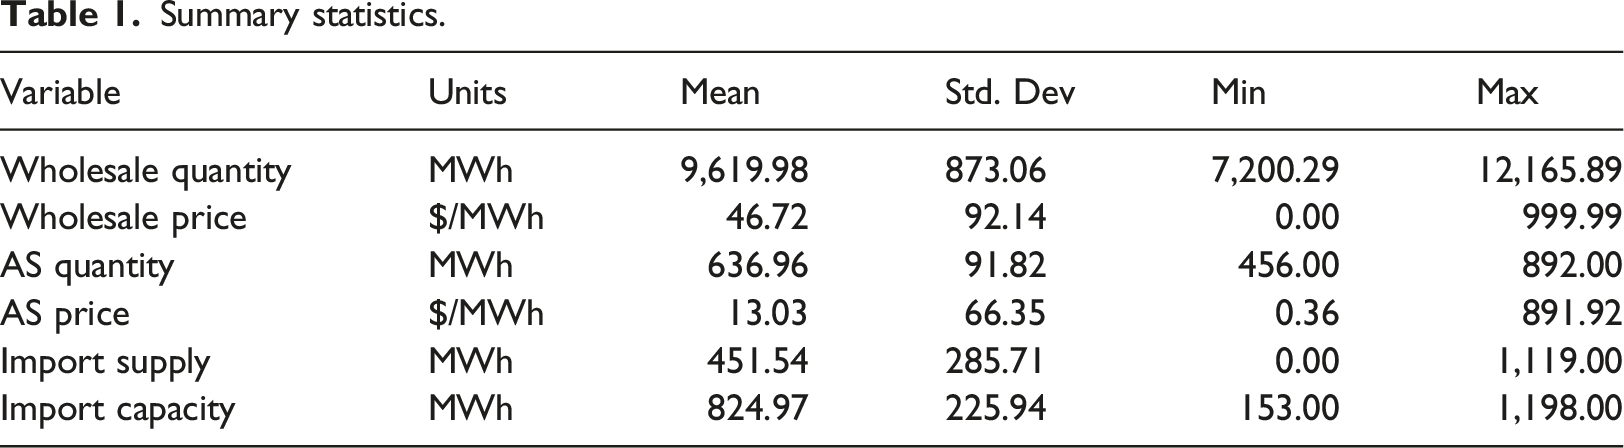
We use data from a number of sources covering the period January 1, 2020 to December 31, 2020. First, we use publicly available data from the Alberta Electric System Operator (AESO) that includes hourly generation unit-level wholesale market production and bids, import supply, available transmission capacity limits from neighboring provinces, market demand, and the ownership and characteristics of generation assets. Second, we use daily natural gas prices from Alberta’s Natural Gas Exchange (NGX). Third, we use weekly Wyoming’s Powder River Basin coal prices provided by the U.S Energy Information Administration to compute fuel input costs for coal units. 14 Fourth, ancillary market data was provided to us by the Market Surveillance Administrator (MSA). 15 These data provide hourly unit-specific information on firms’ price-quantity offers in the AS market and the quantity procured for each AS product. These data will be used to estimate the residual demand facing strategic firms in the AS market.
Summary statistics.
Alberta’s ancillary services and wholesale markets
In this section, we describe the wholesale and AS markets in Alberta. In Alberta, these markets occur sequentially, with the AS market taking place the day before the wholesale market.
Wholesale market
Alberta’s wholesale electricity market operates as an hourly procurement auction. For each hour, generation firms compete by submitting up to seven price-quantity offer blocks for each generation unit, representing the price at which they are willing to supply electricity. Market-clearing is facilitated by the AESO who stacks firms’ offers in order of least-cost and sets the spot price equal to the bid that intersects market demand. All firms receive this uniform market-clearing price. Unlike other jurisdictions with locational pricing, there is a single province-wide wholesale price.
Alberta’s market is an “energy-only” market, meaning that there are no supplemental payments for capacity. Generators rely solely on revenues from generating electricity in wholesale and AS markets to recover their fixed and variable costs. Importantly, the exercise of market power is explicitly permitted, with no bid mitigation. Substantial market power has been observed in high demand hours; see for example Brown and Olmstead (2017). This makes Alberta an ideal setting to analyze firms’ strategic incentives.
In 2020, Alberta’s wholesale electricity market was moderately concentrated with the five largest firms controlling 64% of the province’s generation capacity. The remaining capacity is offered by a large fringe of small firms (MSA, 2020). The largest firm in terms of offer control was TransAlta, with control of 21% of generation capacity. The second largest firm by offer control was the Balancing Pool with control over 14% of generation capacity, followed by Heartland (11%), ENMAX (9%), and Capital Power (8%). 17 Despite the relatively moderate market concentration, prior literature has shown that the unique properties of electricity markets make it particularly susceptible to the exercise of market power (Borenstein et al., 1999). In 2020, 47% of installed generation was natural gas based, followed by coal with 33% of installed capacity, wind (11%), hydroelectic generation (5%), and biogas/biomass (3%) (AUC, 2020).
Ancillary service markets
The AESO procures three type of operating reserves (regulating, spinning, and supplemental), in both active and standby forms (MSA, 2009). Regulating reserves address small minute-to-minute demand and supply differentials, while spinning and supplemental reserves (together, contingency reserves) are designed to address larger disruptions, such as the failure of large generators. Standby operating reserves are called upon when active reserves are unable to produce, which occurs rarely in practice. While assets that are awarded standby contracts may still offer the quantity under those contracts into the wholesale market, quantities under active operating reserve contracts cannot be offered into the wholesale market. As a result, in the remainder of this section, we focus on active reserves.
In contrast to the wholesale market which clears on an hourly basis and in which firms can adjust bids up to 2 hours before the hour, operating reserves are procured in auctions held the business day prior to market clearing; hence, Alberta’s AS and wholesale markets clear sequentially, with the AS market clearing before the wholesale market. Four different active reserve products (on-peak, off-peak, AM super-peak, and PM super-peak) are procured by the AESO in each of the regulating, spinning, and supplemental categories. On-peak refers to the time period from 7:00 AM to 11:00 PM, while off-peak refers to the remaining hours. The AM super peak period stretches from 5:00 AM to 8:00 AM, while the PM super peak period stretches from 4:00 PM to 12:00 AM in November, December, and January, but begins at 5:00 PM in other months (AESO, 2020). These super-peak products provide additional AS beyond the quantities procured for on and off-peak hours. The amounts procured of each product are based on AESO’s forecasted requirements, which are posted in advance.
Generation firms submit bids for each generation unit that they want to use to supply a particular AS product. The AESO stacks these bids in terms of least cost until there is sufficient supply to meet the AS demand for a given reserve product.
The final AS price is determined by a more complex process than in the wholesale market, with a two-part pricing structure. MWs that win in an active reserve auction are paid the subsequent realized wholesale price for the hours associated with the product, plus a premium (which is often negative and therefore a discount). 18 The premium is equal to the average of the marginal offer for that reserve product and the “AESO bid price”, which is known to the bidders. As an example, if the AESO bid price is set at $100/MWs and the marginal offer is -$120/MWs, then winning bidders would receive the wholesale price less a $10 discount (i.e., (100 − 120)/2 = −10). Note that the AS price is provided to suppliers of the AS product regardless of whether they are called upon to supply the AS product in real-time. In addition, active reserve providers are also paid a volumetric payment in the form of the wholesale price for any electricity generated.
Regulating and contingency reserves differ in the number of generating assets that are able to provide them. To provide regulating reserves, a generator must have equipment installed that allows the regulator to automatically control their generation in real-time. Over the year 2020, only 16 generating units, under the offer control of 9 firms, provided regulating reserves. In contrast, in 2020, active spinning reserves were provided by 35 assets (15 firms), while supplemental active reserves were provided by 47 assets (21 firms).
During our sample period, AS is primarily supplied by hydro and cogeneration units. In particular, hydro and cogeneration supply 69% and 30% of the active regulating reserve. Active spinning reserves are supplied by hydro (56%), coal (28%), cogeneration (9%), and other (7%). Finally, the smallest AS product, supplemental reserves, is supplied by load shedding from large industrial customers (36%), hydro (20%), gas (13%), cogeneration (12%), and coal (11%), and other (8%). Other represents a mix of biomass, wood, and battery storage. 19
The active AS market is highly concentrated. In 2020, TransAlta provided the highest percentage of all three types of active operating reserves, by MWhs: 69%, 63%, and 48% of regulating, spinning, and supplemental reserves, respectively. The second highest market shares in each category were ENMAX (24%) in regulating reserves, the Balancing Pool (16%) in spinning reserves, and Heartland Generation (11%) in supplemental reserves. Consequently, we treat the AS market as having a number of large strategic firms, with the remaining supply being provided by a number of small generators that we classify as the competitive fringe.
Estimation methodology
In this section, we describe how we adapt our model to fit the characteristics of Alberta’s electricity market. Our objective is to use our modeling framework to capture key features of Alberta’s electricity market, while balancing numerical tractability.
Recall from above, Alberta’s market has five large firms and a fringe of small producers. One of the large firms, the Balancing Pool, is a government-owned agency that is observed to offer its supply near marginal costs. 20 Consequently, we model the Alberta setting as one with four large strategic firms behaving as Cournot producers in both the AS and wholesale markets, taking the supply from price-taking fringe producers, and imports in the case of the wholesale market, as given.
In the wholesale market, we formulate the price-elastic demand function facing the strategic Cournot producers as the perfectly price-inelastic wholesale demand, net of price-responsive supply from importers from neighboring jurisdictions and fringe producers. In the AS market, the AS demand function represents the pre-specified AS quantity set by the AESO, net of price-responsive supply from fringe firms that are observed to compete in these auctions. Unlike the wholesale market, importers cannot supply the AS product. More details on the construction of residual demand functions are given below.
We compute unit-level marginal cost functions for the four large strategic firms and estimate linear marginal cost functions associated with generating output. This is consistent with the cost functions utilized in our model. Firms also have must-run generation units (e.g., wind and cogeneration) whose supply into the wholesale market is exogenously determined and has zero marginal cost. We take this supply as given.
After establishing parameter estimates for the wholesale and AS residual demand functions and firms’ marginal cost functions, we adapt our model to consider four firms and permit zero marginal cost must-run generation, and use the equilibrium wholesale and AS market output levels to numerically solve the simultaneous and sequential move models for each hour in our sample. Our model can be translated into a mixed complementarity problem (MCP) where we allow for the presence of a zero-bound on AS market output. 21 We utilize the PATH solver in GAMS and the University of Wisconsin’s NEOS server to solve the large number of model cases (Czyzyk et al., 1998; Ferris & Munson, 2000). 22
Marginal cost functions
We estimate the marginal cost of each fossil-fuel generation unit using coal (C) and natural gas (G) price data
Data on unit-specific heat rates for natural gas units were provided to us by Alberta’s Market Surveillance Administrator, the Alberta Utilities Commission, and the Alberta Electric System Operator. Coal unit heat rates were obtained from CASA (2004). We use data from EIA (2020) to compute technology-specific variable O&M costs. Alberta has a carbon pricing policy with a price of $30 per tCO2e during our sample period. We utilize the methods established in Brown et al. (2018) to compute the environmental compliance cost.
There are a large number of wind and cogeneration facilities in Alberta. Cogeneration units generate heat and electricity as a by-product of an on-site industrial process; electricity that is not consumed on-site is sold in the wholesale market and offered at a price of $0/MWh. Wind output is exogenously determined and also bids in at a price of $0/MWh. We define the output from these units to be must-run and have a marginal cost of zero.
Finally, there are several small hydroelectric facilities. Computing the marginal cost of these units is complicated by the fact that hydro units can shift their generation potential across time period, so that their marginal cost represents the opportunity cost of using the energy at some other point in time. Further, hydro facilities face other complex regulatory and ecological constraints. We follow the approach employed by Borenstein et al. (2002), Mansur (2007), and Brown and Olmstead (2017) and assume that the output generated by the hydro units is identical to the level that would be produced by a price-taking firm. This results in taking hydro output as given and analyzing the strategic firms’ use of fossil-fuel units to meet the remaining demand. 24
For each hour, we stack each firm’s dispatchable generation units in order of least-cost to formulate a step-wise discontinuous marginal cost function. We approximate this cost function using a linear regression to establish a linear marginal cost curve for each hour. We use these estimates to construct a month-by-hour representative marginal cost function for each of the four strategic firms. 25 These cost functions are utilized to represent the cost of supplying dispatchable output in either the wholesale or AS markets.
Figure 1 provides a representative observed and estimated marginal cost function for each firm in our sample. The linearization of marginal cost fit the observed marginal cost curves reasonably well with average R-squared values ranging from 0.66 – 0.77. Observed and estimated marginal costs by firm - January 7, HE 1.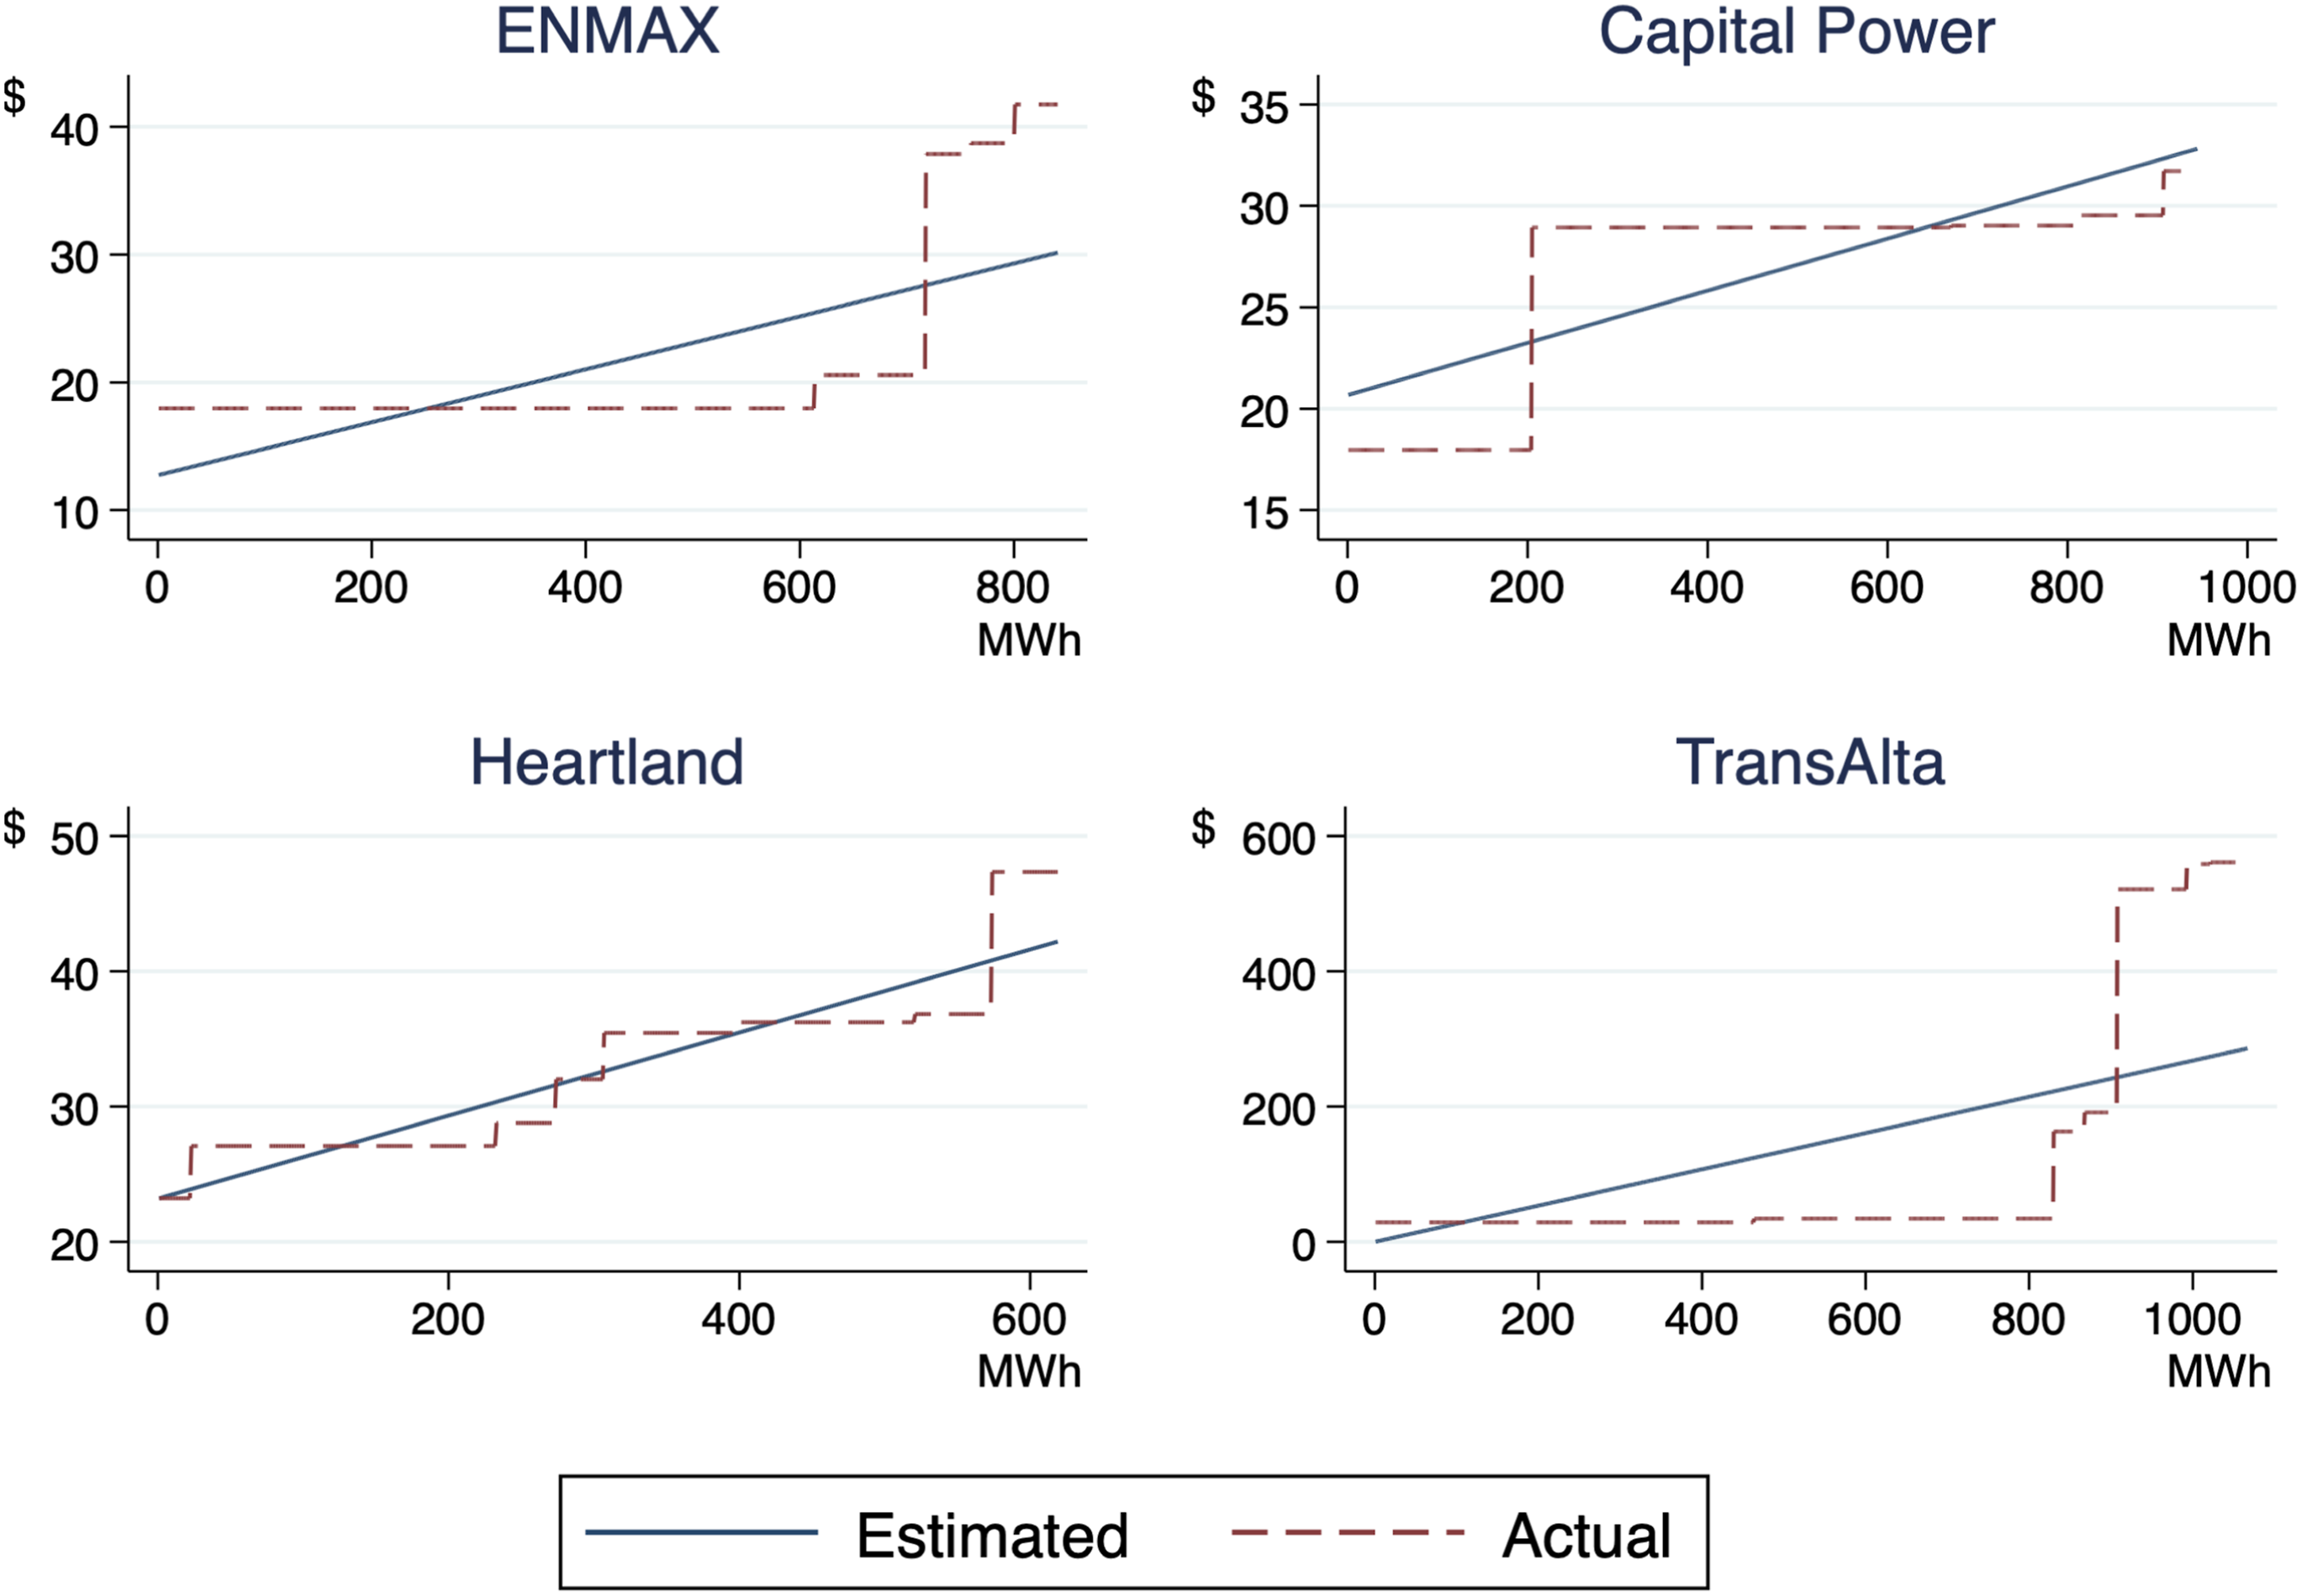
As highlighted in Figure 1, our cost function estimates reveal important asymmetries across firms; see also Table C.2 in Appendix C.1, which reports average cost function parameters over our sample period for each of the four firms. While Heartland, Capital Power, and ENMAX exhibit relatively flat marginal cost curves, with average constant marginal cost terms (κ) ranging from 11.41 to 23.02 and average slope parameters (γ) from 0.02 to 0.03, TransAlta’s marginal cost function generally involves a lower constant marginal cost component (κ = 7.39 on average) but a much steeper slope (γ = .19 on average). This steep slope of TransAlta’s marginal cost curve comes from high offers from its hydroelectric units, which as discussed above are taken as reflective of marginal cost. Hydro marginal costs may be high because of ecological or regulatory constraints, or because of the opportunity cost arising from not employing the resource in another hour. 26
Another key parameter in the total cost function in (1) is η ∈ (0, 1], the weight on AS output in the cost function reflecting that the AS output may not be physically called upon to generate. We do not have data that details how much AS is physically produced. As noted above, there are three AS products, Regulating, Spinning, and Supplemental. MSA (2009) indicates that approximately 50% of the AS procured to provide Regulating Reserve will be physically called upon to supply output. The remaining products are called upon infrequently (in
Residual demand estimation
The downward-sloping residual demand functions faced by the four strategic firms in the wholesale and AS markets are constructed from an inelastic demand level, less upward sloping import and fringe supply curves. We estimate residual demand faced by the four strategic firms in the wholesale market in two parts. First, there are imports supplied from neighboring jurisdictions into Alberta. Imports are scheduled in the day-ahead market and considered to be must-run (i.e., are bid-in at a price of $0/MWh). Treating these MWhs as must-run would be inappropriate because importers make their decisions based in part on their expectations of the wholesale spot price in Alberta. Consequently, we follow the approach in Mansur (2007), Bushnell et al. (2008), and Brown and Olmstead (2017) and use a reduced-form approach to estimate the hourly price-responsive supply of electricity from neighboring jurisdictions British Columbia, Montana, and Saskatchewan.
For each hour t, we estimate imports as a function of the wholesale price 

The wholesale electricity price
The IV regression results are reported in Table B.1 in Appendix B. As expected, failure to account for the endogeneity of the wholesale price in the import supply function leads to attenuation bias in the pool price coefficient in the OLS specification where the endogeneity of the pool price is not accounted for. In the first-stage of the IV regression, forecasted demand has a positive and statistically significant effect on the pool price. 27 The average estimated price-elasticity of import supply equals 0.27.
Second, we use bid data from the fringe firms to establish an hourly fringe supply curve in the wholesale market. More specifically, we order the fringe supply in terms of least-cost and run a linear regression to approximate the fringe supply curve. Ito and Reguant (2016) employ a similar approach to estimating the strategic firms’ residual demand function. We utilize the estimated hourly linear import and fringe supply functions in the wholesale market to construct the residual demand faced by the strategic firms.
At each price, residual demand equals the perfectly price-inelastic market demand minus the estimated supply from imports and fringe firms. The average price-elasticity of residual demand is −0.066. This falls in line with estimates for the PJM and New England regions of the United States found in Bushnell et al. (2008).
In translating data from Alberta’s AS markets into a form that can be analyzed with our modeling framework, our objective is not to capture all features of Alberta’s AS market, but rather to use characteristics of Alberta’s market as a setting to illustrate the strategic implications of AS-wholesale market competition. Unlike the wholesale market where there is a single product procured in each hour, there are three AS products that are procured in multi-hour blocks. We aggregate the AS products into a single hourly product by calculating the total AS quantity being procured across each of the products. We expand the four multi-hour AS product blocks to the hourly level based upon the specific hours covered by each block.
As described above, the AS market has a two-part pricing structure where there is a fixed $/MW payment plus supplemental payments per-unit for generation called upon to provide AS. The bids within the AS market to determine the fixed component reflect a discount relative to the realized wholesale price. We assume that firms have perfect foresight on the realized wholesale price level. In particular, we compute their ex-post realized final AS bids once the wholesale price is determined. 28 These final bids are used to represent the $/MW price at which they are willing to provide the AS product. 29 To compute the volumetic (per-unit) payment for any dispatched AS output, we multiplly the realized wholesale price by the expected probability that a unit providing AS will be called upon to supply the associated output.
As with the wholesale market, the residual demand function for AS faced by large strategic firms is constructed by subtracting the upward sloping fringe supply curve for AS from the inelastic AS demand determined by the system operator. Similar to the wholesale market, we follow the approach employed in Ito and Reguant (2016) and use the final AS bids of the small fringe firms to establish an hourly fringe supply curve in the AS market. We run a linear regression to approximate the fringe supply curve. In each hour, the residual AS demand curve faced by the strategic firms equals the price-inelastic total AS procurement quantity set by the regulator minus the estimated AS fringe supply curve. The average price-elasticity of fringe AS market supply equals 0.20. This inelastic AS fringe supply is consistent with the limited fringe supply in the AS market.
Numerical results
Symmetric firms - Heartland parameters.
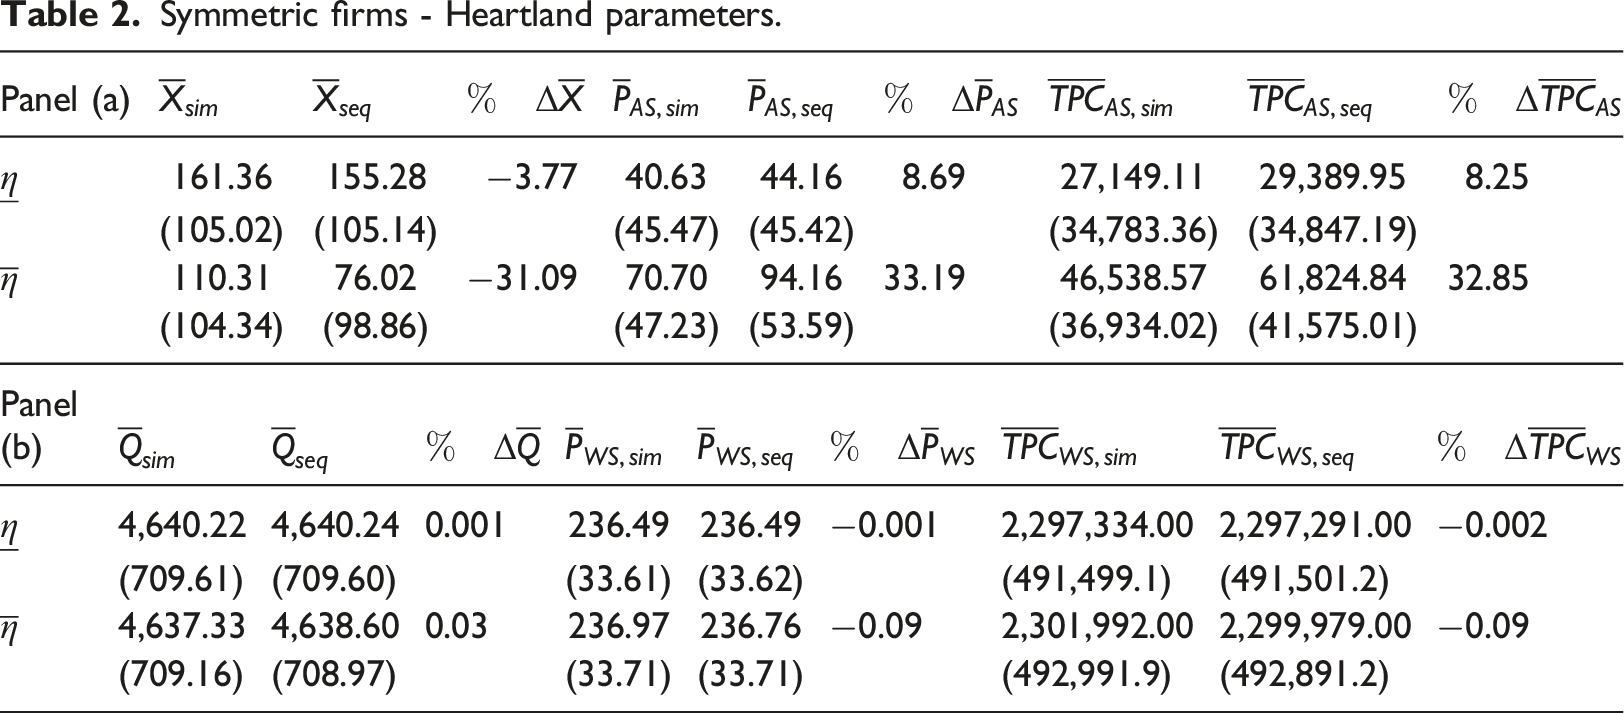
Moving from simultaneous to sequential timing reduces the average total AS output produced by the strategic firms by −3.77% under
To consider the effect of timing on procurement costs, for each setting j ∈ {sim, seq}, we calculate the total AS procurement cost (TPCAS,j) by multiplying the aggregate amount of the AS products procured (from both the strategic firms and the competitive fringe) by the market-clearing AS price. The percentage change in the total AS procurement cost of moving from the simultaneous to the sequential move setting is represented in Panel (a) of Table 2 by
Wholesale market effects are given in Panel (b) of Table 2.
We assess the percentage change in the average total procurement cost
While the reduction in total procurement cost in the wholesale market is small in percentage terms, it has potentially important policy implications because of the large size of the wholesale market relative to the AS market. Combining procurement costs in the two markets, we find that even though AS procurement costs increase by 8% and 33% in the
As observed in (11), a key determinant of the strength of the strategic effect and the pass-through of marginal cost increases into wholesale prices is the parameter γ, which determines the slope of the marginal cost curve. Continuing with the Heartland parameters and focusing on the
We also ran our analysis with symmetric firms using the other three large firms’ cost function parameters: Capital Power, ENMAX, and TransAlta. Detailed results are reported in Tables C.3, C.4, and C.5. Detailed results are reported in Tables C.3, C.4, and C.5. As expected, because of the similarities in their cost functions, the Capital Power and ENMAX parameters yield results closely resembling those from the Heartland Parameters. In contrast, using the parameters for TransAlta’s marginal cost curve yields a larger (although still small) average wholesale price reduction of $0.71/MWh, compared to $0.21/MWh using the Heartland parameters. This increased wholesale market effect is the result of TransAlta’s increased marginal cost slope, leading to increased strategic effects.
We run our analysis using the observed asymmetric cost function parameters. These results are reported in Table C.6. Looking at the market-level results, we find comparable qualitative conclusions to those discussed using Heartland’s parameters above.
More interesting in the asymmetric setting is to consider the implications of timing on the outcomes of individual firms. When
The firm-level effects in the wholesale market are in the opposite direction, although small, with TransAlta increasing wholesale output by 0.7 MW and the other three firms reducing wholesale market output by less than 0.2 MW each. In net, wholesale output increases by a small margin. These results show that firm asymmetries can lead to different strategic incentives at the firm level given the various countervailing incentives. Regardless, looking at the market-level results, our key qualitative conclusions drawn from the symmetric setting persist.
Finally, we consider an extension that includes fixed-priced forward contracts. Forward contracts have been shown to have an important impact on wholesale market outcomes and reduce firms’ incentives to exercise market power (Bushnell et al., 2008; Wolak, 2007). Appendix C.3 provides a detailed discussion of our adjusted empirical approach with forward quantities. 32 In our setting, forward contracts decrease the magnitude of the strategic effect because firms have reduced wholesale output that is exposed to real-time wholesale prices. 33 Consequently, firms are less concerned about how AS output impacts the wholesale market via the effect it has on the wholesale spot price. The Tables presented in Appendix C.3 demonstrate that while the magnitude of the effects are reduced, our key conclusions persist. 34
Conclusions and policy implications
In this paper, we assess the strategic implications of simultaneous versus sequential wholesale and ancillary service (AS) market-clearing. The exponential growth in renewable energy resources and the associated challenges with its variable output has led to increased interest in and importance of AS markets. A central design feature of AS markets is whether these markets clear before or with wholesale markets. Despite the importance of AS markets and continued concerns of market concentration in the electricity sector, the strategic implications of the timing of wholesale-AS market-clearing have not been explored in the literature.
To fill this gap, we develop a Cournot model to evaluate the interaction between the wholesale and ancillary services markets. In our model, we allow the provision of AS output to impact the firms’ costs of supplying output in the wholesale market. This creates a linkage between the supply of wholesale and AS output.
We demonstrate that a strategic incentive arises in the setting where the AS market clears prior to the wholesale market. In particular, we show that firms have an incentive to reduce their AS output in this setting because it allows them to commit to competing more aggressively in the subsequent wholesale market. The presence of this strategic incentive leads to a higher AS market-clearing price, but puts downward pressure on the wholesale price. Consequently, the net effect of moving to sequential timing on the total procurement costs across both markets is ambiguous.
We employ data from Alberta’s wholesale and AS markets to calibrate our theoretical model. We find that the presence of the strategic effect has a large impact on the AS equilibrium outcome, leading to AS price increases ranging from 8% to 33%. These large effects are driven by the highly inelastic supply of fringe producers limiting the competitive forces faced by the large strategic firms. Alternatively, we find that the change in wholesale-AS market timing has a minimal impact on the wholesale market. This is driven in part by the more elastic fringe supply function in the wholesale market.
When computing the total procurement costs associated with both the wholesale and AS markets, we find that total procurement costs increase as a result of moving to sequential market clearing. However, the change in total procurement cost is small. While there is a large AS price increase, the AS market is considerably smaller in magnitude compared to the wholesale market. The small price reduction in the wholesale market helps mitigate the large price increase observed in the AS market. In net, the change in total procurement costs is negligible in our numerical application. Consequently, our results stress the importance of looking at the net effect across both markets given the countervailing impacts that sequential market-clearing has on the equilibrium outcomes in these markets. Focusing only on one market (e.g., the AS market) in isolation may lead to incorrect policy recommendations.
Our analysis highlights another channel through which AS and wholesale market timing can impact equilibrium outcomes when firms have market power. This provides a contribution to ongoing policy debates over market timing as certain jurisdictions (e.g., the European Union) continue to broadly use sequential market-clearing, while other markets (e.g., the United States) have largely adopted a co-optimization (simultaneous) framework (Baldick, 2017). This channel operates alongside the engineering-centric impacts of market timing which has been the focus of much of the literature and policy discussions to date.
The concerns of market power in wholesale and AS markets can be addressed in part by implementing policies that require firms’ bids to reflect their marginal cost of production. These bid mitigation policies have been implemented in various jurisdictions worldwide. 35 More broadly, market power can be mitigated by reducing market concentration through either explicit regulations such as the divestiture of assets (Brown et al., 2023) or via entry of new resources (such as battery storage) that are owned and operated by small non-strategic firms.
Our modeling framework was designed to illustrate the implications of market timing in a simplified setting to isolate the key forces at play. Future research could incorporate technical features of AS markets that could limit the types of resources that provide the various AS products. Consideration of these technical features could potentially increase the market concentration of certain AS products resulting in even larger AS price impacts due to the changes in market timing. As well, our analysis assumed that wholesale and AS demand levels are known with certainty. Under stochastic demand, demand levels in the two markets would be expected to exhibit positive correlation, as increased wholesale demand leads system operators to acquire greater AS quantities. The implications of stochastic demands are a potential subject for future research.
In addition, we use a simplified cost function to facilitate analytical results and numerical tractability. Future research should consider a more complex cost function that permits non-linear marginal cost or even a unit-level analysis with capacity constraints. Such an analysis may generate larger wholesale price effects under certain conditions. For example, if we are in a market where AS output is systematically supplied by peaker gas units, then the firm’s marginal cost curve in the wholesale market would experience a distinct upward shift at higher levels of output which are often called upon to supply during high demand hours. This may lead to a larger wholesale price difference as the market timing varies in high-demand hours where firms’ incentives and abilities to exercise market power are magnified. This has the possibility to enhance the magnitude of the total procurement cost reduction as we move to sequential market-clearing because of the large scale of the wholesale market.
Our analysis also abstracts from the specific characteristics of technologies. One emerging technology, battery storage, is playing an increasing role in AS markets. The technical opportunities and challenges of battery storage has been considered in other studies (Prakash et al., 2022). For the purposes of our analysis, the impact of battery storage will depend on who owns and operates this capacity. If this supply is operated by small fringe firms, the strategic incentives in our analysis will be mitigated. However, if these resources are owned by large strategic firms, we anticipate that the strategic incentives to adjust output on these resources to impact the firms’ broader portfolio will remain. 36 The specific role and implications of different technologies on strategic incentives, including battery storage, should be considered in future research.
Finally, our analysis considers a relatively simple market design with a single AS and wholesale market that abstracts from various market features. Future research should consider additional characteristics such as a day-ahead wholesale market, the inclusion of demand uncertainty reflecting market-clearing further in advance of realized demand, the potential implications of dynamic costs, and explicitly consider the two-part pricing structure (i.e., a $/MW payment for providing AS and a volumetric payment for realized generation) that is common in AS markets. Despite these additional features, we believe that the key strategic incentives of wholesale-AS market competition we have isolated will persist.
Supplemental Material
Supplemental Material - Strategic interaction between wholesale and ancillary service markets
Supplemental Material for Strategic interaction between wholesale and ancillary service markets by David P. Brown, Andrew Eckert, and Douglas Silveira in Competition and Regulation in Network Industries
Footnotes
Acknowledgements
We thank two anonymous referees for their helpful comments and suggestions.
Declaration of conflicting interests
The author(s) declared no potential conflicts of interest with respect to the research, authorship, and/or publication of this article.
Funding
The author(s) disclosed receipt of the following financial support for the research, authorship, and/or publication of this article: This research project received support from the Government of Canada’s Canada First Research Excellence Fund under the Future Energy Systems Research Initiative and the Social Sciences and Humanities Research Council’s Canada Research Chair program.
Supplemental Material
Supplemental material for this article is available online.
Notes
References
Supplementary Material
Please find the following supplemental material available below.
For Open Access articles published under a Creative Commons License, all supplemental material carries the same license as the article it is associated with.
For non-Open Access articles published, all supplemental material carries a non-exclusive license, and permission requests for re-use of supplemental material or any part of supplemental material shall be sent directly to the copyright owner as specified in the copyright notice associated with the article.