
Abstract
Background:
Knee osteoarthritis (KOA) is a major global cause of disability. Traditional burden metrics quantify disease magnitude but may overlook system-level outcomes. The Chronic Disease Quality of Life Index (CD-QoLI) was developed to capture these broader impacts.
Objectives:
To assess the global impact of KOA using the CD-QoLI, focusing on long-term trends, regional disparities, and future projections.
Design:
A global population-based modelling study.
Methods:
KOA data were obtained from the Global Burden of Disease Study and included incidence, prevalence, and years lived with disability (YLDs) across 204 countries and territories. CD-QoLI was derived from two standardized epidemiological ratios to reflect system-level outcomes. Temporal trends were quantified using annual average percentage change (AAPC), and forecasting models projected values to 2040. Analyses were stratified by sex, age, and Sociodemographic Index (SDI) regions.
Results:
Globally, KOA incidence, prevalence, and YLDs increased substantially over the study period. Over the same period, CD-QoLI declined from 0.812 to 0.700 (AAPC: −0.50); in this study, lower CD-QoLI values indicate a relatively more favorable system-level balance between KOA burden and outcomes, and declines were more pronounced in high- and middle-SDI regions. Females and older adults consistently showed lower scores, while individuals aged 15–49 years exhibited a reversal from decline to improvement after 2014. Low-SDI regions displayed persistently higher or rising CD-QoLI values. Spatial analyses indicated marked cross-national heterogeneity, with several high-income countries showing increasing CD-QoLI trajectories over time, whereas others experienced notable declines. Overall, CD-QoLI levels were strongly inversely correlated with SDI (ρ = −0.884). Projections to 2040 indicate persistent disparities, particularly among younger populations and low-SDI areas.
Conclusion:
Although KOA burden continues to rise, improvements in system-level outcomes remain uneven across regions, age groups, and development levels, emphasizing the need for targeted and equitable chronic care strategies.
Plain language summary
Knee osteoarthritis (KOA) is one of the most common joint diseases and a major cause of disability worldwide. Most studies describe KOA using measures such as how many people are affected or how many years of healthy life are lost. However, these numbers do not always show how well health systems are helping patients live better with the disease. In this study, we used a new measure called the Chronic Disease Quality of Life Index (CD-QoLI), which combines different indicators to show how KOA affects daily life and health system performance. We analyzed data from 204 countries and territories between 1990 and 2021 and made projections to 2040. We found that although KOA cases continue to rise globally, the CD-QoLI has declined overall, meaning that many people’s quality of life has not kept up with improvements in treatment and care. The results also varied a lot by region, age, and sex: younger adults in some countries showed improvements after 2014, while older adults and women consistently reported worse outcomes. Countries such as Japan and Finland showed progress, but others, like Afghanistan and South Sudan, declined sharply. Our findings show that simply reducing the number of KOA cases is not enough. Health systems need to focus on improving function and quality of life, especially for disadvantaged populations, to ensure fairer and more effective care worldwide.
Introduction
Knee osteoarthritis (KOA) is the most common form of osteoarthritis (OA), a chronic degenerative joint disease that affects millions of individuals worldwide. 1 Characterized by cartilage degradation, subchondral bone remodeling, and synovial inflammation, KOA leads to progressive pain, stiffness, and functional limitations, particularly among older adults.2,3 As global populations age and obesity becomes more prevalent, the burden of KOA is expected to rise substantially. 4 Unlike other life-threatening chronic diseases, KOA predominantly affects quality of life rather than mortality, making it a key target for health systems aiming to promote healthy aging and reduce disability.5,6
In recent decades, research into KOA has expanded beyond clinical management to encompass its broader societal and public health impact. 7 Large-scale epidemiological studies have highlighted a rising global burden of KOA, particularly in aging populations and in low- and middle-income countries experiencing rapid lifestyle transitions.8,9 Meanwhile, advances in patient-reported outcome measures and health-related quality of life assessment tools have facilitated more nuanced evaluations of how KOA affects individuals beyond pain and mobility-capturing emotional well-being, social participation, and daily functioning.10,11 Despite these developments, most longitudinal analyses still rely on traditional metrics such as prevalence and disability-adjusted life years (DALYs), which may underestimate the lived experience of those affected. 12 Furthermore, comparative evaluations across regions, age groups, and socioeconomic strata remain limited, hindering a comprehensive understanding of global disparities in the quality of life impact of KOA.
To address this gap, we proposed the chronic disease quality of life index (CD-QoLI)—a composite measure we constructed to reflect the long-term quality-of-life burden of chronic conditions such as KOA. Rather than focusing solely on traditional metrics like mortality or disability rates, the CD-QoLI integrates multiple dimensions of chronic disease burden to capture a more nuanced picture of population health. In this study, we applied the CD-QoLI to evaluate global and regional trends in KOA from 1990 to 2021, and projected its trajectory through 2040, offering insights into long-term planning for chronic disease management.
Materials and methods
Data sources and study design
We conducted a global population-based modeling study focusing on KOA-related burden and quality of life.13,14 Epidemiological data were systematically collected from the Global Burden of Disease (GBD) 2021 study, including annual estimates of incidence, prevalence, and Years Lived with Disability (YLDs) for KOA from 1990 to 2021. 15 The dataset covered 204 countries and territories and was stratified by sex (male and female), 3 age groups (15–49, 50–74, and 75+ years), 5 Sociodemographic Index (SDI) regions (low, low-middle, middle, high-middle, and high), and 21 GBD-defined geographic regions. These standardized metrics allowed for cross-national comparisons and longitudinal trend analysis. Our study design focused on capturing global, regional, and demographic patterns of KOA-related quality of life, as well as forecasting future trajectories based on historical trends.
Case definition and inclusion/exclusion criteria
KOA cases were identified using standardized diagnostic coding systems applied in hospital records and claims databases worldwide. Case definitions were based on the International Classification of Diseases (ICD), including ICD-10 codes M17–M17.9 and ICD-9 codes 715.16, 715.26, 715.36, and 715.96, which encompass both primary and secondary KOA. All individuals meeting these ICD-based diagnostic definitions were included in the GBD 2021 estimates from 1990 to 2021 across 204 countries and territories. 16 Annual population-level estimates of incidence, prevalence, and YLDs were extracted for all eligible strata defined by location, year, sex, and age group. Analyses were conducted using aggregated, model-based GBD data rather than individual-level records.
Chronic disease quality of life index
To construct a standardized index reflecting KOA-associated quality of life at the population level, we developed the CD-QoLI.17,18 To construct a standardized index reflecting KOA-associated quality of life at the population level, we developed the CD-QoLI.
The first indicator (I1) was defined as the incidence-to-YLD ratio. It captures the relative magnitude of new disease onset compared with the resulting disability burden, serving as a proxy for the balance between disease occurrence and chronic disability. A higher I1 suggests a relatively more acute impact, whereas a lower I1 indicates that each incident case contributes to a greater long-term disability load:
The second indicator (I2) was defined as the inverse of the logarithm of the prevalence-to-incidence ratio, expressed as 1/ln(1 + prevalence/incidence). This formulation reflects the chronicity of KOA by quantifying the extent to which the condition persists in the population. A higher I2 implies shorter average disease duration or faster turnover, whereas a lower I2 indicates prolonged persistence typical of chronic conditions such as KOA:

For each unique combination of location, year, sex, and age group, we calculated I1 and I2, then applied Z-score standardization to remove unit-related discrepancies and enable comparability:

where Xi denotes the original indicator value, μ the sample mean, and σ the standard deviation across all observations.
We then applied principal component analysis (PCA) to the standardized I1 and I2 values. 19 The first two components were extracted, and a composite PCA score was computed as a weighted sum of PC1 and PC2, using their explained variance proportions (ω1, ω2) as weights:

To enhance interpretability and ensure all values were positive and continuous, we applied an exponential transformation:

In brief, CD-QoLI is a system-level proxy summarizing the balance between KOA epidemiological burden (incidence, prevalence, and YLDs) and disability-related outcomes, rather than a patient-reported QoL scale. Lower CD-QoLI values indicate a relatively more favorable burden–outcome balance, whereas higher values suggest a greater mismatch. CD-QoLI was calculated annually from 1990 to 2021 across 204 countries and territories, stratified by age group, sex, and location, and used as a core outcome for subsequent trend analyses and projections.
Temporal trend analysis
For prevalence, incidence, and YLDs, we calculated the Estimated Annual Percentage Change (EAPC) over the period 1990 to 2021. 20 EAPC reflects the average yearly rate of change and was estimated by fitting a linear regression model to the natural logarithm of the indicator values across time:

where yt is the value of the indicator in year t, and β is the slope. The EAPC was then computed as follows:

A positive EAPC indicates an increasing trend, while a negative EAPC suggests a decreasing trend. Corresponding 95% confidence intervals (CIs) were calculated to determine statistical significance.
For the composite CD-QoLI, we applied joinpoint regression analysis to identify a significant breakpoint year representing a change in trend direction. Based on the identified joinpoint, we calculated the Average Annual Percentage Change (AAPC) for each linear segment-specifically, from 1990 to the breakpoint year and from the breakpoint year to 2021-thereby capturing distinct phases in the CD-QoLI trend trajectory. 21 AAPC for each segment was derived from the average slope of log-transformed values, using the following transformation:

where β_avg denotes the mean slope within each time interval. This allowed us to describe whether CD-QoLI improved, worsened, or plateaued over different historical periods. All analyses were stratified by sex, age group, and geographical region to ensure accurate representation of subgroup-specific temporal patterns.
Statistical analysis
To estimate the future trajectory of KOA-related quality of life, we applied autoregressive integrated moving average (ARIMA) models to project annual CD-QoLI values through the year 2040. Forecasting was conducted at multiple levels of disaggregation, including by age group, sex, and geographic region.22,23 Model selection followed standard procedures using the auto.arima() function from the forecast package in R, which optimizes parameters based on AIC and residual diagnostics. For each model, 95% prediction intervals were computed to reflect uncertainty.
To explore the relationship between CD-QoLI and socioeconomic development, we assessed the Pearson’s correlation between CD-QoLI, I1, and I2 scores, and the SDI across regions in 2021. In addition, we examined the correlation between the AAPC of CD-QoLI (as estimated before and after the identified joinpoint) and regional SDI levels, to understand how development status influences long-term trends in quality of life for KOA.
All statistical analyses and visualizations were conducted in R (version 4.3.1; R Foundation for Statistical Computing, Vienna, Austria; https://www.r-project.org/). The correlation coefficient (ρ) quantifies the direction and strength of the monotonic relationship between variables, ranging from −1 to +1. A positive ρ indicates a direct association, while a negative ρ indicates an inverse relationship. The p value assesses the statistical significance of the correlation; a p < 0.05 was considered statistically significant. Visualizations, including time-series trend plots, forecast charts, and correlation scatterplots, were generated using the ggplot2, ggprism, and forecast packages. The reporting of this study conforms to the Strengthening the Reporting of Observational Studies in Epidemiology (STROBE) statement. 24
Results
Global burden of KOA
From 1990 to 2021, the global number of incident KOA cases increased from 14.13 million (95% uncertainty interval (UI): 12.15–16.08 million) to 30.85 million (26.53–35.19 million), with the incidence rate rising from 265.0 to 390.9 per 100,000 population (EAPC: 1.37, 95% CI: 1.34–1.41; Table S1). Throughout the study period, females consistently exhibited higher incidence rates than males (465.4 vs 316.9 per 100,000 in 2021), although both sexes shared the same EAPC of 1.37 (Figure S1(A) and (B) and Table S1). By age, individuals aged 50–74 years contributed the largest proportion of new cases (18.51 million), with the highest incidence rate observed in this group (1127.1 per 100,000, EAPC: 0.21), followed by those aged 75 years and older (786.4 per 100,000, EAPC: 0.12; Figure S1(C) and (D)). At the regional level, the fastest-growing incidence rates were found in Middle SDI regions and Southeast Asia (EAPC: 2.10 and 2.08, respectively), while Eastern and Western sub-Saharan Africa reported the lowest incidence rates in 2021. The highest regional incidence rates were seen in High-income Asia Pacific (799.6 per 100,000), Western Europe (584.2 per 100,000), and Australasia (571.7 per 100,000; Table S1).
In terms of prevalence, the global number of KOA cases more than doubled from 159.80 million (95% UI: 137.28–182.88 million) in 1990 to 374.74 million (321.86–428.35 million) in 2021. The prevalence rate increased from 2996.1 to 4748.7 per 100,000 population, with an overall EAPC of 1.61 (95% CI: 1.56–1.67; Table S2). Females showed substantially higher prevalence than males (5854.3 vs 3650.8 per 100,000 in 2021), with similar EAPCs (1.6 vs 1.63; Figure S2(A) and (B) and Table S2). Among age groups, the 50–74 years group accounted for the majority of prevalent cases (254.48 million), with a prevalence rate of 15,494.4 per 100,000 in 2021 (EAPC: 0.31). However, the highest rate was observed among those aged 75 years and older (23,741.0 per 100,000, EAPC: 0.17; Figure S2(C) and (D)). Regionally, Middle SDI countries and Southeast Asia demonstrated the most rapid increases in prevalence rates (EAPC: 2.43 and 2.28, respectively). The highest prevalence rates in 2021 were recorded in High-income Asia Pacific (12,154.7 per 100,000), Western Europe (8041.4 per 100,000), and Australasia (7716.2 per 100,000; Table S2).
The burden of KOA-related YLDs also rose substantially between 1990 and 2021. The global number of YLDs increased from 5.15 million (95% UI: 2.51–9.95 million) to 12.02 million (5.86–23.27 million), with the corresponding YLD rate rising from 96.5 to 152.3 per 100,000 population (EAPC: 1.61, 95% CI: 1.55–1.67; Table S3). Females consistently bore a greater burden than males (186.8 vs 118.1 per 100,000 in 2021), though both sexes showed comparable EAPCs (1.59 and 1.63, respectively; Figure S3(A) and (B) and Table S3). The highest YLD rate was recorded in the 75+ years age group (720.5 per 100,000, EAPC: 0.16), while the 50–74 years group accounted for the largest absolute number (8.21 million; Figure S3(C) and (D)). Regionally, the most pronounced increases in YLD rates occurred in Middle SDI regions and Southeast Asia (EAPC: 2.42 and 2.28, respectively). In 2021, the highest YLD rates were observed in High-income Asia Pacific (389.3 per 100,000), Western Europe (255.9 per 100,000), and Central Europe (186.7 per 100,000; Table S3). Collectively, these findings underscore the escalating global burden of KOA in terms of incidence, prevalence, and disability.
Temporal trends of I1, I2, and CD-QoLI by sex and age
From 1990 to 2021, the global CD-QoLI score declined from 0.812 to 0.700 (AAPC: −0.50, 95% CI: −0.59 to −0.42), indicating a relative improvement in the balance between KOA burden and disability-related outcomes at the system level. A breakpoint occurred in 1995, after which the previously mild upward trend (AAPC: 0.20) shifted to a sustained decline (AAPC: −0.68; Table 1). This deterioration was paralleled by steady reductions in both I1 and I2 scores, reflecting changes in the relationship between KOA incidence, prevalence, and long-term disability over time (Figure 1(a)–(c)). Sex-specific trends showed that males consistently had higher CD-QoLI scores than females (0.776 vs 0.655 in 2021), though both experienced worsening trajectories. Males exhibited a breakpoint in 1999, transitioning from a nearly flat phase (AAPC: 0.06) to a sharper decline (AAPC: −0.84), whereas females had an earlier shift in 1995, from a modest increase (AAPC: 0.28) to a decline (AAPC: −0.63). These sex differences were similarly reflected in the I1 and I2 trends, with males maintaining higher levels throughout but showing comparable downward patterns (Table S4).
CD-QoLI scores in 1990 and 2021 with segmented AAPC trends, and overall AAPC (1990–2021) by sex, age, SDI, and geographical region.

AAPC, average annual percentage change; CD-QoLI, Chronic disease quality of life index; CI, confidence interval; SDI, socio-demographic index.

Temporal trends in CD-QoLI and its components (I1 and I2) for KOA by sex and age group, 1990–2021. (a–c) Trends in I1 score, I2 score, and CD-QoLI score stratified by sex (male, female, both sexes). (d–f) Trends in I1 score, I2 score, and CD-QoLI score stratified by age group (15–49 years, 50–74 years, 75+ years, and all ages).
By age, individuals aged 15–49 years not only exhibited the highest CD-QoLI values but also underwent the most dynamic trajectory: a marked decline prior to 2014 (AAPC: −1.08), followed by a reversal toward improvement (AAPC: 2.05). In contrast, older adults aged 50–74 and 75+ years showed relatively stable yet persistently low scores over time, with overall AAPCs of −0.20 and −0.04, respectively (Figure 1(d)–(f) and Table 1). These age-related patterns were also mirrored in I1 and I2 metrics, highlighting greater temporal variability in the burden-outcome balance among younger individuals. Collectively, these findings underscore a globally worsening impact of KOA on quality of life, particularly among females and older populations, while offering emerging signs of improvement in younger age groups.
Regional disparities and temporal patterns of CD-QoLI across SDI levels
Significant disparities in KOA-related CD-QoLI scores were observed across SDI quintiles and global regions from 1990 to 2021. Globally, CD-QoLI scores declined in all but the lowest SDI quintile, with high, high-middle, and middle SDI regions showing marked reductions (overall AAPCs of −0.63, −0.65, and −0.69, respectively; Table 1). In contrast, low SDI regions exhibited a slight increase in CD-QoLI (AAPC: 0.10), indicating relatively limited improvement in managing KOA burden over time. This is further reflected by persistently high I1 and I2 scores in low-SDI areas (Figure 2(a)–(c) and Table S4). By 2021, the highest CD-QoLI scores were observed in Central sub-Saharan Africa (1.245), Eastern sub-Saharan Africa (1.211), and Low SDI regions (1.106). Conversely, high-income Asia Pacific (0.458), Western Europe (0.551), and high-income North America (0.555) reported the lowest CD-QoLI scores (Table 1).

Regional and demographic patterns in CD-QoLI scores and temporal trends for KOA. (a–c) Temporal trends of I1 score, I2 score, and CD-QoLI score for KOA across SDI regions from 1990 to 2021. (d) CD-QoLI scores in 2021 by age group (all ages, 15–49, 50–74, 75+ years) and region, including global, SDI regions, and 21 GBD geographic regions. (e) AAPC in CD-QoLI scores by region.
Geographically, the sharpest reductions were found in high-income Asia Pacific (AAPC: −1.50), East Asia (−0.92), and Central Europe (−0.80), with trend breakpoints occurring mainly before 2010 (Table 1 and Figure 2(d) and (e)). These patterns may reflect early health system investments, policy interventions, or improved clinical management. In contrast, regions such as Western and Central sub-Saharan Africa experienced increasing CD-QoLI scores (AAPCs: 0.43 and 0.39, respectively), pointing to potential mismatches between disease progression and available care. While some low-SDI regions experienced delayed inflection points or no significant shift in trajectory, high-SDI and middle-SDI areas showed earlier and more pronounced improvements (Table 1 and Figure 2(d) and (e)). Overall, CD-QoLI trajectories illustrate how health system performance evolves relative to KOA burden, rather than serving as a direct measure of disease severity. A decline in CD-QoLI may indicate improved capacity to mitigate KOA-related disability, while increases or plateaus highlight the need for more targeted interventions in underserved regions.
Spatial distribution and longitudinal change in CD-QoLI
Marked heterogeneity in CD-QoLI scores was observed across countries in 2021. The highest scores were recorded in Japan (50.511), Puerto Rico (20.900), Monaco (19.534), Finland (18.194), and Spain (16.070), indicating a pronounced mismatch between epidemiological burden and disability-related outcomes under the CD-QoLI framework (Figure 3(a) and Table S5). These countries also showed consistently upward trends over time, as evidenced by substantial AAPCs, such as Japan (8.98), Puerto Rico (6.36), Finland (4.90), and Spain (1.43). Many other high- and upper-middle-income countries, including Republic of Korea (7.77), Albania (7.41), Taiwan (Province of China, 6.88), and Malta (6.46), also experienced rapid increases in CD-QoLI (Figure 3(b) and Table S5).

Global distribution and temporal trend of CD-QoLI scores for KOA at the national level. (a) Geographic distribution of CD-QoLI scores for KOA in 2021 across 204 countries and territories. Scores are categorized into seven quantiles with a sequential blue-to-red gradient. (b) AAPC in CD-QoLI scores from 1990 to 2021. Negative values (blue) represent decreasing trends, while positive values (red) indicate increasing trends over time.
In contrast, a subset of countries experienced notable declines in CD-QoLI between 1990 and 2021, indicating either relatively improved management or potential underestimation of KOA burden. The most significant reductions were seen in Afghanistan (AAPC: −10.4), South Sudan (−5.06), Saudi Arabia (−5.45), Cabo Verde (−5.87), and Libya (−4.39). Several other nations—such as Tajikistan (−4.36), Chad (−3.75), Grenada (−3.45), and Palestine (−3.46)—also showed sustained negative AAPCs, often alongside low absolute CD-QoLI values in 2021 (Figure 4(d) and Table S5).
Country-specific trajectories and AAPC classification of CD-QoLI
Between 1990 and 2021, countries exhibited three distinct trajectories in their CD-QoLI scores related to KOA: increasing, decreasing, or stable. Among the 204 countries and territories assessed, the majority (130) experienced increasing trends, while 69 showed declining patterns and only 5 remained relatively stable over the study period (Figure 4(a)). Notably, the distribution of these trajectories reveals a widening global disparity in quality-of-life outcomes related to KOA. Countries with increasing CD-QoLI scores saw marked escalations from 1990 to 2021, with some—such as the Northern Mariana Islands (AAPC: 16.77), United States Virgin Islands, and Timor-Leste-experiencing rapid upward trends (Figure 4(d)).

Country-level trajectories and representative patterns of CD-QoLI scores for KOA from 1990 to 2021. (a) Classification of countries and territories based on the trajectory of CD-QoLI scores using AAPC from 1990 to 2021. A total of 130 countries showed increasing trends, 69 showed decreasing trends, and 5 remained stable. (b) Distribution of CD-QoLI scores in 1990 and 2021 by trajectory category (increasing, decreasing, and stable), demonstrating directional differences in score changes over time. (c) Global map displaying the CD-QoLI trajectory types: increasing (red), decreasing (blue), and stable (green), based on AAPC from 1990 to 2021. (d) Selected examples of countries with the steepest increasing and decreasing AAPC values for CD-QoLI, including the Northern Mariana Islands (16.77%), United States Virgin Islands (10.38%), and Democratic Republic of Timor-Leste (9.46%) for increasing trends, and Afghanistan (−10.4%), Liberia (−7.55%), and Saint Kitts and Nevis (−6.47%) for decreasing trends.
Conversely, countries such as Afghanistan, Liberia, and Saint Kitts and Nevis exhibited sharp declines in CD-QoLI, potentially reflecting improved management or changes in detection and reporting (Figure 4(d)). As shown in the boxplots (Figure 4(b)), nations with decreasing trajectories often began with higher CD-QoLI scores, while those with increasing trends saw substantial rises over time. The global distribution map (Figure 4(c)) reveals that rising trends were mostly concentrated in high- and middle-income countries, whereas declines were more common in lower-income settings. These diverse patterns underscore the need for context-specific interventions to mitigate KOA burden at the national level.
Correlation between CD-QoLI metrics and SDI
A strong inverse correlation was observed between CD-QoLI and SDI across regions and countries (ρ = −0.884, p < 0.001; Figure 5(a)). This pattern was supported by negative correlations between SDI and both I1 (incidence-to-YLD ratio) and I2 (log prevalence-to-incidence ratio), with ρ values of −0.658 and −0.664, respectively (p < 0.001; Figure 5(b) and (c)). Interestingly, a modest positive correlation was found between CD-QoLI’s long-term trend (AAPC) and SDI (ρ = 0.46, p < 0.001; Figure 5(d)). This suggests that although high-SDI countries had lower baseline CD-QoLI values, many have seen rising trends over time-possibly reflecting efforts to reduce unmet needs and improve rehabilitation. In contrast, some low-SDI settings showed declining trends, which might indicate growing gaps between disease burden and care capacity.
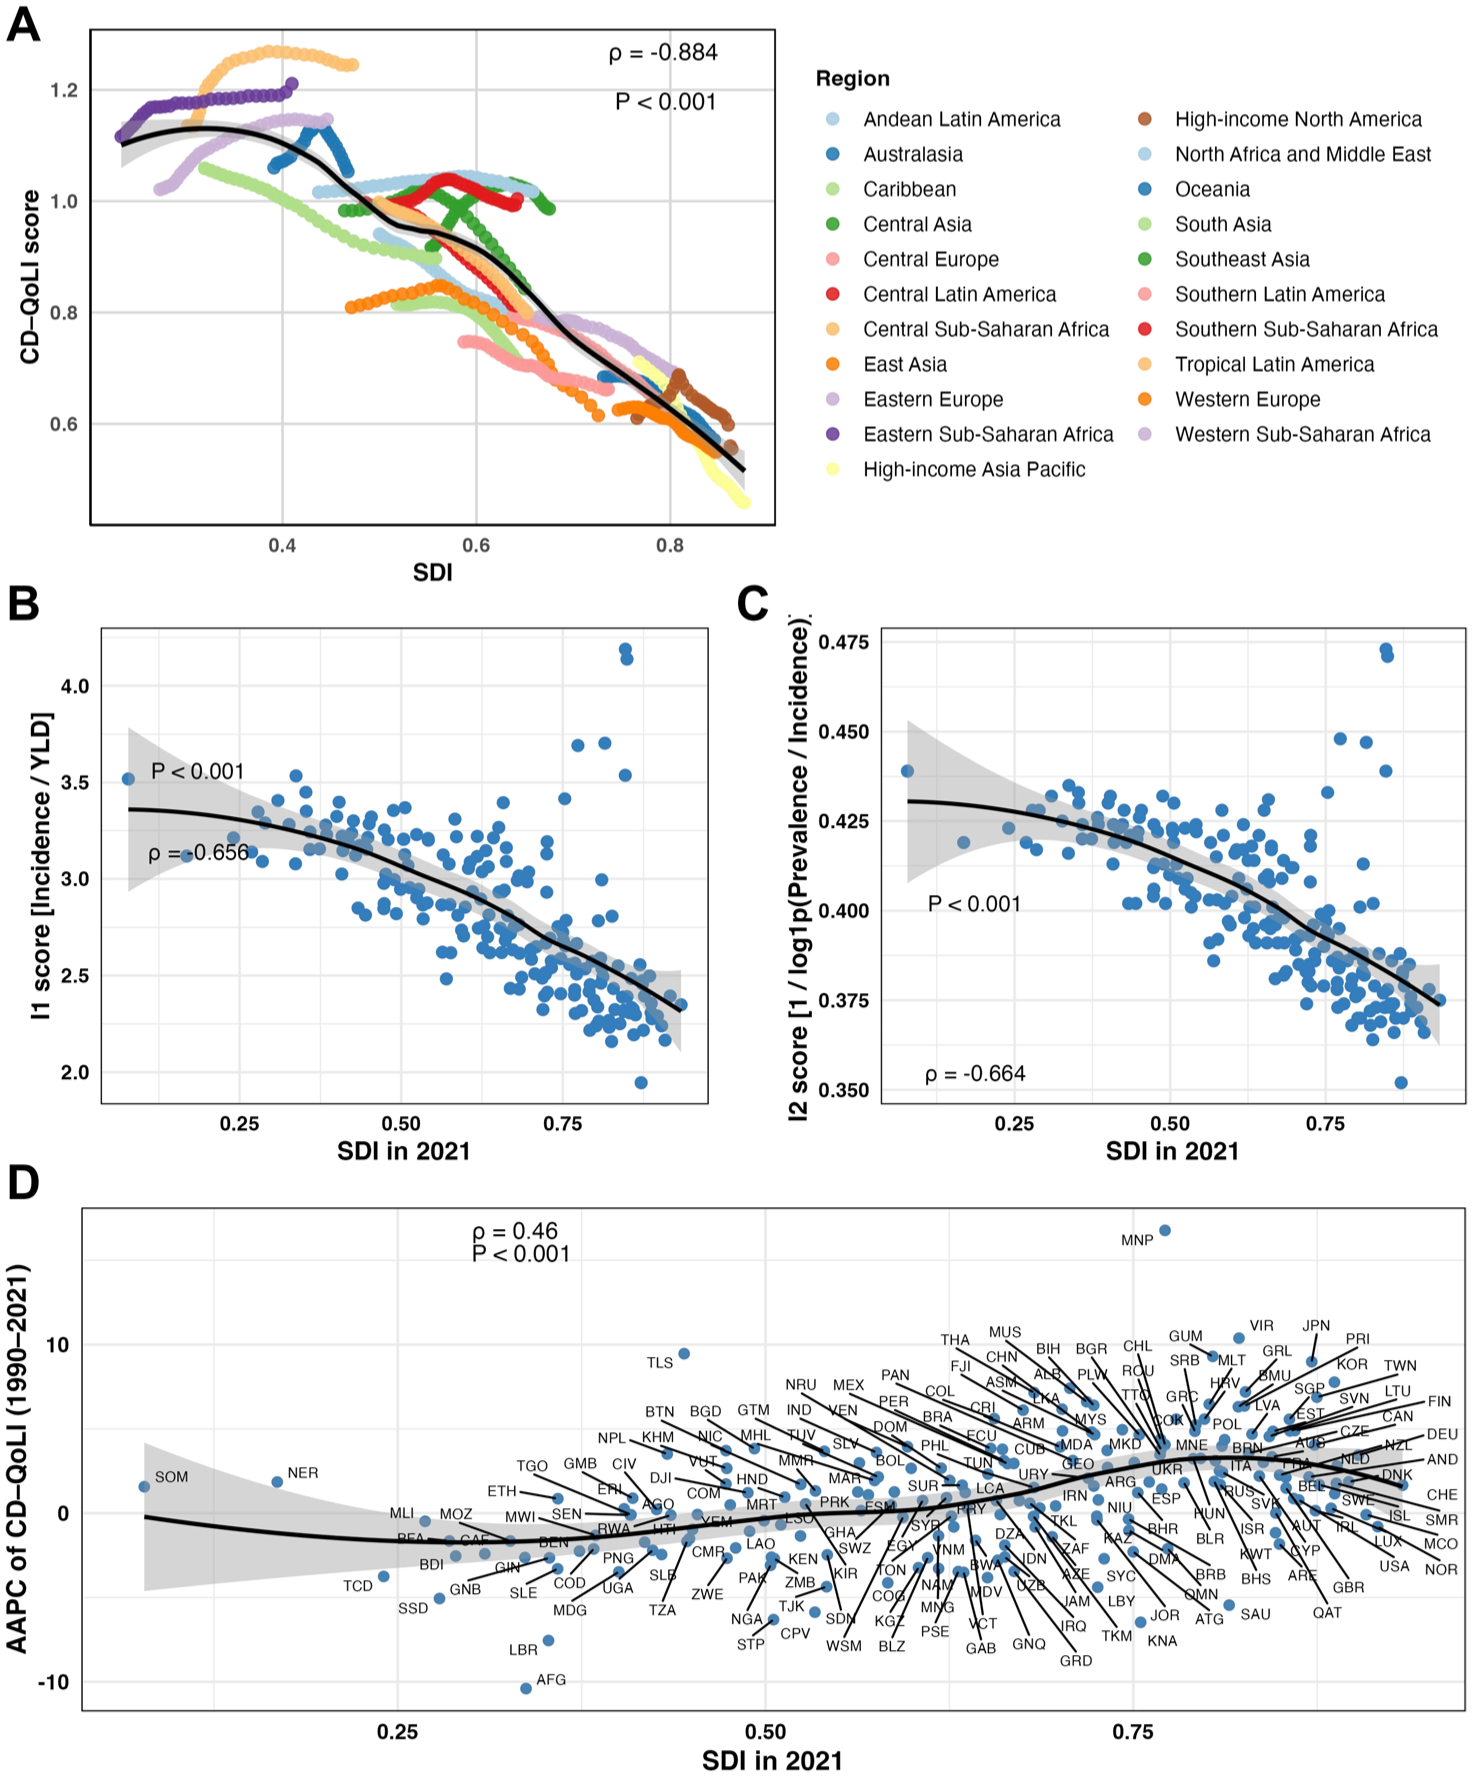
Associations between CD-QoLI indicators and the SDI. (a) Relationship between CD-QoLI scores and SDI across 21 GBD-defined global regions from 1990 to 2021. Each line represents a region’s trajectory over time, with a pooled smoothing curve showing an overall negative correlation (ρ = −0.884, p < 0.001). (b) Correlation between the I1 score (Incidence/YLDs) and SDI in 2021, showing a significant inverse association (ρ = −0.656, p < 0.001). (c) Correlation between the I2 score (1/log(Prevalence/Incidence)) and SDI in 2021, also showing an inverse association (ρ = −0.664, p < 0.001). (d) Scatterplot of AAPC in CD-QoLI (1990–2021) versus SDI in 2021 at the national level, with labeled countries and a significant positive correlation (ρ = 0.46, p < 0.001).
Forecasted trends in CD-QoLI score through 2040
From 2022 to 2040, global CD-QoLI scores are projected to decline across sexes, with the global average decreasing from 0.673 in 2025 to 0.574 in 2040. Male scores are consistently higher than female scores (e.g., 0.745 vs 0.634 in 2025; 0.629 vs 0.539 in 2040), though both show downward trends over time (Figure 6(a) and Table S6). By age group, the 15–49-year population shows a steady increase in CD-QoLI, from 9.15 in 2025 to 10.61 in 2040. In contrast, scores in the 50–74 and 75+ age groups remain relatively stable and low, staying around 0.55 and 0.18, respectively (Figure 6(b) and Table S6). Across SDI regions, low SDI areas are projected to maintain the highest CD-QoLI levels, rising from 1.125 in 2025 to 1.144 in 2040. Middle, high-middle, and high SDI regions show declining trends, with forecasts for 2040 reaching 0.483, 0.462, and 0.507, respectively (Figure 6(c) and Table S6). These patterns suggest persistent global disparities in KOA-related care performance, highlighting the importance of targeted efforts to improve equity and system responsiveness across development levels.

ARIMA-based projections of CD-QoLI scores for KOA from 2022 to 2040, stratified by sex, age, and SDI regions. (a) Projected trends in CD-QoLI by sex (male, female, both sexes combined). (b) Projected trends in CD-QoLI by age groups (15–49 years, 50–74 years, 75+ years, and all ages). Notably, individuals aged 15–49 years are projected to experience a marked increase in CD-QoLI score, while older age groups remain largely stable. (c) Projected trends in CD-QoLI across six SDI regions (global, high SDI, high-middle SDI, middle SDI, low-middle SDI, and low SDI).
Discussion
In this global modeling study, we assessed long-term trends in KOA burden and system-level outcomes from 1990 to 2021 and projected patterns through 2040. Over the study period, KOA incidence, prevalence, and YLDs increased across most regions worldwide. In contrast, the composite CD-QoLI showed an overall declining trend, with more pronounced decreases observed in high- and middle-SDI regions, while low-SDI regions generally maintained higher levels or exhibited modest increases. Sex- and age-stratified analyses revealed consistently lower CD-QoLI values among females and older adults, whereas individuals aged 15–49 years demonstrated a marked reversal from decline to improvement after 2014. Together, these findings highlight substantial heterogeneity in KOA-related outcomes across demographic and sociodemographic contexts.
While traditional GBD metrics such as incidence, prevalence, and YLDs have consistently increased across most regions, the CD-QoLI showed an overall declining trajectory, particularly in high- and middle-SDI countries. This divergence implies that although the measurable disease load is rising, health systems may be making uneven progress in preserving quality of life among affected individuals. Notably, patterns varied widely by geography, age, and sociodemographic status.25–27 While some younger populations exhibited recent signs of improvement, many lower-SDI regions maintained elevated or increasing CD-QoLI scores, reflecting persistent challenges in the delivery and equity of chronic care services.
These findings resonate with an evolving consensus in musculoskeletal and health systems research, which argues for a broader view of chronic disease impact—one that incorporates patient function and system responsiveness. 27 Traditional GBD analyses have focused primarily on summary statistics such as prevalence and DALYs, which, although crucial, may fail to capture the lived experience of chronic diseases like KOA.28–30 Prior research has underscored that YLD-based metrics often underestimate suffering in populations with limited access to surgical intervention, physical rehabilitation, or assistive technologies.31,32 The CD-QoLI complements existing burden measures by integrating epidemiological dynamics (e.g., incidence, chronicity) with a lens on system-level adaptation.
Moreover, our findings are consistent with prior longitudinal studies from high-income settings, where despite medical advances, functional limitations among KOA patients have not significantly declined.33,34 In the United States and Europe, rising life expectancy and earlier onset of joint degeneration have compounded the challenge, with patients living longer under disabling conditions.35,36 Increasing CD-QoLI values in younger cohorts of high-SDI countries may reflect early exposure to risk factors such as obesity or occupational strain, suggesting that prevention efforts need to target younger adults more proactively. Conversely, stable or decreasing trends in older populations may signal better access to care, improved health literacy, or cultural adaptation to chronic symptoms.
It is essential to emphasize that CD-QoLI is not a conventional disease burden indicator. Unlike DALYs or YLDs, which quantify loss of healthy life, CD-QoLI serves as a system-performance proxy-higher values suggest a greater mismatch between disease dynamics and the system’s ability to maintain function and well-being. For example, high CD-QoLI scores in low-SDI regions may reflect limited access to diagnosis and rehabilitation, while relatively low scores in high-SDI countries may indicate better integration of KOA management into routine health services. This makes CD-QoLI a useful addition to the GBD toolkit, especially in contexts where traditional burden metrics offer limited insight into care effectiveness. 37
Limitations
While this study provides important insights, several limitations should be acknowledged. First, CD-QoLI is derived from secondary, model-based estimates from the GBD study, which may not fully capture local variation in diagnostic practices, reporting standards, or access to healthcare services. 38 Second, although the index integrates multiple indicators to assess health system performance, it does not include direct patient-reported outcomes, which are vital for understanding the real-world impact on quality of life. 39 Despite these limitations, this study introduces a robust and innovative framework for evaluating long-term, population-level outcomes related to KOA, and provides useful evidence to inform health system planning and policy decision-making.
Conclusion
In conclusion, despite substantial increases in the incidence, prevalence, and YLDs of KOA worldwide from 1990 to 2021, system-level outcomes as reflected by CD-QoLI showed divergent patterns across regions and populations. Declining CD-QoLI trends in many high- and middle-SDI settings suggest relative improvements in mitigating disability, whereas persistently high or rising levels in low-SDI regions highlight ongoing inequities in chronic care capacity.
Supplemental Material
sj-docx-1-tab-10.1177_1759720X261426247 – Supplemental material for Tracking global quality of life trajectories in knee osteoarthritis: a population-based long-term analysis
Supplemental material, sj-docx-1-tab-10.1177_1759720X261426247 for Tracking global quality of life trajectories in knee osteoarthritis: a population-based long-term analysis by Fanyu Fu, Li Dong, Jiwei Lian, Chang Liu, Tingting Pang, Yunli Wang, Peng Liu and Yufeng Wang in Therapeutic Advances in Musculoskeletal Disease
Supplemental Material
sj-docx-2-tab-10.1177_1759720X261426247 – Supplemental material for Tracking global quality of life trajectories in knee osteoarthritis: a population-based long-term analysis
Supplemental material, sj-docx-2-tab-10.1177_1759720X261426247 for Tracking global quality of life trajectories in knee osteoarthritis: a population-based long-term analysis by Fanyu Fu, Li Dong, Jiwei Lian, Chang Liu, Tingting Pang, Yunli Wang, Peng Liu and Yufeng Wang in Therapeutic Advances in Musculoskeletal Disease
Footnotes
References
Supplementary Material
Please find the following supplemental material available below.
For Open Access articles published under a Creative Commons License, all supplemental material carries the same license as the article it is associated with.
For non-Open Access articles published, all supplemental material carries a non-exclusive license, and permission requests for re-use of supplemental material or any part of supplemental material shall be sent directly to the copyright owner as specified in the copyright notice associated with the article.