
Abstract
Personalized medicine is a much talked about subject that is a timely and important development to healthcare in general and also specifically for patients affected by osteoarthritis. This review uses biomarker examples pertinent to osteoarthritis to highlight the current status of the field, while also highlighting probable future developments. It is not meant to be an exhaustive account. The BIPED(s) [Burden of disease, Investigative, Prognosis, Efficacy, Diagnosis (safety)] classification system is used to organize the discussion of examples. Biomarkers pertaining to burden, investigation, prognosis, efficacy, diagnosis and safety are highlighted. The examples are followed by a discussion of issues related to interpretation and application of biomarker results and approaches to solve the challenges interpretation faces, including graphical, mathematical and synthetic representations. Through this review, it is hoped that a better appreciation can be gained of the potential and pitfalls of personal medicine in the care of patients with osteoarthritis.
Introduction
Over the last several years, personalized medicine has become a much talked about subject that has many divergent meanings to the different stakeholders involved. In fact, trying to meet the many varied expectations all at once has led in part to the difficulty in achieving results. However, nearly all would agree that personalized medicine is a timely and important development in healthcare.
Much of the traditional medicine is based on a public health approach in which population-based findings (risk factors) are used to determine recommendations for individuals. As well-known examples, we regularly use cholesterol, blood sugar and blood pressure guidelines to advise patients [Aronow and Banach, 2012; Buyken et al. 2007; Daskalopoulou et al. 2012; Lenfant et al. 2003; Phillips, 2012] and guidelines have even been used to assess the quality of healthcare providers [Cotton et al. 2006; Guldberg et al. 2011; Kirchhoff et al. 2008; Rodondi et al. 2006].
In contrast, personalized medicine can be thought of as the broad application of approaches that allow decision making to be based on the individuals’ specific test results and clinical factors rather than being based on global recommendations. Some examples might be use of the cardiac risk score [Armstrong et al. 2011; Guzder et al. 2005; Nakajima and Nishimura, 2008; Sheridan et al. 2003], and the fracture risk assessment tool for osteoporosis (OA) [Johansson et al. 2009; Kanis et al. 2008], both of which combine testing results with clinical factors. The typical personalized medicine goal falls into a small number of categories (Table 1), including diagnostic, therapeutic, efficacy and safety. Subdivisions of these are readily considered, such as predicting susceptibility versus actual current diagnosis.
Common personalized medicine goals for biomarker use.

In order to accomplish these goals, tests of blood, urine or nucleic acids are used to define an individual’s personal biotype and thereby make healthcare predictions. The analytes measured are typically referred to as biomarkers [Kraus, 2006; Schatzkin et al.; Biomarkers Definitions Working Group, 2001]. Some properties of an ideal biomarker include being generally available in terms of acquiring the sample, but also having readily available testing, being stable in storage, and perhaps most importantly, accurately representing a specific disease pathogenesis or treatment goal [Kraus, 2006]. Currently, very few tests function well enough to meet even most of these requirements. Despite this, there are convincing reasons to consider biomarkers as valuable assets in caring for patients with OA [van Spil et al. 2010].
The Burden of disease, Investigative, Prognosis, Efficacy and Diagnosis (BIPED) classification of biomarkers as put forward by Bauer and others [Bauer et al. 2006] helps to give structure to our thinking regarding biomarkers. It has often been expanded to include a safety category often shown as (s) [Kraus et al. 2011]. Although the domains measured are not unique to OA, the acronym BIPEDs may allow us to stand on our own two feet when we talk about personalized medicine and OA. Using this logical structure, markers under development for OA are to be characterized according to relevance to one or more specific areas. For example, one marker might measure aspects of disease burden (B), while also aiding in disease diagnosis (D). The recent overview paper by Kraus and colleagues includes lists of biomarkers, which have accrued enough evidence to support their clinical use [Kraus et al. 2011]. For example, urine c-terminal crosslinking telopeptide from type II collagen (uCTX-II) has support for measuring disease burden, prognosis, treatment efficacy and diagnosis (BPED). The future development of markers that perform especially well in one single domain may be the most practicable markers of all as their results would be most readily interpreted. Examples of markers that highlight each of the BIPEDs categories will be used (vide infra) as a way to illustrate the current state of personalized medicine in OA.
BIPEDs examples
Diagnosis
Discussion will start with the ‘D’ of BIPEDs because of the critical importance of defining the phenotype of interest to any further biomarker discussion. We must first know what we are talking about, that is, a ‘biomarker of what’? What can biomarkers tell us about diagnosing OA? As we can see from this partial list (Table 2), many marker associations to OA diagnosis have been described. These include protein-based markers from blood [serum hyaluronic acid (sHA), serum cartilage oligomeric matrix protein (sCOMP)], from urine (uCTX-II) and gene-based markers [Cibere et al. 2009; Dam et al. 2009a; Deberg et al. 2005a, 2005b; Fernandez-Moreno et al. 2008; Karsdal et al. 2010; Kraus et al. 2010; Meulenbelt et al. 2006; Rego-Perez et al. 2008]. For example, when Sharif and colleagues examined tibiofemoral OA versus patellofemoral OA, they were able to show a relationship between elevated serum COMP and tibiofemoral OA, specifically highlighting the diagnostic discrimination that might be obtained using biomarkers [Sharif et al. 2006].
Selected biomarker associations to the diagnosis of osteoarthritis.

COMP, cartilage oligomeric matrix protein; CTX-II, c terminal crosslinking telopeptide from type II collagen; DVWFA, double von Willebrand factor A; GDF-5, growth differentiation factor; HA, hyaluronic acid; IL-1RN, interleukin 1 receptor antagonist; NA, not applicable; OA, osteoarthritis; OR, odds ratio; SNP, single nucleotide polymorphism; TLR-9, toll like receptor 9.
Among the strongest gene candidates for OA diagnosis are the interleukin (IL)-1 gene complex, the vitamin D receptor, the cyclooxygenase (cox) 2 genes (PTGS2), double von Willebrand factor A domains particularly in Asians, and growth and differentiation factor 5 (GDF-5) [Chapman et al. 2008; Fernandez-Moreno et al. 2008; Loughlin et al. 2002; Takahashi et al. 2010; Zintzaras et al. 2010]. Recent meta-analyses have refined and confirmed the strength of these influences [Zintzaras et al. 2010]. Table 2 further shows examples of how this type of data is typically reported, listing results for each biomarker, some at different body sites such as hip, knee or generalized, which are in effect surrogates for different diagnostic or phenotypic forms of OA. Many markers also vary with the genetic origin of the patient. For example, the GDF-5 single nucleotide polymorphism (SNP) 143383, in relationship to hip, knee and hand OA has a small magnitude effect with an overall odds ratio (OR) of about 1.26 for OA [Chen et al. 2010]. However, the mean OR for OA of the hip in Asians was much higher at 1.78 [Chapman et al. 2008].
One of the newest gene marker associations with severe OA of the knee is toll like receptor (TLR)-9 haplotypes, defined based on their typing at three SNP sites: 1237, 1486 and 1635 studied in a Chinese patient population. Subjects in which the haplotype sequence is TTA have increased risks (OR up to 1.66) of OA, while those with the TCA haplotype have decreased risks of OA (OR 0.63) [Su et al. 2012]. We should recognize that ORs close to 1 complicate our application of markers to individual patients even though the markers may be truly informative. As a consequence, we are forced to think probabilistically rather than absolutely, which will be considered in more detail in the ‘Application/interpretation’ section of this paper.
Burden (B)
The idea of measuring burden is to have a way to summarize the extent of disease. For OA, this concept most likely relates best to a summary of the total number of joints involved, the magnitude of cartilage destroyed, or possibly to a patient’s level of disability. Some markers that have been suggested as effective in assessing OA burden include sCOMP, sHA and uCTX-II [Henrotin et al. 2007; Kraus et al. 2010]. Similarly, using a slightly different definition of burden, serum type 2 collagen peptide 1 (sColl 2-1) has been suggested as a marker of joint destruction in OA as it rapidly returns to normal after total joint surgery for an isolated joint affected by OA [Kraus et al. 2010].
Investigative (I)
Investigative markers are those that show promising preliminary data but which have not yet accumulated enough data to be categorized solidly into other BIPEDs categories. In some cases these might be already well described markers being looked at for a new ‘indication’.
While it is clear that OA symptoms wax and wane seemingly without any clear reason, it is logical that biomarkers to assess disease activity, perhaps based on messenger RNA microarrays, might be particularly useful to predict these changes. Biswas and colleagues used a bioinformatics approach on publicly available microarray datasets of rheumatoid arthritis and OA samples [Biswas et al. 2011] to identify changes in collagenase 1, matrix metalloproteinase 3 IL-6, tumor necrosis factor α, and increased expression of phospholipase C. These markers could be measured either as the protein correlates or as messenger RNA using different techniques. These markers for disease activity or prognosis would currently be characterized as ‘I’. The use of multiple microarray markers directly rather than their associated protein equivalents may soon be more feasible as testing platforms of significantly lower cost are rapidly becoming available.
Prognosis (P)
Most studies of biomarkers examining prognosis have focused on radiographic outcomes as the measure of worsening that the prognostic markers are subsequently compared with. Several biomarkers have shown benefit in predicting radiologic progression, for example, sColl 2-1 [Deberg et al. 2005a, 2005b], uCTX-II [Dam et al. 2009a, 2009b], IL-6 [Livshits et al. 2009], and IL-1 gene variants [Attur et al. 2010]. An example will illustrate how applicable these may be. As shown in Figure 1, patients who have one or more copies of this IL-1 receptor antagonist haplotype (the light bars) have less severe OA as measured by K/L grade at all ages examined [Attur et al. 2010]. Consequently, patients bearing only this marker might not need therapy, while the opposite results would suggest the need for a more aggressive treatment strategy as nearly 75% of those in the oldest age range without this marker have a K/L score greater than 2.
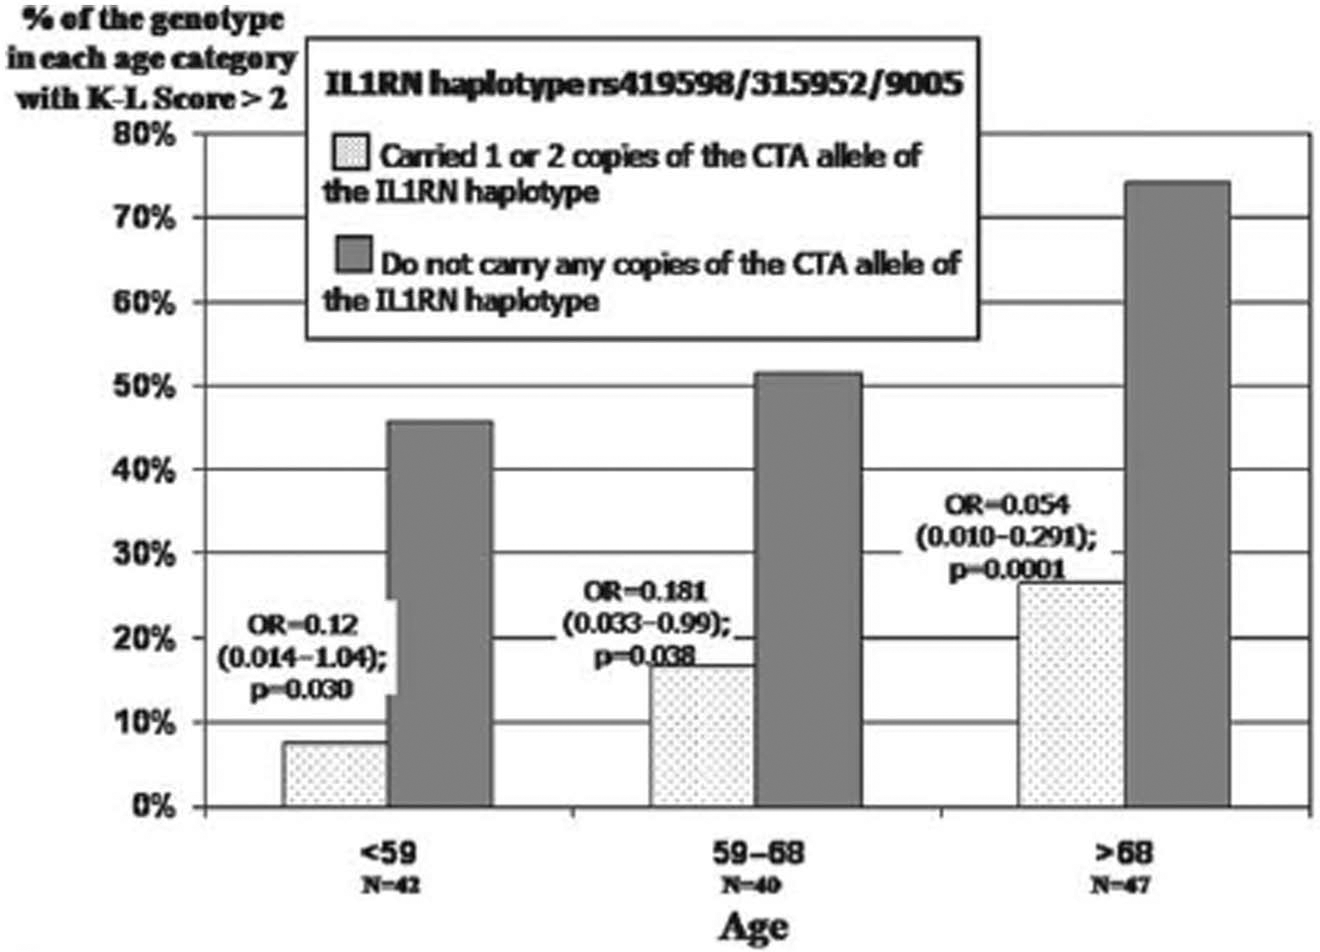
Likelihood of developing severe osteoarthritis based on a gene marker of interleukin 1 receptor antagonist. (IL1RN). Reproduced from Attur et al. [2010] with permission from BMJ Publishing Group Ltd.
Clinical features are also known to be associated with worsened prognosis, including the presence of synovitis, having a larger body mass index (BMI) or more advanced age, and having a history of joint injury [Jiang et al. 2011; Zhang et al. 2009]. As we will see below, combining clinical and biomarker data may show the most promise in applying biomarkers to clinical issues [Flugsrud et al. 2002; Livshits et al. 2009].
Efficacy (E)
Another frequent clinical question ripe for personalized medicine is ‘What is the best therapy?’ While we all recognize that ‘best’ requires that we balance efficacy and safety, can we pick a therapy based on biomarker results and get the ‘best’ one? Although I was unable to find an OA example, a study of nonsteroidal anti-inflammatory drugs (NSAIDs) used to treat the pain associated with wisdom teeth extraction is very likely illustrative of what we can expect to accomplish in OA. Figure 2 shows the results for two genotypes of the cox 2 gene (PTGS2) [Lee et al. 2006]. Patients who have only the GG type responded best to treatment with rofecoxib, while those who had at least one ‘C’ at this site in their typing did best using ibuprofen. The observed differences in pain as measured by visual analog scale were statistically significant and also clinically relevant. These observations help to explaining the common clinical observation that one NSAID helps a given patient, while several other NSAIDs seemingly are of no benefit to that same patient. It is easy to appreciate that testing for a few such markers could change a largely trial and error approach to pain relief into a personalized one in which efficacy is maximized.

Cyclooxygenase 2 genotypes and response of dental pain to selected nonsteroidal anti-inflammatory drugs. Reproduced from Lee et al. [2006].
Safety (s)
The use of biomarkers to avoid or limit adverse drug reactions (ADRs) has been reasonably productive, perhaps in part due to the clarity of the phenotypes associated with specific adverse events such as associations between NSAIDs, particular human leukocyte antigen types, and development of allergic reactions and chronic urticaria associated with aspirin or NSAID use [Pacor et al. 2006; Sanchez-Borges et al. 2009]. In treating OA, we would most like to limit the occurrence of peptic ulcer disease, renal insufficiency, allergic reactions and vascular complications. Thus far, examples modifying gastrointestinal or renal ADRs are not available.
Several studies show evidence for the potential of predicting selected cardiovascular outcomes and thereby for modifying a patient’s risks. In a master’s thesis by Christine St Germaine at McGill University, polymorphisms of three genes CRP, COX-1 and KLOTHO were each associated with increased risk of acute coronary syndrome (ACS) among NSAID users [St Germaine, 2008]. The OR was highest for the COX-1 gene at 6.9. Notice this OR is significantly higher than those observed in association with markers of OA diagnosis. Another study by Brune and colleagues [Brune et al. 2008] examined a protein biomarker, N-terminal pro-B-type natriuretic peptide (NT-BNP), as related to de novo onset of congestive heart failure (CHF) following initiation of NSAIDs. They observed an OR of 7.41 for patients who initiate a coxib despite having a BNP greater than 100 ng/liter, highlighting how biomarker testing could be used to modify prescribing behavior and thereby avoid selected ADRs. Once again the importance of phenotype definition is very evident, as the markers most associated with one cardiovascular complication, for example new onset CHF after starting NSAIDs, appear to be different than those associated with another cardiovascular complication, that is, ACS after NSAID initiation.
Application/interpretation of biomarkers
Thus far, I have shown a few examples of biomarkers related specifically to OA. But, to apply the BIPEDs construct to everyday practice, we need to consider how the interpretation part of the process is to be done. For the moment, assume that our list of ideal biomarkers can be readily measured and at a reasonable cost. What do we do with the results? Is there a best way to apply them? Can we use multiple results in a coordinated way? In many ways their interpretation is like our past experience with understanding basic electrolyte measurement. The first level is assessing whether the measured values of sodium, potassium, bicarbonate and so on are in the normal range. However, the value of the test is further increased by use of strategies to combine the measures, for example, by calculating the anion gap [Kraut and Madias, 2012; Porteous et al. 2011]. Similar combinatorial analyses have not yet been revealed for most biomarkers, although the use of ratios of cartilage synthesis to destruction markers has been used [Williams, 2009] and combinations of imaging and soluble biomarkers [Dam et al. 2009b]. These examples have shown improved accuracy compared with use of individual markers.
Just as the ‘normal range’ of common analytes like hematocrit is affected by gender, similar effects are likely for biomarkers in OA. One of the best examinations of the effects of demographic variables on OA biomarkers has been done by van Spil and colleagues, who examined 14 biomarkers in a large study of early OA of the hip and knee called the Cohort hip and cohort knee (CHECK) study [van Spil et al. 2012]. They were able to show strong statistical relationships between demographic variables (age, gender and BMI) and the levels of some of the biomarkers, thereby suggesting a more detailed application of the tests than normal and abnormal is required.
Examination of current clinical use of gene testing/interpretation might provide further insights as well. Most of us are familiar with interpretation of monogenic disease tests like those used to diagnose sickle cell anemia, in which the sequence variant is clearly present or absent. We are also increasingly comfortable with tests for oligogenic conditions like hemochromatosis in which compound heterozygotes (one copy of two different mutant alleles) can also be affected by the disease [Santos et al. 2012; Speechley et al. 2012], but we have only begun to develop abilities to interpret results pertaining to polygenic disorders. These trends apply equally well to other types of biomarker interpretation.
Perhaps surprisingly, asking about family history remains one of the most potent ways to separate patients at most risk for a disease from those who are not at risk [Paynter et al. 2010]. Perhaps asking about family history serves to integrate multiple small influences (low ORs) into a single usable score for us. A ‘score’ in the future that reliably outperforms family history needs to be developed in order to get the maximal benefits from personalized medicine.
Some efforts to develop such a score have already taken place. The study by Livshits and colleagues [Livshits et al. 2009] made use of a serum assay result (IL-6) (biomarker) and clinical features [the subject’s age and a physical measure (BMI) to stratify a patient’s risk for developing radiographic OA of the knee] each plotted on their own axis as a three-dimensional figure [Livshits et al. 2009]. All three factors clearly change an individual’s risk and importantly the diagrams make it possible to assess each factor’s influence on the patient’s risk and to look up a particular patient’s absolute risk based on their personal factors. However, considering more than a small number of biomarkers with this approach will be quite difficult.
A potential solution to this limitation has been provided by another group: the ‘Nottingham knee prediction models’ are mathematical models designed to apply what we know about key OA risk factors to predict incident, symptomatic or progressive (increase by K/L grade 1) OA of the knee [Zhang et al. 2011]. For example, the equation for incidence of symptomatic OA is Logit = −7.733 + 0.56 age + 0.29 female + 0.089 BMI + 0.245 occupational risks + 0.543 family history + 0.87 knee injury. Inspection of the constants (factor weightings) shows injury followed by family history to be the most important factors to predict development of incident symptomatic knee OA. Receiver operating curves (ROCs) were used to test the equation’s effectiveness on several different patient populations. For these tests maximal areas under the curve (AUCs) are desirable (maximum of 1). The results for this model ranged from 0.6 to 0.79 for the three patient sets. Would better results have been achieved by adding biomarker data to the calculation? It appears as if it would, as a similar analysis using both gene-based markers and clinical features performed by Takahashi and colleagues showed a simple increase in risk associated with the presence of increasing numbers of risk alleles with a ROC AUC of 0.554, while a ROC on the model based on the risk alleles and clinical factors including age, gender and BMI was more robust, with an AUC of 0.742 [Takahashi et al. 2010]. The addition of clinical factors significantly improved the ROC again, suggesting that the tried and true clinical factors are having the largest effect, not the biomarker analysis. This strongly suggests that further synthesis of biomarker results is still required to produce maximal benefits from their application.
Future developments and conclusions
OA is a disease in which biomarkers should enable efforts to achieve optimal clinical care. To date, family history and traditional risks such as prior injury remain the most important predictors of disease, but progress in defining other markers has been rapid. It is most likely that biomarkers will first aid us in minimizing adverse drug reactions, but later will help with selection of treatments for achieving best efficacy.
The tools for testing many biomarkers concurrently are soon to be generally available, but how to use the results in a meaningful way for application by the clinician is still very open to debate. We can draw from one example to think about the options. The University of Chicago has started a 1200 patient study focused on pharmacogenomic markers [Geonomeweb, 2012]. Subjects have to be chronically followed by their team and be on relatively few baseline medications. They are using the traffic light as their communication device, with red, yellow and green icons to let the providers know if the addition of any planned new medication is supported by that patient’s genotype information. A red light means that the evidence is against the initiation of the medication. The actual SNPs and genes involved are not important to the care provider and are not reported. Instead a synthetic measure of what the evidence shows is used. Ultimately, integrative measures of biomarkers and clinical data perhaps as an ‘OA score’ will provide the most benefit to patients. These types of synthetic measures will be essential to move beyond reporting associations of biomarkers to accomplishing differences in providing OA care.
Footnotes
Acknowledgements
I would like to thank Bioiberica S.A. for their support of my OA research as well as their role in encouraging my development of this material first for use in a talk and then for this manuscript.
Funding
This research received no specific grant from any funding agency in the public, commercial, or not-for-profit sectors.
Conflict of interest statement
The authors declare no conflicts of interest in preparing this article.