
Abstract
Determining the bathymetry of ocean is important for many aspects such as generating navigational charts, to study changes in the seafloor profile, sea level rise, and beach erosion. Traditionally, the bathymetry of ocean was determined by a hydrographic ship carrying an echo sounder instrument which was cost effective but time consuming and also often inaccessible in shallow water regions. The alternate solution to infer the bathymetry of ocean is remote sensing technology. The multispectral satellite platform such as Ikonos and WorldView images are commercially available, whereas the Landsat-8 imagery is freely accessible and therefore the Landsat-8 imagery is used. In this study, the first objective was to evolve a procedure to determine the bathymetry of ocean using the ratio transform algorithm. The second objective was to find the effectiveness of improving the spatial resolution of Landsat-8 imagery to estimate the bathymetry of ocean, and the results of both before and after improving the spatial resolution are compared. The statistical indices, root mean square error and mean absolute error, are computed between the algorithm results and the reference hydrographic chart values, and it was found that the improved spatial resolution of Landsat-8 imagery provided better estimation up to 10 m depth.
Keywords
Introduction
Estimating the bathymetry of ocean is one of the important parameters which plays a significant role in planning near-shore structure activities such as engineering work, port management, pipeline laying, fishing, dredging operation, oil drilling, and aquaculture, and it is also significantly important to determine the underwater topography and movement of sediments and to generate hydrographic charts for safe transportation. Moreover, in the port, maintaining the depth of man-made channel throughout the year is important for the smooth navigation of large ships.
Typically, the measurement of ocean depth is done using conventional methods such as pre-measured rope or cable passage, placed on the side of the vessel and allowed to reach the seabed (Doxani et al., 2012). This method can retrieve the depth of a single point in time. This method was rapidly replaced by hydrographic ships carrying echo sounder instruments such as single-beam and multi-beam echo sounders. The echo-sounding method is capable of determining the depth accurately over clear water coastal environment, whereas in turbid water, the method lacks performance due to infiltration of sound waves to the bottom of the ocean. Generally, the speed of ship constrains the surveyors to map the ocean region at a slightly different scale than the desired scale. It is to be noted that the method would take 200 years of survey time to complete swath survey of deep ocean, and it would take even more time for shallow coastal areas (Carron et al., 2001).
In order to overcome this inefficiency, various airborne laser bathymetric (ALB) and light detection and ranging (LiDAR) systems such as scanning hydrographic operational airborne lidar survey (SHOLAS), compact hydrographic airborne rapid total survey (CHARTS), laser airborne depth sounder (LADS), and experimental advanced airborne research lidar (EAARL) were established to infer the bathymetry of oceans. This method can effectively determine the depth of both shallow and clear water coastal environment, but this technique is limited by its high purchasing and maintenance costs.
Almost all of the above methods take a long interval of time to revisit the same location and thus it is difficult to monitor the frequent changes of seabed morphology. It is very difficult to infer the bathymetry of shallow water region, as those areas are inflexible to access by hydrographic ships carrying echo-sounding instruments. Accurate estimation of bathymetry of shallow water region is important for the navigation safety of small boats like fishing and for benthic studies (Ma et al., 2014). Remote sensing technology can be regarded as one of the most promising alternative tools to map the bathymetry of shallow water regions by pairing remote sensing data with ground-based measurements (Winterbottom and Gilvear, 1997). Remote sensing technology has various advantages such as wide coverage of area, repetivity of the area over certain period of time, and also easy access of data. Therefore, this technology provides a fast solution to map bathymetry of the region, where rapid change of coastal environment is observed (Deng et al., 2008).
Bathymetry mapping using remote sensing technology is attained from the principle in which the total amount of electromagnetic energy observed and reflected from the water body determines the water depth. The remote sensing technique is available to determine the depth of ocean, for the reason that the water attenuates signal from the bottommost part of ocean with a strong wavelength dependency (Dekker et al., 2011). However, penetration of electromagnetic wave energy is limited. Therefore, remote sensing technique is primarily adopted to infer the depth of clear and shallow water region (Zheng et al., 2014).
The two important approaches such as analytical method and empirical method are adopted to retrieve the bathymetry of ocean using satellite image. A number of analytical algorithms are available in the literature, which are proposed by Lyzenga (1978, 1981), Lyzenga et al. (2006), and Philpot (1989). In order to use the analytical method for mapping the bathymetry of ocean, a number of input parameters such as water column, properties of atmosphere and bottom reflectance, and spectral signatures of suspended and dissolved materials are required (Spitzer and Dirks, 1986). Although the analytical method is moderately complex and difficult, it has been adopted by Mobley et al. (2005), Brando et al. (2009), and Giardino et al. (2012). On the other hand, the empirical method establishes the relationship between the remotely sensed radiance of a water body and the depth at sampled locations is established empirically without regard to how light is transmitted in water (Gao, 2009). In comparison, empirical method requires only few parameters as input which are simple and do not require water column parameters. However, for the calibration function, the method requires hydrographically measured data.
A number of empirical algorithms are proposed to retrieve the bathymetry of ocean, among which the most commonly used algorithm is the ratio transform algorithm developed by Stumpf et al. (2003). The ratio transform algorithm operates by the mixture of two bands (blue and green) to detach the difference in depth from difference in bottom albedo. The algorithm works on the principle that the observance of water differs from band to band when the depth of water increases. Generally, the spectral band of green is high in absorptivity, in which the reflected irradiance declines quicker than in the low absorptivity of blue band (Pe’eri et al., 2014). Therefore, the ratio between the green and blue bands declines linearly with penetration, when they are log transformed. It is important to note that both bands are affected similarly with the changes in the bottom albedo, but the high absorption band green is affected more when the depth varies.
The mapping of bathymetry in the clear ocean water is successfully mapped up to the depth of 25–30 m by adopting the remote sensing technique (Eugenio et al., 2015; Lyzenga et al., 2006; Mishra et al., 2007). To determine the depth of ocean and marine water environment, the blue and green bands (visible bands) of spectrum wavelength are selected for remotely sensing bathymetry. In the visible bands, light infiltrates the water column, an exponential attenuation of radiance as a function of both depth and wavelength, and delivers the primary principle for estimating the depth (Gao, 2009).
Some of the important literatures for estimating the bathymetry of ocean using remote sensing technology are discussed below.
Vahtmäe and Kutser (2016) investigated linear band model and the log-transformed band ratio model for determining the bathymetry of optically complex Baltic Sea region using airborne HySpex hyperspectral images. The results of both the models are compared by the statistical indices of
Eugenio et al. (2015) implemented the multichannel physical s-based algorithm to determine the bathymetry of Granadilla de Abona (Tenerife Island) and Corralejo (Fuerteventura Island) areas using WorldView-2 imagery. In order to retrieve the depth accurately, the physical s-based algorithm is coupled with radiative transfer model. The coupled model estimates the depth effectively up to 25 m. The model declines the prediction of depth greater than 25 m.
Su et al. (2014) used a geographically adaptive inversion and conventional global inversion model to estimate the bottom depth over Kauai and Barbuda Islands using high-resolution Ikonos and Landsat ETM+ satellite imagery. The performance of conventional global inversion model is limited, when the bottom type and water quality vary spatially within the scene. The geographically adaptive inversion model divides the image scene into local areas to calibrate the inversion models for each submission to improve the accuracy and reliability of retrieving the bathymetry from remote sensing imagery. It is demonstrated that the geographically adaptive inversion model estimates the bathymetry better than the conventional model.
Su et al. (2008) developed an automated method for calibrating the parameters for a non-linear inversion model based on the Levenberg–Marquardt optimization algorithm for determining the bathymetry of south shore of Molokai Island, Hawaii, using Ikonos satellite imagery. Depth data derived from the non-linear inversion model are compared with the conventional log-linear inversion model. It is observed that the overall performance of both the models is similar. The non-linear inversion model produced slightly better and accurate estimation of deeper depth of 10–15 m, but slightly less accurate for very shallow regions (i.e. <5 m).
The following literature represents the estimation of bathymetry along the coast of India.
Pattanaik et al. (2015) used a simple radioactive model and a linear radioactive model for estimating the depth along the coast of Odisha, India, using Indian Remote Sensing (IRS) Linear Imaging Self Scanning Sensor (LISS-III) multispectral imagery. The statistical index
The common errors associated while estimating the depth from remote sensing images are as follows: first, error may be presented in the reference bathymetry data set (i.e. ground data). Second, water turbidity is one of the most significant factors which decline the accuracy of remotely sensed bathymetry. Third, the existence of submerged vegetation canopies in the study area also affects the accuracy of remotely sensed bathymetry.
The first objective of this study was to evolve a procedure based on ratio transform algorithm for estimating the bathymetry of near shore along the Mangaluru coast of Karnataka, India, using Landsat-8 imagery. The second was to adopt the same procedure to find the effectiveness of improving the spatial resolution of Landsat-8 imagery. The coefficient of determination
Materials and methodology
Study area
The coastal region of Dakshina Kannada district of Karnataka state, India, stretches from Talapady in the south to Baindur in the north over a distance of about 140 km. The region is enclosed by the Arabian Sea on the west and the Western Ghats on the east. Generally, the coast of Dakshina Kannada adores the tropical hot monsoon climate due to its latitudinal position. The coast is influenced by the southwest monsoon which receives heavy rainfall during the months from June to September, ranging from 3000 to 3900 mm. The coast experiences high temperature throughout the year with relatively constant high humidity. During the monsoon period, wave height of 6.5 m is recorded along the coast of Dakshina Kannada, and in the non-monsoon period, the height of wave is less than 1 m.
The present study area covers a total length of 25 km (approximately), extending from Ullal region in the south to Surathkal in the north, roughly (12°51′0″S 74°50′0″E) shown in Figure 1. Mangaluru is the major city in the coast of Dakshina Kannada and gains economic importance due to urbanization and industrialization. The Netravathi and Gurpur rivers originate from the Western Ghats and flows westward and takes a right angle bend near the coast and then flow either northward or southward close to and parallel to the coast. These rivers join together at some point before they merge into the Arabian Sea. The study area along the coast of Mangaluru covers the range of depth up to 25 m and also encompasses the New Mangalore Port Trust (NMPT).
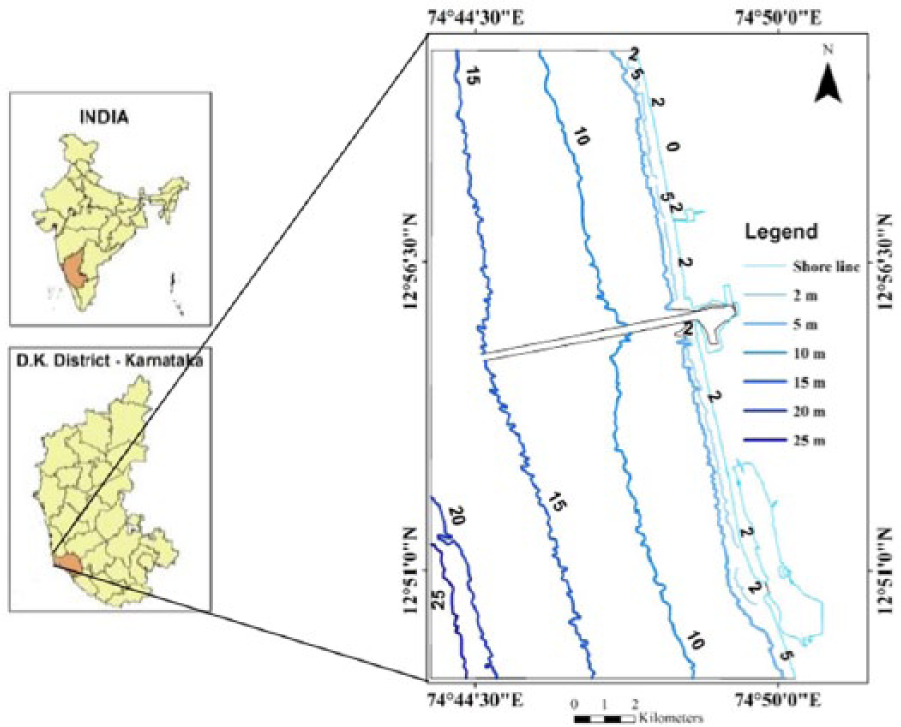
Location map of study area.
Methodology
The important steps for determining the bathymetry of near-shore ocean along the coast of Mangaluru using Landsat-8 imagery are shown in Figure 2.
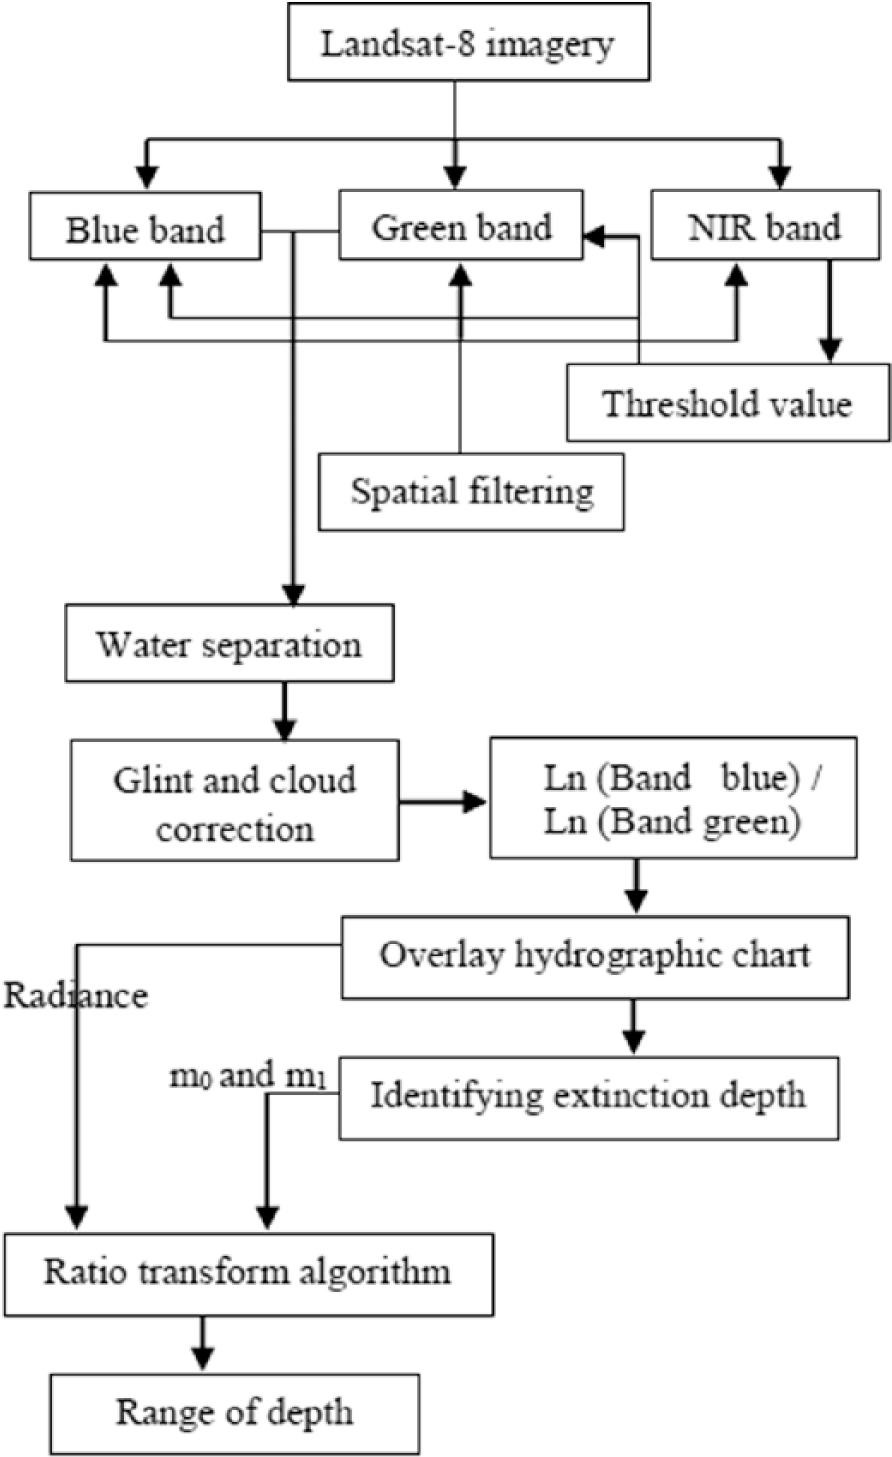
Methodology for estimating the bathymetry of near-shore ocean.
First, the procedure is adopted on the original imagery of Landsat-8. Second, the same procedure is adopted on the Landsat-8 imagery after improving spatial resolution. Third, range of depth obtained from the original and after improving spatial resolution of Landsat-8 imagery is compared.
Bathymetry from space
Generally, the bathymetry of ocean is surveyed by ships carrying echo sounders.
Although most of the areas are unexplored due to the complications of transporting the ship to the deep ocean, estimating the bathymetry by ship is cost effective.
The remote sensing–based technique has advantages in comparison with the present echo sounder technique. The remote sensing technique absorbs the globe with uniform resolution, and repetivity of collecting data over the same area helps to monitor changes in the bathymetry of ocean.
There are several commercially available multispectral satellite data acquired through Ikonos and WorldView, which can be used to determine the bathymetry of ocean. However, the Landsat-8 satellite imagery is available freely in the open domain. Hence, Landsat-8 imagery is utilized for determining the bathymetry of near-shore ocean. The Landsat-8 imagery used for this study is downloaded from the United States Geological Survey (USGS) website, acquired on 13 March 2014. The Landsat-8 satellite acquires total of 11 bands, including blue and green with the spatial resolution of 30 m and panchromatic (pan) band with the spatial resolution of 15 m.
For this study, blue, green, and near-infrared (NIR) bands of Landsat-8 imagery are used. The spatial resolution of blue, green, and NIR bands is 30 m. The reason for applying the blue and green bands in the coastal environment is that the radiance in the blue band (450–515 nm) decreases more rapidly with depth than radiance in the green band (525–600 nm). Generally, light at wavelengths above 700 nm has a very low transmittance in sea water. Therefore, water appears dark and the land appears bright. For this reason, the NIR band (845–885 nm) is used for distinguishing water from land.
The bathymetry of near-shore ocean is estimated using the blue and green band pair, and most importantly, hydrographic chart of the same area is acquired on 18 March 2014. The acquisition dates of both satellite image and hydrographic chart are close to each other. Therefore, both the data are co-registered correctly and used for the estimation of bathymetry. The hydrographic chart represents the ground data with respect to the chart datum. The depth soundings of hydrographic chart were used to reference the satellite-derived bathymetry to the chart datum. To perform the ratio transform algorithm, the gain and offset (i.e.
Spatial filtering
Before performing spatial filtering, technique float is performed to convert each pixel of satellite image into a floating point representation. Later, a spatial filtering technique called low-pass filter (kernel size of 5 × 5) is applied on the blue, green, and NIR bands of Landsat-8 imagery to remove the speckle noise.
Water separation
It is important to separate land from water to estimate the bathymetry of ocean. For this purpose, band NIR is used due to the appearance of water in dark and land in bright. Here, the land/water threshold value is obtained by drawing a line that crosses from land (bright areas) into the water (dark areas). The obtained threshold value is applied on the blue and green bands of Landsat-8 imagery to separate land from water.
Glint and cloud correction
This step is intended to correct the radiometric contribution from sun glint and low clouds; the method proposed by Hedley et al. (2005) is performed to rectify the radiometric correction on blue and green bands. The linear relationship between the NIR and visible bands (i.e. green and blue) is established using the linear regression, based on a selected sample area of the image pixels. Following the recommendation of Hochberg et al. (2003), sample region of image is selected which is evident of sun glint, but the spectral brightness of the selected region is expected to be consistent, wherein the region of deep water is ultimate for this. The equation for removing the sun glint and low clouds is shown below
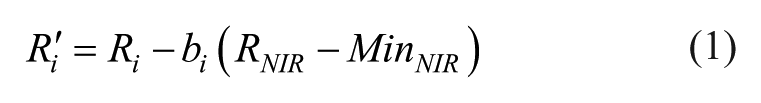
where
Select the sample area where the range of sun glint is evident. It is important to note that the image might be more or less homogeneous, and if the sun glint was not present (in deep water), then estimate the minimum NIR brightness
To remove the sun glint from the bandi (bandblue ,
To remove the sun glint from the
Ratio transform algorithm
A ratio transform algorithm was proposed by Stumpf et al. (2003) to estimate the bathymetry of near-shore ocean. The algorithm makes use of two bands in order to reduce the number of parameters to infer the depth of ocean. It decreases the bottommost radiance of one band more rapidly with respect to depth, when compared to another band. This leads to the ratio between the two bands to differ with respect to the depth. A near-constant attenuation value will be preserved between the ratio of two bands which is nothing but the difference of the diffuse attenuation coefficient at two different wavelengths; just depending on notion that water column is uniformly mixed. The algorithm can cut down the error coupled with varying radiation in the atmosphere, water column, and seafloor, for the reason that both bands are distributed equally.
Typically in the coastal environment, radiance in the blue wavelength (400–500 nm) attenuates faster with depth than light in the green wavelength (500–600 nm) (Jerlov, 1976). Thus, the variation in ratio between the bands is affected further by the depth than by bottom reflectance. To infer the bathymetry, the algorithm establishes the linear relationship between the ratio of radiance in two bands (green and blue) and water depth (Stumpf et al., 2003). The algorithm relies on the circumstance that the absorptivity of water differs spectrally from band to band. As the depth of water increases, reflectance values of the band with higher absorption will decrease proportionately faster than reflectance value of the band with lower absorption. Therefore, when two bands are transformed, there exists a linear decrease between a ratio of high absorption band to a low absorption band and water depth.
The following equation is used to determine the depth of the near-shore ocean
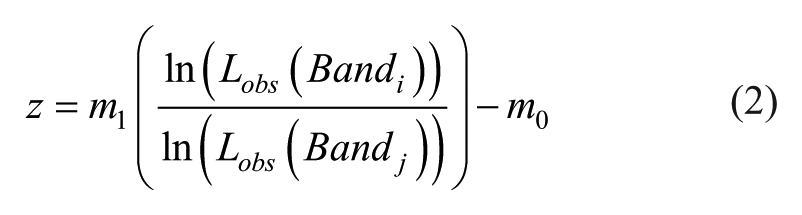
where
Identifying the extinction depth
The statistical analysis
Finally, the calculated parameter such as observed radiance of band from the ratio of blue and green and the values of
Improving the spatial resolution of Landsat-8 imagery
In order to improve the spatial resolution of satellite image, various image fusion methods are proposed, such as principal component analysis (PCA) (Chavez and Kwarteng, 1989), modified intensity hue saturation (M-IHS) (Siddiqui, 2003), Brovey transform (BT) (Hallada and Cox, 1983), high-pass filter (HPF) (Chavez et al., 1991), and wavelet coupled with IHS and PCA (Gonzalez-Audicana et al., 2005; Ranchin and Wald, 1993). Image fusion is the process of transferring high spatial resolution of pan image to the multispectral image in order to obtain a single image with both high spatial and high spectral resolution. The important conditions for fusing the satellite image are (1) both pan band and multispectral band should cover the same area and should be acquired at the same time and (2) wavelength range of pan band and multispectral band should be close to each other. Here, the wavelength ranges of blue (0.450–0.515 µm) and green (0.525–0.600 µm) bands are close to the wavelength range of pan (0.500–0.680 µm).
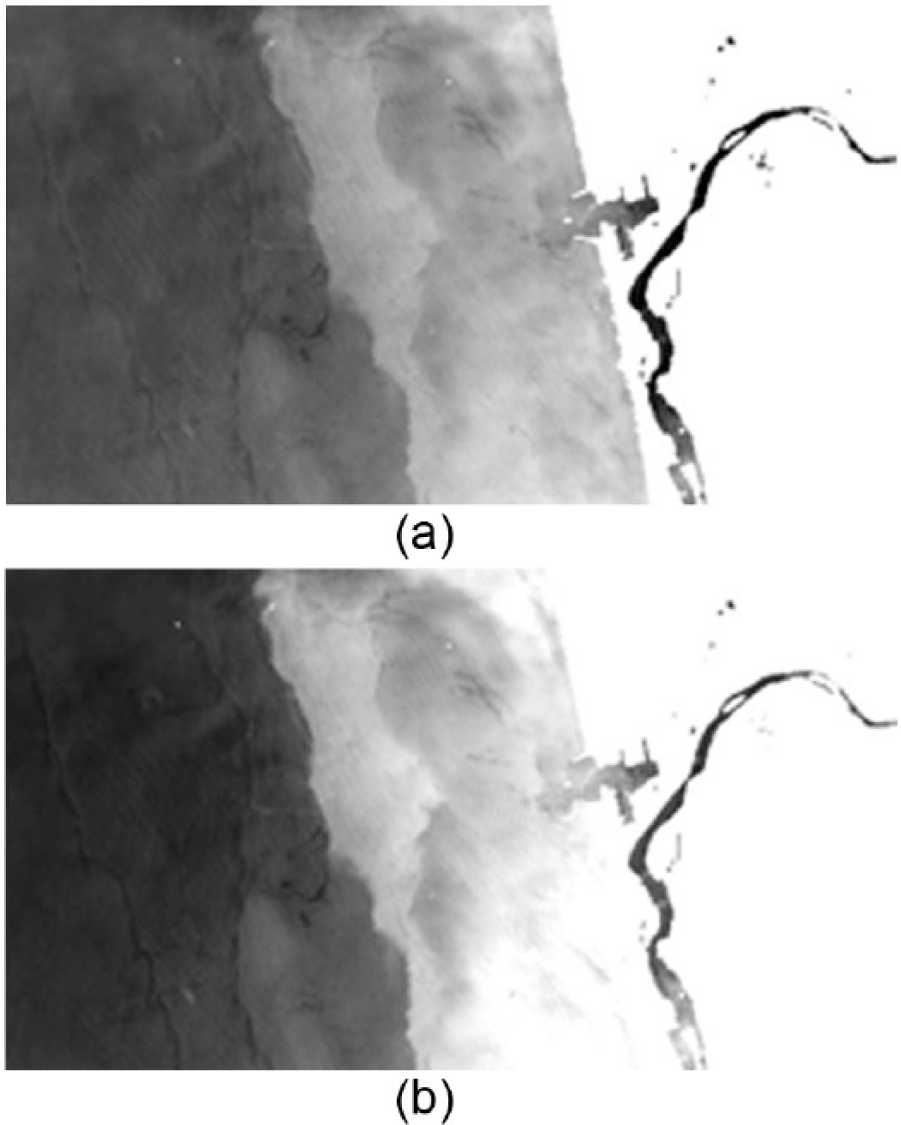
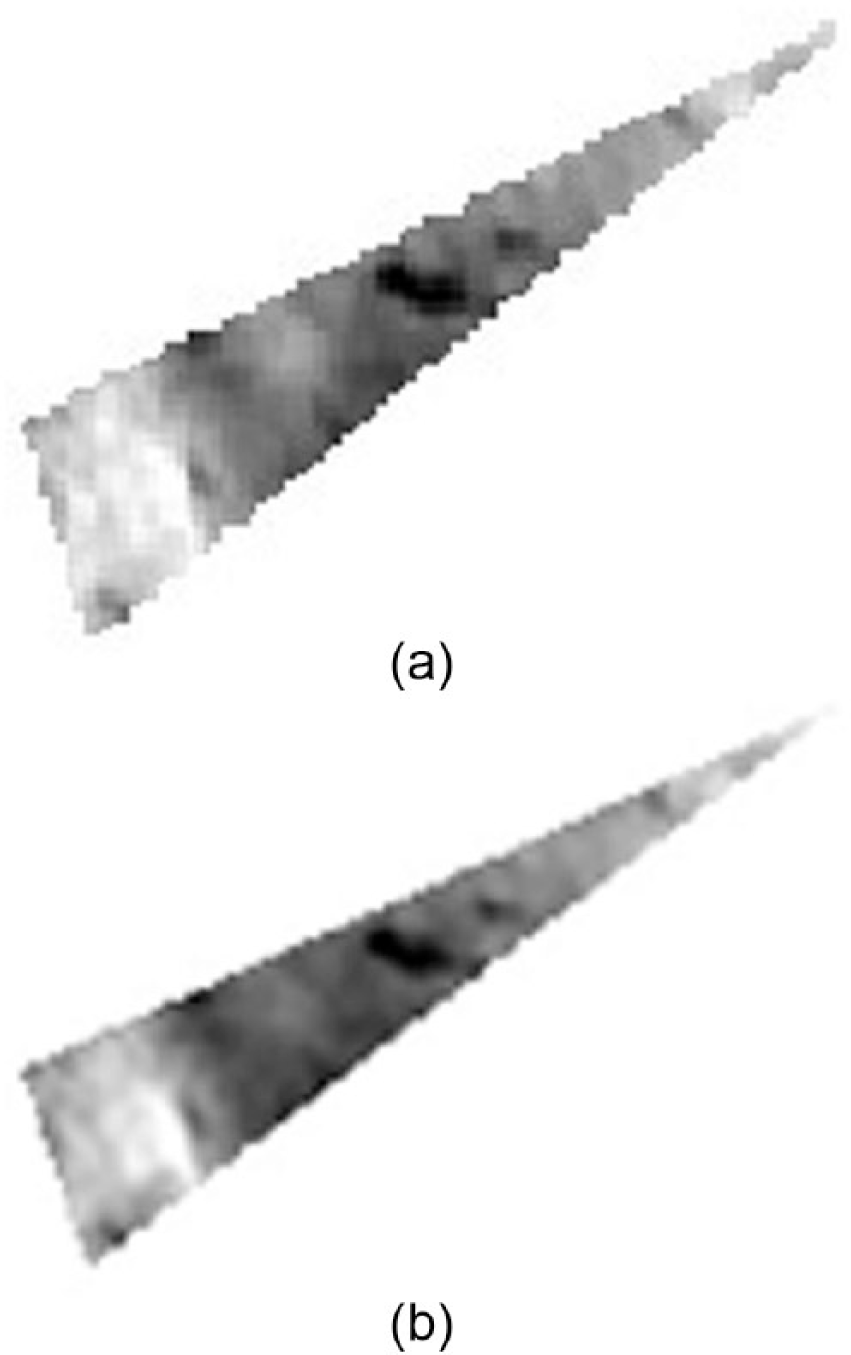
Therefore, the original blue and green bands with the spatial resolution of 30 m are fused separately with the pan band of 15-m spatial resolution. Improved spatial resolution of blue and green bands is obtained using the HPF image fusion method as shown in Figure 3(a) and (b).
Improved spatial resolution of (a) blue band and (b) green band.
HPF
The only pan-sharpening HPF tool (ERDAS Imagine 2014 software) provides single-band fusion option. Therefore, the HPF method has been used for fusing the pan band with blue and green bands individually. The method computes the ratio R between the spatial size of the pan and blue and also pan and green bands. The kernel size of 5 × 5 is used based on the suggestion in the ERDAS software manual as the ratio of multispectral band to pan band resolution is <2.5. A small HPF is placed on the pan band, and the pixel size of the blue and green bands is resampled to that of the high-pass pan band. The filtered high-pass pan band is added to the resampled blue and green bands to obtain a merged blue and green band with both high spatial and rich spectral information.
After improving spatial resolution, it is important to assess the quality of blue and green bands, before it is used for estimating the bathymetry of near-shore ocean. The quantitative index, spatial correlation coefficient (SCC) (Choi, 2006; Zhou et al., 1998), is used to assess the spatial quality of blue and green bands (i.e. improved spatial resolution). In order to process this index, the reference blue and green band with the spatial resolution of pan band is needed, but in reality it is difficult to obtain the blue and green band with this requirement. Nevertheless, a reference image can be obtained by resampling the original blue and green bands to the size of the pan band (Gangkofner et al., 2008). The index value of SCC close to 1 indicates that the bands have good spatial quality.
Here, the value of SCC for the blue band is 0.8995 and for the green band is 0.8815, which is close to the original value of 1. Therefore, the HPF method generates improved spatial resolution of blue and green bands with high spatial quality. The HPF method is processed using the ERDAS 2014 software based on the suggestions in the software manual and also on the basis of existing literature, and the spatial quality of fused image is assessed using MATLAB 2015b. The improved spatial resolution of blue and green bands is used to estimate the bathymetry of near-shore ocean by applying the above procedure. The extinction of depth before and after improving the spatial resolution is also compared.
Results and discussion
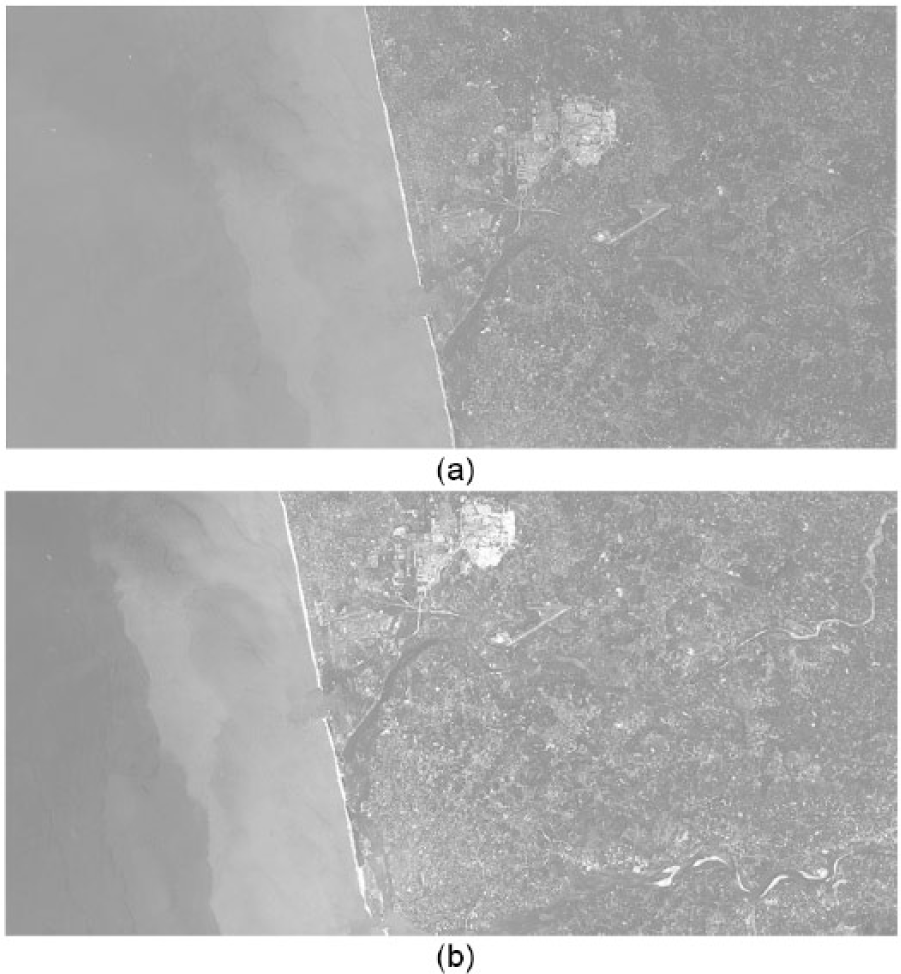
In this study, a procedure was evolved to estimate the bathymetry of near-shore ocean using the Landsat-8 satellite imagery. The results of the procedure implemented are presented in Figures 4 to 14. It is important to pre-process the satellite image before estimating the near-shore bathymetry. Therefore, the low-pass filter is applied on the blue, green, and NIR bands as shown in Figure 4(a) to (c), respectively. To separate the land from water, the threshold value is estimated from the NIR band as shown in Figure 5, which indicates the smooth section with low values representing water, whereas the fluctuating high values represent land. Thus, the threshold value 7000 is applied on the blue and green bands to separate water from land as shown in Figure 6(a) and (b).
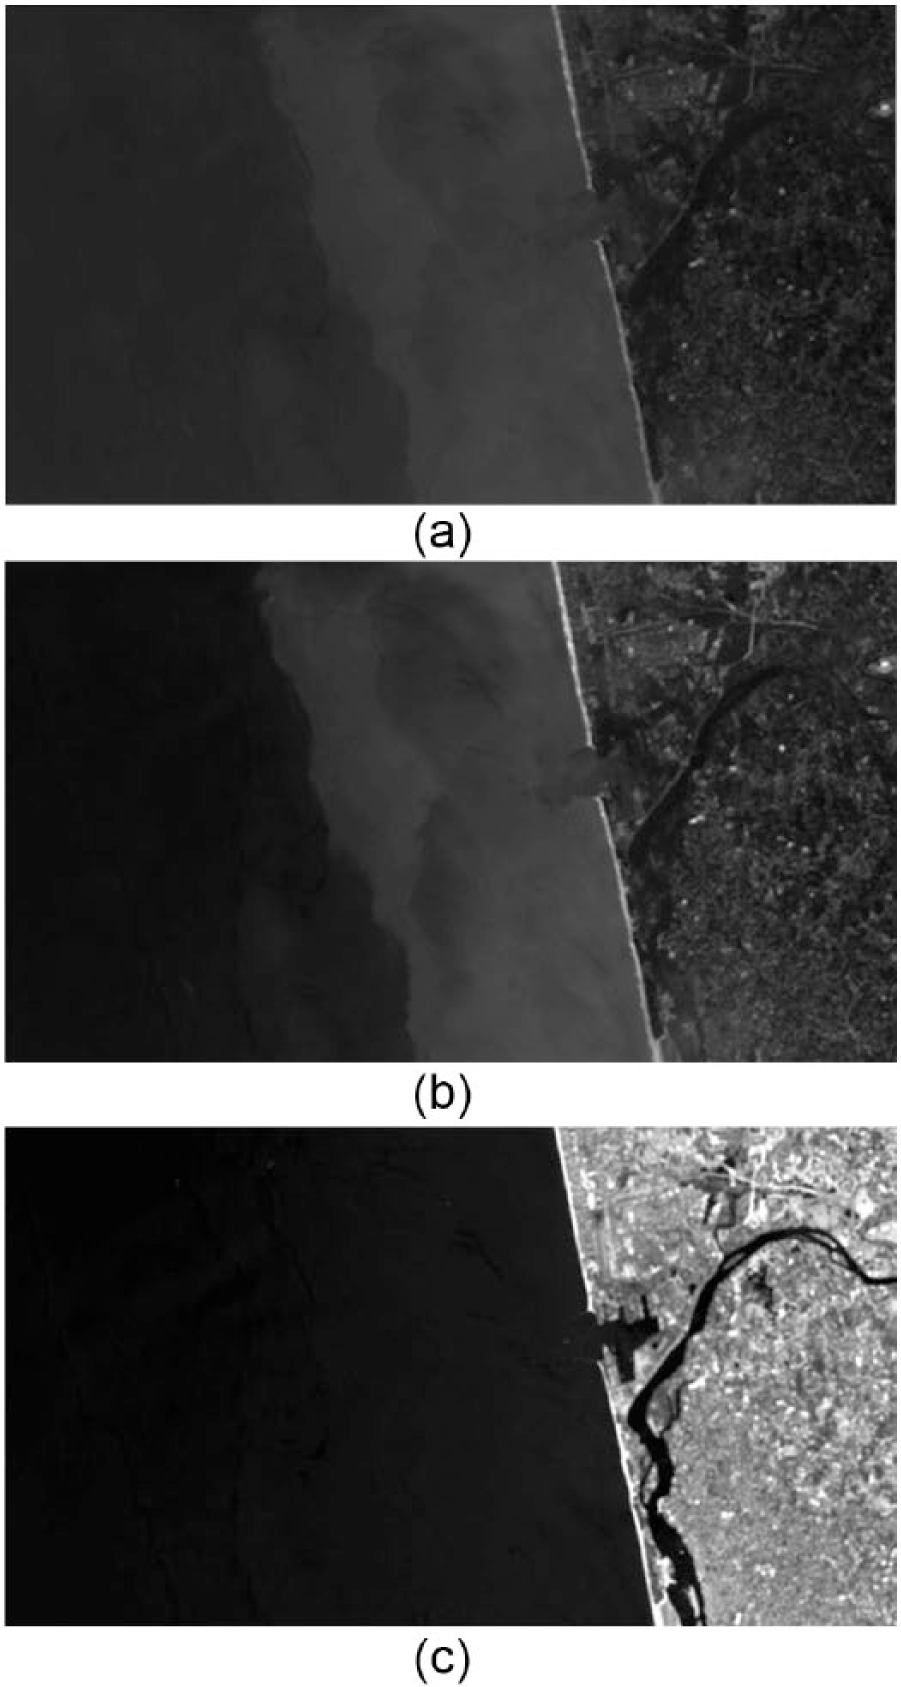
Low-pass filter of (a) blue band, (b) green band, and (c) NIR band.
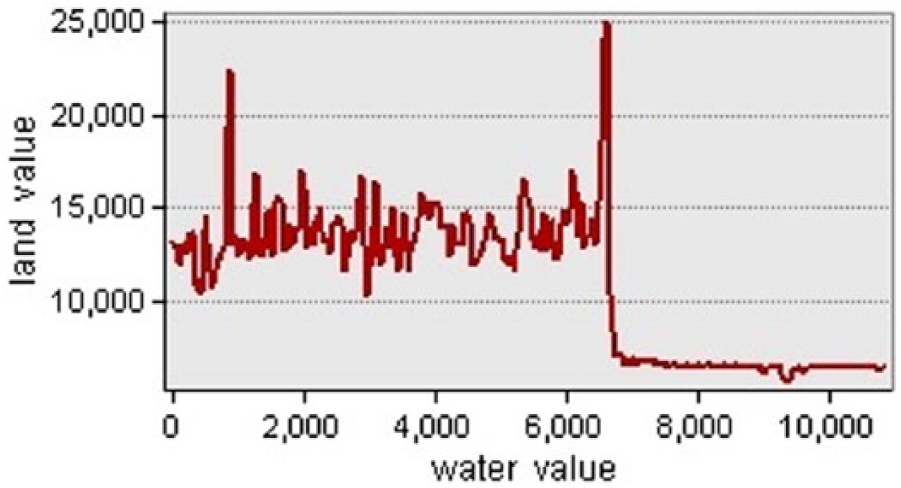
Threshold value to separate the land from water.
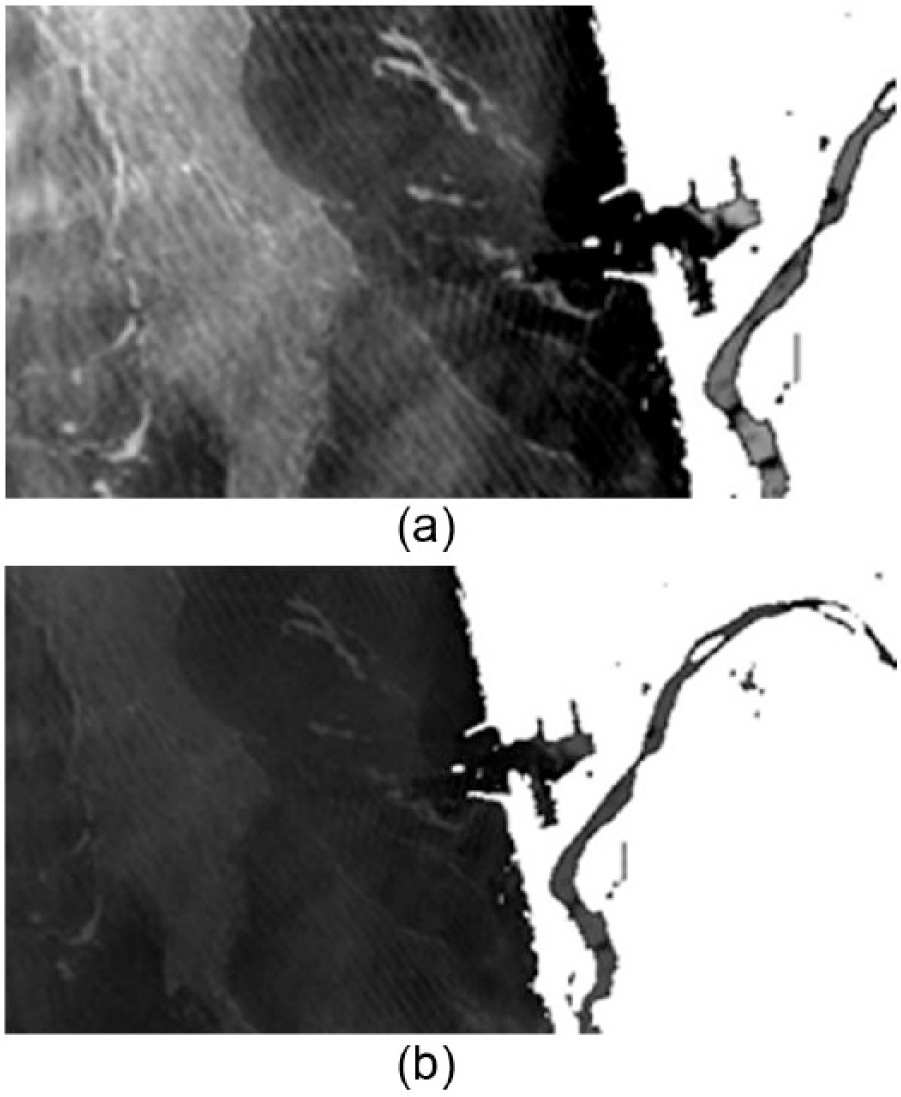
Removal of land from water for (a) blue band and (b) green band.
Extraction of polygon for (a) blue band and (b) green band.
Linear regression is established for bands (a) blue and (b) green to determine the
Removal of sun glint for (a) blue band and (b) green band.
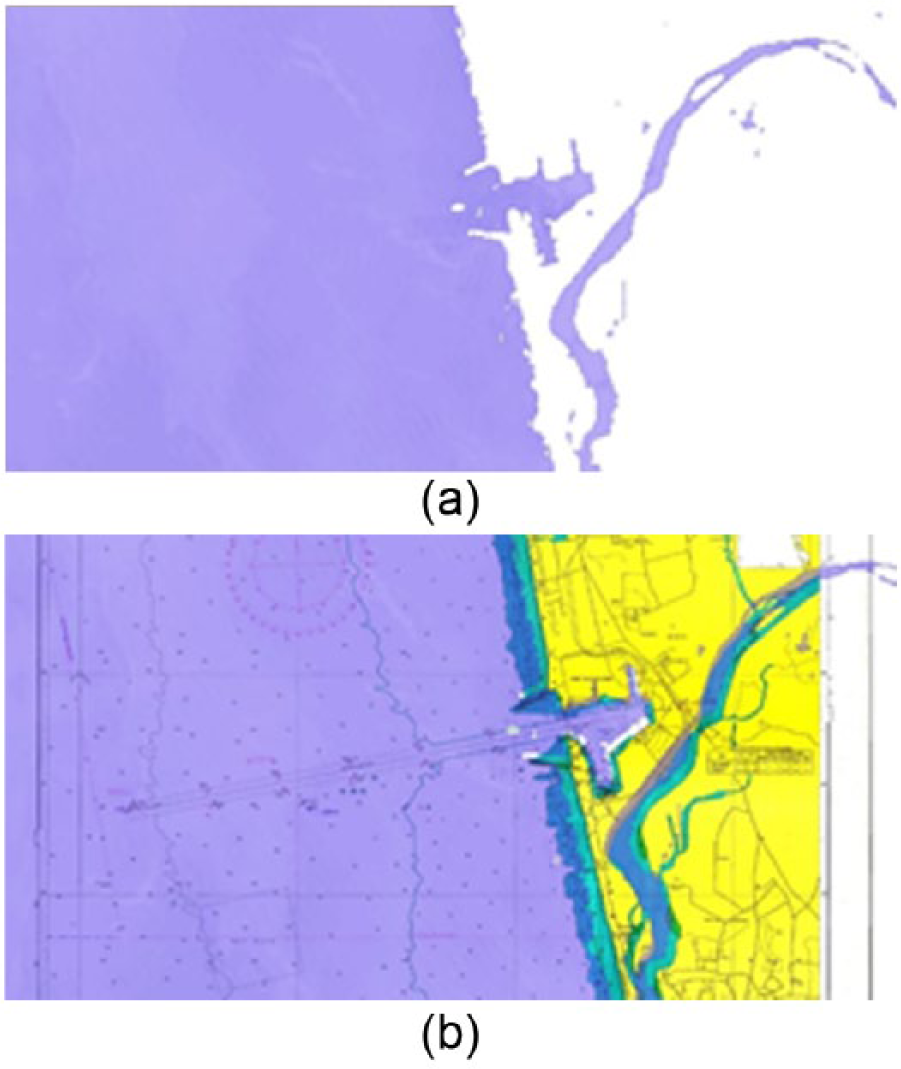
Representation of (a) bathy image and (b) hydrographic chart overlaid on bathy image.
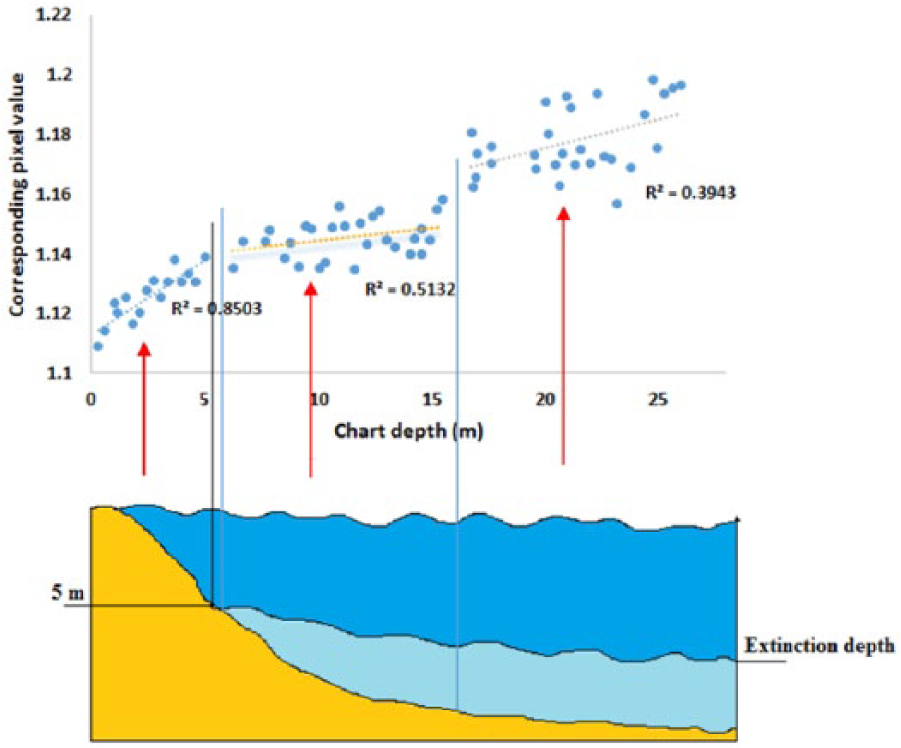
Extinction of depth before improving the spatial resolution.
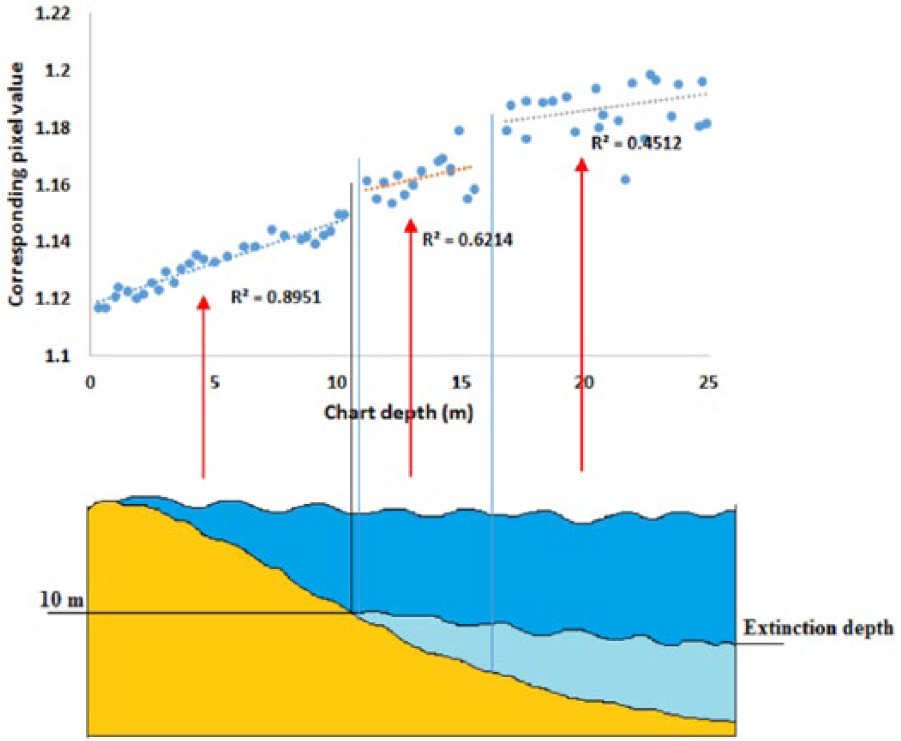
Extinction of depth after improving the spatial resolution.
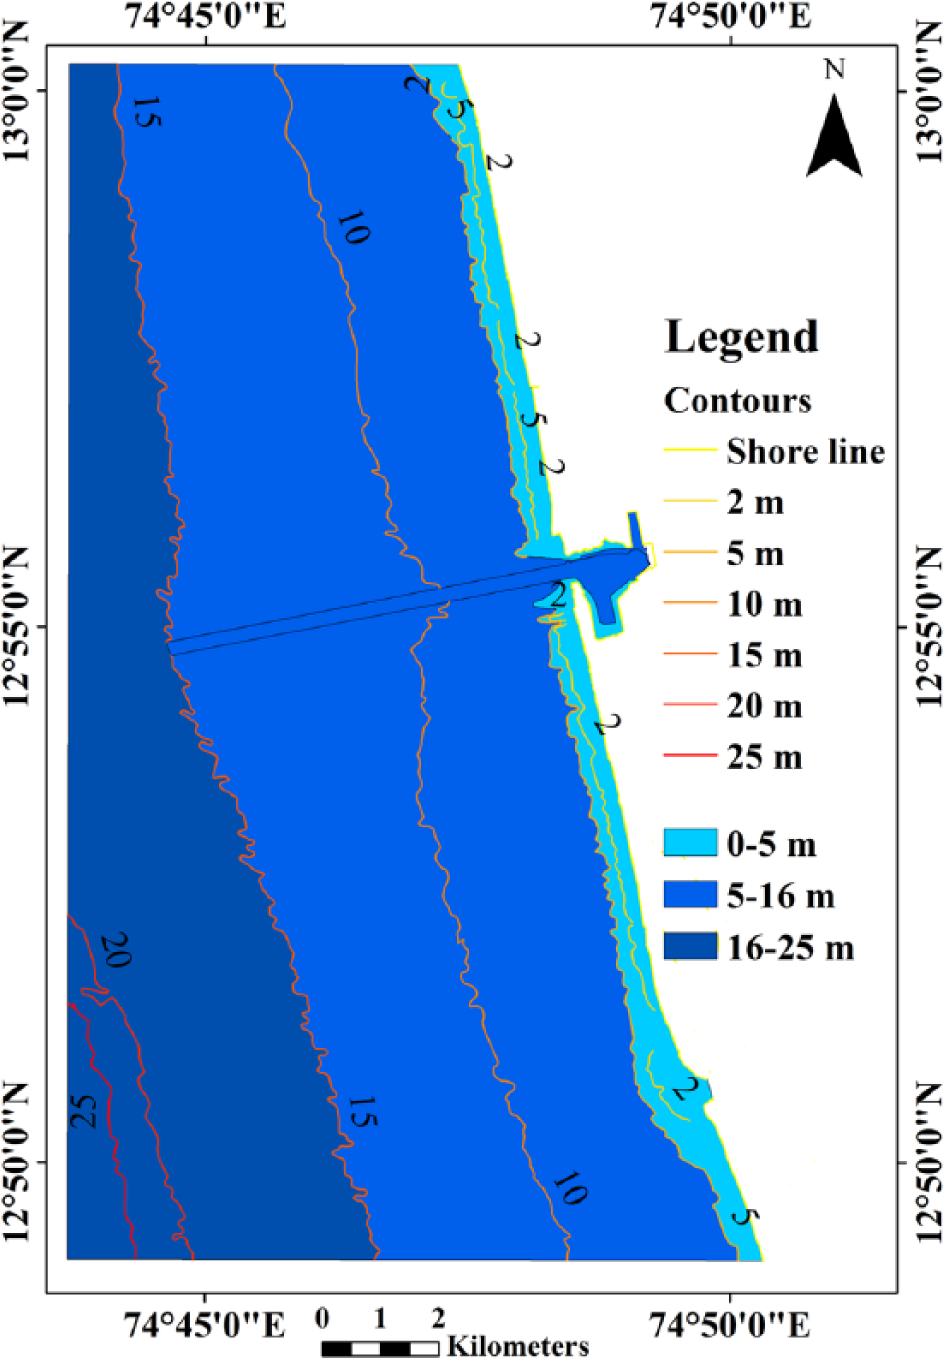
Estimation of depth before improving the spatial resolution.
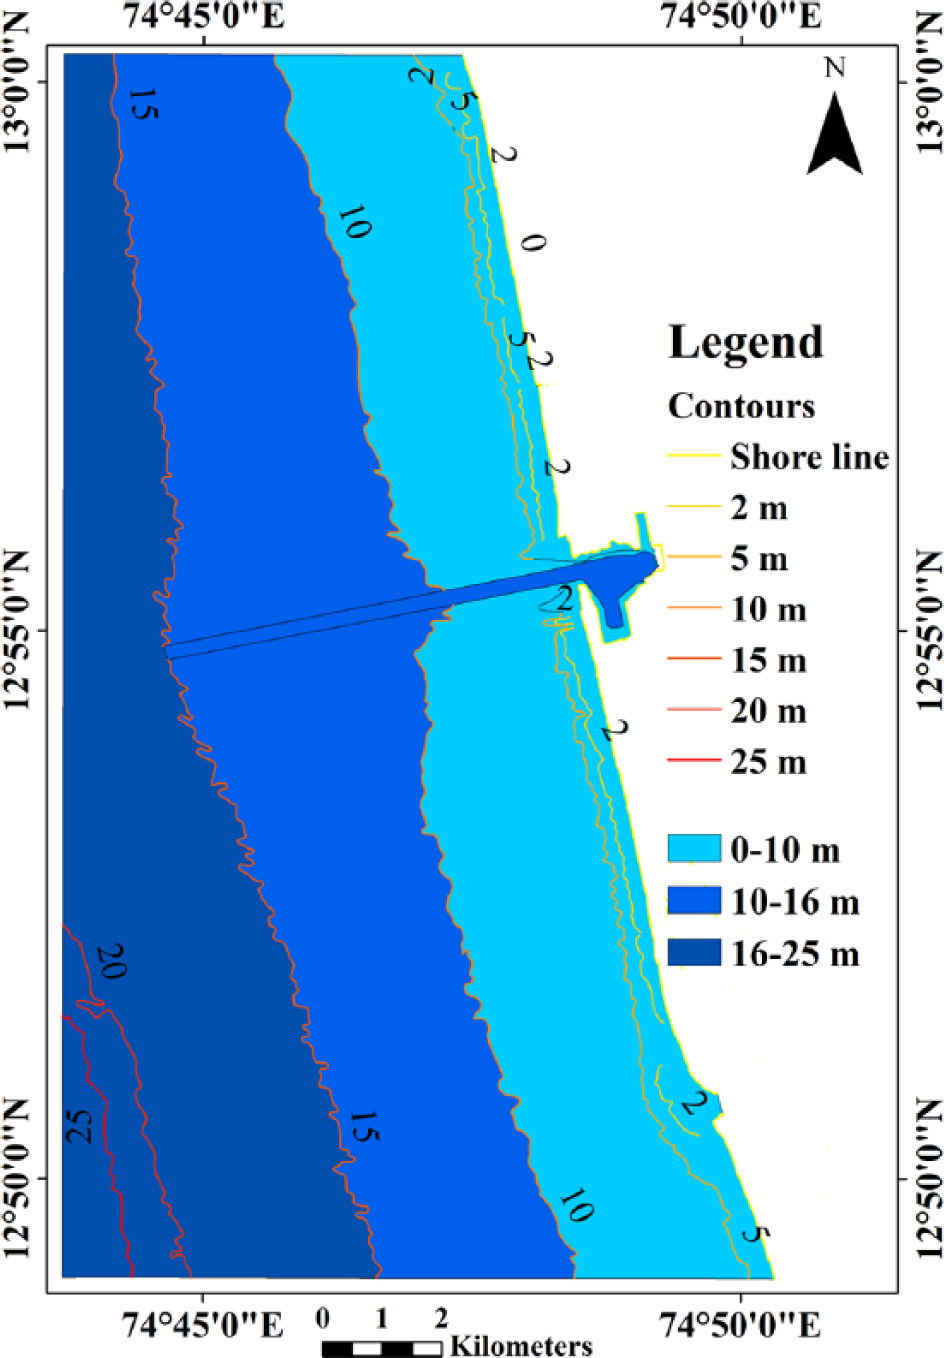
Estimation of depth after improving the spatial resolution.
In order to remove the silver glint, Hedley et al.’s (2005) method is adopted.
First, the polygon is drawn which covers only the water area (from the recommendations of Hochberg et al., 2003, areas of deep water are ideal for this). The polygon is created over the NIR band (i.e. band contains both dark (water) and bright (land) areas). The extracted polygon covers only the water area and is next used to extract the water body of the blue and green bands, as shown in Figure 7(a) and (b).
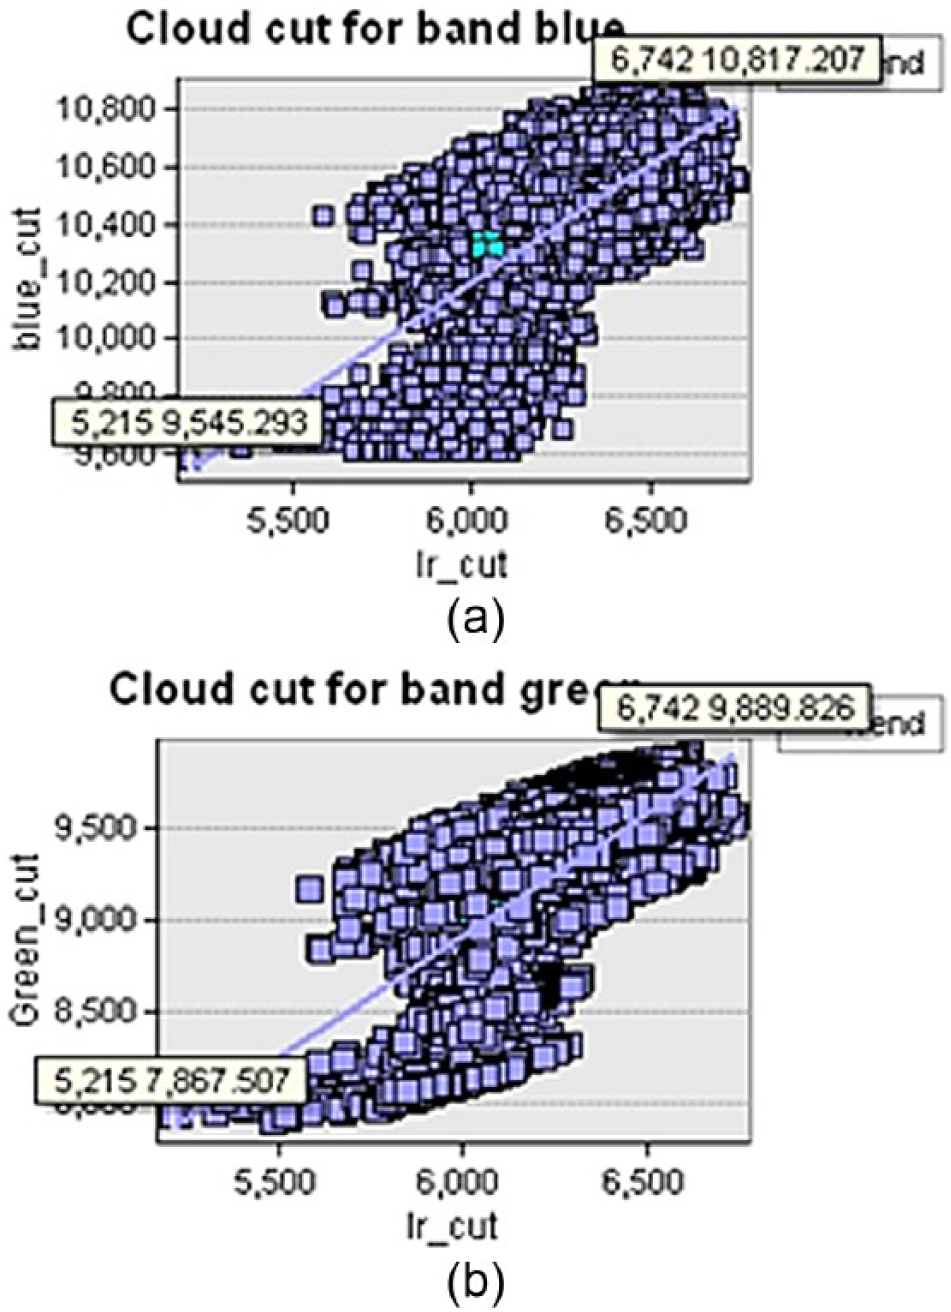
Second, linear regression is established for all the selected areas of each visible band against the NIR band, as shown in Figure 8(a) for blue band and Figure 8(b) for green band, where x-axis represents the NIR band brightness and y-axis represents the visible band. To remove the sun glint and cloud, the parameters such as
where the values of
The ratio transform algorithm is adopted on the pre-processed blue and green bands and estimates the bathymetry of near-shore ocean. The hydrographic chart used as a reference depth which is overlaid on the outcome of
From Figure 10(b), depth points in the hydrographic chart and the corresponding pixel values from the bathy image are obtained, and the scatter plot is plotted which is shown in Figures 11 and 12, in which x-axis represents the hydrographic chart depth and y-axis represents the corresponding pixel value. To estimate the bathymetry of near-shore ocean using ratio transform algorithm, certain parameters are required, such as
The effectiveness of improving the spatial resolution of Landsat-8 imagery for determining the bathymetry of near-shore ocean is examined by comparing the results of both before improving the spatial resolution of 30 m and after improving the spatial resolution of 15 m. To validate the ratio transform algorithm, the statistical indices such as RMSE and mean absolute error (MAE) are computed between the algorithm results and hydrographic chart depth.
Figure 11 represents the result of estimating the bathymetry of near-shore ocean before improving the spatial resolution of satellite image (i.e. 30 m), where the top portion of the image shows the scatter plot of the corresponding pixel value against the hydrographic chart depth, which indicates good correlation value of R2 = 0.8503 for depth up to 5 m. It is also seen that the value of R2 = 0.5132 for the depth from 5 to 16 m indicates that the corresponding pixel moderately matches the hydrographic chart depth, and the value of R2 = 0.3943 for the depth from 16 to 25 m indicates that the pixel value and hydrographic chart depth do not match.
The bottom portion of the image explains the pixel value and its relation to the depth of extinction. Areas deeper than the extinction depth (i.e. 5 m) do not have a good correlation between the pixel value and the reference hydrographic chart depth. Therefore, the ratio transform algorithm can retrieve the depth up to 5 m for the 30 m spatial resolution of Landsat-8 imagery.
Figure 12 represents the result of estimating the bathymetry of near-shore ocean (i.e. after improving the spatial resolution of satellite image to 15 m), where the top portion of the image shows the scatter plot of the corresponding pixel value against the hydrographic chart depth which indicates the good correlation value of R2 = 0.8951 for the depth up to 10 m. It is also seen that the value of R2 = 0.6214 for the depth from 10 to 16 m indicates that the pixel value moderately matches the hydrographic chart depth, and the value of R2 = 0.4512 for the depth from 16 to 25 m indicates that the pixel value and hydrographic chart depth matches unlikely.
The bottom portion of the image explains that the areas deeper than the extinction depth 10 m do not have a good correlation between the pixel value and the reference hydrographic chart depth. Therefore, it is evident that improving the spatial resolution of satellite image helps to determine the higher depth.
The required parameters such as
RMSE and MAE values before improving the spatial resolution of Landsat-8 imagery.
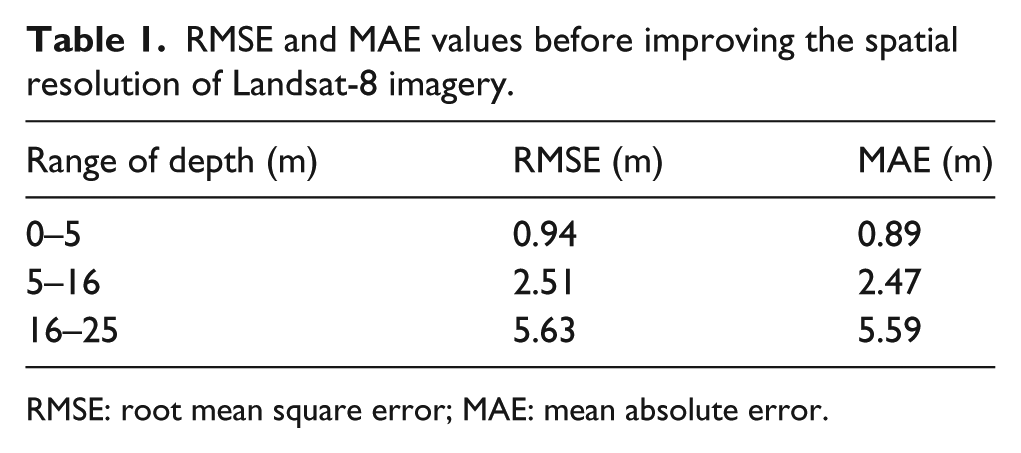
RMSE: root mean square error; MAE: mean absolute error.
RMSE and MAE values after improving the spatial resolution of Landsat-8 imagery.
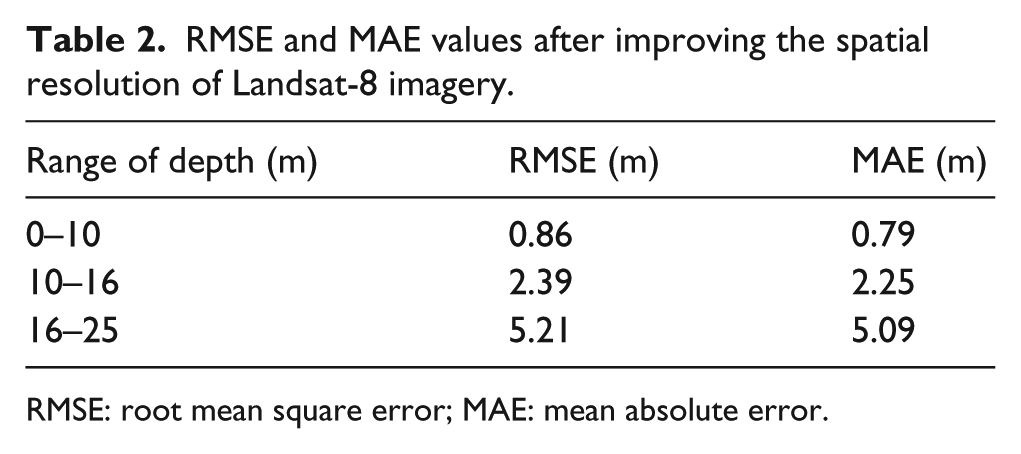
RMSE: root mean square error; MAE: mean absolute error.
Table 1 indicates that the range of depths between 0 and 5 has higher accuracy (RMSE = 0.94; MAE = 0.89). From Table 2, it is observed that the highest accuracy (RMSE = 0.86; MAE = 0.79) is achieved for the range of depths between 0 and 10. It is seen that the ratio transform algorithm tends to underestimate the depths in water deeper than 10 m. Therefore, the ratio transform algorithm can better estimate the depth up to 10 m for the improved spatial resolution of Landsat-8 imagery.
Figures 13 and 14 represent the estimation of bathymetry before and after improving the spatial resolution of satellite image along the coast of Mangaluru, Karnataka.
The Landsat-8 image with the spatial resolution of 30 m (i.e. before improving the spatial resolution) provided better estimation of depth up to 5 m, which is indicated in light blue and shown in Figure 13, the depth from 5 to 16 m is shown in blue, and the depth from 16 to 25 m is shown in dark blue in which the algorithm results and hydrographic chart depth do not match. Therefore, the Landsat-8 image with spatial resolution of 30 m better estimates the depth up to 5 m.
The Landsat-8 image with the spatial resolution of 15 m (i.e. after improving the spatial resolution) provided the better estimation of depth up to 10 m (which is colored in light blue) is shown in Figure 14, the depth from 10 to 16 m is shown in blue, and the depth from 16 to 25 m is shown in dark blue indicates that the algorithm results and hydrographic chart depth do not match. Therefore, the Landsat-8 image with improved spatial resolution of 15 m better estimates the depth up to 10 m.
Conclusion
In this study, the procedure is evolved for estimating near-shore bathymetry using Landsat-8 satellite imagery based on the ratio transform algorithm. In effect, this procedure can be best used as an exploration tool to infer the bathymetry of coastal region before a high-resolution hydrographic survey is operated using an expensive instrument such as multi-beam echo sounder.
The results of satellite image show a good correlation of R2 = 0.8503 with the hydrographic chart data for the depth up to 5 m for the 30-m spatial resolution of Landsat-8 imagery.
The results of satellite image after improving the spatial resolution to 15 m show a good correlation of R2 = 0.8951 with the hydrographic chart data for the depth up to 10 m. Therefore, improving the spatial resolution helps to infer the higher depth in the region of coast.
The results of RMSE and MAE between the algorithm results and hydrographic chart indicate that the ratio transform algorithm can better estimate the depth up to 10 m for the improved spatial resolution of Landsat-8 imagery.
The procedure used for deriving the satellite bathymetry can be used by marine surveyors and hydrographic officers. Using the results of this procedure, marine surveyors can assess the current amount of change in depth, and if a weaker R2 value is observed, it necessitates the update of high-resolution hydrographic chart to the existing one.
To derive the bathymetry using the satellite imagery, environmental conditions such as water clarity, cloud cover, and sun glint are needed to be considered that could deteriorate the accuracy of estimated depth.
It is also to be noted that the selection of reference hydrographic chart is important due to the age of the hydrographic survey or the old technique and equipment used to conduct the survey.
Finally, regardless of improvement in the satellite-derived bathymetry, the procedure evolved can be used as an exploration tool for operating the hydrographic survey, and this is not an alternative for acoustic hydrographic survey.
Footnotes
Acknowledgements
The authors thank Dr Richard P. Stumpf, Oceanographer, NOAA (National Center for Coastal Ocean Science), and Dr Shachak Pe’eri, Research Associate Professor, Center for Coastal and Ocean Mapping, University of New Hampshire, for providing the necessary support for research execution. The authors also acknowledge the support from the authorities of New Mangalore Port Trust (NMPT), Mangaluru, Karnataka, India, for providing the necessary data required for research and also lending a hand to understand the working of the single-beam echo sounder instrument. The authors thank the Director, NITK, Surathkal and also the Head, Department of Applied Mechanics and Hydraulics, NITK, Surathkal.
Declaration of conflicting interests
The author(s) declared no potential conflicts of interest with respect to the research, authorship, and/or publication of this article.
Funding
The author(s) received no financial support for the research, authorship, and/or publication of this article.