
Abstract
Background:
Breast cancer (BC) is the most frequently diagnosed malignancy and the leading cause of cancer-related death in women. Beyond traditional clinical classifications, metabolic reprogramming has emerged as an additional layer of tumor heterogeneity. Fatty acids (FAs), essential for membrane synthesis, energy storage, and signaling, undergo dynamic remodeling in cancer and may reflect disease progression.
Objectives:
To examine associations between serum FAs profiles and clinical-pathological features of BC, including tumor stage, surrogate subtype, lymph node status, and proliferative activity.
Design:
A retrospective, cross-sectional study was conducted at a single institution to analyze metabolic signatures in patients with BC stratified by clinical and surrogate characteristics.
Methods:
Serum FAs composition was analyzed by gas chromatography–mass spectrometry in 110 patients with BC before treatment initiation. Patients were categorized according to tumor stage, BC surrogate subtype, and Ki-67 proliferation index. Group comparisons and correlations were performed using standard parametric/non-parametric tests as appropriate, with Benjamini–Hochberg false discovery rate (FDR) correction across the FAs panel.
Results:
In categorical comparisons (e.g., tumor stage, Ki-67, lymph node status), some FAs, particularly arachidonic acid (ARA), and selected saturated, branched-chain, and polyunsaturated species, were nominally elevated in more aggressive phenotypes, but none remained significant after FDR correction (Q = 0.05). Correlation analysis using Ki-67 as a continuous variable revealed modest but consistent positive associations with multiple FAs. Notably, ARA, dihomo-γ-linolenic acid, docosapentaenoic acid, and several branched- and odd-chain species remained significantly correlated with Ki-67 after FDR adjustment.
Conclusion:
This exploratory study suggests that specific serum FAs are modestly associated with tumor proliferative activity, supporting the concept that aggressive BC phenotypes may involve systemic lipid remodeling. Further prospective studies are needed to validate these findings and assess their potential clinical relevance.
Plain language summary
Doctors usually learn about breast cancer by examining tumor tissue. These tests are important, but they capture a small part of the disease at a single moment. We explored whether patterns of fatty acids circulating in the blood might also reflect how the cancer behaves. We analyzed blood samples from 110 women with newly diagnosed breast cancer before treatment. Using laboratory methods, we measured different blood fatty acids and compared them with cancer stage, cancer subtype, and how fast the cancer was growing. We found that higher levels of certain fatty acids, especially arachidonic acid, docosapentaenoic acid and some branched- and odd-chain fats, were linked to faster tumor growth, as measured by a marker called Ki-67. This suggests that blood fatty acids patterns might reflect how aggressive the tumor is, even before treatment starts. However, this was an early-stage, single-center study, and larger, well-designed studies that include these factors and confirm findings in independent groups of patients are needed before serum fatty acid profiling can be considered for clinical use.
Introduction
Breast cancer (BC) is the most common cancer among women and the leading cause of cancer-related deaths.1–4 It is a heterogeneous disease shaped by genetic and non-genetic factors, like environment, reproduction, and lifestyle. 5 Less than 10% of cases involve inherited mutations; most occur sporadically. BC is classified into luminal, human epidermal growth factor receptor 2 (HER2)-positive, and triple-negative (TNBC) subtypes based on estrogen receptor (ER), progesterone receptor (PR), Ki-67 index, and HER2 status.6–9 However, this classification does not fully reflect tumor heterogeneity, especially in TNBC, which has different subgroups with varying prognoses and treatment responses. 10 Standard histopathology gives a limited view from a single biopsy and misses tumor evolution and resistance mechanisms. This has led to interest in alternative, less-invasive biomarkers, such as those derived from blood samples. 11 Lipidomics is a promising method for analyzing lipid metabolism, which is reprogrammed in numerous cancers, including BC, to support rapid growth.12,13
To meet the demand for membrane synthesis and energy, tumor cells increase de novo lipogenesis, boosting fatty acids (FAs) production. 14 These hydrocarbon chains serve as structural parts of membranes and act as signaling molecules, like diacylglycerol and phosphatidylinositol-3,4,5-trisphosphate, which regulate vital processes such as growth and survival. 12 In nutrient-rich conditions, excess FAs (mainly saturated (SFA) and monounsaturated (MUFA)) are stored as triacylglycerols for energy. While normal cells mainly use external FAs, tumor cells depend more on internal synthesis to meet their metabolic needs. 15 Although evidence points to lipid metabolism’s role in cancer progression, the effects of individual FAs are still unclear and may vary by chain length, saturation, and tumor-specific pathways. For example, oleic acid (OA, 18:1n-9), a MUFA, promotes focal adhesion kinase phosphorylation, boosting migration and metastasis in BC cells. 16
In our previous work, we found distinct changes in serum lipid profiles between BC patients and healthy controls. We also showed that disruptions in SFA and MUFA profiles could last up to 12 months after tumor removal, potentially increasing the risk of recurrence. 17 However, links between serum FAs profiles and specific clinical features in BC are still limited. To address this gap, we examined serum FAs composition in treatment-naïve BC patients and looked at its connections with clinical stage, immunohistochemistry-based subtypes, lymph node involvement, and Ki-67-defined proliferative activity.
Methods
Study design and patient characteristics
The reporting of this study conforms to the STROBE guideline for cross-sectional observational studies; the completed STROBE checklist is provided as Table S1. The study was conducted between January 2014 and January 2018, with active recruitment between January 2014 and January 2016, under the Declaration of Helsinki. The protocol was approved by the Independent Bioethics Committee for Scientific Research at the Medical University of Gdansk, Poland (NKBBN/526/2013; October 30, 2013). Written informed consent was obtained from all participants. In total, 110 women (18–79 years) with histopathologically confirmed, treatment-naïve BC (stage I–III) were consecutively recruited from the oncological outpatient department of the Medical University of Gdansk. Recruitment and blood collection were integrated into routine pre-treatment outpatient visits and were restricted to patients who could attend morning appointments. Participants were contacted before their scheduled visit and instructed to arrive after an overnight fast; consent and fasting blood sampling were obtained during the same visit, prior to initiation of any therapy, without an additional study-specific appointment. This workflow, together with the treatment-naïve stage I–III inclusion criteria, contributed to the modest cohort size. Exclusion criteria included a second active malignancy; common comorbidities (e.g., cardiovascular disease or diabetes) were not exclusionary. Demographic and clinical data (age, family history, tumor histology, clinical stage per AJCC 7th edition TNM classification (2010–2017), 18 lymph node status, and Ki-67 index) were extracted from medical records. Tumors were classified into immunohistochemistry-based surrogate subtypes: luminal A-like (ER+, PR ⩾20%, HER2−, Ki-67 ⩽30%), luminal B-like (ER and/or PR+, with Ki-67 >30%, or PR <20%, regardless of HER2 status), HER2-positive (ER−/PR−/HER2+), and TNBC (ER−/PR−/HER2−). A 30% Ki-67 cut-off was applied to reduce inter-observer and inter-laboratory variability. Detailed information on lipid-lowering therapy (e.g., statins, fibrates), NSAID use, and concomitant inflammatory conditions was not systematically available. While the standardized fasting morning sampling protocol ensured consistent pre-analytical conditions, residual confounding because of unmeasured medication use and inflammatory/metabolic conditions cannot be excluded.
Serum FA profiling using GC-MS
Total lipids were extracted from 200 µL serum aliquots using the Folch method. 19 Lipids were hydrolyzed with KOH/methanol at 90°C for 3 h, and FAs were extracted with water/n-hexane. FAMEs were synthesized by derivatization with 10% BF3-methanol at 55°C for 1.5 h, followed by triple extraction with n-hexane, solvent evaporation under nitrogen, and storage at −20°C. FAMEs were analyzed by GC-EI-MS (Shimadzu QP-2010SE; Shimadzu Corporation, Kyoto, Japan) on a Zebron ZB-5MSi column (Phenomenex, Torrance, CA, USA) (30 m × 0.25 mm × 0.25 μm). The injection solvent was dichloromethane. Oven program: 60–310°C at 4°C/min, 5 min hold (total 67.5 min). Helium carrier gas at 100 kPa. MS detection in full scan (m/z 45–700) with 70 eV EI. After extraction, the mass of lipids was measured, and based on the total volume of serum used for extraction, we calculated the amount of lipids per 1 mL of serum. The FA profile was determined using reference standards (branched-chain fatty acid (BCFA) and very long-chain fatty acids (VLCFA) standards; (Larodan AB, Solna, Sweden), and 37 FAME Mix (Sigma-Aldrich, St. Louis, MO, USA). FA concentrations were calculated based on the internal standard signal and expressed as relative abundance. These values were then calculated for a specific serum volume, and finally, the results are shown as µmol of FA per 1 L of serum. We identified 48 FAs and, based on these, defined 9 additional groups to which the acids were classified. To control the quality of the results, a mixture of reference standards was analyzed before and after GC-MS analysis of patients’ samples, and randomly selected samples were replicated (triplicate analyses were performed to establish precision).
Statistical analysis
Statistical analyses were performed using InStat (GraphPad, San Diego, CA, USA). Data distribution was assessed using the Shapiro–Wilk test. For normally distributed data, comparisons between two groups were conducted using Student’s t test, while multiple group comparisons employed one-way ANOVA with appropriate post hoc testing. For non-normally distributed data, the Kruskal–Wallis test followed by Dunn’s post hoc was applied. Correlations between variables were assessed using Pearson’s test. No imputation was performed; analyses were conducted on available data, and sample sizes (n) are reported for each analysis. To account for multiple testing across the FAs panel within each stratification/comparison, p-values were adjusted using false discovery rate (FDR) control according to the Benjamini–Hochberg procedure. FDR-adjusted q-values are reported alongside nominal p-values; results were considered significant at q < 0.05.
Results
Characteristics of patients included in the study
The clinical characteristics of the study cohort are summarized in Table 1. The majority of patients presented with stage I and Luminal A-like surrogate subtype.
Characteristics of patients with breast cancer.

ER, estrogen receptor; HER2, human epidermal growth factor receptor 2; PR, progesterone receptor; SEM, standard error of the mean; TNBC, triple-negative breast cancer.
Serum FAs profile across BC clinical stages
To explore potential associations between serum FAs composition and BC progression, patients were stratified according to clinical stage (I–III; Table S2) as defined by AJCC 7th edition TNM classification (2010–2017), restricted to M0 disease: stage I comprised IA (T1N0) and IB (T0N1mi or T1N1mi); stage II comprised IIA (T0N1, T1N1, or T2N0) and IIB (T2N1 or T3N0); stage III comprised IIIA (T0–2N2 or T3N1–2), IIIB (T4N0–2), and IIIC (any T, N3). Two FAs showed nominal differences between I and III stages; higher concentrations of 16:0 (stage I: 2724 ± 93 μmol/L; stage III: 3243 ± 175 μmol/L; nominal p = 0.0373) and arachidonic acid (ARA, 20:4n-6 (stage I: 583.4 ± 25.97 μmol/L; stage III: 696.3 ± 33.46 μmol/L; nominal p = 0.0304)) compared with stage I were noted (Table 2). However, none of the pairwise comparisons remained significant after controlling for multiple testing using the FDR across the analyzed FAs (Q = 0.05; Table 2).
The concentration of FAs (μmol/L) in the serum of patients with I, II, and III stages of breast cancer (mean ± SEM).

AdA, adrenic acid; ALA, α‑linolenic acid; ARA, arachidonic acid; BCFA, branched-chain fatty acid; BH-FDR, Benjamini–Hochberg false discovery rate; DGLA, dihomo‑γ‑linolenic acid; DHA, docosahexaenoic acid; DPA, docosapentaenoic acid; ECFA, even-chain fatty acids; EDA, eicosadienoic acid; EPA, eicosapentaenoic acid; ETA, eicosatrienoic acid; FA, fatty acids; HDA, hexadecenoic acid; LA, linoleic acid; MUFA, monounsaturated fatty acids; n-3 PUFA, omega‑3 polyunsaturated fatty acids; OCFA, odd-chain fatty acids; OCFA, n-6 PUFA, omega‑6 polyunsaturated fatty acids; SEM, standard error of the mean; SFA, saturated fatty acids.
Bold indicates statistically significant differences (p < 0.05).
Serum FA profiles in BC surrogate subtypes
Serum FA profiles were further analyzed according to surrogate subtypes defined by receptor status, including TNBC, Luminal A-like, and Luminal B-like. The HER2-positive group was not included due to the small number of patients (n = 5). The distribution of patients across subtypes and corresponding clinical characteristics is presented in Table S3. As shown in Table 3, several FAs displayed nominal differences between TNBC and Luminal A-like tumors, including higher levels of 20:0 (Luminal A-like: 8.59 ± 0.57 μmol/L; TNBC: 12.13 ± 1.23 μmol/L; nominal p = 0.041), 23:0 (Luminal A-like: 4.73 ± 0.41 μmol/L; TNBC: 7.11 ± 0.83 μmol/L; nominal p = 0.046), 17:1 (Luminal A-like: 16.83 ± 0.90 μmol/L; TNBC: 23.05 ± 2.10 μmol/L; nominal p = 0.035), and docosapentaenoic acid (DPA, 22:5n-3 (Luminal A-like: 34.18 ± 1.96 μmol/L; TNBC: 44.51 ± 3.37 μmol/L; nominal p = 0.035). However, none of these subtype comparisons remained significant after Benjamini–Hochberg false discovery rate correction at Q = 0.05 (BH-FDR q values).
The concentration of FAs (μmol/L) in the serum of patients with luminal A-like, luminal B-like, and TNBC surrogate subtypes (mean ± SEM).

AdA, adrenic acid; ALA, α‑linolenic acid; ARA, arachidonic acid; BCFA, branched-chain fatty acid; BH-FDR, Benjamini–Hochberg false discovery rate; DGLA, dihomo‑γ‑linolenic acid; DHA, docosahexaenoic acid; DPA, docosapentaenoic acid; ECFA, even-chain fatty acids; EDA, eicosadienoic acid; EPA, eicosapentaenoic acid; ETA, eicosatrienoic acid; FA, fatty acids; HDA, hexadecenoic acid; LA, linoleic acid; MUFA, monounsaturated fatty acids; n-3 PUFA, omega‑3 polyunsaturated fatty acids; OCFA, odd-chain fatty acids; OCFA, n-6 PUFA, omega‑6 polyunsaturated fatty acids; SEM, standard error of the mean; SFA, saturated fatty acids.
Bold indicates statistically significant differences (p < 0.05).
In clinical decision-making, the key biological and therapeutic contrast is observed between TNBC and luminal-like tumors. While Luminal A-like and Luminal B-like differ in proliferative activity, they share hormone-receptor-driven biology and are often treated collectively in treatment stratification. Therefore, for this analysis, both luminal-like subtypes were grouped together, allowing a direct comparison of TNBC versus luminal-like disease, whose clinical characteristics are presented in Table S4. This approach enables assessment of whether serum FAs profiles can capture fundamental metabolic distinctions between these clinically divergent entities, thereby supporting their potential translational relevance.
Similarly, when comparing TNBC with all luminal-like subtypes combined (Luminal A-like and Luminal B-like), as shown in Table 4, several FAs showed nominal between-group differences. Specifically, TNBC was associated with higher levels of 12:0 (luminal-like: 16.80 ± 1.80 μmol/L; TNBC: 26.00 ± 3.82 μmol/L; nominal p = 0.04), 18:0 (luminal-like: 757.70 ± 19.75 μmol/L; TNBC: 861.20 ± 43.97 μmol/L; nominal p = 0.04), 20:0 (luminal-like: 9.35 ± 0.55 μmol/L; TNBC: 12.13 ± 1.23 μmol/L; nominal p = 0.05), 17:1 (luminal-like: 17.52 ± 0.90 μmol/L; TNBC: 23.05 ± 2.10 μmol/L; nominal p = 0.02), and DPA (luminal-like: 36.05 ± 1.68 μmol/L; TNBC: 44.51 ± 3.37 μmol/L; nominal p = 0.03). However, none of these differences remained significant after BH-FDR correction.
The concentration of FAs (μmol/L) in the serum of patients with luminal-like and TNBC surrogate subtype (mean ± SEM).

AdA, adrenic acid; ALA, α‑linolenic acid; ARA, arachidonic acid; BCFA, branched-chain fatty acid; BH-FDR, Benjamini–Hochberg false discovery rate; DGLA, dihomo‑γ‑linolenic acid; DHA, docosahexaenoic acid; DPA, docosapentaenoic acid; ECFA, even-chain fatty acids; EDA, eicosadienoic acid; EPA, eicosapentaenoic acid; ETA, eicosatrienoic acid; FA, fatty acids; HDA, hexadecenoic acid; LA, linoleic acid; MUFA, monounsaturated fatty acids; n-3 PUFA, omega‑3 polyunsaturated fatty acids; OCFA, odd-chain fatty acids; SEM, standard error of the mean; OCFA, n-6 PUFA, omega‑6 polyunsaturated fatty acids; SFA, saturated fatty acids; TNBC, triple-negative breast cancer.
Bold indicates statistically significant differences (p < 0.05).
FA serum profiles in relation to lymph node involvement in BC
Since lymph node metastasis at diagnosis is associated with significantly worse outcomes after relapse compared with node-negative disease, independent of the disease-free interval, 20 patients were stratified according to nodal status (Table S5). As shown in Table 5, ARA (20:4n-6) showed a nominal increase in patients with lymph node involvement (N+) compared with node-negative cases (N−) (N−: 591.6 ± 22.53 μmol/L; N+: 660.9 ± 22.55 μmol/L; nominal p = 0.03). However, this difference did not remain significant after BH-FDR correction at Q = 0.05 (q = 0.89). No consistent differences were observed for the remaining serum FAs between N− and N+ groups (Table 5). However, because nodal status is correlated with clinical stage, the N− versus N+ comparisons may be confounded by stage and should be interpreted as exploratory.
Serum FA concentrations (μmol/L) of patients with breast cancer stratified by lymph node involvement (mean ± SEM).

AdA, adrenic acid; ALA, α‑linolenic acid; ARA, arachidonic acid; BCFA, branched-chain fatty acid; BH-FDR, Benjamini–Hochberg false discovery rate; DGLA, dihomo‑γ‑linolenic acid; DHA, docosahexaenoic acid; DPA, docosapentaenoic acid; ECFA, even-chain fatty acids; EDA, eicosadienoic acid; EPA, eicosapentaenoic acid; ETA, eicosatrienoic acid; FA, fatty acids; HDA, hexadecenoic acid; LA, linoleic acid; MUFA, monounsaturated fatty acids; n-3 PUFA, omega‑3 polyunsaturated fatty acids; OCFA, odd-chain fatty acids; OCFA, n-6 PUFA, omega‑6 polyunsaturated fatty acids; SEM, standard error of the mean; SFA, saturated fatty acids.
Bold indicates statistically significant differences (p < 0.05).
Association between serum FAs and cellular proliferation marker Ki-67 in BC
To investigate potential associations between FA profiles and proliferative activity, patients were stratified according to their Ki-67 index, using a 30% cut-off value. The stratification is presented in Table S6, dividing the cohort into low (<30%) and high (⩾30%) Ki-67 expression values. As shown in Table 6, several FAs showed nominal between-group differences, with generally higher concentrations in patients with Ki-67 ⩾30%. Among SFAs, nominal increases were observed for 18:0 (stearic acid; Ki-67 <30%: 742.60 ± 20.28 μmol/L; Ki-67 ⩾30%: 848.70 ± 28.72 μmol/L; nominal p = 0.003), 20:0 (arachidic acid; Ki-67 <30%: 8.85 ± 0.55 μmol/L; Ki-67 ⩾30%: 11.83 ± 0.96 μmol/L; nominal p = 0.01), and 24:0 (lignoceric acid; Ki-67 <30%: 12.02 ± 0.74 μmol/L; Ki-67 ⩾30%: 15.41 ± 1.24 μmol/L; nominal p = 0.02). Similarly, several odd-chain SFAs displayed nominal elevations, including 15:0 (Ki-67 <30%: 34.08 ± 1.27 μmol/L; Ki-67 ⩾30%: 40.29 ± 2.25 μmol/L; nominal p = 0.02), 17:0 (Ki-67 <30%: 30.07 ± 1.06 μmol/L; Ki-67 ⩾30%: 37.02 ± 1.98 μmol/L; nominal p = 0.00), 19:0 (Ki-67 <30%: 1.74 ± 0.09 μmol/L; Ki-67 ⩾30%: 2.16 ± 0.17 μmol/L; nominal p = 0.04), and 23:0 (Ki-67 <30%: 4.88 ± 0.37 μmol/L; Ki-67 ⩾30%: 6.78 ± 0.69 μmol/L; nominal p = 0.02), together with a nominal increase in total odd-chain FAs (OCFA; Ki-67 <30%: 75.70 ± 2.69 μmol/L; Ki-67 ⩾30%: 91.62 ± 4.73 μmol/L; nominal p = 0.01). Within BCFAs, nominal increases were noted for iso 16:0 (Ki-67 <30%: 5.66 ± 0.28 μmol/L; Ki-67 ⩾30%: 7.07 ± 0.49 μmol/L; nominal p = 0.02), iso 17:0 (Ki-67 <30%: 10.19 ± 0.45 μmol/L; Ki-67 ⩾30%: 12.73 ± 0.81 μmol/L; nominal p = 0.01), total iso-BCFA (Ki-67 <30%: 20.10 ± 0.89 μmol/L; Ki-67 ⩾30%: 24.69 ± 1.52 μmol/L; nominal p = 0.01), anteiso 17:0 (Ki-67 <30%: 8.40 ± 0.55 μmol/L; Ki-67 ⩾30%: 11.76 ± 1.00 μmol/L; nominal p = 0.01), total anteiso-BCFA (Ki-67 <30%: 16.39 ± 0.83 μmol/L; Ki-67 ⩾30%: 20.53 ± 1.52 μmol/L; nominal p = 0.02), and total BCFA (Ki-67 <30%: 37.83 ± 1.76 μmol/L; Ki-67 ⩾30%: 46.63 ± 3.03 μmol/L; nominal p = 0.02). Among MUFAs, 17:1 showed a nominal increase (Ki-67 <30%: 17.35 ± 0.95 μmol/L; Ki-67 ⩾30%: 22.08 ± 1.69 μmol/L; nominal p = 0.02). Among polyunsaturated fatty acids (PUFAs), nominally higher concentrations were observed for ARA (Ki-67 <30%: 602.00 ± 18.51 μmol/L; Ki-67 ⩾30%: 663.40 ± 19.86 μmol/L; nominal p = 0.03), dihomo‑γ‑linolenic acid (DGLA; 20:3n-6; Ki-67 <30%: 124.00 ± 4.67 μmol/L; Ki-67 ⩾30%: 144.00 ± 8.35 μmol/L; nominal p = 0.04), eicosapentaenoic acid (EPA; 20:5n-3; Ki-67 <30%: 90.79 ± 5.26 μmol/L; Ki-67 ⩾30%: 126.20 ± 13.70 μmol/L; nominal p = 0.02), DPA (22:5n-3; Ki-67 <30%: 34.74 ± 1.70 μmol/L; Ki-67 ⩾30%: 43.10 ± 2.57 μmol/L; nominal p = 0.01), and total n-3 PUFA (Ki-67 <30%: 310.70 ± 16.52 μmol/L; Ki-67 ⩾30%: 378.10 ± 25.56 μmol/L; nominal p = 0.03). However, none of the above differences remained statistically significant after BH-FDR correction at Q = 0.05 (all q > 0.05).
The concentration of FAs (μmol/L) in the patients with breast cancer, categorized by different Ki-67 marker levels (<30% and ⩾30%) (mean ± SEM).

AdA, adrenic acid; ALA, α‑linolenic acid; ARA, arachidonic acid; BCFA, branched-chain fatty acid; BH-FDR, Benjamini–Hochberg false discovery rate; DGLA, dihomo‑γ‑linolenic acid; DHA, docosahexaenoic acid; DPA, docosapentaenoic acid; ECFA, even-chain fatty acids; EDA, eicosadienoic acid; EPA, eicosapentaenoic acid; ETA, eicosatrienoic acid; FA, fatty acids; HDA, hexadecenoic acid; LA, linoleic acid; MUFA, monounsaturated fatty acids; n-3 PUFA, omega‑3 polyunsaturated fatty acids; OCFA, odd-chain fatty acids; OCFA, n-6 PUFA, omega‑6 polyunsaturated fatty acids; SEM, standard error of the mean; SFA, saturated fatty acids.
Bold indicates statistically significant differences (p < 0.05).
To further validate these associations, we performed a correlation analysis between the Ki-67 proliferation index and individual serum FA concentrations. The results, presented in Table 7, include Pearson correlation coefficients (r-values), corresponding p- and q-values (after BH-FDR correction). Overall, the associations were positive but modest in magnitude (most r values were in the ~0.22–0.36 range), indicating that higher proliferative activity is associated with small-to-moderate shifts in circulating FAs. Despite the modest effect sizes, a substantial subset of correlations remained statistically robust after BH-FDR correction. Among SFA and OCFAs, the strongest correlations were observed for 17:0 (r = 0.36; nominal p = 0.0001; q = 0.01), 18:0 (r = 0.35; nominal p = 0.0002; q = 0.01), and OCFA (r = 0.32; nominal p = 0.0006; q = 0.01), with additional BH-FDR-supported associations for 15:0, 20:0, 22:0, 24:0, ECFA, and SFA (all q < 0.05). BCFAs also showed consistent positive relationships with Ki-67, including iso 16:0 (r = 0.31; nominal p = 0.0012; q = 0.03), iso 17:0 (r = 0.29; nominal p = 0.0021; q = 0.03), total iso-BCFA (r = 0.30; nominal p = 0.0014; q = 0.03), and anteiso 17:0 (r = 0.32; nominal p = 0.0007; q = 0.01). Within PUFAs, Ki-67 correlated positively with DGLA (20:3n-6; r = 0.33; nominal p = 0.0005; q = 0.01), and DPA (22:5n-3; r = 0.33; nominal p = 0.0005; q = 0.01), and remained associated after BH-FDR with ARA (20:4n-6; r = 0.23; nominal p = 0.0183; q = 0.04), total n-6 PUFA (r = 0.25; nominal p = 0.0096; q = 0.04), and total n-3 PUFA (r = 0.26; nominal p = 0.0077; q = 0.04).
The concentration of FAs in patients’ serum correlated with the Ki-67 index, presented as Pearson r value and p- and q-values.

AdA, adrenic acid; ALA, α‑linolenic acid; ARA, arachidonic acid; BCFA, branched-chain fatty acid; BH-FDR, Benjamini–Hochberg false discovery rate; DGLA, dihomo‑γ‑linolenic acid; DHA, docosahexaenoic acid; DPA, docosapentaenoic acid; ECFA, even-chain fatty acids; EDA, eicosadienoic acid; EPA, eicosapentaenoic acid; ETA, eicosatrienoic acid; FA, fatty acids; HDA, hexadecenoic acid; LA, linoleic acid; MUFA, monounsaturated fatty acids; n-3 PUFA, omega‑3 polyunsaturated fatty acids; OCFA, odd-chain fatty acids; OCFA, n-6 PUFA, omega‑6 polyunsaturated fatty acids; SFA, saturated fatty acids.
Bold indicates statistically significant differences (p < 0.05).
Discussion
This exploratory study examines the link between tumor growth and certain circulating FAs in treatment-naïve BC patients. Among all the clinicopathologic features, the Ki-67 proliferation index was the most informative. It showed strong correlations with various individual FAs and FA classes. In contrast to the clinical stage, lymph node status, or surrogate subtype, numerous differences were not significant after correcting for multiple tests. The continuous analysis of Ki-67, however, revealed a clear metabolic signal. Several associations remained significant after BH-FDR adjustment (Q = 0.05). These correlations were consistent across saturated, odd-chain, branched-chain species, and selected polyunsaturated FAs. This indicates that higher tumor activity is linked to small-to-moderate shifts in systemic lipid composition (Figure 1).
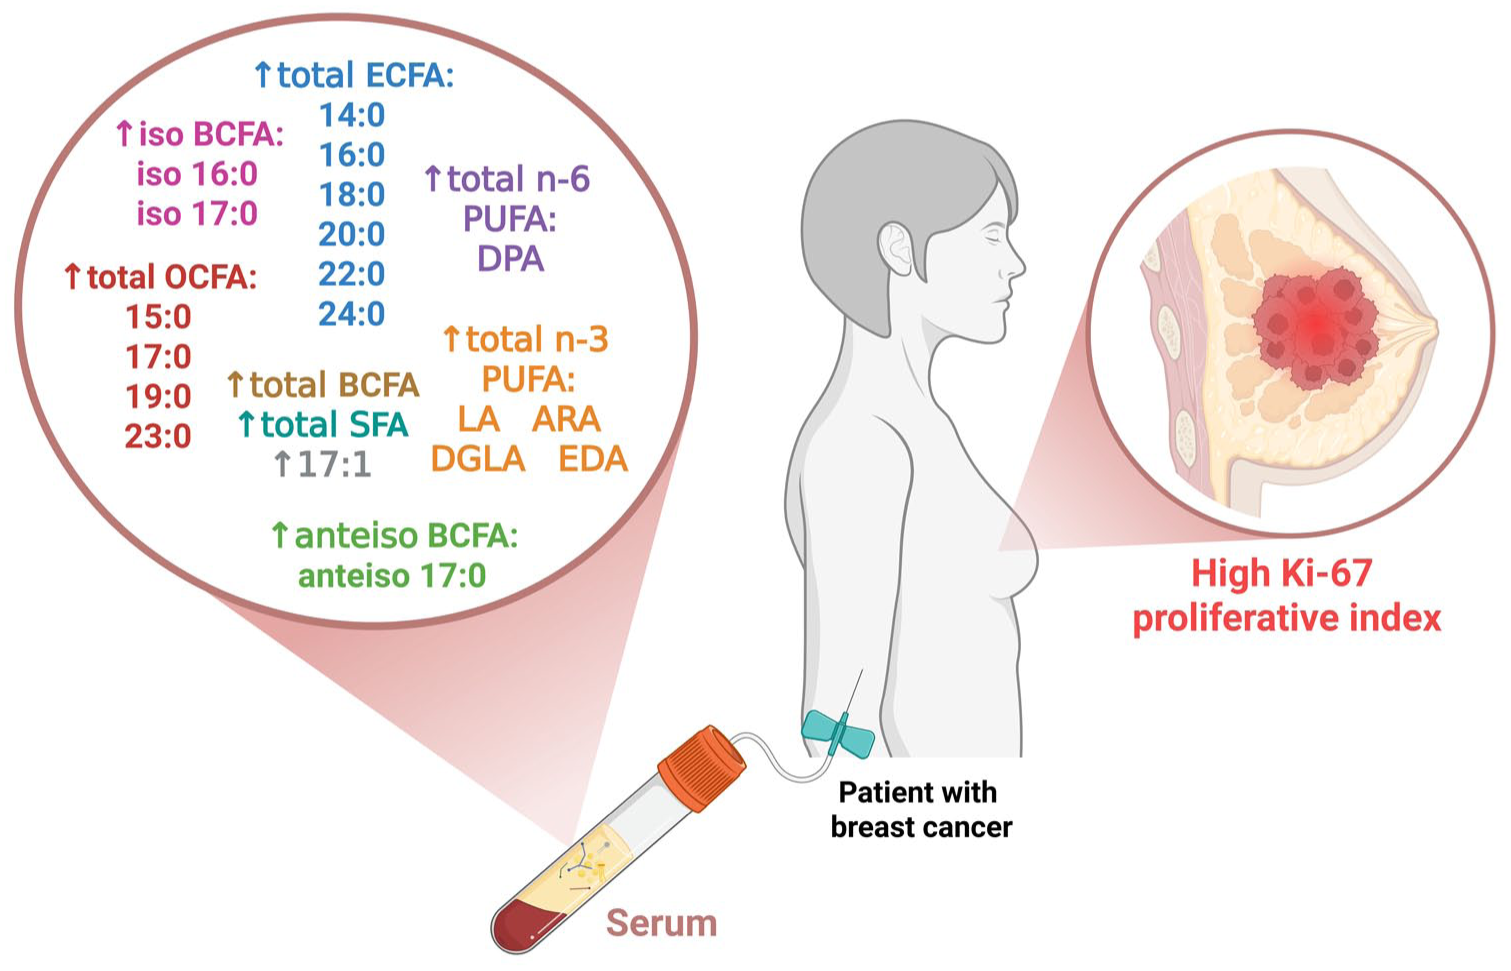
Serum fatty acid profile linked to high Ki-67 proliferation index in breast cancer. Fatty acids with significant positive correlations to Ki-67 (q < 0.05 after Benjamini–Hochberg correction) are grouped by class: ECFA, SFA, & OCFA, BCFA, and PUFA.
From a clinical-translational perspective, serum FAs profiling should complement, not compete with, established risk assessment methods. TNM stage, ER/PR/HER2 status, and Ki-67 are the main foundations for routine stratification. Multigene assays like the 21-gene recurrence score (Oncotype DX; Genomic Health, Inc., Redwood City, CA, USA) offer proven prognostic and predictive insights for certain early-stage HR-positive/HER2-negative groups.7,21 Serum FA composition, on the other hand, provides a broader metabolic view. If it can be consistently reproduced and validated, it may capture information not reflected in morphology, immunohistochemistry, or static gene-expression signatures. This includes details about lipid availability and inflammatory lipid signaling pathways related to ARA and eicosanoids. 22 Because serum sampling is minimally invasive, it allows for repeated collection. This feature could enhance ongoing phenotyping during diagnosis and treatment, unlike single-time-point tissue assessments. 13 This aspect is particularly important when tissue samples are scarce or when pathology results are inconsistent, such as with Ki-67, which can be influenced by various analytical factors. 23 It is crucial to note that this study was not designed to prove additional clinical benefit beyond Ki-67 or genomic assays. It did not include outcome-based modeling or patient-level factors affecting FAs metabolism. Therefore, any potential role of serum FAs profiling in clinical risk stratification should be seen as a starting point for future research. It needs further testing in larger studies to assess its predictive value compared to current standards.
Among the analyzed FAs, ARA was a common candidate linked to cell growth. In subgroup analyses, ARA showed slight increases in advanced disease features and increased proliferative activity, such as stage III, lymph node involvement, and high Ki-67. However, these findings were not significant after adjusting for multiple tests, so they should be viewed carefully. ARA is biosynthesized from linoleic acid (18:2n-6) 24 through phospholipase A2-mediated hydrolysis. 25 It is further metabolized through cyclooxygenase (COX), lipoxygenase (LOX), and cytochrome P450 pathways. 26 Previous studies showed that ARA can enhance BC cell migration through LOX-dependent processes 27 or via phosphoinositide 3-kinase/protein kinase B and epidermal growth factor receptor signaling. 28 In addition, ARA activates peroxisome proliferator-activated receptor alpha, potentially stimulating proliferation through nuclear receptor signaling. 29 These effects are tightly linked to COX2, encoded by prostaglandin-endoperoxide synthase 2 (PTGS2), whose expression rises in aggressive breast tumors and relates to inflammation-driven cancer. 30 Overall, these data offer a reasonable explanation for the link between proliferative activity and higher circulating ARA.
Several other FAs, including selected saturated, odd-chain, and branched-chain species, as well as DGLA and DPA, displayed a similar pattern. They showed nominal differences in categorical comparisons but clearer associations when linked to Ki-67 as a continuous variable. Notably, DPA, an n-3 PUFA, positively correlated with Ki-67 after BH-FDR correction. This is interesting, considering the anti-carcinogenic roles often assigned to n-3 PUFAs. For example, EPA promotes apoptosis and alters pro-survival proteins in BC cells. 31 This difference suggests that n-3 FAs may have context-dependent roles that vary by tumor type or stage. Certain metabolic or microenvironmental conditions might lead cancer cells to use specific n-3 PUFAs, like DPA, to support tumor growth. Changes in lipid metabolism in TNBC, for instance, could result in different uses of FAs for membrane synthesis, signaling, or energy, potentially offering a growth advantage. 32 Therefore, the role of DPA in aggressive BC subtypes deserves further exploration, especially regarding lipidomic changes, receptor pathways, and immune interactions.
We found that higher Ki-67 levels relate to modest increases across various FAs subclasses (including SFAs, OCFAs, BCFAs, and selected PUFAs). This pattern suggests systemic metabolic changes in fast-growing diseases. It also supports the idea that aggressive tumors may reprogram lipids to meet rapid growth and energy needs. This remodeling might be driven by increased levels of lipogenic enzymes 33 (e.g., fatty acid synthase (FASN), acetyl-CoA carboxylase, stearoyl-CoA desaturase 1) and transporters (e.g., CD36 (fatty acid translocase), FABP5 (fatty acid-binding protein 5)), known to be enriched in high-grade tumors, particularly TNBC.34,35 As lipid metabolism drives BC progression and offers potential treatment targets, 36 focusing on pathways like de novo lipogenesis (including FASN) is important, particularly for TNBC. 37
In addition, the rise in specific OCFAs and BCFAs could come from diet, branched-chain amino acid breakdown, or microbiota-derived precursors like propionate and isobutyrate.38,39 Analysis of elongation of very long-chain fatty acids protein 1 (ELOVL1) expression indicates that some very long-chain fatty acids may come from exogenous lipid uptake rather than de novo tumor synthesis. 40 This supports the idea of various host and environmental influences on circulating lipids. However, the correlations we investigated are only associative and do not prove causality. The observed links might also involve other factors related to Ki-67 and FA metabolism, such as subtype, stage, body fat, menopausal status, diet, medications, and inflammation. These factors were not fully modeled in this exploratory study.
Medications like statins, anti-inflammatory drugs, or treatments for metabolic disorders could affect circulating FA profiles, thereby acting as potential confounders. Although we lacked these data for our group, our previous work showed that statins did not significantly change SFA profiles in dialysis patients. 41 Other studies indicate more subtle or selective effects; for example, some statins might reduce the n-3/n-6 PUFA ratio in coronary artery disease patients. 42 In another study, only DHA and DGLA showed significant changes. 43 Moreover, statins may promote the conversion of LA to DGLA, a precursor of anti-inflammatory oxylipins. These findings highlight the need for future studies with detailed clinical and pharmacological data to clarify how these factors contribute to the relationship between FAs and proliferation.
Although the present study suggests associations between circulating FAs and BC phenotypes, several limitations should be acknowledged. The study had a cross-sectional, single-center design and lacked a validation cohort. Because no healthy control group was included, the present data cannot address the diagnostic utility or disease specificity of the observed patterns. Participants were consecutively recruited throughout the active study period; however, enrollment was restricted to treatment-naïve women with stage I–III disease and standardized pre-treatment fasting serum sampling, rather than representing all incident BC cases. Consequently, the overall sample size and several subgroups were modest and unequal, limiting statistical power and generalizability; therefore, the HER2-positive subgroup was not included in surrogate subtype comparisons, and all subgroup findings should be interpreted as hypothesis-generating. Multiple-testing correction attenuated categorical subgroup signals, indicating that nominal between-group differences should not be over-interpreted. Tissue-level lipid enzymes or downstream eicosanoid markers (e.g., PTGS2) were not assessed, precluding linkage of circulating FAs patterns to tumor-level pathway activity. Finally, a single Ki-67 cut-off was applied without sensitivity analyses. Despite these limitations, the observed pattern shows modest but coordinated links between proliferative activity and various FA subclasses, like ARA and DPA. This supports the idea that lipid metabolic changes accompany aggressive tumor biology. Interestingly, total serum FA concentrations were similar across all groups. This suggests that individual FAs are redistributed instead of total lipid amounts changing (Figure S1). These patterns align with known roles of lipid metabolism in membrane biosynthesis, cell growth, and inflammation. They also match earlier findings connecting ARA-derived eicosanoids to cancer development and microenvironmental changes. 44
Conclusion
In this exploratory cohort of treatment-naïve BC, serum FAs profiling showed modest links to tumor biology. The strongest signal was for proliferative activity (Ki-67) when analyzed continuously. The current data do not prove added clinical value beyond standard clinicopathologic and genomic assessments. Larger prospective studies with standardized pre-analytical procedures and clear multivariable models are needed to confirm these findings and assess their clinical relevance.
Supplemental Material
sj-docx-1-tam-10.1177_17588359261436624 – Supplemental material for Serum fatty acid profiles across clinicopathologic heterogeneity in breast cancer: an exploratory study
Supplemental material, sj-docx-1-tam-10.1177_17588359261436624 for Serum fatty acid profiles across clinicopathologic heterogeneity in breast cancer: an exploratory study by Patryk T. Mucha, Agata Jedrzejewska, Alicja Pakiet, Patrycja Jablonska, Jacek Zielinski, Weronika Szczecinska, Miroslawa Puskulluoglu, Adriana Mika, Ewa M. Slominska and Marta Tomczyk in Therapeutic Advances in Medical Oncology
Footnotes
References
Supplementary Material
Please find the following supplemental material available below.
For Open Access articles published under a Creative Commons License, all supplemental material carries the same license as the article it is associated with.
For non-Open Access articles published, all supplemental material carries a non-exclusive license, and permission requests for re-use of supplemental material or any part of supplemental material shall be sent directly to the copyright owner as specified in the copyright notice associated with the article.