
Abstract
Background:
Hematoxylin and eosin (H&E) staining is routine in pathology but lacks cellular specificity. Multiplex immunofluorescence (mIF) captures spatial immune relationships in tumors, but cost and complexity limit clinical application. Novel approaches to yield similar information from readily available tumor histology are needed.
Objectives:
Develop and validate a novel deep learning tool capable of translating standard H&E-stained histopathology images into high-fidelity synthetic mIF images that preserve immune cell information predictive of treatment response in breast cancer.
Design:
Comparative model evaluation and predictive modeling in a retrospective breast cancer cohort.
Methods:
Core-needle biopsies from 17 triple-negative breast cancer cases underwent mIF imaging. Hematoxylin and eosin and mIF images for DAPI (nuclei), pan-CK (tumor), CD3/CD4/CD8 (T-cells), and CD20 (B cells) were aligned. A pipeline outperforming standard Pix2Pix and CycleGAN image translation networks was developed, “multiplex Synthetic Immunofluoresence Generated through H&E Translation” (mSIGHT), which integrates a registration network to overcome misalignment between the input and target images. Generated images were evaluated with pixel-level metrics and biological metrics, including cell density and cell-to-cell adjacency. The pipeline was then applied to an external cohort to assess associations between predicted immune features and pathologic response to neoadjuvant chemotherapy.
Results:
Generated images preserved immune cell distributions and proximity metrics correlated to the ground truth cell counts. In a cohort of 218 breast cancer cases treated with neoadjuvant chemotherapy, predicted density of CD8+ T cells was significantly associated with complete response (adjusted odds ratio 1.89, 95% confidence interval 1.23–2.80, p = 0.002), independent of receptor status, grade, and pathologist TIL annotations.
Conclusion:
The mSIGHT pipeline enables translation of routine H&E slides into virtual mIF images with interpretable immune biomarkers, offering a scalable and affordable alternative to multiplex imaging. It also identifies immune features predictive of therapeutic response and has the potential to assist in the personalization of neoadjuvant therapy.
Keywords
Background
Hematoxylin and eosin (H&E) staining is a widely used technique in histopathology that allows pathologists to categorize types of tissues by providing contrast that highlights overall morphology and general cell types. H&E staining is a near-universal step in the routine analysis of pathology for cancer diagnosis and classification. However, the lack of specificity provided by H&E staining limits cell type identification to broad classes such as tumor cells, lymphocytes, and stromal cells. Multiple studies have found that in breast cancer, infiltration with CD8+ cytotoxic T cells is associated with both a better prognosis and improved response to neoadjuvant therapy.1 –3 Conversely, the impact of CD4+ T cells is variable and may depend on further stratification into helper and regulatory T-cell subsets, and the impact of B cells on outcome remains uncertain. 4 High CD73 expression is associated with reduced disease-free survival (DFS) and overall survival (OS) in triple-negative breast cancer. 5 However, beyond quantifying individual immune cells, the interaction between pairs of cells may improve the prediction of response 6 ; in particular, spatial analysis outperforms other biomarkers in the prediction of response to immunotherapy. 7 Ziblat et al. 8 showed that the number of CD8+T cells and Batf3+ DCs and their clustering are associated with anti-PD-1 (programmed cell death protein 1) efficacy in human metastatic melanoma. 8 Multiplex immunofluorescence (mIF) is one approach to simultaneously assess multiple markers to visualize cell composition and cell–cell interactions, which is crucial to the understanding of cancer immunology. 9 While mIF provides valuable biological insights, multiplex imaging requires advanced laboratory techniques, analysis, and equipment, and is more time-consuming and more expensive than traditional staining techniques such as H&E. Novel approaches for quantitative assessment of the tumor microenvironment are needed.
With advances in artificial intelligence (AI), generative adversarial networks 10 (GANs) have emerged as a promising solution for image-to-image translation tasks across a wide variety of applications, including in medicine. GANs are deep learning architectures consisting of two neural networks: a generator trained to create synthetic images and a discriminator trained to distinguish generated images from real images. GAN-based networks have been developed to create synthetic magnetic resonance images (MRIs),11,12 CT images from MRIs, 13 and retinal images and perform image augmentation.14,15 In digital staining of histological tissues, studies have successfully transformed images from one imaging domain to another, such as converting H&E stains into Ki-67 immunohistochemistry (IHC), 16 PHH3 IHC, 17 pan-cytokeratin (PanCK) immunofluorescence, 18 and mIHC. 19 A computational tool that translates from H&E to mIF images with reliable accuracy could provide a rapid and cost-efficient assessment of the tumor microenvironment to generate immune biomarkers for clinical application.
Various GAN-based architectures, most noticeably Pix2pix 20 and CycleGAN, 21 have been used to perform the transformation of images from one type of tissue stain to another. However, these methods have limitations, such as inconsistent translation accuracy and the potential distortion or loss of critical histological details present in ground truth images, which can limit their ability to accurately infer multiple immune markers simultaneously for clinical applicability. Specifically, Pix2Pix contains only one generator and discriminator module and requires the paired input and target images to have pixel-level alignment. However, mounting tissue for mIF can cause distortions that preclude precise tissue alignment. While CycleGAN does not require aligned images, it is only trained to generate images indistinguishable from real images—in other words, the generated image may appear realistic, but there is no incentivization to ensure the generated image accurately captures biologically relevant elements from a paired target image. In this study, we propose a novel tool for H&E to mIF image translation, multiplex synthetic immunofluorescence generated through H&E translation (mSIGHT), which incorporates a trainable registration network 22 to improve image alignment to overcome the deficiencies of prior image translation techniques. The performance of mSIGHT is compared to alternative image translation techniques in the task of generating multiplex images for a panel of six cell phenotype markers, and we evaluate the utility of immune cell subsets identified by this tool to predict response to neoadjuvant therapy in a cohort of breast cancer patients.
Methods
Data sources
Core-needle biopsies for multiplex immunofluorescence imaging were selected from a set of 19 triple-negative breast cancer patients who consented to additional tissue acquisition at the time of diagnostic biopsy, with samples collected between January 1st, 2016, and December 31st, 2018 (Supplemental Table 1). Two biopsies were excluded due to the inability to align with paired H&E images. This initial set of samples was used to train three separate stain translation models: Pix2Pix, CycleGAN, and our custom mSIGHT model (described in detail below). The predictive accuracy of immune cell subsets identified by the mSIGHT model was further assessed in a separate cohort of 218 cases from the University of Chicago, diagnosed from January 1st, 2006, through December 31st, 2021, and treated with neoadjuvant therapy where pre-treatment H&E pathology was available. Consent was obtained from all patients at the time of diagnosis, and this study was approved by the University of Chicago institutional review board (protocol 22-0707).
Data acquisition and image processing
To obtain paired H&E and mIF whole-slide images (WSIs), 19 core-needle biopsies were iteratively stained and imaged using a CaliberID Large Format RSG4 fluorescence confocal scanning microscope equipped with a panel of cell and contextual markers (Supplemental Table 2). Each staining cycle included the application of DAPI imaged at 405 nm, accompanied by three distinct antibody markers imaged at 488, 561, and 640 nm. Following each cycle, the coverslip was removed from the microscope, and antibodies were stripped off the tissue with a solution comprising SDS, Tris-HCl, and beta-mercaptoethanol, heated to 56°C. Subsequently, the tissue was re-blocked and probed with both primary and secondary antibodies before re-imaging. Full-section images were captured at 63× magnification, yielding a pixel size of 221 nm. Full-section composites of each channel were constructed by stitching together image strips across the channel using a cross-correlation-based algorithm. All channel composites were aligned by employing the DAPI channel from each imaging cycle as a reference using a similar cross-correlation algorithm.
Alignment of H&E and multiplex images
For each section on the DAPI or CK channel mIF slide, the corresponding location on the paired H&E slide was identified. Each pair of H&E and multiplex image sections was roughly aligned/registered by Valis, 23 a fully automated software application designed to align both brightfield and fluorescent WSIs. Valis processes the input slides by downsampling WSIs at a pyramid level that provides the highest resolution while staying within the specified maximum image dimensions, identifying outlines of the tissues on the downsampled images to create masks, and normalizing the images. Rigid registration, including scaling, shifting, and rotation, was then performed on the processed images, followed by a non-rigid registration that introduces local deformation of structures. The resulting registered slide sections were then tiled at 10× optical magnification into 512 × 512 pixel tiles, each representing a 502 × 502 μm field of view using the Slideflow pipeline. 24
Model training and image generation
The training data were augmented using a stride width smaller than the tile width when extracting paired image tiles, allowing for overlapping tiles, and by applying random flipping and affine transformations, such as scaling, rotation, translation, and shearing during training. Image pixel values were normalized between −1 and 1 before being input into the models. We trained models with three different architectures: Pix2Pix, 20 CycleGAN, 21 and mSIGHT—modified from the RegGAN architecture. 22 All three architectures share the same conditional GAN module architecture that generates mIF images and the same discriminator architecture that learns to distinguish between real targets and generated images. Pix2Pix requires perfect alignment between the input and target images. CycleGAN is designed for image-to-image translation, with a cycle consistency loss to ensure that translated images can be translated back to their original form. mSIGHT has an additional registration network structure that directly models the misalignment between the generated image and the target image (Supplemental Figure 1).
The following Generator and Discriminator architectures remain unchanged from the RegGAN architecture. The GAN module adopts a symmetric encoder–decoder design augmented with nine residual blocks. It begins with a 7 × 7 convolutional layer followed by two downsampling blocks. The core transformation is handled by nine residual blocks, each composed of two 3 × 3 convolutional layers flanked with reflection padding, instance normalization, and ReLU activation. Upsampling is achieved via two transposed convolution layers with a stride of 2 and 3 × 3 kernels. The generator concludes with a 7 × 7 convolution mapped to the output channel space and a Tanh activation. The discriminator includes four convolutional blocks, each with normalization and LeakyReLU activations, followed by a final classification layer.
Six channels (CD20, CD3, CD4, CD8, DAPI, and CK) were selected to form six-channel image targets for training generative networks to identify the most common cell types present in images (tumor, B cells, and cytotoxic/helper T cells). Apart from changing the targets from one channel to six channels, we also modified the loss calculations to accommodate differences in sparsity across the six channels by adding different weights for the channels and limiting the registration network loss to the channel with the highest density. The generator loss (


All models were trained for 35 epochs, with a batch size of 8, a learning rate of 0.0001, and a lambda of 20. No visual improvements were observed after around 35 epochs of training. The authors of RegGAN used a batch size of 1 and stated that an increased batch size led to decreased performance with no apparent reasons. We chose a larger batch size primarily to parallelize computation and improve training speed.
Cell segmentation and classification
Cells on the ground truth mIF images were segmented from DAPI using the pretrained nuclei model in Cellpose2.0,25,26 and then expanded to reach a diameter = 10 microns based on the typical cell diameter. Cells in the real mIF images from the training dataset were classified by a hierarchical clustering algorithm, which initialized each data point as its own cluster and iteratively merged the closest clusters based on distances between clusters. Inputs to the clustering algorithm include the z-score normalized average cell pixel intensity across the entire expanded cell area and the standard deviation of pixel values within the cell region. Each cluster was assigned a cell classification (tumor, CD4+ T, CD8+ T, and CD20+ B) based on the expression of tumor (CK) and immune (CD3, CD4, CD8, CD20) markers. The resulting ground truth mIF image cell classifications from clustering were used to determine cell classifications on the generated mIF images. A Random Forest classifier with 100 estimators and Gini impurity as a measurement of the quality of a split using the same features as the clustering algorithm. The random forest classifier was then used to classify cells on the images in the validation dataset. We used cell density, defined as the total number of cells in each category per tile image, to quantitatively compare the relative distributions of cells in real and generated images. We were unable to evaluate cell classification results at a single-cell level because we did not have ground truth cell labels on the real mIF images or the location correspondence between cells on the real and generated mIF images. To measure cell-to-cell adjacency, we calculated the number of cells from class A with at least one cell from class B present within 20 microns on a tile, denoted by A:B, for each pair of cell categories (A, B). Note that A:B and B:A are not interchangeable due to variations in the number, distribution, and clustering tendencies of each cell type. For example, if 1 A cell and 10 B cells are all located within 20 microns of each other, A:B would be 1, and B:A would be 10.
Predictive accuracy for response to neoadjuvant therapy
We generated mIF images using the mSIGHT model from the neoadjuvant cohort (an external set of cases with response data available), then classified cells and calculated density and adjacency metrics using procedures identical to the training and internal validation process. Logistic regression models were used to assess the association of immune cell density or adjacency metrics with pathologic complete response (pCR) status. For each model, we calculated odds ratios to assess the strength and direction of the relationship between each variable and the outcome. Grade, tumor size, age, TIL percentage (as assessed by International TIL Working Group criteria 4 ), and estrogen/progesterone/HER2 receptor status were included in all adjusted models. Due to the significant correlation and interdependence between adjacency metrics—from cell category A to B and vice versa—we fitted separate logistic regression models for each directional adjacency metric—although all models were adjusted for clinicopathologic parameters.
Statistical analysis
Our validation cohort consisted of 160 image tiles, for which the correlation coefficient for real versus generated metrics was calculated. Per Fischer’s transformation, this allowed for the detection of a correlation between true versus predicted immune cell metrics of 0.22 or higher, with a power of 80% and alpha = 0.05. Thus, we selected this breakdown of training/validation cases to maximize the data available for training while still detecting reasonable correlates of immune cell metrics. Pixel-level mean squared error (MSE) quantifies model performance by calculating the average squared difference between pixels in real and generated images, with lower MSE indicating greater pixel-level similarity. MSE was calculated between pairs of ground truth and generated images for each trained model to quantify model performance on generation in the held-out validation dataset. Deep image structure and texture similarity (DISTS) was also compared between models, which measures the spatial and structural similarities between images by summing a texture term that compares the spatial averages of feature maps and a structure term that directly compares the feature maps, considering both low-level and high-level features. 27 Accordingly, lower DISTS indicates that the generated image is perceptually more similar to the real image. Furthermore, Fréchet inception distance (FID), which quantifies the similarity between real and generated images by calculating the distance between two distributions of images in the feature space of a pretrained Inception V3 model, was compared between ground truth and generated images in the validation set. 28 Thus, a lower FID indicates that the generated images have a greater resemblance to real images. A t-test was used to compare mSIGHT with CycleGAN and Pix2Pix for MSE and DISTS metrics—as FID is a dataset-level metric rather than a sample metric, such a comparison could not be performed for FID. After cell segmentation and classification, the correlation between the density of immune cell subsets and spatial proximity metrics in the generated versus ground truth images was computed using Spearman’s rho. In addition, the area under the receiver operating characteristic curve (AUROC) was calculated for each cell density or proximity metric to assess the extent to which the generated images replicated the cell density and local neighborhoods of the ground truth images. For AUROC calculations, image tiles within the top tertile are labeled as “high” density/proximity for each metric in the ground truth images, and the AUROC was calculated using the numerical cell densities from the predicted images. Finally, the accuracy in the prediction of pCR was assessed via adjusted odds ratios (aOR), which showed significance for individual associations assessed with Wald’s test. All statistical tests were two-sided, with a significance threshold of alpha = 0.05. We performed all data analyses using Python, version 3.9.12 (Python Software Foundation).
The reporting of this study conforms to the TRIPOD AI guideline 29 for prediction models utilizing machine learning approaches (see Supplemental File).
Results
Accurate multiplex immunofluorescence images generated from hematoxylin and eosin histology
Registered pairs of H&E and mIF WSIs were obtained from the biopsies of 17 triple-negative breast cancer (TNBC) cases (Supplemental Table 1), with two of the biopsies held out for validation. We trained models to reconstruct mIF images using data from fifteen patients (418 paired image tiles, representing approximately 75% of all image tiles) and held out data from two patients (160 tiles) for validation. Upon visual inspection of the generated images and cell classification results from each model, we found that mSIGHT generated the highest quality images that accurately captured the textural characteristics of the H&E images with cells clearly separated from background tissues (Figure 1(a), Supplemental Figures 2–7). In comparison, CycleGAN generated images with far less difference in intensity between cells and background tissues, which made it challenging to perform cell classification or to visually identify relevant features on the generated images. As expected, Pix2Pix generated poorly defined images with indistinct cell boundaries, due to the lack of pixel-level alignment in the training data.
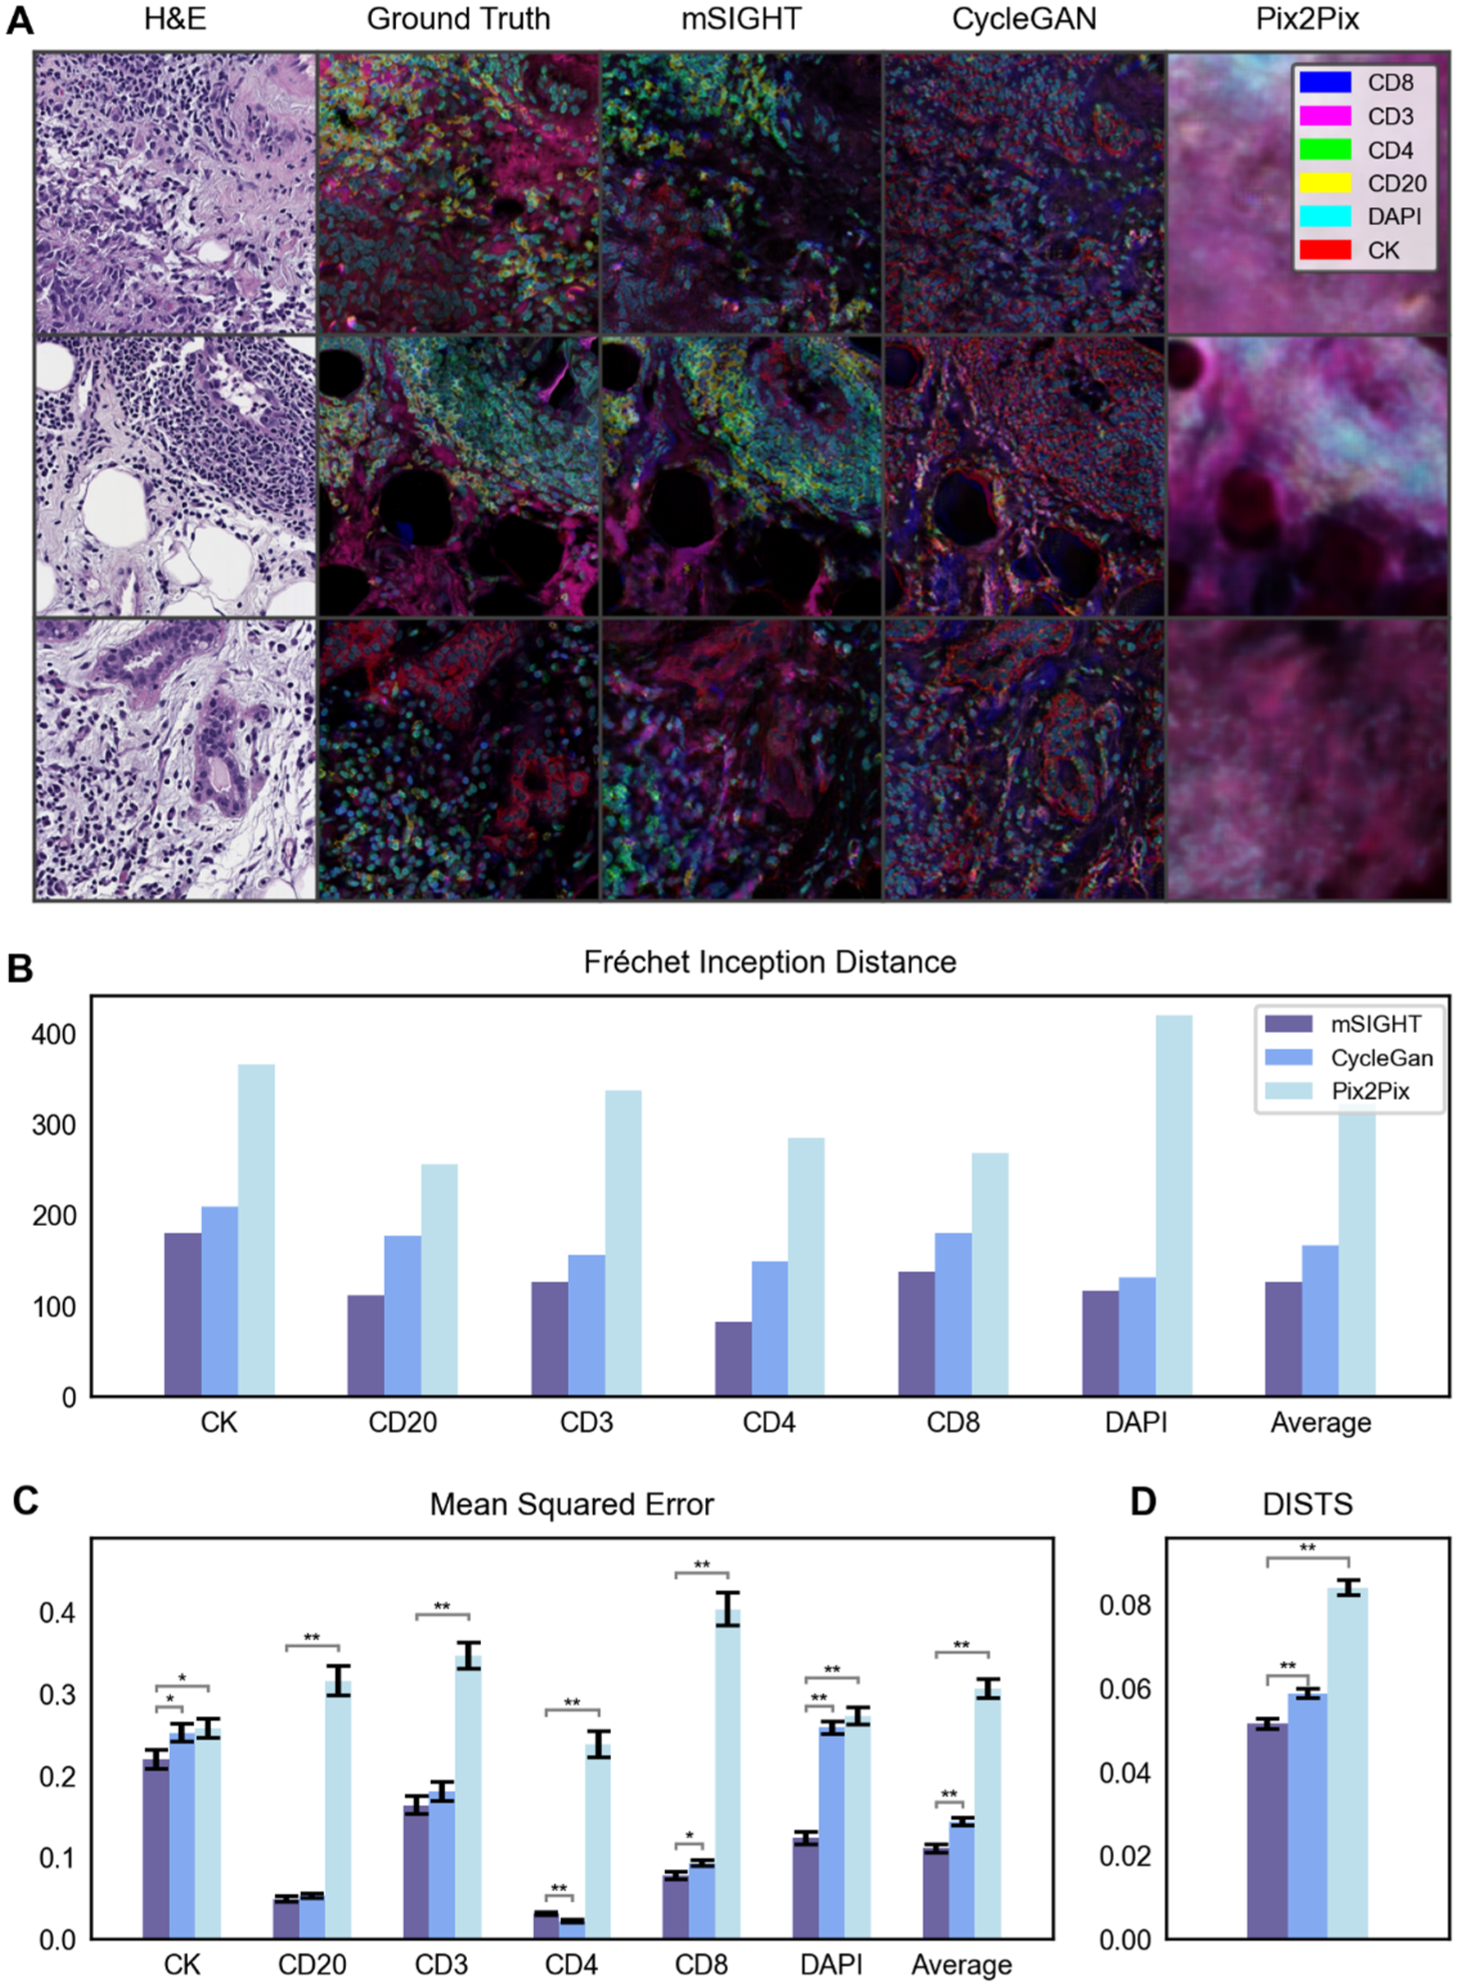
Comparison of generated multiplex images across models. (a). Three tiles selected from the validation dataset demonstrate differences in multiplex image reconstruction with mSIGHT and two comparator models. Multiplex images are visualized as a composite image using five colors to represent the five immune and tumor markers evaluated in this study. Accuracy of the three generative models was assessed in the held-out validation cohort of n = 160 image pairs using the Fréchet Inception Distance (b), pixel-level mean squared error (c), and the DISTS metric (d). mSIGHT errors are consistently lower than CycleGAN and Pix2Pix, especially in the DAPI channel, where losses are generally higher due to high expressions on the ground truth images.
We evaluated the performance of mSIGHT in generating mIF images from H&E images and compared it to Pix2Pix and CycleGAN, using established metrics to assess the fidelity of generated images. We compared the pixel-level mean-squared error (MSE) between the ground truth (i.e., the stained mIF images) and generated images in the validation set for each model. mSIGHT performed better across all image channels but CD4, with the greatest performance improvement over CycleGAN observed in DAPI (MSE 0.12, 95% CI 0.11–0.14 vs CycleGAN MSE 0.26, 95% CI 0.24–0.27, p < 0.001 and Pix2Pix MSE 0.27, 95% CI 0.25–0.29, p < 0.001) and CD8 channels (MSE 0.08, 95% CI 0.07–0.09, vs CycleGAN MSE 0.09, 95% CI 0.09–0.10, p = 0.01; MSE 0.40, 95% CI 0.36–0.44, p < 0.001, Figure 1(b) and (c), Supplemental Table 3). Losses for DAPI and CK channels were generally higher for all models due to high expression in the original images. Deep Image Structure and Texture Similarity (DISTS) loss similarly showed statistically superior performance of mSIGHT (0.051, 95% CI 0.049–0.054, vs CycleGAN 0.059, 95% CI 0.056–0.061, p = 0.02, and versus Pix2Pix 0.084, 95% CI 0.081–0.087, p < 0.001). Fréchet inception distance (FID) between ground truth images and generated images in the validation cohort also demonstrated improvement in mSIGHT (FID 125.72) over CycleGAN (FID 166.97) and Pix2Pix (FID 321.96).
Consistency of cell classification from pairs of ground truth and generated multiplex images
After cell segmentation and classifying cells into tumor and immune cell subsets, we found that distinct clusters of cells were correctly identified, including lymphoid structures comprised of CD20+ B cells and CD4+ T cells, as well as accurate localization of CK on tumor cell components (Figure 2(a)). We observed similar patterns in the average pixel intensity and the total number of cells for each classified category of cells between GAN-generated images and the validation images (Figure 2(b) and (c)). T-distributed Stochastic Neighbor Embedding (t-SNE) was applied to both sets of images to visualize groupings of cells based on expression, demonstrating similar clustering of the cell subsets in ground truth and generated images in the validation cohort, with differences in the overlaps between cell populations (Figure 2(d) and (e)). Tumor cells had the highest cell counts, followed by CD4+ T cells, CD20+ B cells, and CD8+ T cells (Figure 3(a)).
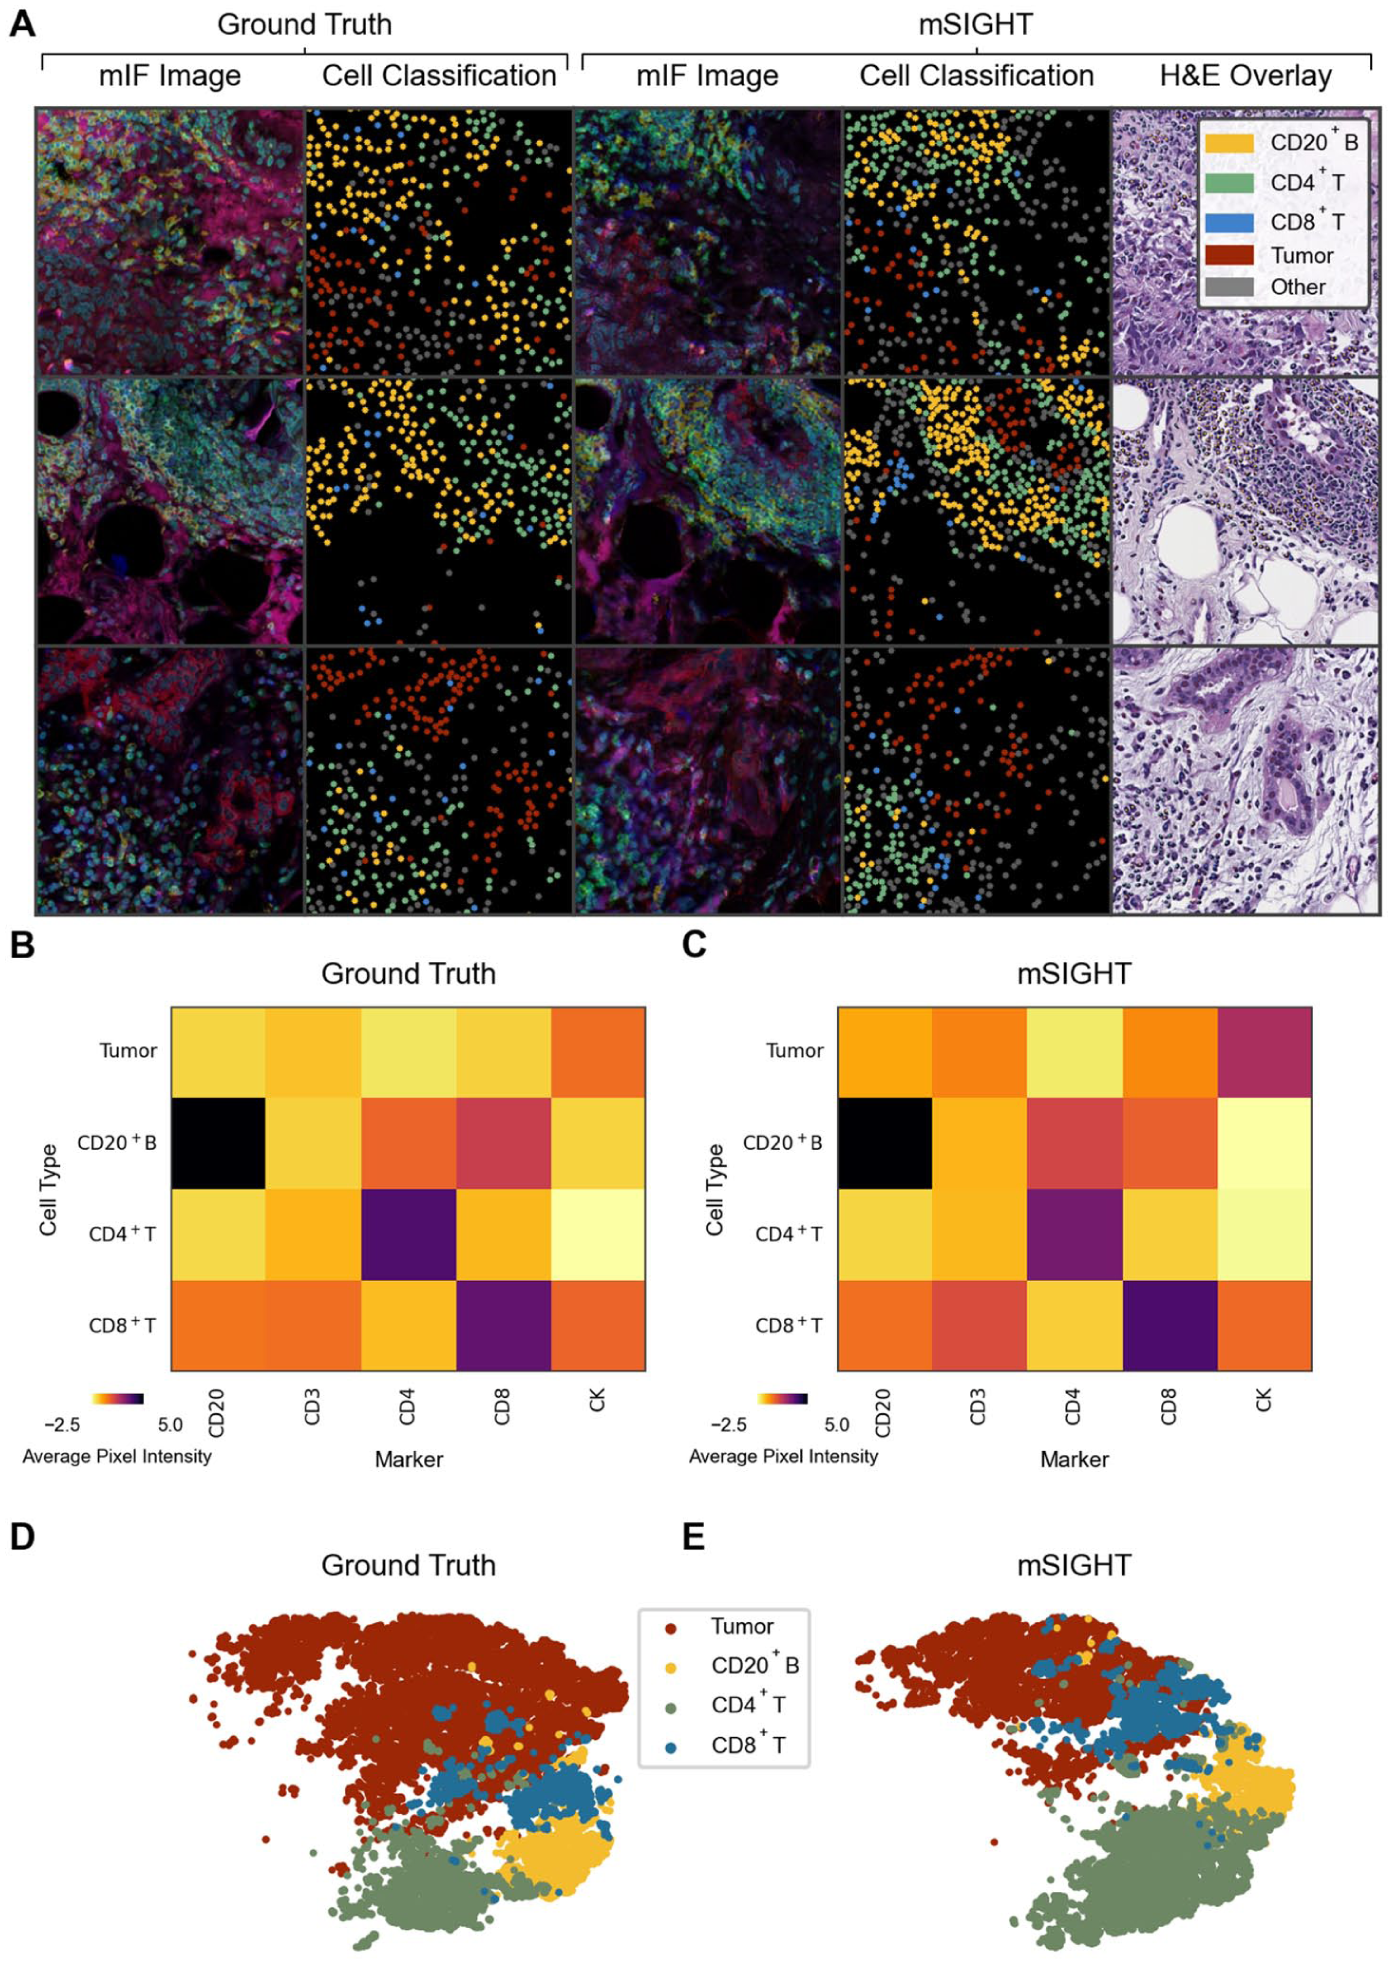
Comparison of Cell Classification from Ground Truth Multiplex Immunofluorescence and Generated Image Tiles. (a). The distribution and classification of tumor and immune cells are illustrated for both the ground truth mIF image tiles and images generated from paired H&E in the held-out validation cohort. Subtle misalignment is visible in several tiles. The predominant cell types and their distributions are similar between the ground truth and generated images. Overlay of the generated cell types is consistent with the general appearance of cells on H&E images (i.e., tumor cells are labeled as tumor, lymphocytes labeled as one of the lymphocyte subsets). (b and c) Illustrated is the heatmap of the z-score normalized mean pixel intensity of each marker versus the assigned cell label across all cells identified in images from the validation cohort of n = 160 image pairs, demonstrating expression of markers is consistent with expected expression for both ground truth annotations (b) and predictions from generated images (c). (d and e). A t-distributed stochastic neighbor embedding was computed from vectors of mean pixel intensity and standard deviation of pixel intensity across all identified cells in validation images and visualized to illustrate the distribution of cells within each class, demonstrating grossly similar distributions from ground truth annotations (d) and predictions from generated images (e).

Accuracy of cell density and spatial proximity metrics computed from generated images. (a). Spearman correlation and AUROC scores, computed for cell densities and spatial proximity metrics for each pair of image tiles. For the computation of AUROC, image sets within the top tertile of each metric are labeled as “high” density/spatial proximity for the given metric. (b). A clustered correlation matrix between each cell density and spatial proximity metric illustrated that several distinct/non-correlated cell classifications are produced from the generated images. a:b indicates a spatial proximity metric defined by the number of cells of type a with at least one cell of type b located within 20 microns.
mSIGHT-generated images accurately predicted image tiles with high densities of tumor (AUROC 0.78, 95% CI 0.70–0.86), CD4+ T-cells (AUROC 0.77, 95% CI 0.69–0.85), CD20+ B-cells (AUROC 0.65, 95% CI 0.54–0.75), and CD8+ T-cells (AUROC 0.61, 95% CI 0.51–0.71, Figure 3(a), Supplemental Table 4). We also found a moderate to weak correlation between cell densities in the GAN-generated multiplex images and ground truth validation images for tumor cells (Spearman ρ = 0.52, 95% CI 0.39–0.62), CD4+ T cells (Spearman ρ = 0.49, 95% CI 0.37–0.60), CD20+ B-cells (Spearman ρ = 0.28, 95% CI 0.13–0.42) and CD8+ T cells (Spearman ρ = 0.20, 95% CI 0.05–0.35). Cell–cell adjacency metrics were also significantly correlated—in particular, CD4+ T cell:tumor (Spearman ρ = 0.45, 95% CI 0.32–0.57) and tumor:CD8+ T cell (Spearman ρ = 0.41, 95% CI 0.27–0.54) were accurately captured by the model. Of note, metrics involving tumor cells and CD8+ T cells were moderately correlated between ground truth and generated images, as well as metrics involving CD4+ T cells and CD20+ B cells, perhaps due to the colocalization of these cell types (Figure 3(b)). CD4+ and CD8+ T cells are not correlated, suggesting that assignment of individual lymphocytes is unique in different tumor regions—as if assignment to immune cell subsets was random, we would expect equal predicted density of all lymphocyte subsets in any lymphocyte-rich region.
Immune cell metrics generated from standard H&E pathology predict response to therapy
We evaluated model performance on 753 H&E-stained tissue slides of breast core-needle biopsies from a retrospective cohort of 218 cases treated with neoadjuvant chemotherapy with digital pathology available (Supplemental Table 1). Although mSIGHT was developed on TNBC breast cancer cases, given the association of TILs and response across all breast cancer subtypes, we did not restrict this analysis to TNBC.30,31 Patients predominantly received taxane + anthracycline-based chemotherapy, with HER2-targeted treatments administered for cases of HER2+ disease (Supplemental Table 5). Although immunotherapy receipt was not an exclusion criterion for selection of this cohort, only two patients in this cohort received immunotherapy, so this assessment predominantly reflects associations of immune cell metrics with chemotherapy response. Image generation, cell classification, and metric calculation processes were identical to the internal validation process. Of note, there was a high degree of correlation between predictions of immune cell density from each slide with the mean immune cell density from other slides from the same patient—with Pearson correlation coefficients ranging from 0.66 for predicted CD8+ T-cell density to 0.71 for CD20+ B-cell density. We first examined tiles with the highest predicted density of CD20+ B-cells, CD4+ T cells, and CD8+ T cells, revealing distinct morphologic features associated with each lymphocyte subtype (Figure 4(a)). B cells were found in isolated lymphoid aggregates, CD4+ T cells were located in peritumoral aggregates, and CD8+ T cells were more often interspersed within tumors.

Generated immune cell subsets predict response to neoadjuvant therapy. (a). From the entire neoadjuvant cohort, the image tiles with the highest density of each of the cell types were selected and illustrated. The real H&E tile with the predicted immunofluorescence composite image is shown. Each immune cell subset demonstrates a unique pattern—with predicted CD20+ B cells present in high density in isolated clusters, CD4+ T cells forming clusters adjacent to tumor cells, and CD8+ T cells interspersed throughout tumors. (b). Adjusted odds ratios for pCR for each cell density metric demonstrate that CD8+ T cells are independently predictive of pCR. (c). Adjusted odds ratios from logistic regressions incorporating spatial proximity metrics demonstrate that tumor cell:CD8+ T-cell proximity (representing the number of tumor cells with a CD8+ T cell present within 20 microns) is negatively associated with pCR. Of note, odds ratios displayed for spatial metrics were estimated separately for interactions with each cell subset—that is, tumor:CD20+ B cells and CD20+ B cells:tumor were estimated in separate models given the high correlation between these bi-directional interactions. Grade and hormone receptor status were included in all models. (d). pCR rate as predicted density of CD8+ T cell, CD4+ T cells, CD20+ B cells, and TILs increases.
We then identified the association of immune cell subsets with demographic and clinical features in univariable models (Supplemental Table 6). On a slide level, predicted high CD8+ T-cell density was associated with triple-negative receptor status (OR 1.26, 95% CI 1.02–1.54) and high grade (OR 1.25; 95% CI 1.02–1.54). Predicted high CD4+ T-cell density was associated with ER-positive disease (OR 1.20, 95% CI 1.03–1.39) and white race (OR 1.30, 95% CI 1.12–1.51), and predicted low CD4+ T-cell density was associated with black race (OR 0.79, 95% CI 0.68–0.92). However, most associations were not significant on a patient level, aside from the association of predicted CD8+ T-cell density with pCR status.
On multivariable models, we found the patient-level predicted density of CD8+ T cells (aOR 1.89, 95% CI 1.23–2.80, p = 0.002) was associated with pCR to neoadjuvant therapy after adjusting for other immune cell density, age, grade, tumor size, pathologist TIL annotations, and receptor status (Figure 4(b), Supplemental Table 7). This is consistent with previous studies and suggests that subtyping of immune cells beyond standard TIL quantification can improve response prediction.2,32 –34 In addition, predicted spatial proximity of CD20+ B cells to CD8+ T cells was the strongest individual predictor of response (aOR 2.76, 95% CI 1.09–6.98, p = 0.032; Figure 4(c)), suggesting that reconstruction of spatial proximity of multiple immune cell subtypes can improve response prediction over prediction of single cell types. Increasing predicted CD8+ T-cell density was associated with increasing response rates (Figure 4(d)), ranging from 23.8% in cases with the lowest decile of CD8+ T-cell density, to 63.6% in cases in the top 5%.
Discussion
This study demonstrates that a novel artificial intelligence approach can generate multiplex immunofluorescence images that accurately identify tumor cells and lymphocyte subtypes. Recent advances in DL have been applied to enable virtual staining techniques, which have been applied to various stain translation tasks. However, these have generally focused on the production of a single-stained image. Several studies have successfully generated digitally stained histology from images of unstained samples, including H&E, Jones stain, and Masson’s trichrome (MT).35,36 Similarly, studies have performed stain-to-stain translation to convert H&E images to MT, periodic acid-Schiff and Jones silver stain, 37 and H&E to IHC for single markers.16,17,38 For example, Burlingame et al. utilized a Pix2Pix approach to translate from H&E to DAPI, panCK, or α-smooth muscle actin at 10× and 20× magnification. 18 Although these approaches could be used to generate serial images for each marker, they are not optimized to leverage multiple stain types to identify elements of the immune microenvironment accurately and do not scale well to comprehensive multiplex panels needed for accurate tumor microenvironment profiling. Ghahremani et al. developed DeepLIIF to merge multiple IHC stains into a single multiplex image, but this approach still requires costly primary antibodies and abundant tissue. 39
In this work, we trained a single model to generate multiple mIF markers from H&E and used a wider range of quantified immune features on translated stains than previously reported methods. We demonstrated that this approach can be rapidly applied to readily available H&E images to predict response to therapy. Training a DL model to generate realistic and meaningful multiplex images is particularly challenging because of the biologically complex nature of tissue samples. There is a drastic difference in structure between the general morphology captured by H&E staining and individual tissue components highlighted in mIF images. From a computational perspective, training a DL model to accurately infer multiple markers simultaneously inherently requires more time and training data. Training a GAN-based model to translate from one image to another can be supervised or unsupervised. A supervised model requires perfectly aligned inputs and targets, whereas an unsupervised approach relies on the model architecture to navigate the spatial differences between input and target domains. Since acquiring completely aligned pairs of WSIs was impossible for our data, we introduced a WSI registration step before training and selected a DL model with a registration component to handle minor misalignment on tile images. Registration of WSIs is challenging due to the size of the images and the limitations of traditional alignment algorithms.40,41 A DL model such as mSIGHT could mitigate slight misalignment without requiring a complex registration process. However, perfectly registered H&E and mIF WSIs might simplify this framework, improve overall model performance, or allow explorations of alternative GAN architectures.
The composition and interactions of immune cells shown on multiplex images provide crucial information for predicting reaction to treatment, 6 recurrence, and overall survival42,43 in breast cancer. In our study of over 300 patients receiving neoadjuvant therapy, we observed that the density of predicted CD8+ T cells was independently associated with a favorable response to neoadjuvant therapy. This aligns with findings from Seo et al., who reported that CD8+ tumor-infiltrating lymphocytes were independently predictive for response in a cohort of 153 pre-treatment breast cancer cases, after adjusting for CD4+ and FOXP3+ T-cell density. 2 These observations have been corroborated across multiple studies.32 –34 Prior studies have reported variable roles of CD4+ T cells and B cells in response to therapy,44 –46 with some finding positive and some demonstrating negative associations. Certain B-cell subsets can produce immunosuppressive cytokines or facilitate the recruitment of regulatory T cells (Tregs), dampening the anti-tumor immune response. This interaction could potentially shield the tumor from immune attack, thereby promoting resistance to therapy. Of note, the spatial orientation and proximity of lymphocyte subtypes might influence therapeutic outcomes—in our dataset, predicted CD4+:CD8+ T-cell proximity was associated with response, whereas CD4+:CD20+ cell proximity was associated with resistance. Other studies have demonstrated that co-infiltration of CD4+ and CD8+ T cells might synergistically respond to therapy. 47 The CD4+ T cells near CD8+ T cells may represent Th1 type T cells that facilitate CD8+ T cell expansion, which can be associated with a good prognosis. 48 Thus, the role of other or more specific immune cell subtypes in mediating response is likely heavily dependent on spatial proximity and specific cell–cell interactions—and multiplex immunofluorescence and spatial analysis techniques may be necessary to identify these associations. Our computational tool leverages this capability to rapidly predict spatial immune biomarkers from standard H&E images, facilitating their use in clinical settings. Although a number of tools leverage H&E histology to predict response to therapy or recurrence, these approaches mainly rely on either non-specific quantification of lymphocytes49,50 or less interpretable weakly supervised approaches.51,52 Conversely, mSIGHT can provide additional biologic insight into the immune composition of tumors, which can be leveraged for outcome prediction. The use of mIF images as an intermediate step between H&E imaging and clinical prediction tasks offers justifiable advantages. While H&E images provide valuable morphological information, they lack the molecular and cellular specificity necessary for capturing the tumor microenvironment’s complexity, such as immune cell spatial interactions. In addition, the immune cell subsets identified by this tool remain independently predictive of response in our multivariate analysis incorporating TILs, suggesting that precise quantification of immune cells can improve prediction of response. Although our neoadjuvant cohort lacked matched multiplex immunofluorescence, the biological consistency of our findings with prior results validates the utility of our approach in accurately classifying immune cells directly from H&E histology. This approach may be particularly relevant in low-resource settings where even single-stain IHC can be cost-prohibitive. The cost for a single IHC stain incorporating reagents and technician time can exceed $100 per test, 53 whereas the digital assay we present here is open source and thus freely available, and can be run on a wide range of desktop computers, or on cloud servers such as Amazon Web Services for under $1 per hour.
However, our study has limitations. Our training data come from a small cohort of patients, which might not fully represent the morphologic features of immune cells in a larger breast cancer population. The quantitative analysis of the multiplex immunofluorescence images in this study was limited by the quality of images, which, in some cases, were affected by shine-through and other artifacts. The predictive accuracy for some immune cell subsets was weak, which may be attributed to the imperfect alignment between paired H&E and mIF images, leading to discrepancies in cell subset locations on the mIF image tiles and limiting their reliability as a definitive “ground truth” for assessment of the generated images. Since we did not assess the subtypes or cell states of CD4+ T cells and B cells, functional heterogeneity within these populations may have been overlooked, which might obscure specific cellular roles or associations that could influence therapeutic responses. Future investigations involving these subtypes and their dynamic states would be essential to a more nuanced understanding of their contributions to therapy outcomes. We also selected only a subset of six markers that were represented with enough frequency in our cohort to adequately confirm the accuracy of our generative model in this cohort—and thus the ability of this approach to identify less common, yet potentially influential, immune and non-immune cell populations within the tumor needs to be assessed in future studies. In this study, only pathologic assessment of response was performed as patients did not uniformly undergo imaging to clearly define partial response versus stable disease—and as only three patients in the neoadjuvant cohort experienced clinical progression, we were unable to test associations of predicted immune metrics with progression. Since the cohort for response assessment did not have paired mIF images available, we could not directly evaluate the pixel-level accuracy of the generated mIF images in this cohort. We also were unable to compare the predictive accuracy of our generated CD8+ T-cell density to true immune cell densities from mIF or IHC, as these tests are not routinely performed as standard of care. Despite this limitation, the associations of detected immune cell subsets with response are consistent with prior studies, and the distribution of immune cells (i.e., B cells in lymphoid aggregates) is also biologically consistent.
Conclusion
mSIGHT can generate realistic multiplex immunofluorescence images from standard H&E pathology images, from which we can identify immune cell subsets and cell–cell proximity metrics that are associated with response to therapy. We focused our analyses of the breast cancer tumor microenvironment on three lymphocyte subtypes. Further validation of this approach with extended panels of immune and tumor markers and on larger datasets is planned.
Supplemental Material
sj-docx-1-tam-10.1177_17588359251379411 – Supplemental material for Virtual multiplex immunofluorescence identifies lymphocyte subsets predictive of response to neoadjuvant therapy
Supplemental material, sj-docx-1-tam-10.1177_17588359251379411 for Virtual multiplex immunofluorescence identifies lymphocyte subsets predictive of response to neoadjuvant therapy by Anran Li, Madeleine Torcasso, Anna Woodard, Hanna Hieromnimon, Jonathan Trujillo, Long Nguyen, Margarite Matossian, James Dolezal, Rebecca Abraham, Marcus R. Clark, Galina Khramtsova, Yuanyuan Zha, Maryellen L. Giger, Alexander T. Pearson and Frederick M. Howard in Therapeutic Advances in Medical Oncology
Supplemental Material
sj-docx-2-tam-10.1177_17588359251379411 – Supplemental material for Virtual multiplex immunofluorescence identifies lymphocyte subsets predictive of response to neoadjuvant therapy
Supplemental material, sj-docx-2-tam-10.1177_17588359251379411 for Virtual multiplex immunofluorescence identifies lymphocyte subsets predictive of response to neoadjuvant therapy by Anran Li, Madeleine Torcasso, Anna Woodard, Hanna Hieromnimon, Jonathan Trujillo, Long Nguyen, Margarite Matossian, James Dolezal, Rebecca Abraham, Marcus R. Clark, Galina Khramtsova, Yuanyuan Zha, Maryellen L. Giger, Alexander T. Pearson and Frederick M. Howard in Therapeutic Advances in Medical Oncology
Footnotes
References
Supplementary Material
Please find the following supplemental material available below.
For Open Access articles published under a Creative Commons License, all supplemental material carries the same license as the article it is associated with.
For non-Open Access articles published, all supplemental material carries a non-exclusive license, and permission requests for re-use of supplemental material or any part of supplemental material shall be sent directly to the copyright owner as specified in the copyright notice associated with the article.