
Abstract
Background:
Gastric cancer is a leading cause of cancer-related mortality worldwide, and HER2-positive gastric or gastroesophageal junction (G/GEJ) adenocarcinoma constitutes an aggressive molecular subtype. The KEYNOTE-811 phase III trial demonstrated improved clinical outcomes with combination therapy of pembrolizumab, trastuzumab, and chemotherapy (PTC) compared to trastuzumab and chemotherapy alone (TC), but the economic value of this regimen remains uncertain.
Objective:
To assess the cost-effectiveness of the PTC regimen versus TC for unresectable metastatic HER2-positive G/GEJ adenocarcinoma in the United States, stratified by PD-L1 combined positive score (CPS), and to evaluate the economic impact of real-world sequential treatment strategies.
Design:
A model-based pharmacoeconomic evaluation.
Method:
A 10-year semi-Markov model was developed using data from the KEYNOTE-811 trial to estimate disease progression, costs, quality-adjusted life years (QALYs), and incremental cost-effectiveness ratios (ICERs). Additionally, a 21-day cycle micro-simulation model was constructed to evaluate sequential treatment pathways involving first-line PTC or TC, followed by trastuzumab deruxtecan or ramucirumab plus paclitaxel, and third-line paclitaxel monotherapy or best supportive care. One-way and probabilistic sensitivity analyses were conducted to test model robustness.
Results:
For patients with PD-L1 CPS ⩾1, the PTC regimen provided an additional 0.33 QALY at an incremental cost of $247,474.27 compared to TC, resulting in an ICER of $750,750.50 per QALY—well above the U.S. willingness-to-pay threshold of $150,000/QALY. In CPS < 1 and overall populations, ICERs were −$377,258.54 and $957,550.19 per QALY, respectively. In sequential treatment analyses, the TC-based sequences were more cost-effective than PTC-based sequences, with the ICERs of PTC-based regimens exceeding $745063.32 per QALY. Sensitivity analyses confirmed the robustness of these findings.
Conclusion:
From a U.S. payer perspective, PTC is not cost-effective for HER2-positive metastatic G/GEJ adenocarcinoma at current prices, regardless of PD-L1 CPS status or treatment sequence. Price reduction strategies and biomarker-driven therapy selection are warranted to improve economic value.
Plain language summary
Stomach cancer is a major global health concern. One aggressive form is HER2-positive gastric or gastroesophageal junction (G/GEJ) adenocarcinoma. Standard treatment includes trastuzumab and chemotherapy. The KEYNOTE-811 trial found that adding pembrolizumab, an immunotherapy drug, improves survival. However, pembrolizumab is expensive, and whether its benefits justify the cost is uncertain. This study evaluated the cost-effectiveness of pembrolizumab plus trastuzumab and chemotherapy (PTC) compared to trastuzumab and chemotherapy alone (TC) for patients in the U.S. A 20-year simulation model estimated costs, quality-adjusted life years (QALYs), and value for money. Results showed that for patients with high PD-L1 expression (CPS ⩾1), the PTC regimen added about 4 extra months of good-quality life but cost $247,000 more—leading to a cost of $750,750 per QALY, far above the typical U.S. threshold of $150,000. For those with low PD-L1 expression or across all patients, PTC was even less cost-effective. The study also included a sequential treatment model, reflecting real-world practice where patients receive second- and third-line therapies after progression. Even when accounting for the full course of treatment, the TC-based sequences were more cost-effective than PTC-based sequences, with the ICERs of PTC-based regimens exceeding $745,063 per QALY. Sensitivity analyses confirmed the robustness of these findings. In conclusion, while PTC improves survival, it is not cost-effective under current U.S. standards, even when multi-line treatment is considered. Reducing pembrolizumab’s price could help improve affordability. These findings can support informed decisions for clinicians, patients, and policymakers.
Keywords
Introduction
Gastric cancer (GC) ranks as the fifth most common malignancy globally and stands as the fourth leading cause of cancer-related mortality. In the United States, approximately 26,890 new cases are diagnosed annually, with about 10,880 deaths reported. Due to its typically asymptomatic nature in the early stages, GC is often diagnosed at an advanced stage, at which the 5-year survival rate is a mere 6%.1,2 The predominant histological type of GC is gastric adenocarcinoma, accounting for over 90% of all GCs. Approximately one-quarter of patients with gastric or gastroesophageal junction (G/GEJ) adenocarcinoma exhibit overexpression of human epidermal growth factor receptor 2 (HER2). Tumors with HER2 overexpression are generally more aggressive, with higher recurrence rates and poorer survival outcomes compared to HER2-negative counterparts. 3 Diagnosis in patients with unresectable or metastatic HER2-positive G/GEJ adenocarcinoma often occurs at a late stage, at which the cancer has already metastasized, making systemic therapy the primary treatment option.
For many years, chemotherapy, particularly fluoropyrimidine and platinum-based regimens, has remained the standard treatment for GC. In recent years, the advent of immunotherapy and targeted therapies has brought renewed hope to the management of GC. Trastuzumab, a targeted therapy against the HER2 receptor, demonstrated efficacy and safety in combination with chemotherapy (TC) for patients with locally advanced or metastatic HER2-positive G/GEJ adenocarcinoma in the Trastuzumab for Gastric Cancer (ToGA) trial. 4 As a result, the National Comprehensive Cancer Network (NCCN) has recommended trastuzumab in combination with chemotherapy as the first-line treatment option. 5 Despite this progress, prognosis remains poor, with a median overall survival (OS) still under 13 months, emphasizing the urgent need for novel therapeutic strategies.
Pembrolizumab, an immune checkpoint inhibitor, enhances the cytotoxic action of T cells against tumor cells by blocking the interaction between the programmed death-1 (PD-1) receptor and its ligands PD-L1 and PD-L2. Clinical studies have shown that anti-PD-1 antibodies significantly improve survival rates for patients with HER2-negative metastatic gastroesophageal cancer compared to conventional first-line chemotherapy. 6 Previous studies have reported a high prevalence of PD-L1 co-expression in HER2-positive G/GEJ adenocarcinomas, with up to 88% of tumors demonstrating PD-L1 positivity. 7 In this context, trastuzumab targets HER2 to block tumor growth signaling, while pembrolizumab activates the immune system’s anti-tumor response, offering dual therapeutic protection. Moreover, trastuzumab may further optimize the tumor microenvironment, enhancing immune cell infiltration and activity, thereby boosting the efficacy of pembrolizumab.
An international, double-blind, randomized phase III clinical trial, KEYNOTE-811 (NCT03615326), investigated the efficacy and safety of the combination therapy of pembrolizumab, trastuzumab, and chemotherapy (PTC) compared to trastuzumab plus chemotherapy (TC) in treatment-naïve patients with HER2-positive metastatic G/GEJ adenocarcinoma. The latest findings as of September 13, 2024 showed that PTC led to a significant improvement in median progression-free survival (PFS; 10.0 months vs 8.1 months, HR: 0.73, 95% CI: 0.61–0.87, p = 0.006) and OS (20.0 months vs 16.8 months, HR: 0.80, 95% CI: 0.67–0.94, p = 0.004) compared to TC. Notably, patients with a combined positive score (CPS) of PD-L1 ⩾1 receiving PTC exhibited significantly improved OS (20.1 months vs 15.7 months, HR: 0.79, 95% CI: 0.66–0.95) and PFS (10.9 months vs 7.3 months, HR: 0.72, 95% CI: 0.60–0.87). Given these significant clinical benefits, this combination therapy was granted accelerated FDA approval for patients with PD-L1 CPS ⩾1 and unresectable or metastatic HER2-positive gastric/gastroesophageal junction adenocarcinoma. 8
However, novel immunotherapeutic agents are often accompanied by high treatment costs, imposing significant economic burdens on both patients and society. A review of the existing literature reveals that most studies focus on the cost-effectiveness of monotherapy with pembrolizumab or trastuzumab combined with chemotherapy compared to chemotherapy alone. For instance, Nguyen et al. demonstrated that in the United States, trastuzumab combined with chemotherapy could be a cost-effective first-line treatment for HER2-positive metastatic GC patients. 9 Similarly, Shiroiwa’s study, which examined HER2-positive advanced GC patients in Japan, concluded that trastuzumab combined with chemotherapy was cost-effective only for the subgroup of patients with IHC 3+ expression. 10 Additionally, Lang et al. evaluated the cost-effectiveness of pembrolizumab combined with chemotherapy or pembrolizumab monotherapy versus chemotherapy alone in patients with HER2-negative G/GEJ adenocarcinoma. Their findings indicated that neither pembrolizumab plus chemotherapy nor pembrolizumab monotherapy was cost-effective for advanced G/GEJ adenocarcinoma patients with CPS ⩾1 under the economic conditions of the United States and China. However, pembrolizumab monotherapy was deemed cost-effective in the United States for patients with CPS ⩾10. 11 These findings provide a vital theoretical foundation for our study, highlighting its significance and necessity. While trastuzumab combined with chemotherapy has been shown to be a cost-effective treatment option in the United States, the addition of pembrolizumab markedly improves therapeutic efficacy, albeit with varying effects across different patient subgroups. This enhanced efficacy, however, is accompanied by the high cost of pembrolizumab and the potential risk of adverse events (AEs).
Consequently, this study evaluates the cost-effectiveness of pembrolizumab combined with trastuzumab and chemotherapy for patients with locally advanced or metastatic HER2-positive G/GEJ adenocarcinoma from the perspective of U.S. healthcare payers. To ensure a comprehensive analysis, patients were stratified by PD-L1 CPS status, providing critical economic insights for clinicians, healthcare professionals, and policymakers in making treatment decisions for G/GEJ adenocarcinoma patients. Furthermore, our findings aim to inform pricing strategies and promote the rational clinical use of these therapies.
While prior studies have primarily focused on first-line therapies, real-world management of unresectable metastatic HER2-positive G/GEJ adenocarcinoma often involves sequential treatment across multiple lines. Following first-line pembrolizumab plus trastuzumab and chemotherapy, patients may proceed to second-line options such as trastuzumab deruxtecan (TD) or ramucirumab plus paclitaxel (RP), and eventually to third-line paclitaxel (Pa) monotherapy. 12 Despite the increasing clinical adoption of such treatment sequences, the cost-effectiveness of these full treatment pathways remains inadequately evaluated. Therefore, in addition to assessing the cost-effectiveness of PTC alone, our study further incorporates a comprehensive sequential treatment evaluation model to reflect real-world clinical practice, aiming to provide robust economic evidence for guiding therapeutic decisions across all lines of care.
Methods
As this study is entirely based on previous research and publicly available data, it does not include any new research involving human participants or animals by any of the authors, and therefore does not require approval from an independent ethics committee. The study was completed in 2024. The economic analysis adhered to the methodological guidelines established by the Second Panel on Cost-Effectiveness in Health and Medicine, and the findings are reported in accordance with the Consolidated Health Economic Evaluation Reporting Standards (CHEERS) 2022 checklist, detailed in Table S1.
Patients and interventions
First-line treatment evaluation model
The data for this study were derived from the KEYNOTE-811 clinical trial, targeting patients over the age of 18 with unresectable or metastatic HER2-positive G/GEJ adenocarcinoma who have not previously received cancer treatment. Eligible patients met the Solid Tumor Response Assessment Criteria (RECIST) version 1.1, had measurable disease, and scored 0 or 1 on the Eastern Cooperative Oncology Group (ECOG) performance status, demonstrating an expected lifespan of more than 6 months and good organ function. Participants were randomized 1:1 into two groups:
PTC group: pembrolizumab 200 mg every 3 weeks (up to 35 cycles); trastuzumab (initial 8 mg/kg, then 6 mg/kg every 3 weeks); and chemotherapy options of either fluorouracil (800 mg/m² IV, days 1–5) with cisplatin (80 mg/m², every 3 weeks) or capecitabine (1000 mg/m² orally twice daily, days 1–14) with oxaliplatin (130 mg/m², every 3 weeks). TC group (trastuzumab and Chemotherapy): trastuzumab and chemotherapy regimens were identical to the PTC group, with pembrolizumab replaced by a placebo administered every 3 weeks. Treatment continued until disease progression (PD), unacceptable toxicity, researcher discretion, consent withdrawal, or the completion of the maximum cycles.
In the clinical trial, subsequent treatment regimens were as follows: In the PTC group, 39% of patients received subsequent therapy, which included 19% receiving chemotherapy, 3% receiving pembrolizumab, 8% receiving ramucirumab, and 9% receiving trastuzumab. In contrast, in the TC group, 47% of patients received subsequent therapy, specifically 24% chemotherapy, 3% pembrolizumab, 10% ramucirumab, and 9% trastuzumab. It is assumed that the remaining patients who did not receive the aforementioned treatments received best supportive care13,14 and were provided with end-of-life care prior to death. Follow-up frequency was designed according to NCCN guidelines: oral and intravenous contrast CT of the chest/abdomen/pelvis every 6 months for 2 years, then annually for up to 5 years. History and physical examination and complete blood count blood tests were conducted every 3 months for 2 years, then every 6 months until death.
The clinical trial did not provide specific data on subsequent treatment plans, drug selection, and adverse reactions for the PD-L1 CPS ⩾1 and PD-L1 CPS <1 cohorts, so it is assumed these aspects were consistent with those observed in the overall population. The patient’s body surface area was calculated using the Mosteller formula. 15 Height and weight data were sourced from the U.S. adult anthropometric reference data 16 (Table 1).
Ranges and distributions of parameters used in the model.

AEs, adverse events; BSA, body surface area; CBC, complete blood count; IV, intravenous; PD, progressed disease; PFS, progression-free survival; Ppps, past pertinent problems; PTC, pembrolizumab plus trastuzumab and chemotherapy; TC, trastuzumab plus chemotherapy.
Sequential treatment evaluation model
In addition to evaluating the cost-effectiveness of first-line PTC versus TC, we developed an extended model to assess the economic value of a real-world sequential treatment strategy commonly adopted in clinical practice for patients with unresectable metastatic HER2-positive G/GEJ adenocarcinoma. The target population for the sequential treatment evaluation model was the overall patient cohort, without stratification by PD-L1 CPS status. The treatment sequence consisted of the following lines:
First-line: PTC versus TC, with identical drug regimens and dosing schedules as described in the first-line treatment evaluation model.
Second-line: TD (administered at 6.4 mg/kg on day 1 of each 21-day cycle) versus ramucirumab (8 mg/kg on days 1 and 15 of each 28-day cycle) plus paclitaxel (80 mg per square meter of body-surface area on days 1, 8, and 15 of each 28-day cycle).
Third-line: Paclitaxel monotherapy or BSC.
Clinical efficacy inputs, costs, AE profiles, and transition probabilities for second- and third-line therapies were derived from published clinical trials and supplemented by literature-based assumptions where necessary. 12 This sequential framework allowed us to evaluate the cumulative cost-effectiveness across multiple lines of treatment, reflecting real-world clinical practice more accurately.
Model construction
First-line treatment evaluation model
Using the “heemod” package in R (version 4.4.1; https://www.r-project.org/), semi-Markov models were constructed. The full model code is available at: https://github.com/youcaicong/Pharmacoeconomic-evaluation–Gastric-cancer. This model encompasses three mutually exclusive health states: PFS, PD, and death (Figure 1). All patients are assumed to start initially in the PFS state and may either remain in this state or progress to the next health state in each cycle. The model’s duration is set for 10 years, sufficiently capturing the overall progression of the patients, as over 99% of patients in both treatment groups are assumed to have died by this point. The model cycles are aligned with the dosing intervals at 21 days. The primary outcomes include total costs, quality-adjusted life year (QALY), and the incremental cost-effectiveness ratio (ICER). In line with the World Health Organization (WHO) recommendations, the willingness-to-pay (WTP) threshold per QALY for U.S. payers is set at $150,000. 30 Costs and utilities are calculated using a half-cycle correction, and a 3% annual discount rate is applied (Table 1). 30

First-line treatment evaluation model.
Sequential treatment evaluation model
We developed a continuous microsimulation model with a 21-day cycle in R to compare alternative treatment strategies under the context of the U.S. healthcare system. In real-world clinical practice for HER2-positive unresectable metastatic G/GEJ adenocarcinoma, patients typically follow a well-defined multiline treatment pathway—progressing from first-line therapy to second-line therapy, then to third-line therapy, and eventually receiving best supportive care and end-of-life treatment. Based on this clinical trajectory, we constructed a sequential treatment evaluation model to more accurately capture transitions in health states, resource utilization, and quality-of-life changes throughout the disease course, thereby improving the predictive validity of the model. The simulation tracked a cohort of patients with advanced HER2-positive G/GEJ adenocarcinoma over their lifetime, transitioning through four health states: PFS, first-stage disease progression (PD1), end-stage progression (PD2), and death. All patients entered the model in the PFS state and could subsequently transition through second-line and third-line therapies before ultimately reaching death.
Detailed modeling procedures and validation methods are provided in Supplemental Method S1, Figure S6, and the GitHub repository listed above.
Model parameters
Transition probabilities
We extracted the most recent PFS and OS Kaplan–Meier (KM) survival curves from the KEYNOTE-811 trial using the GetData Graph Digitizer (http://getdata-graphdigitizer.com). The article did not provide KM curves for PFS in patients with CPS < 1, so we reconstructed these curves using the KM Subtraction method developed by Zhao et al., 31 combined with the minimum cost bipartite matching algorithm. This was done by excluding survival data for patients with CPS ⩾1 from the overall cohort. Individual patient data (IPD) was reconstructed following Guyot’s method, 32 which is currently the most accurate method known for reconstructing IPD.
We used R Software (version 4.4.1; R Core Team, Vienna, Austria) to fit and extrapolate the KM survival curves, evaluating 15 different parameter survival model: exponential, Weibull, gamma, log-normal, Gompertz, log-logistic, generalized gamma, FP1, FP2, restricted cubic splines, Royston-Parmar, generalized additive models, and mixture-cure models. To determine the best model for long-term clinical survival outcomes, we implemented a rigorous model selection process. This process was based on meticulous visual inspection, clinical plausibility assessment—initially excluding unreasonable models where terminal survival rates remained constant long-term, or PFS survival rates exceeded OS survival rates—and was supplemented by statistical criteria like the Akaike information criterion (AIC)and Bayesian information criterion (BIC), favoring models with lower values for these indicators. The corresponding AIC and BIC values for all candidate models are summarized in Table S2. The finally determined best-fit curves for each population are presented in Figure S1.
In Figure S1 and Table S3, the optimal parameter distribution and corresponding parameter values for fitting the survival curves of various health states are shown. The transition probabilities between health states required in the first-line treatment evaluation model and sequential treatment evaluation model are derived based on fitted survival curves. The specific formula is detailed in the Supplemental Material (Method S1). The specific transition probability can be obtained at the GitHub repository listed above.
Cost estimates
The cost analysis was conducted from a U.S. payer perspective, focusing exclusively on direct medical expenses. These costs include pharmaceutical expenses, laboratory diagnostics, charges for enhanced abdominal CT scans, BCB, hospice care, each intravenous infusion, best supportive care, and the management of AEs. Only treatment-related AEs of Grade 3 or higher with an incidence of 5% or higher were included, such as diarrhea, anemia, neutropenia, and thrombocytopenia. This exclusion is due to the fact that minor AEs typically do not necessitate medical intervention or incur significant costs. The costs associated with pharmaceuticals, intravenous administration, oncological imaging, and laboratory examinations are derived from the U.S. Centers for Medicare and Medicaid Services and the Medicare Physician Fee Schedule.24,25 All other expenses are obtained from published literature.19 –22,26 –28 To account for inflationary adjustments, all costs have been adjusted to the 2024 fiscal year 33 (Table 1).
Utility inputs
Due to the absence of detailed reports on the global health status and quality of life dimensions from the KEYNOTE-811 trial using the European Organization for Research and Treatment of Cancer Quality of Life Questionnaire (EORTC QLQ-C30), we utilized data from previously published literature. The average health utility values for PFS, PD, and death states were 0.730, 0.577, and 0, respectively.17,18 Additionally, we considered the disutility associated with treatment-related AEs of Grade 3 or higher with an incidence rate of 5% or more, with disutility values derived from published literature.34,35 The impact of adverse reactions on patient quality of life was evaluated by multiplying the utility decrement of each AE by its incidence rate (Table 1).
Sensitivity analyses
Two types of sensitivity analyses were utilized to assess the robustness of the model: one-way sensitivity analysis (OWSA) and probabilistic sensitivity analysis (PSA). In the OWSA, reasonable ranges were established for each parameter. Where possible, standard deviations for distributions were sourced from literature; otherwise, they were calculated at ±25% of the mean. The outcomes of the univariate sensitivity analysis are depicted using tornado diagrams to visually demonstrate the impact of variations in different parameters on the model results (Figure 2).
PSA involved conducting 1000 Monte Carlo simulations to explore the cumulative effects of simultaneous variations in multiple parameters. Cost parameters were modeled using a Gamma Distribution, while utility and probability parameters were assigned a Beta Distribution. 36 The results of the PSA are presented not only through scatter plots illustrating the cost-utility relationship of the model but also via cost-effectiveness acceptability curves (CEACs), which depict the probability of cost-effectiveness for each treatment option at various WTP thresholds. Basic values, distributions, and ranges of model parameters are provided in Table 1.
Considering the critical role of selected fitting curves in determining research outcomes, we conducted an independent analysis to evaluate how different fitting curves affect the model’s results. Specifically, extrapolation curves were selected from the 15 survival distribution types described in the methodology. To ensure consistency, we imposed the constraint that the OS curve for a given group must always remain above the PFS curve. The fitting parameters for each combination were subsequently incorporated into the model to compute the corresponding ICER. The results were visualized using scatter plots to facilitate detailed analysis.
Scenario analysis
Since the FDA has only approved the PTC regimen for patients with unresectable or metastatic HER2-positive G/GEJ adenocarcinoma presenting a PD-L1 CPS of ⩾1. 8 We conducted three scenario analyses within the PD-L1 CPS ⩾1 subgroup to simulate potential real-world conditions. Scenario One: In the baseline analysis, outcomes were extrapolated to 10 years, while the real-world data in clinical literature spans 5 years. To assess the impact of the model’s duration on outcomes, we adjusted the timeframe to either 5 or 20 years. Scenario Two: We simulated a situation where patients, post-PD, lacking a clearly defined subsequent treatment plan, do not receive optimal supportive care. This mimics real-world scenarios where treatment may be discontinued due to health, economic, or compliance issues. Scenario Three: The initial assumed price of pembrolizumab was reduced to 50%, 25%, and 15.9%, respectively, to evaluate the impact of different pricing on cost-effectiveness, thus supporting the formulation of value-based pricing strategies.
Results
Base case analysis
First-line treatment evaluation model
Table 2 presents the results of the baseline analysis for the 10-year simulation, with details of direct medical costs provided in Table S4. In the patient cohort with PD-L1 CPS ⩾1, total costs for the PTC regimen were $370,794.80, in contrast to $123,320.52 for the TC group. The PTC group accrued 1.72 QALY, compared to 1.39 QALY for the TC group. Despite gaining an additional 0.33 QALY, the PTC group’s additional expenditure of $247,474.27 led to an ICER of $750,750.50 per QALY, greatly exceeding the United States’ WTP threshold of $150,000 per QALY
Basic analysis results of first-line treatment evaluation model.
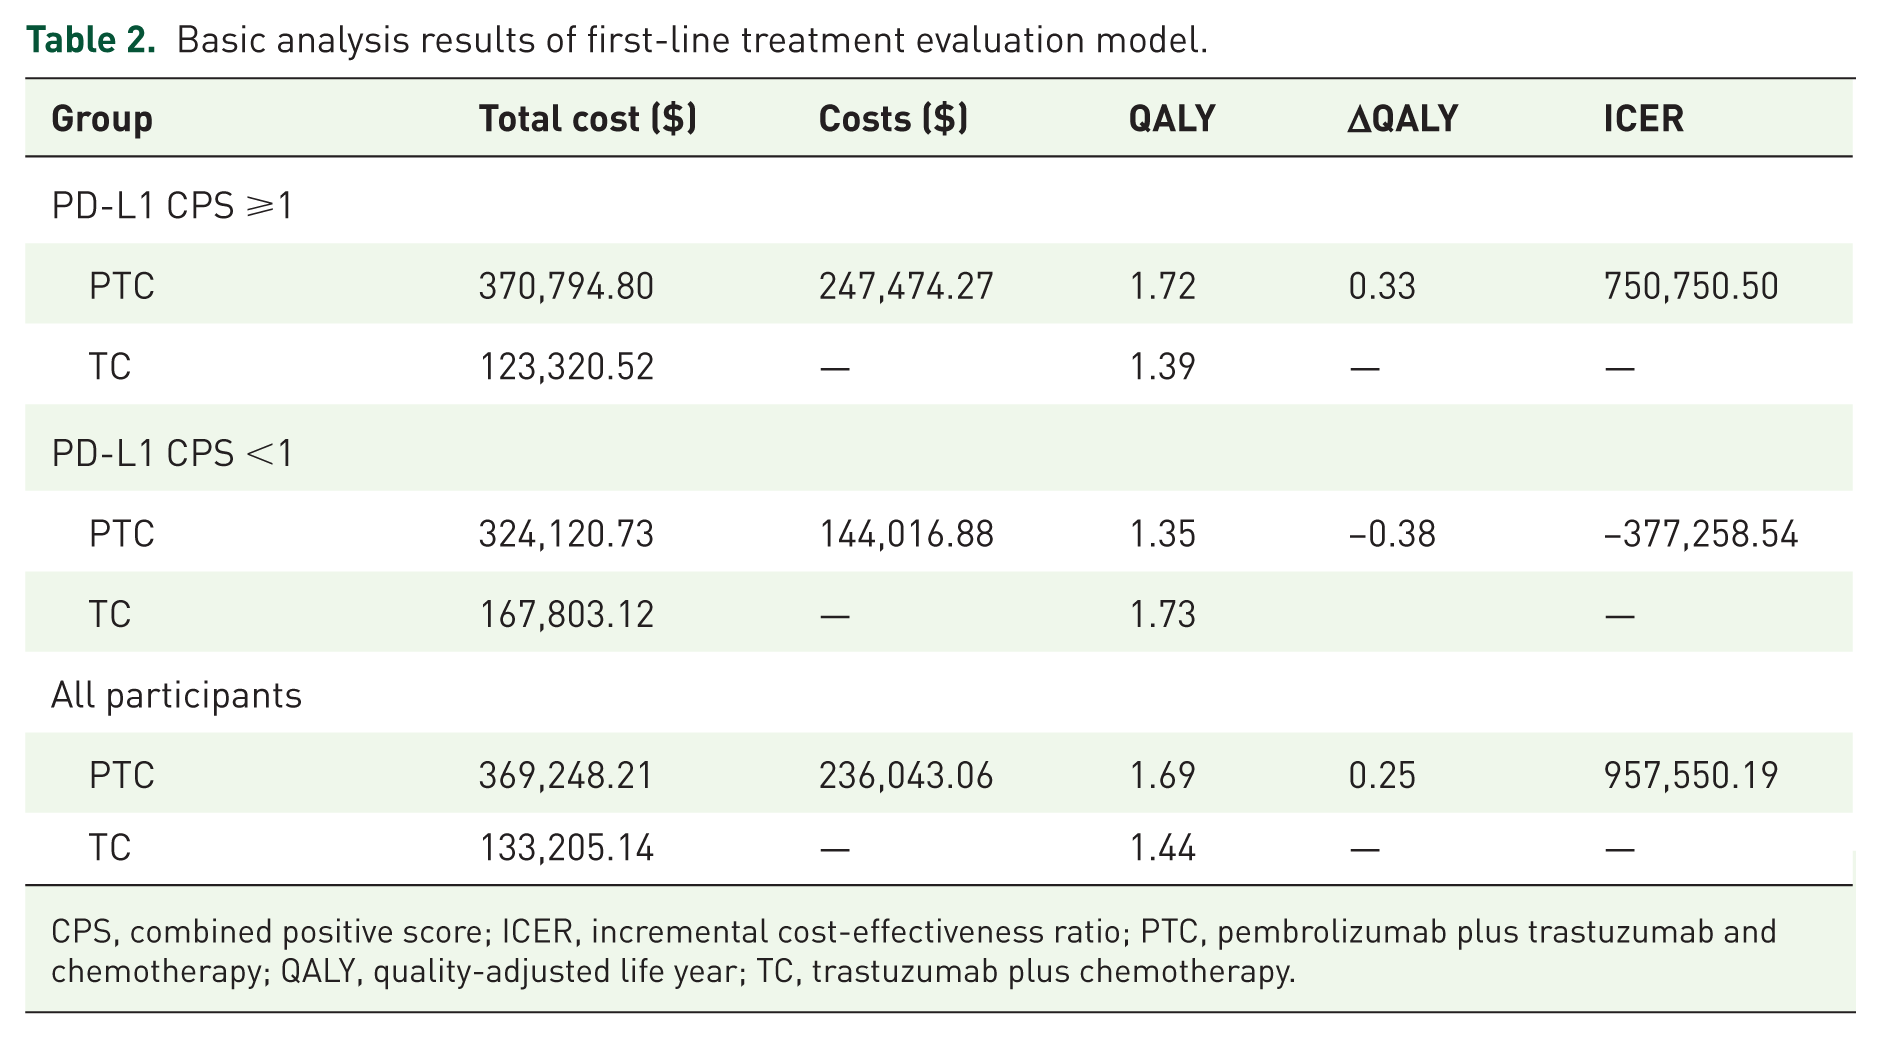
CPS, combined positive score; ICER, incremental cost-effectiveness ratio; PTC, pembrolizumab plus trastuzumab and chemotherapy; QALY, quality-adjusted life year; TC, trastuzumab plus chemotherapy.
In patients with PD-L1 CPS <1, the PTC regimen’s total cost was $324,120.73, yielding 1.35 QALY, while the TC regimen incurred $1,667,803.12, achieving 1.73 QALY. The PTC regimen, thus, not only incurred higher costs but also resulted in fewer QALY, with an ICER of -$377,258.54, indicating a significant disadvantage for patients with PD-L1 CPS <1.
For all participants, the total cost for the PTC regimen was $369,248.21 compared to $133,205.14 for the TC group. The PTC group gained 1.69 QALY versus 1.44 QALY for the TC group. With an additional 0.25 QALY gain and an incremental cost of $236,043.06, the ICER was $957,550.19 per QALY, substantially above the WTP threshold of $150,000 per QALY. Therefore, whether it is for patients with PD-L1 CPS ⩾1, PD-L1 CPS < 1, or all locally advanced or metastatic HER2-positive G/GEJ adenocarcinoma, the PTC regimen is not cost-effective compared to the TC regimen.
Sequential treatment evaluation model
The base-case results of the sequential treatment model are summarized in Table S6 and Figure S7. Among the four evaluated strategies, TC+TD+Pa provided the highest cost-effectiveness. It yielded 1.57 QALYs at a total cost of $335,818.13. In contrast, TC+RP+Pa resulted in a slightly lower QALY of 1.52 and a higher cost of $346,741.76. The resulting ICER was −$224,673.71, indicating that TC+RP+Pa was dominated (i.e., more costly and less effective) by TC+TD+Pa.
When pembrolizumab was introduced in the first-line setting, both PTC+TD+Pa and PTC+RP+Pa strategies demonstrated improved clinical benefits, with QALYs of 1.90 and 1.86, respectively. However, these gains were accompanied by substantial increases in total costs—$580,530.01 and $603,606.70, respectively. The corresponding ICERs compared to TC+TD+Pa were $745,063.32/QALY for PTC+TD+Pa and $910,560.17/QALY for PTC+RP+Pa, both of which far exceed the $150,000 WTP threshold.
Sensitivity analysis
OWSA results of first-line treatment evaluation model are illustrated in Figure 2 and Figure S2. It is important to note that the Incremental ICER is significantly influenced by the PD-L1 CPS status, the utilities of PFS and PD, the price of pembrolizumab, and the discount rate. Other parameters have moderate to minor impacts on the ICER. In the sequential treatment evaluation model (Figure S8), we examined the impact of parameter uncertainty only on the cost-effectiveness results between the two most cost-effective strategies: PTC+TD+Pa and TC+TD+Pa. The parameters with significant impact are consistent with those in the first-line treatment evaluation model, while the state-related costs for second- and third-line treatments have a relatively smaller influence. Variations in all parameters within their respective ranges do not align the resulting ICER values with the WTP threshold of $150,000 per QALY, confirming the robustness of our model (Figure 3).
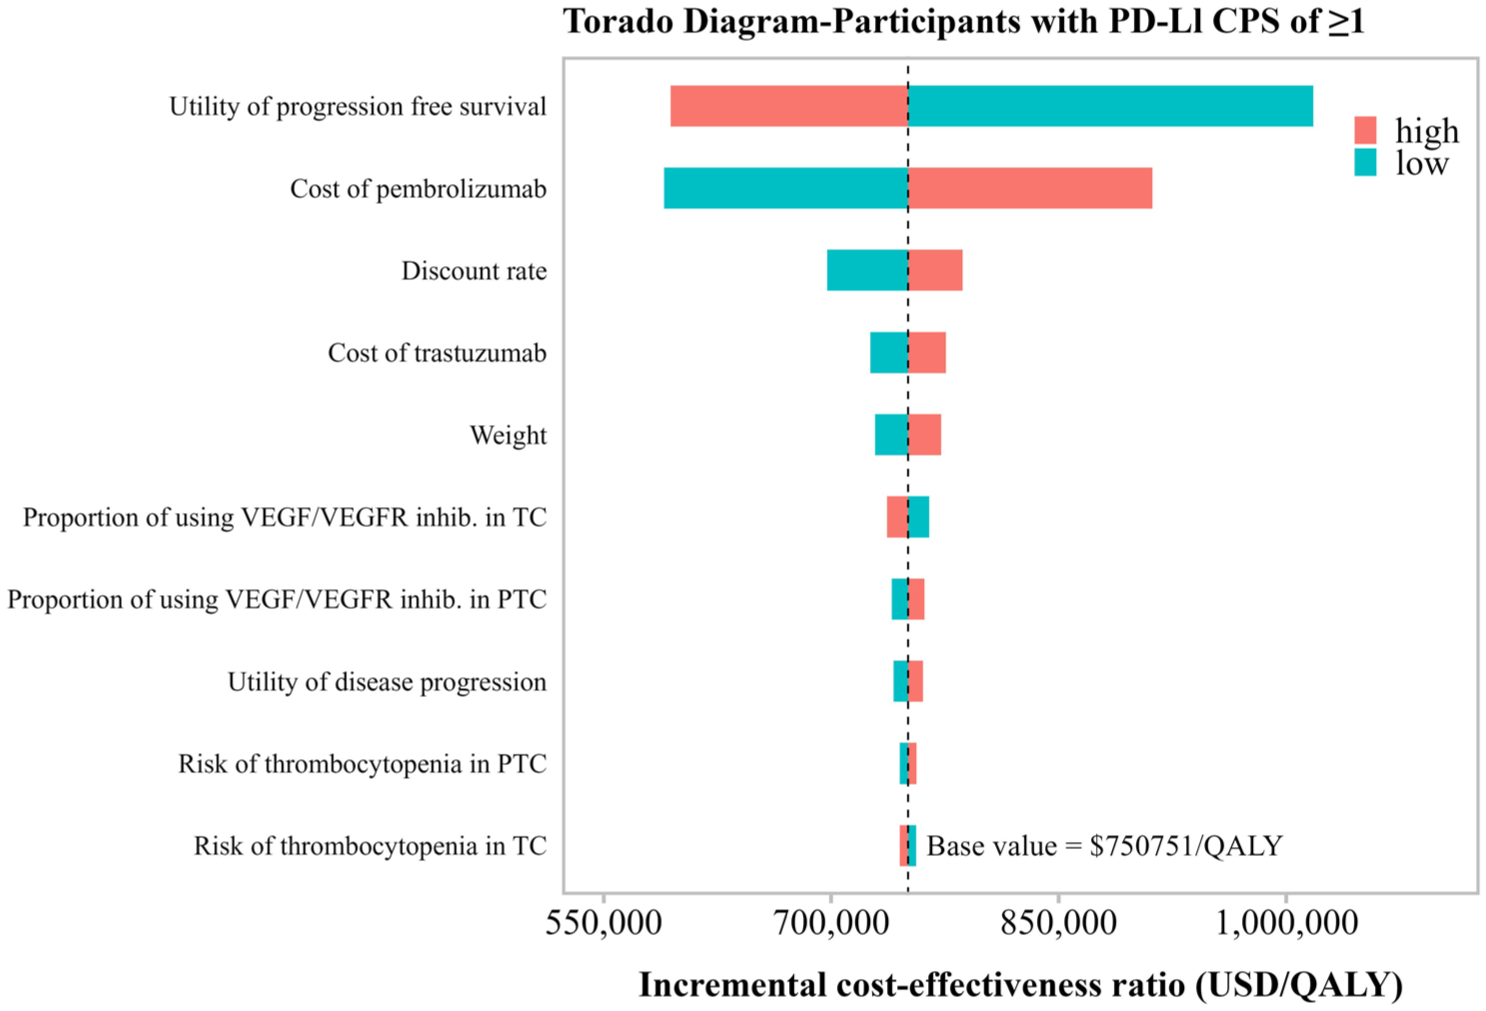
Tornado diagrams illustrating the results for participants with PD-L1 CPS ⩾ 1 in the first-line treatment evaluation model.
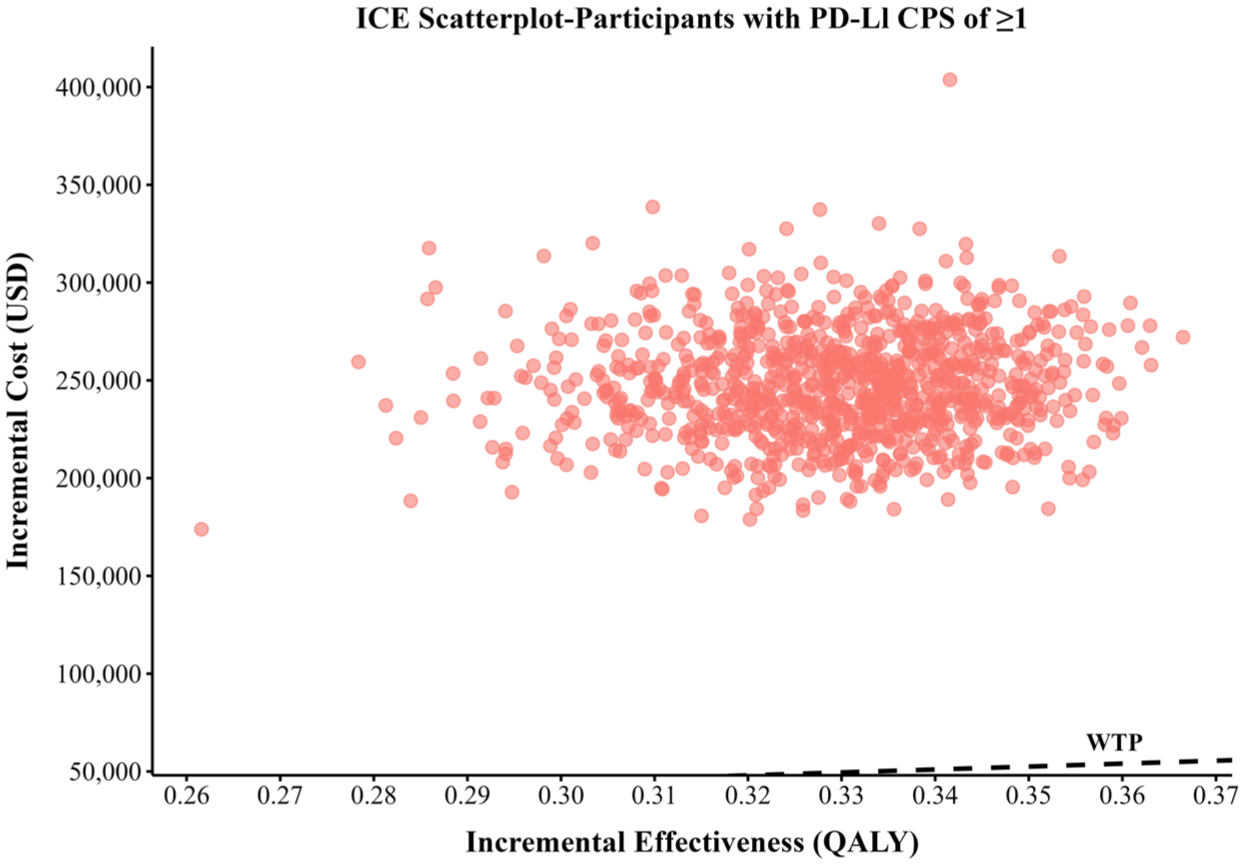
Scatter plot diagrams showing the incremental cost-effectiveness for participants with PD-L1 CPS ⩾1 in the first-line treatment evaluation model.
The PSA results of the first-line treatment evaluation model are shown in Figures 3, 4, and S3. All points in the scatter plots, representing individual simulations, exceed the United States per capita WTP threshold of $150,000 per QALY. The CEACs demonstrate that, at a WTP threshold of $150,000 per QALY, the probability of the PTC regimen being cost-effective compared to the TC regimen is 0% for patients at any PD-L1 CPS expression level and for all patients with locally advanced or metastatic HER2-positive G/GEJ adenocarcinoma. The PSA results of the sequential treatment evaluation model are shown in Figure S9, and all simulation results revolve around the basic analysis results. Among the four decisions, the sequential treatment group with PTC as the first-line treatment has higher parameter uncertainty and a wide cost range in many simulations, exceeding $600,000. In contrast, the sequential treatment group with TC as the first-line treatment has a tighter cluster and lower cost and QALYs range.
The sensitivity analysis results for each parameter survival model combination are shown in Figure S5. After excluding unreasonable model combinations, a total of 3850, 4897, and 5400 simulations were performed for the PD-L1 CPS ⩾1 group, PD-L1 CPS <1 group, and the overall population group, respectively. In the overall population group, the lowest ICER was $475,619.50, while the lowest ICER in the PD-L1 CPS⩾1 group was $381,809.10, both of which significantly exceeded the WTP threshold of $150,000. In contrast, in the PD-L1 CPS < 1 group, the ICERs formed two distinct clusters in the second and third quadrants, indicating that the PTC regimen may not be as cost-effective as the TC regimen in terms of cost and effectiveness in this subgroup. Overall, regardless of the distribution combination used, the PTC regimen was not cost-effective compared to the TC regimen in any subgroup. Moreover, the extrapolation results showed high consistency among different distribution combinations, further supporting the robustness of the fitting method.
Scenario analysis
Table S5 summarizes the results of the scenario analysis. In Scenario 1, setting the study duration to 5 years led to a substantial increase in the ICER to $954,901.88 per QALY, while extending it to 20 years reduced the ICER to $649,980.77 per QALY. Both values far exceed the commonly accepted per capita WTP threshold in the United States. This finding suggests that, in the short term, the high initial treatment costs of the PTC regimen outweigh the longer-term benefits, such as improvements in quality of life and survival extension. In Scenario 2, where no best support care is provided after PD, the total costs of the PTC regimen slightly decrease to $366,027.00, with the ICER marginally dropping to $749,201.00, suggesting that the absence of best support care has a minimal impact on total costs and cost-effectiveness. Scenario 3, which involves varying degrees of reductions in the price of pembrolizumab, shows a gradual decrease in the ICER as the price decreases. A 50% price reduction brings the ICER down to $428,518.80, and a reduction of 93% lowers it to $149,981.77, indicating that for the PTC regimen to be economically viable compared to the TC regimen, the price of pembrolizumab must be reduced by at least 93% (Figure 4).

Cost-effectiveness acceptable curve for participants with PD-L1 CPS ⩾1 in the first-line treatment evaluation model.
Discussion
This study evaluated the cost-effectiveness of incorporating pembrolizumab into the standard first-line treatment regimen (TC) for patients with unresectable, metastatic HER2-positive G/GEJ adenocarcinoma. Additionally, it assessed the economic value of sequential treatment strategies that reflect real-world clinical practice, encompassing first-, second-, and third-line therapies. Analysis shows that in the first-line treatment evaluation model, for patients with a PD-L1 CPS of ⩾1, while the PTC regimen offers a modest increase in benefits of 0.33 QALY, its ICER is an exorbitant $750,750.50 per QALY—substantially surpassing the United States’ WTP threshold of $150,000 per QALY. For those with a PD-L1 CPS <1, the PTC regimen was dominated by the comparator, being more costly and less effective. This indicates that the regimen is more costly and less effective, clearly showing its economic disadvantage. Across all patient groups involved, the ICER for the PTC regimen remains above the WTP threshold, amounting to $957,550.19 per QALY. The base-case results of the sequential model revealed that the TC+TD+Pa strategy offered the most favorable cost-effectiveness profile, yielding 1.57 QALYs at a total cost of $335,818.13. Conversely, replacing TD with RP in the second-line setting TC+RP+Pa resulted in both higher costs and lower QALYs, leading to strict dominance (ICER = −$224,673.71). This indicates that RP-based strategies may be less economically viable than TD-based regimens for patients who do not receive pembrolizumab in the first line. When pembrolizumab was included in the first-line regimen (PTC+TD+Pa and PTC+RP+Pa), QALY gains improved to 1.90 and 1.86, respectively, reflecting enhanced clinical efficacy. However, these gains came at the expense of significant cost increases—more than $240,000 higher than their TC-based counterparts. The ICERs of $745,063.32 and $910,560.17 per QALY far exceeded the $150,000 WTP threshold, reaffirming the conclusion from the first-line analysis: the PTC-based strategies, though more clinically effective, are not cost-effective under current pricing structures.
These findings underscore two critical insights. First, the choice of second-line agent materially impacts the overall cost-effectiveness. TD is not only clinically effective but also offers a more favorable economic profile compared to RP in the sequential context. Second, while the inclusion of pembrolizumab improves survival outcomes, its high cost continues to undermine cost-effectiveness, even when incorporated into a real-world treatment sequence.
To ensure the robustness of our model, we conducted sensitivity analyses. In the first-line treatment evaluation model, the OWSA underscored the substantial impact of pembrolizumab’s price, the utilities of PFS and PD, and the discount rate on the Incremental ICER. The results confirm that variations within the predetermined ranges of these parameters do not modify the original conclusions of our study. The PSA shows that the economic viability of the PTC regimen is 0% at a WTP threshold of $150,000, only exceeding 50% viability at a WTP of $760,000. In the context of U.S. healthcare, balancing access to innovative treatments with financial protection for patients is paramount. Therefore, healthcare systems should focus on strategies that provide advanced therapies while minimizing financial strain on patients. An effective approach could involve negotiating lower prices for pembrolizumab. Our scenario analysis further investigated the influence of pembrolizumab’s price on the ICER, revealing that a price reduction of approximately 93% would be necessary for economic feasibility. In the sequential treatment evaluation model, the PSA showed that TC-based strategies clustered in a lower-cost, lower-QALY region with relatively less variability, while PTC-based strategies demonstrated greater parameter uncertainty and frequent cost outliers exceeding $600,000. OWSA revealed that the cost of pembrolizumab, utilities of health states, and time horizon were the most influential factors, consistent with the first-line model. These results suggest that unless the price of pembrolizumab is substantially reduced, its inclusion in real-world sequential treatment pathways will remain economically unjustifiable from the U.S. payer perspective.
To the best of our knowledge, this study is the first to evaluate the cost-effectiveness of first-line pembrolizumab treatment for locally advanced or metastatic HER2-positive G/GEJ adenocarcinoma in the United States, as well as to incorporate a comprehensive assessment of real-world sequential treatment strategies across multiple lines of therapy. Several aspects of our study stand out. First, we used the latest data from the KEYNOTE-811 phase III clinical trial alongside 2024 drug and medical cost information, which helps minimize the influence of real-world data variability and medical cost fluctuations on our findings. Second, we combined the standard parameter survival model and the flexible parameter survival model, and conducted sensitivity analysis on the model to reduce the structural uncertainty of the parameter survival model. 37 Lastly, our analysis was stratified by different PD-L1 CPS statuses, offering a nuanced understanding of the cost-effectiveness of each treatment regimen across specific patient groups. We conducted scenario analyses in the PD-L1 CPS ⩾1 cohort, capturing a range of clinical practice scenarios, which enhances the applicability and generalizability of our results.
However, this study does have some limitations that need to be acknowledged. First, due to the lack of IPD in this study, we can only rely on summary data from published literature for modeling, which limits our ability to accurately simulate the actual treatment path of patients (such as interruption of treatment, dressing changes, dose adjustments, etc.). Second, similar to many prior studies, our focus was on AEs of grade ⩾3 with an incidence ⩾5%, but it’s important to note that lower-grade and less frequent AEs have a minimal impact on the overall results due to their lower associated treatment costs and utility losses. Third, due to the absence of health-related quality of life data in the KEYNOTE-811 clinical trial, the utility values for health states used in this study were derived from previously published literature, which may introduce temporal constraints. To mitigate this limitation, we employed a wide range of utility values in the OWSA to thoroughly assess the impact of variations in utility values on the robustness of the results. Our findings demonstrated that even with reasonable fluctuations in PFS and OS utility values, the study’s conclusions remained consistent. Fourth, the long-term survival data in our model are primarily based on the 10-year short-term follow-up data from KEYNOTE-811, which may not fully capture PD in real-world settings. Nevertheless, we examined the impact of various distribution fitting combinations on the results through sensitivity analysis. The findings reveal that, regardless of the chosen fitting distribution, the model exhibited high stability, and the study outcomes remained consistent, further reinforcing the reliability of the inference methodology. Despite these limitations, our study provides valuable insights into the cost-effectiveness of combining PTC for patients with unresectable, metastatic HER2-positive G/GEJ adenocarcinoma from the perspective of U.S. payers. Further research examining health outcomes when pembrolizumab prices vary could offer additional guidance for physicians and healthcare decision-makers.
Conclusion
From the perspective of American payers, based on a WTP threshold of $150,000/QALY, the first-line treatment of pembrolizumab combined with trastuzumab and chemotherapy is not cost-effective in patients with unresectable, metastatic HER2-positive G/GEJ adenocarcinoma, regardless of PD-L1 CPS status. In the sequential treatment model that simulates real clinical pathways, although starting with PTC can obtain more QALYs, the cost increases significantly, and ICER far exceeds the WTP threshold, which is still not cost-effective. In contrast, the strategy that starts with TC and runs through TD+Pa in sequence is economically optimal. Lowering the price of pembrolizumab may help improve its cost-effectiveness, which needs to be further validated with real-world data in the future.
Supplemental Material
sj-docx-1-tam-10.1177_17588359251378294 – Supplemental material for Cost-effectiveness of sequential treatment strategies involving first-line pembrolizumab with trastuzumab and chemotherapy for unresectable metastatic HER2-positive gastric or gastroesophageal junction adenocarcinoma
Supplemental material, sj-docx-1-tam-10.1177_17588359251378294 for Cost-effectiveness of sequential treatment strategies involving first-line pembrolizumab with trastuzumab and chemotherapy for unresectable metastatic HER2-positive gastric or gastroesophageal junction adenocarcinoma by Caicong You, Jiahao Zhang, Jianying Lei, Wu Fu, Bin Zheng, Hongfu Cai, Maobai Liu and Na Li in Therapeutic Advances in Medical Oncology
Footnotes
References
Supplementary Material
Please find the following supplemental material available below.
For Open Access articles published under a Creative Commons License, all supplemental material carries the same license as the article it is associated with.
For non-Open Access articles published, all supplemental material carries a non-exclusive license, and permission requests for re-use of supplemental material or any part of supplemental material shall be sent directly to the copyright owner as specified in the copyright notice associated with the article.