
Abstract
Background:
Programmed cell death protein 1 ligand 1 (PD-L1) expression alone may not be the optimal predictor of immunotherapy (IO) efficacy in advanced non-small cell lung cancer (NSCLC). Evaluation of circulating immune signatures using mass cytometry is a promising technique for predicting IO response and prognosis. The utility of circulating immune signatures for efficacy prediction after IO in advanced NSCLC remains to be elucidated.
Objectives:
To assess the feasibility of circulating immune cells and cytokines in predicting tumor response to IO in advanced NSCLC.
Design:
A prospective observational study.
Methods:
To investigate dynamic changes in immune signatures, blood specimens were prospectively collected from patients with NSCLC at baseline and following chemotherapy (C/T) and/or IO. Mass cytometry and enzyme-linked immunosorbent assay were used to characterize immune signatures and cytokine patterns to identify correlations between immune profiles and treatment efficacy.
Results:
The study enrolled 45 patients. The proportion of circulating natural killer (NK) cells and CD8+ T cells significantly increased after IO alone treatment. Cell levels of PD-1+CD8+ T cells, PD-1+CD4+ T cells, TIM-3+CD8+ T cells, LAG-3+ NK cells, and LAG-3+CD8+ T cells significantly decreased in patients with treatment response to IO alone. Tumor necrosis factor-alpha (TNF-α) levels significantly increased after IO alone treatment. Patients with high PD-1+CD8+ T cells before IO alone treatment had lower overall survival (OS) compared to those with low levels. Patients with high LAG-3+CD8+ T cells before chemotherapy plus immunotherapy treatment had lower OS compared to those with low levels.
Conclusion:
Responses to IO in NSCLC were correlated with declines in specific exhausted T cells, suggesting that IO may exert therapeutical efficacy by decreasing circulating exhausted T cells, which were associated with poorer survival, while also increasing TNF-α. These results highlight the prognostic value of monitoring changes in circulating exhausted T cells to predict IO response and survival outcomes in advanced lung cancer.
Introduction
The human immune system can facilitate the elimination of tumor cells, but antitumor immunity is often modulated or inhibited by the tumor microenvironment (TME). Cancer immune evasion has been related to tumor-extrinsic mechanisms that lead to immunosuppressive status in TME and tumor-intrinsic mechanisms that enable the tumor to escape immune recognition. The tumor-extrinsic mechanisms contain infiltration with immunosuppressive cells (such as exhausted T cells, regulatory T cells, and macrophages), immune receptor inhibition, and production of immunosuppressive cytokines, etc.1–4 The tumor-intrinsic mechanisms included defects in major histocompatibility complex (MHC) class I proteins, loss of tumor-associated antigens, and expression of ligands for immune checkpoints (such as programmed cell death protein 1 ligand 1 (PD-L1), and cytotoxic T-lymphocyte antigen-4).1–3,5 The antitumor effector cells of immune system, including cytotoxic T lymphocytes, natural killer (NK) cells, dendritic cells, macrophages, polymorphonuclear leukocytes, and mast cells.1–3,6,7 Further studies are warranted to investigate how tumor cells manipulate the immune system to evade the antitumor immunity. 7
PD-1 and PD-L1 blocking antibodies have shown their superior efficacy in patients with non-small cell lung cancer (NSCLC).8–10 Despite PD-L1 expression demonstrates to enrich for response to PD-1/L1 antibodies, many clinical trials revealed that tumors without PD-L1 expression can also respond to the treatment, raising concerns that using the PD-L1 expression alone may not be the best biomarker to predict the efficacy of immunotherapy (IO). Therefore, the identification of various factors in TME that predicts which patients will respond to PD-1/L1 blocking antibodies is one of the top priorities for improving lung cancer IO.1,7 Mass cytometry (cytometry by time of flight (CyTOF)) is a next-generation cytometry platform with several technological advances that confer advantages over fluorescence-based flow cytometry when highly multiparametric analyses are required. 11 Previous studies of CyTOF showed that exhausted T cell features of lung cancer were implicated in disease progression and response to IO. 12 The presence of exhausted PD-1+ T cells was a significant indicator of both treatment response and survival time in a study examining NSCLC patients undergoing PD-1 inhibitors. 13 The expression of T cell immunoglobulin and mucin-domain containing3 (TIM-3) on T cells has been associated with lymph node metastasis and more advanced stages of lung cancer. 14 Additionally, the expression of lymphocyte-activation gene 3 (LAG-3) on tumor-infiltrating lymphocytes has been linked to early postoperative recurrence and a poor prognosis in NSCLC. 15 Collectively, exhausted T cells with the expression of PD-1, TIM-3, or LAG-3 might emerge as potential circulating immune biomarkers to predict the effect of IO and the prognosis of lung cancer patients receiving IO.
In this prospective study, CyTOF was used to investigate immune cell phenotypes in patients with lung cancer receiving immune checkpoint inhibitors (ICIs). By exploring clinical manifestations and immune signatures, this study evaluated the treatment efficacy following ICIs for lung cancer and examined circulating biomarkers that could predict treatment response and prognosis following IO.
Patients and methods
Patient population
Patients with NSCLC who harbored wild-type EGFR and ALK and were treated with either chemotherapy (C/T) alone, IO alone, or both in Taipei Veterans General Hospital from 2020 to 2023 were prospectively enrolled. The IO regimen involved the use of PD-1/PD-L1 inhibitors, and the C/T regimen comprised platinum-doublet C/T and single-agent C/T in accordance with the clinical practice guidelines. 16 This study excluded the following patient groups: (1) patients treated with steroid exceeding 10 mg/day of prednisolone within the previous 14 days; (2) patients who had major surgery or radiotherapy within the previous 30 days; (3) patients with known epidermal growth factor receptor (EGFR) or anaplastic lymphoma kinase (ALK) mutations who received first-line targeted therapy; and (4) patients diagnosed with small-cell carcinoma. Data on clinical characteristics, including age, gender, tumor node metastasis (TNM) stage, systemic treatment regimen, treatment response, and survival time, were collected from medical records. Peripheral blood specimens were also obtained for immunophenotyping analysis. Approval for this study was granted by the Institutional Review Board of Taipei Veterans General Hospital (2020-05-006B), and informed consent was obtained from all participants before their involvement in the study. This study complied with the guidelines outlined in the Strengthening the Reporting of Observational Studies in Epidemiology (STROBE) Statement 17 (Supplemental File_STROBE).
Specimen collection process
Whole-blood specimens were obtained from patients via phlebotomy 1 day prior to commencing systemic treatment (day 0 (D0)) and again a week after the first medication dose (day 8 (D8)). Peripheral blood mononuclear cells (PBMCs) were separated using Ficoll density gradient centrifugation within 6 h of blood collection. These isolated PBMCs were then cryopreserved for later testing and analysis.
Mass-cytometry-based immunophenotyping of PBMCs
Immunophenotyping of various lymphocyte and monocyte subpopulations was carried out using mass cytometry (CyTOF; Fluidigm, San Francisco, CA, USA). Detailed procedures for CyTOF experiments, performed according to the manufacturer’s protocol, are described in Supplemental 1. T cells (CD45+CD3+) were labeled with antibodies of Catalog #3141009C and #3170007C; cytotoxic T cells (CD45+CD3+CD8+) were identified using antibodies of Catalog #3141009C, #3170007C, and #3146001C. Helper T cells (CD45+CD3+CD4+) were marked with antibodies of Catalog #3141009C, #3170007C, and #3145001B. NK cells (CD45+CD16+) were labeled with antibodies of Catalog #3141009C and #3209002C. For exhausted T cells (CD45+CD3+CD8+PD1+, CD45+CD3+CD8+TIM3+, or CD45+CD3+CD8+LAG3+), antibodies of Catalog #3141009C, #3170007C, #3146001C, #3155009C, #3153008C, and #3165037C were used. B cells (CD45+CD19+) were labeled with antibodies of Catalog #3141009C, and #3158032C, and monocytes (CD45+HLADR+CD14+) were identified using antibodies of Catalog #3141009C, #3174001C, and #3160006B (all from Fluidigm).18–21 To effectively manage the multidimensional data derived from CyTOF, we employed the specialized tools available in the OIMQ data analysis software (OMIQ, Inc., Santa Clara, CA, USA). This included the use of optimized t-Distributed Stochastic Neighbor Embedding (opt-SNE) plots and histograms. These tools were instrumental in reducing the dimensionality of the data and providing a detailed two-dimensional visual representation of the events, extracted from the original multidimensional dataset. 22 The median cell count per microliter in the study population was used as the cutoff value to categorize patients as having high or low cell levels when performing statistical analysis. Patients with cell levels below the median were classified as having low levels, while those with cell levels greater than or equal to the median were classified as having high levels.
Assessment of cytokine levels using enzyme-linked immunosorbent assay
The blood samples were subjected to centrifugation at a temperature of 4°C and a speed of 1500 revolutions per minute. To quantify the levels of various cytokines in plasma, we utilized the Quantikine enzyme-linked immunosorbent assay (ELISA) Kits (R&D Systems, Minneapolis, MN, USA) to detect interleukin (IL)-2, IL-6, IL-10, tumor necrosis factor-alpha (TNF-α), and interferon-gamma (IFN-γ). Detailed procedures, performed according to the manufacturer’s protocol, are described in Supplemental 2. The variation in cytokine levels was illustrated through the log2 fold change, comparing the concentration of various cytokines on D8 to their levels on D0. 23
Evaluation of treatment effectiveness
Clinical characteristics such as age, gender, smoking history, performance status, histological type, the number of cancer treatment courses, radiotherapy history, and sites of metastasis were systematically gathered and analyzed. The evaluation of the treatment responses was carried out in accordance with the Response Evaluation Criteria in Solid Tumors (RECIST) criteria (version 1.1). 24 Additionally, progression-free survival (PFS) was defined as the time from start of treatment to the earliest sign of disease progression, according to RECIST criteria, or death from any cause. In patients without disease progression at the time of last follow-up, PFS was censored at that point. Overall survival (OS) was calculated starting from the initiation date of treatment up to the date of death or the last follow-up visit.
Approaches to statistical analysis
Pearson’s Chi-squared test and Fisher’s exact test were employed to evaluate categorical variables, while continuous variables were analyzed using the Student’s t test and the Mann–Whitney U test. The Kaplan–Meier method, complemented by the log-rank test, was applied for conducting survival analysis. The threshold for statistical significance was established at a p-value of less than 0.05 (two-sided). All analyses were conducted using SPSS software (version 21.0; SPSS Inc., Chicago, IL, USA).
Results
Patient characteristics
Circulating immune biomarkers and signatures that may potentially predict treatment response and prognosis following IO were evaluated through mass cytometry (CyTOF) in this study. A total of 45 patients with advance NSCLC were prospectively enrolled and their blood specimens were analyzed by CyTOF. Of them, the median age was 62 years, with a range from 33 to 89 years (Table 1). Twenty-eight (62.2%) were men and 17 (37.8%) were women. The histologic types included 36 adenocarcinoma (80%), 4 squamous cell carcinoma (8.9%), and 5 other types (11.1%). Among these patients, 42.2% had a history of smoking. A substantial majority showed an Eastern Cooperative Oncology Group performance status of 0–1 (95.6%), and 46.7% had undergone more than two lines of treatment. All patients were categorized into three groups based on the treatments: C/T alone group (n = 9), IO alone group (n = 24), and chemotherapy plus immunotherapy (C/T+IO) group (n = 12). Among the three groups, the IO alone group exhibited a significantly higher percentage of PD-L1 levels exceeding 50%. This finding aligns with current treatment guidelines, which recommend IO alone treatment for patients with PD-L1 levels greater than 50%. The response rates in the C/T alone, IO alone, and IO+C/T group are 55.6%, 20.8%, and 33.3%, respectively.
Patient characteristics.

Others: sarcomatoid carcinoma (n = 1), NSCLC—not otherwise specified (n = 4).
Others: adrenal metastasis (n = 2), pleural effusion (n = 7), pericardial effusion (n = 2), omentum seeding (n = 1), abdominal metastatic lymphadenopathy (n = 1).
CR, complete remission; C/T, chemotherapy; C/T+IO, chemotherapy plus immunotherapy; ECOG PS, Eastern Cooperative Oncology Group performance status; IO, immunotherapy; NSCLC, non-small cell lung cancer; PD, progressive disease; PD-L1, programmed cell death protein 1 ligand 1; PR, partial response; SCC, squamous cell carcinoma; SD, stable disease.
Circulating immune signature analysis
Mass cytometry was performed for immune signature analysis of blood specimens from healthy individuals and lung cancer patients (Figure 1). opt-SNE plots (Figure 1(a), (c), (e), and (g)) and overlay histograms (Figure 1(b), (d), (f), and (h)) were utilized to graphically depict the variation in immune markers within PBMCs across healthy individuals and three treatment groups, including C/T alone group, IO alone group, and C/T+IO group. The opt-SNE plots are enhanced with spectral colors to depict the expression patterns of markers, including CD45, CD3, CD8, CD4, CD16, PD-1, TIM-3, and LAG-3, across various cell populations. The colors range from blue (low expression) to red (high expression), indicating the distribution and expression levels of these markers across different cell populations. Clusters represent groups of similar cells, and distances reflect their similarity. The overlay histograms display the detailed comparison of the different markers in PBMCs and provide a visual representation of the cell numbers expressing these markers, showing the changes of these markers before (D0, red line) and after treatment (yellow line), highlighting the immune response variations induced by the different treatment regimens. The immune signatures of PBMCs from three healthy control subjects were examined using CyTOF, displaying the typical expression patterns of immune markers in healthy individuals (Figure 1(a) and (b)). The expression of immune markers is prominently displayed in the opt-SNE plots (Figure 1(a)) and the corresponding histograms (Figure 1(b)). Notably, the three treatment groups exhibit markedly low numbers of PD-1+ cells, TIM-3+ cells, and LAG-3+ cells (Figure 1(c)–(h)). The opt-SNE plots (Figure 1(c)) show visible change in the distribution of CD45+ and CD3+ cells after treatment in the C/T alone group. The overlay histograms further demonstrate that the number of CD45+ cells and CD3+ cells in the C/T alone group decreased after treatment (Figure 1(d)). In the IO alone group (Figure 1(e)), the clusters show changes in CD8+ and CD4+ cells after treatment. The number of CD8+ cells and CD4+ cells in the IO alone group increased after treatment (Figure 1(f)). After C/T+IO treatment, changes are observed in the distribution and expression levels of various immune markers (Figure 1(g)). The number of cells expressing CD3 and CD4 changes, further illustrating the impact of the C/T+IO treatment (Figure 1(h)).
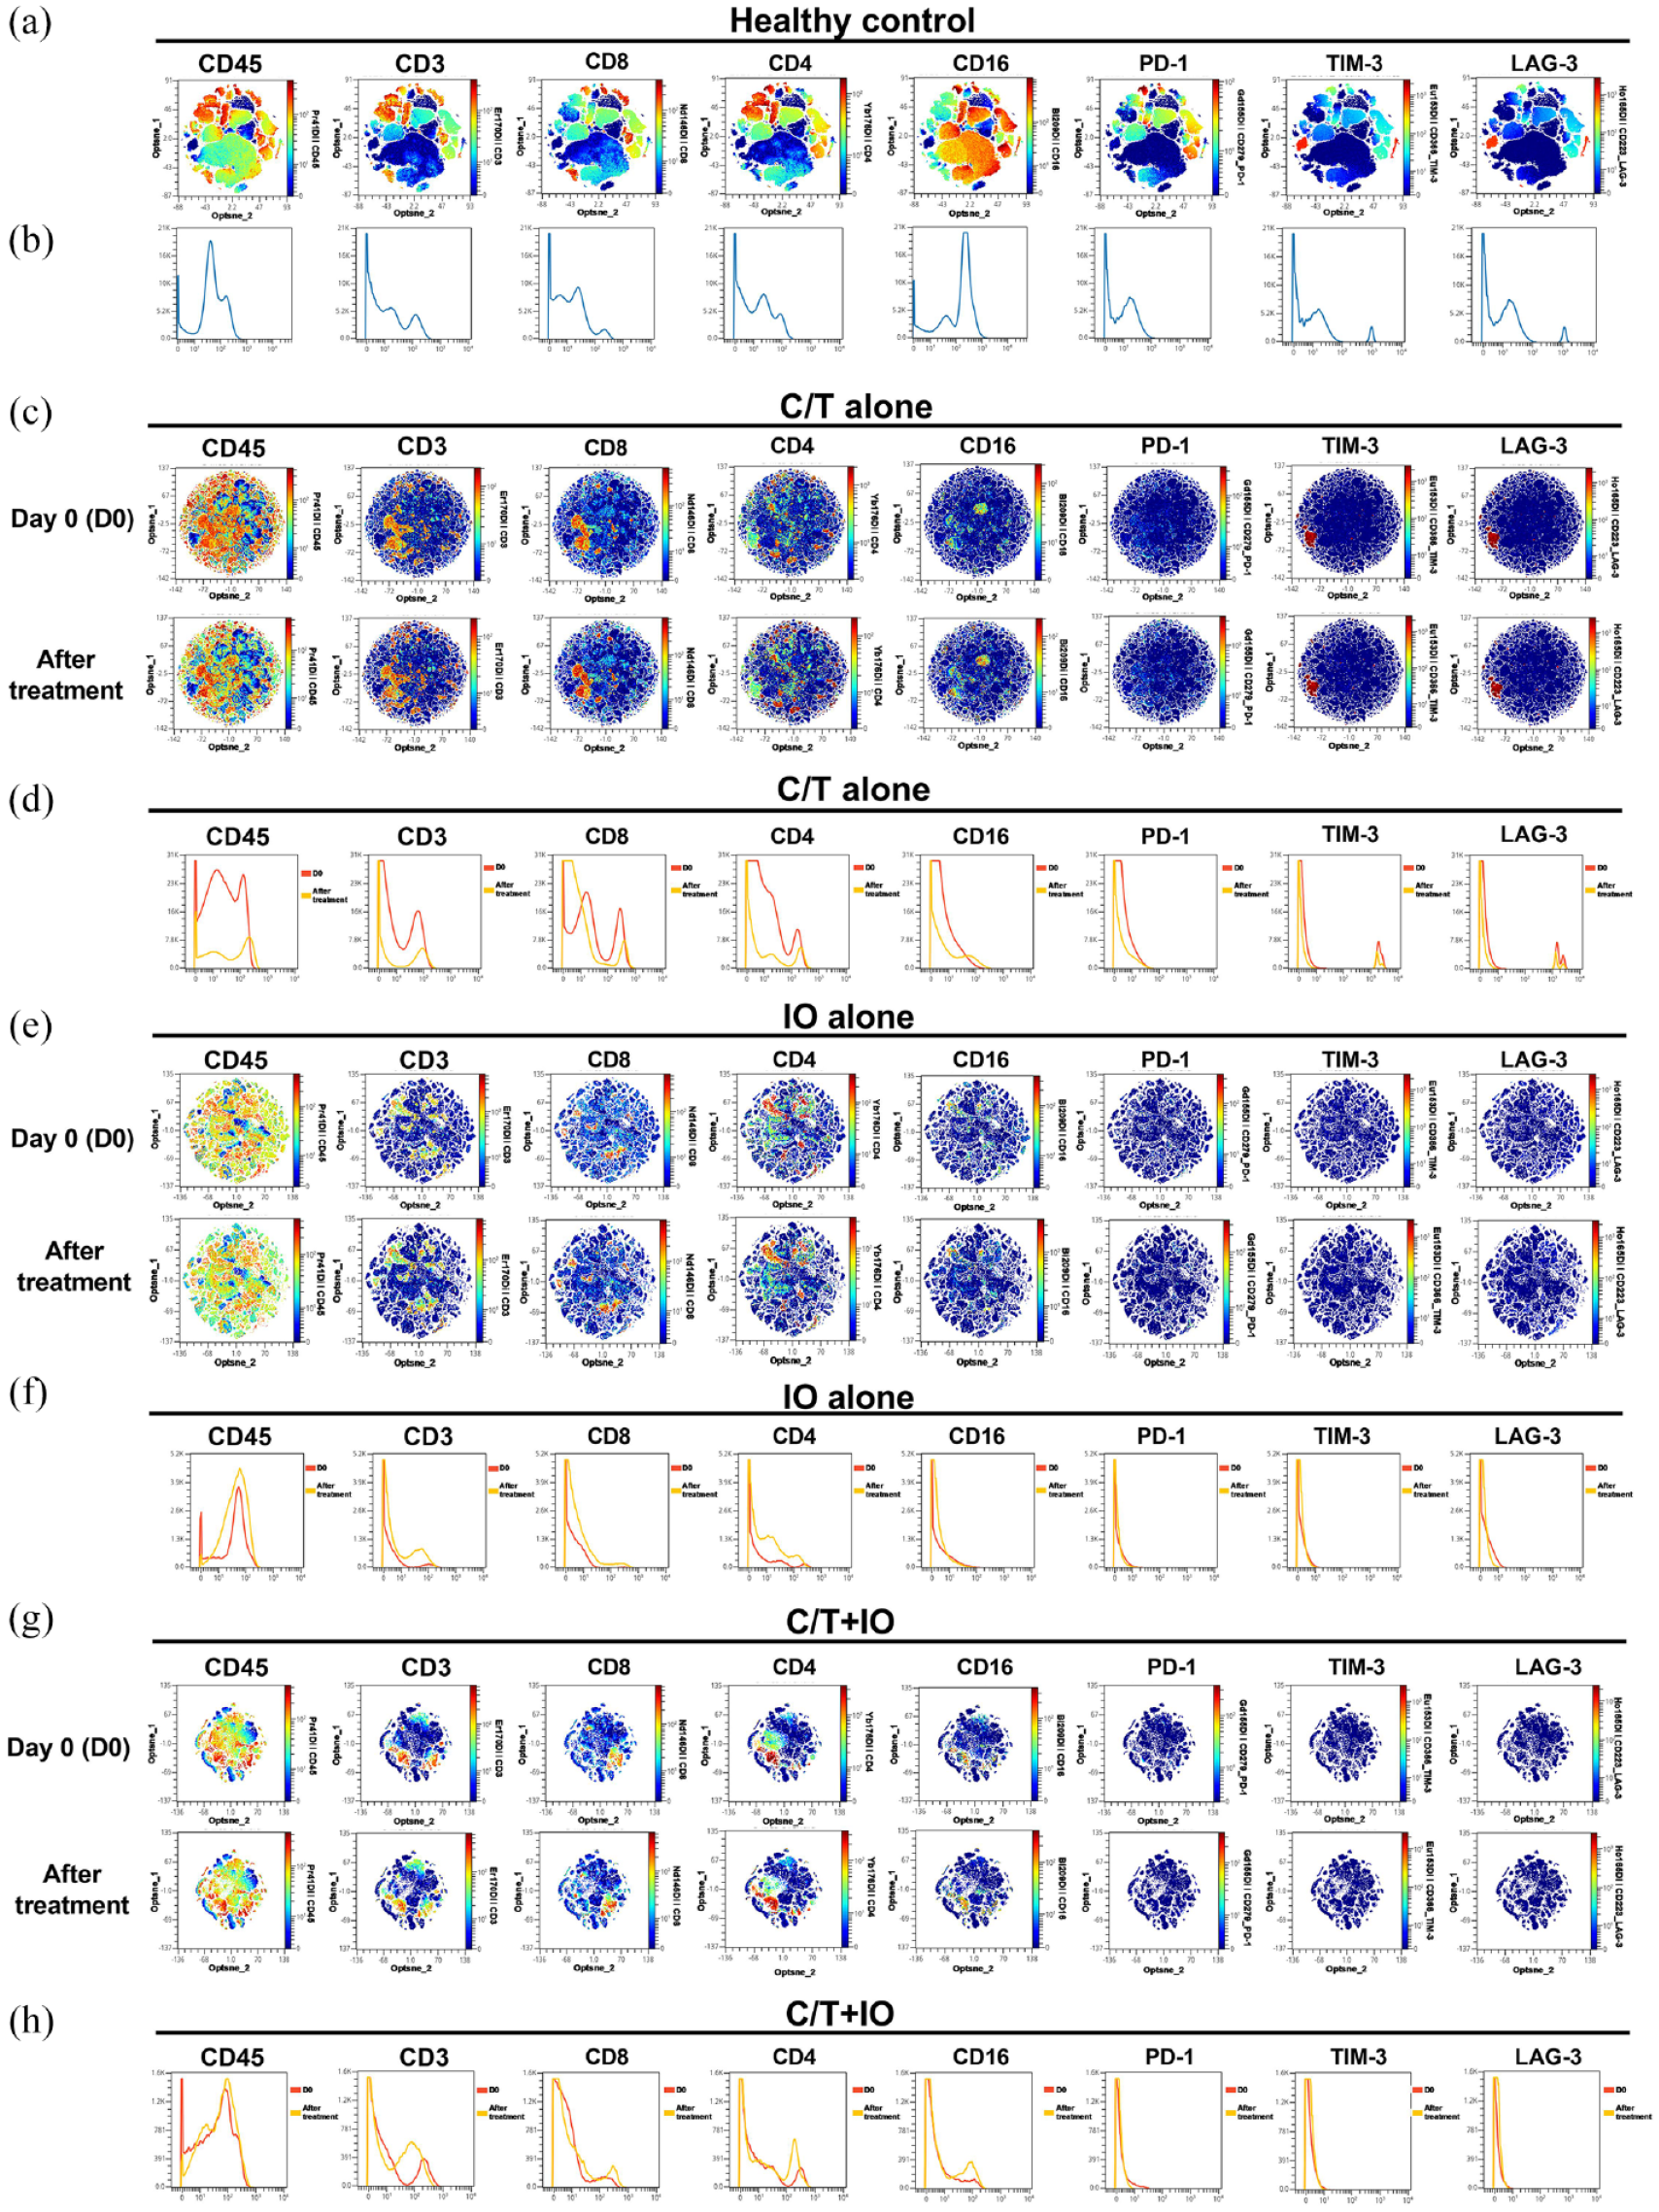
Analysis of immune signatures in peripheral blood using mass cytometry (CyTOF). (a, c, e, g) opt-SNE plots and (b, d, f, h) histograms show the expression patterns and changes of various immune markers (CD45, CD3, CD8, CD4, CD16, PD-1, TIM-3, LAG-3) in the PBMCs across healthy individuals (a, b) and the different treatment groups, including (c, d) C/T alone group, (e, f) IO alone group, and (g, h) combined C/T+IO group before and after treatment. In the opt-SNE plots, the colors range from blue (low expression) to red (high expression), indicating the distribution and expression levels of these markers. The histograms provide a detailed comparison of marker expression levels at baseline (D0, red line) and after treatment (yellow line).
To comprehensively illustrate these findings, this study employed spanning-tree progression analysis of density-normalized events (SPADE) analysis to cluster and visualize distinct immune cell subpopulations, including NK cells, CD8+ (cytotoxic) T cells, CD4+ T cells, B cells, and monocytes, across healthy individuals and the different treatment groups both before and after treatment (Figure 2(a), (c), (e), and (g)). In these panels, nodes represent different immune cell populations, such as NK cells, CD8+ T cells, CD4+ T cells, B cells, and monocytes. The size of each node is proportional to the number of cells in that population. Edges (the lines connecting the nodes) indicate relationships between populations, illustrating the connections between different cell groups and showing how their expression patterns of surface markers are functionally connected. The colors of nodes represent the expression levels of specific markers on the cells within that population. Red represents high expression levels and blue represents low expression level. Figure 2(b) shows the average percentage of the various immune cells in PBMCs between healthy individuals and all patients before treatment. Figure 2(d), (f), and (h) displays the average percentage of the various immune cells before and after treatment in the C/T alone group (Figure 2(d)), IO alone group (Figure 2(f)), and IO+C/T group (Figure 2(h)). Figure 2(a) shows a more balanced and diverse distribution of immune cells among healthy individuals compared to all patients before treatment. The edges in healthy controls are more evenly distributed, suggesting a more consistent relationship and functional connectivity among different immune cell populations compared to all patients before treatment. The CD8+ T cell and NK cell populations in all patients appear more prominent compared to the other immune cells populations, indicating an immune response or imbalance. The healthy controls exhibited higher proportions of CD8+ T cells and CD4+ T cells compared to all patients before treatment (p < 0.0001 and p < 0.001, respectively; Figure 2(b)). The C/T alone group demonstrates a prominent change in CD4+ T cell populations, with moderate changes in CD8+ T cell and NK cell populations after treatment (Figure 2(c)). The C/T alone group exhibits increased proportions of CD4+ T cells after treatment (p < 0.05; Figure 2(d)). The IO alone group shows prominent changes in NK cell and CD8+ T cell populations after treatment (Figure 2(e)). In Figure 2(f), the IO alone group demonstrated lower proportions of CD8+ T cells compared to healthy controls (p < 0.05) and revealed increased proportions of NK cells and CD8+ T cells after treatment (p < 0.001 and p < 0.0001, respectively). The C/T+IO group reveals a moderate change in CD4+ T cells (Figure 2(g)) and showed an increased proportion of CD4+ T cells after treatment (p < 0.01; Figure 2(h)).

Visualization of immune cell clustering and quantization via SPADE. The SPADE trees and bar graphs illustrate various immune cell subpopulations and percentages of different immune cells, including NK cells, CD8+ (cytotoxic) T cells, CD4+ T cells, B cells, and monocytes, in (a, b) healthy individuals compared to all patients before treatment and three treatment groups before and after treatment, including (c, d) C/T alone group, (e, f) IO alone group, and (g, h) combined C/T+IO group.
Immunophenotypic analysis of lymphocyte subpopulations before and after treatment
Immunophenotyping analysis of the various lymphocyte subpopulations was performed before and after different treatments (Figure 3). The cell counts per microliter of the lymphocyte subpopulations for each treatment group, including C/T alone, IO alone, and C/T+IO, are shown in Figure 3(a)–(c), (d)–(f), and (g)–(i), respectively. When stratified by the different exhausted T-cell subpopulations, the analysis reveals a significant decrease in cell levels of PD-1+CD8+ (cytotoxic) T cells in the IO alone group after treatment (p < 0.05; Figure 3(d)). However, the levels of PD-1+CD8+ T cells did not exhibit significant differences before and after treatment in either the C/T alone or C/T+IO groups (Figure 3(a) and (g)).
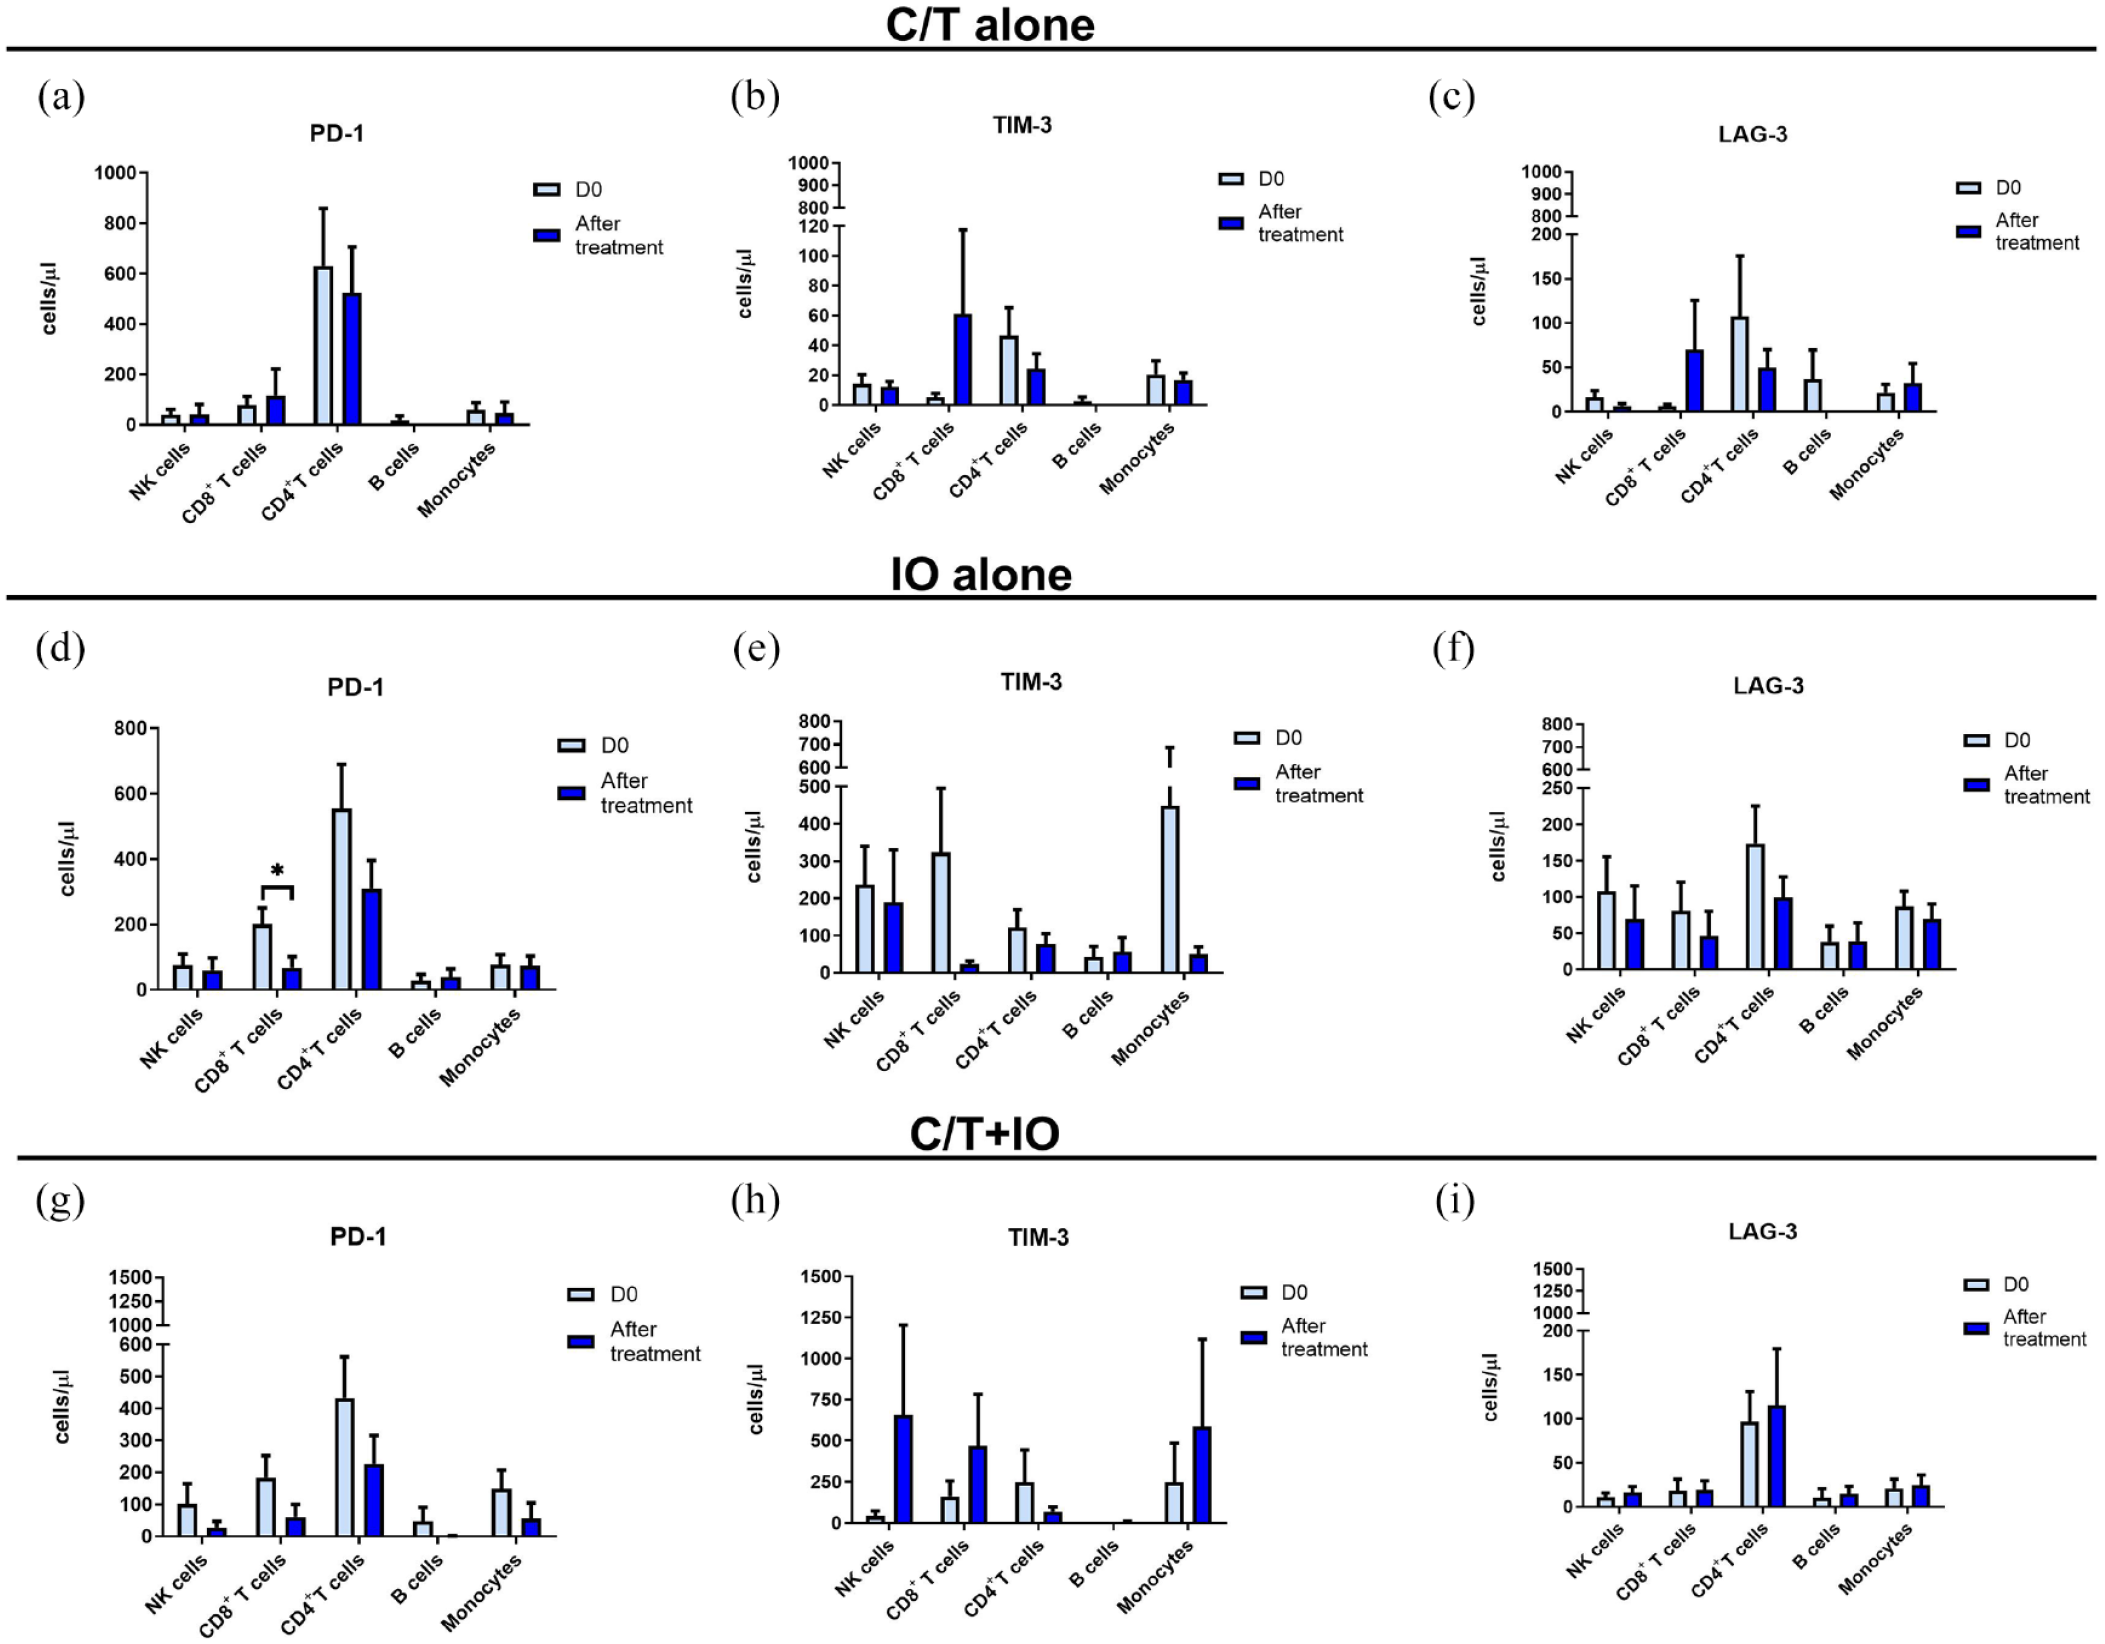
Cell levels of circulating lymphocyte subpopulation before and after treatment. Immunophenotyping analysis of PD-1+, TIM-3+, and LAG-3+ lymphocyte subpopulations before (D0) and after treatment showed the cell counts per microliter of lymphocyte subpopulations in different groups, including (a–c) the C/T alone group, (d–f) the IO alone group (*p < 0.05), and (g–i), the combined C/T+IO group.
The cell levels of different exhausted T cells (PD-1+ T cells, TIM-3+ T cells, and LAG-3+ T cells) before and after treatment in patients with or without treatment response (partial response) are shown in Figure 4. Figure 4 demonstrates the cell levels of different exhausted T cells before (D0) and after treatment in C/T alone (Figure 4(a)–(f)), IO alone (Figure 4(g)–(l)) and C/T+IO group (Figure 4(m)–(r)) with or without treatment response. In C/T alone group with treatment response (Figure 4(a), (c), and (e)), the cell levels of PD-1+CD8+ T cells, TIM-3+CD4+ T cells, and LAG-3+CD4+ T cells decreased after treatment (p < 0.05, p < 0.001 and p < 0.01, respectively). In C/T alone group without treatment response (Figure 4(b), (d), and (f)), the cell levels of PD-1+CD8+ T cells, TIM-3+CD8+ T cells, and LAG-3+CD8+ T cells increased after treatment (all p < 0.01). In IO alone group with treatment response (Figure 4(g), (i), and (k)), the cell levels of PD-1+CD8+ T cells (p < 0.0001), PD-1+CD4+ T cells (p < 0.01), TIM-3+CD8+ T cells (p < 0.05), LAG-3+ NK cells (p < 0.05), and LAG-3+CD8+ T cells (p < 0.05) decreased after treatment. In IO alone group without treatment response (Figure 4(h), (j), and (l)), the cell levels of TIM-3+CD8+ T cells decreased after treatment (p < 0.05). In C/T+IO group with treatment response (Figure 4(m), (o), and (q)), the cell levels of PD-1+CD8+ T cells decreased after treatment (p < 0.01). In C/T+IO group without treatment response (Figure 4(n), (p), and (r)), the cell levels of PD-1+ NK cells decreased after treatment (p < 0.01).

Cell levels of circulating lymphocyte subpopulation with or without treatment response. Immunophenotyping analysis of PD-1+, TIM-3+, and LAG-3+ lymphocyte subpopulations before (D0) and after different treatments showed the cell counts per microliter of lymphocyte subpopulations in three treatment groups with or without treatment response, including (a–f) C/T alone group, (g–l) IO alone group, and (m–r) the combined C/T+IO group.
Subgroup analysis was performed. Patients were divided into subgroups based on PD-L1 levels: less than 1%, between 1% and 49%, and greater than or equal to 50%, as well as subgroups based on whether they received radiotherapy, as shown in Supplemental Figures S1–S5. In IO alone group without treatment response (Supplemental Figure S3(I)), the cell levels of LAG-3+CD4+ T cells decreased after treatment in patients with PD-L1 levels greater than or equal to 50% (p < 0.05). Other subgroups did not show significant differences.
Survival analysis by different lymphocyte subpopulation
PFS analyses of different lymphocyte subpopulation showed no significant differences in PFS between patients with high versus low cell levels of PD-1+/TIM-3+/LAG-3+ CD8+ T cells, CD4+ T cells, or NK cells. OS analysis based on the cell levels of PD-1+/TIM-3+/LAG-3+ CD8+ T cells is shown in Figure 5 for the C/T alone, IO alone, and C/T+IO group. In IO alone group, patients with high cell levels of PD-1+CD8+ T cells before treatment had lower OS compared to those with low levels (p = 0.0159, Figure 5(d)). In C/T+IO group, patients with high cell levels of LAG-3+CD8+ T cells before treatment had lower OS compared to those with low levels (p = 0.0248, Figure 5(h)). There was no significant difference in OS between patients with high versus low cell levels of PD-1+/TIM-3+/LAG-3+ CD4+ T or NK cells.

Survival analysis by different lymphocyte subpopulation. Survival analysis of patients with high versus low cell levels of PD-1+, TIM-3+, and LAG-3+ CD8+ T cells in different groups, including (a–c) the C/T alone group, (d–f) the IO alone group, and (g–i) the combined C/T+IO group.
Subgroup analysis of OS was conducted. Patients were categorized based on PD-L1 levels into subgroups: less than 1%, between 1% and 49%, and greater than or equal to 50% (Supplemental Figures S6–S8). Additionally, they were grouped based on whether they received radiotherapy, as shown in Supplemental Figures S9 and S10. In the C/T+IO group, patients with PD-L1 level less than 1% and high cell levels of LAG-3+CD8+ T cells before treatment had lower OS compared to those with low levels (p = 0.0246, Supplemental Figure S6(H)). In IO alone group, patients with high pre-treatment levels of PD-1+CD8+ T cells who did not receive radiotherapy had lower OS compared to those with low levels (p = 0.0266, Supplemental Figure S10(D)). Other subgroups did not show significant differences.
Analysis of cytokine profiles by treatment groups
Cytokine profiles were compared between the different treatment groups to understand the interaction between the various treatments and cytokine responses. The levels of cytokines, including IL-2, IL-6, IL-10, TNF-α, and IFN-γ, were quantified by ELISA in peripheral blood at baseline (D0) and after treatment (D8) for the three treatment groups (Figure 6). In the C/T+IO group, IL-2 significantly decreased from baseline after treatment (p < 0.01; Figure 6(a)). TNF-α levels showed distinct changes between the IO alone and C/T alone groups (Figure 6(g) and (h)). Specifically, TNF-α significantly increased after IO alone treatment (p < 0.05) but decreased significantly after C/T alone treatment (p < 0.01). Figure 6(h) plots the log2 fold changes in cytokine concentrations on D8 compared to baseline on D0 in different treatment groups. The log2 fold change in TNF-α was higher in the IO alone group compared to the C/T alone group (p < 0.05). These findings indicate that IO alone, C/T alone, and C/T+IO treatment have differential effects on IL-2 and TNF-α responses.

Analysis of cytokine profiles by treatment groups. Circulating cytokines consisting of the levels of IL-2 (a), IL-6 (c), IL-10 (e), TNF-α (g), and IFN-γ (i) were analyzed in different treatment groups before (D0) and after treatment (D8), including IO alone group, C/T alone group, and the combined C/T+IO group. (b, d, f, h, j) The changes of cytokine levels were demonstrated by using log2 fold change in the concentration of various cytokines in D8 compared with that in D0.
Discussion
The present immunophenotypic investigation prospectively enrolled advanced NSCLC patients who received PD-1/L1 inhibitors and circulating immune cells before and after ICIs and/or C/T were collected to evaluate whether the treatment efficacy is related to the exhaustive immune system by using mass cytometry. Our findings revealed that responders to C/T alone treatment showed decreases in cell levels of exhausted T cell subtypes, including PD-1+CD8+, TIM-3+CD4+, and LAG-3+CD4+ T cells after treatment. Similarly, IO alone responders demonstrated reduced cell levels of exhausted T cell populations such as PD-1+CD8+/CD4+ T cells, and LAG-3+NK/CD8+ T cells post-treatment. Patients not responding to C/T alone treatment showed increased exhausted T cells like PD-1+CD8+, TIM-3+CD8+, and LAG-3+CD8+ T cells. For those not responding to C/T+IO treatment, a decrease in PD-1+ NK cells was the sole significant change. Moreover, circulating TNF-α exhibited a significant increase after IO alone treatment, contrasting with a significant decrease in TNF-α levels following C/T alone. These findings demonstrate the variability in immune responses based on treatment types. Treatment response was associated with declines in specific exhausted T cell levels across the groups, whereas non-response correlated with increases or no change in exhausted T cell populations. In addition, high PD-1+CD8+ T cells or LAG-3+CD8+ T cells were associated with lower survival after IO or C/T+IO treatment. Overall, IO contributes to therapeutical efficacy by reducing circulating exhausted T cells, which were associated with worse survival and increasing the levels of TNF-α. These results highlight the potential prognostic value of tracking changes in circulating exhausted T cells to predict treatment response and survival outcome in patients with advanced lung cancer.
CyTOF enabled immune profiling and quantification of changes in circulating immune cell subsets before and after treatment with IO and/or C/T. 25 Our study revealed that increased proportions of NK cells and CD8+ (cytotoxic) T cells after treatment were found in the IO alone group. However, analysis of various exhausted T-cell subpopulations shows a decrease in PD-1+CD8+ T cells, which was correlated with therapeutical response following IO alone treatment, indicating that IO may expand cytotoxic T cells while reducing exhausted T cells, which could contribute to achieving treatment efficacy. Furthermore, that responders to IO alone treatment demonstrated a decrease in cell levels of PD-1+CD4+ T cells after treatment. CD4+ T cells can exhibit direct cytotoxicity to tumor cells or act indirectly, either by inhibiting tumor angiogenesis or by activating innate immune cells. 26 High PD-1 expression on CD4+ T cells has been correlated with poor clinical outcomes in patients with NSCLC. 27 T cell exhaustion is widely considered a major contributor to ineffective antitumor immunity. Elucidating the precise factors driving exhaustion versus the downstream impacts on antitumor responses will be important to develop strategies to restore T cell function in cancer. 28
T cell exhaustion is accompanied by a progressive increase in the amount and diversity of inhibitory receptors that are expressed, including PD-1, TIM-3, and LAG-3.4,29–33 Studies have shown that PD-1, TIM-3, and LAG-3 play an inhibitory role in T cell responses,4,30,31 and the upregulation of these receptors has been observed on exhausted T cells in tumors.4,14,29,31,34 TIM-3 is a checkpoint receptor expressed by a wide variety of immune cells. Co-blockade of TIM-3 and PD-1 can lead to reduced tumor progression in preclinical models and can facilitate antitumor T-cell responses in cancer patients. 35 LAG-3 is an inhibitory ligand that reduces T cell activation by blocking CD4 contact sites on MHC class II proteins and is expressed on activated T cells and Treg cells. 36 LAG3 is a marker of T cell exhaustion, which portends a poorer prognosis when expressed on tumor-infiltrating lymphocytes. 36 Blockade of additional immune checkpoint receptors including TIM-3, and LAG-3 expressed on T cells infiltrating tumors may improve the antitumor efficacy of therapies targeting the PD-1/PD-L1 axis. 28 Our findings showed that in the C/T alone group with treatment response, the cell levels of PD-1+CD8+ T cells, TIM-3+CD4+ T cells, and LAG-3+CD4+ T cells decreased after treatment. However, in the C/T alone group without treatment response, the cell levels of PD-1+CD8+ T cells, TIM-3+CD8+ T cells, and LAG-3+CD8+ T cells increased after treatment. In the IO alone group with treatment response, the cell levels of PD-1+CD8+ T cells, TIM-3+CD8+ T cells, and LAG-3+CD8+ T cells decreased after treatment. But in the IO alone group without treatment response, the cell levels of TIM-3+CD8+ T cells also decreased after treatment, and the cell levels of LAG-3+CD4+ T cells decreased after treatment in patients with PD-L1 levels greater than or equal to 50%, implying that changes in exhausted T cells may be associated with IO response in patients with high PD-L1 expression. Collectively, specific exhausted T cells with PD-1, TIM-3, and LAG-3 expression showed the correlation with treatment response.
ICIs in combination with C/T are now one of the standard frontline treatments for advanced NSCLC based on data from phase III clinical trials.8–10 By identifying PD-1 as a marker for exhausted CD8+ T cells within tumors, several C/T agents have demonstrated effectiveness in diminishing T cell exhaustion in preclinical tumor models.37,38 In our study, the C/T alone and C/T+IO group with treatment response showed that the cell level of PD-1+CD8+ T cells decreased after treatment. Incorporating C/T could potentially enhance the efficacy of ICIs by decreasing antigenic load, an important factor contributing to T cell exhaustion. 27
Reversal of the T cell exhaustion pathway has been reported to impair T cell persistence in some contexts, adding another layer of complexity.39,40 Our study revealed that within the IO alone group, patients with higher levels of PD-1+CD8+ T cells before treatment experienced lower OS than those with lower levels, and this effect was also observed in patients who did not receive radiotherapy, suggesting that radiotherapy may influence the outcome of IO. In the C/T+IO group, patients with higher levels of LAG-3+CD8+ T cells before treatment had reduced OS compared to those with lower levels, and this effect was also found in patients with PD-L1 level less than 1%, indicating that PD-L1 levels may impact the effectiveness of IO. Given this, the promising approach to enhance cancer IO efficacy may be strategies preventing the development of exhaustion, rather than trying to reverse established exhaustion. 28
As cancer progresses and T cell stimulation continues, T cells lose effector functions and become exhausted. Generally, functions including IL-2 production, cytokine polyfunctionality, and high proliferative capacity, are lost early; this is followed by defects in the generation of TNF-α, IFN-γ, and chemokines, as well as in degranulation.29,41 In our cytokine analysis, treatment with IO alone led to a significant increase in TNF-α levels but did not impact IL-2 levels. IO alone treatment resulted in a greater change in TNF-α levels compared to C/T alone. Elevated circulating TNF-α levels have been associated with enhanced response to PD-1 blockade IO and prolonged OS in NSCLC. Therefore, TNF-α may serve as a biomarker for tracking the IO efficacy.
NK cells are critical for antibody-dependent cell-mediated cytotoxicity, an important mechanism for eliminating tumor cells. 42 NK cells have cytotoxic functions but also produce proinflammatory cytokines such as TNF-α and IFN-γ. 43 Our findings revealed an increase in the proportion of circulating NK cells and TNF-α levels following IO alone treatment and a decrease in the levels of LAG-3+ NK cells after treatment among patients who responded to IO alone. Studies have shown that increased infiltration of NK cells into tumor tissue is associated with improved OS in advanced lung cancer.44–46 Moreover, elevated peripheral NK cells has been correlated with a decreased incidence of carcinoma.43,45 In a preclinical study, knockout of LAG-3 gene resulted in decreased NK cell activity. 47 Therapeutic blockade of LAG-3, which interacts with both NK and T cells, in combination with PD-1 inhibitors is currently under investigation in early phase trials. 48
There are some limitations in this study. First, the study cohort was relatively small and may have limited generalizability as it was from a single tertiary center. However, the prospective approach of this study allowed for detailed, consistent data collection and thorough analysis within a controlled environment, ensuring the reliability of our findings within the context of our specific patient population. Second, this study utilized blood samples collected the day before systemic treatment and on the eighth day after. The monitoring time was not extensive, so the optimal monitoring timeframe for immunophenotyping analysis remains to be established by future studies. Third, several patients received previous cancer treatment before enrolment, which could have influenced the different expression patterns of CyTOF markers compared to those seen in healthy controls. Despite these limitations, our findings contribute meaningful insights into the treatment responses in NSCLC patients, particularly in the context of IO. The identification of immune biomarkers in this study, such as the decline in circulating exhausted T cells and the increase in TNF-α levels, offers promising prognostic indicators for the efficacy of IO. These results highlight the potential for personalized IO strategies and necessitate further validation in larger, multicenter studies.
Conclusion
Our data indicate that treatment responses in NSCLC across the groups were correlated with declines in circulating exhausted T cells, including PD-1+CD8+ T cells, PD-1+CD4+ T cells, TIM-3+CD4+ T cells, LAG-3+CD8+ T cells, and LAG-3+CD4+ T cells, which might emerge as potential circulating immune biomarkers to predict the efficacy of IO. Circulating TNF-α levels showed a significant increase following IO alone treatment. PD-1/L1 inhibitors may enhance antitumor immunity via the regulation of different types of exhausted T cells and TNF-α levels. In conclusion, IO may achieve therapeutical efficacy by decreasing circulating exhausted T cells, which were linked to lower survival, while also increasing TNF-α levels. These findings underscore the prognostic potential of monitoring changes in circulating exhausted T cell populations to predict treatment response and survival outcomes in patients with advanced lung cancer. Further research is warranted to better understand the relationship between the wide spectrum of circulating lymphocyte subpopulations and response to IO.
Supplemental Material
sj-docx-1-tam-10.1177_17588359241284946 – Supplemental material for Immune signatures of patients with advanced non-small-cell lung cancer for efficacy prediction after immunotherapy
Supplemental material, sj-docx-1-tam-10.1177_17588359241284946 for Immune signatures of patients with advanced non-small-cell lung cancer for efficacy prediction after immunotherapy by Yung-Hung Luo, Chia-I Shen, Chi-Lu Chiang and Yuh-Min Chen in Therapeutic Advances in Medical Oncology
Supplemental Material
sj-docx-2-tam-10.1177_17588359241284946 – Supplemental material for Immune signatures of patients with advanced non-small-cell lung cancer for efficacy prediction after immunotherapy
Supplemental material, sj-docx-2-tam-10.1177_17588359241284946 for Immune signatures of patients with advanced non-small-cell lung cancer for efficacy prediction after immunotherapy by Yung-Hung Luo, Chia-I Shen, Chi-Lu Chiang and Yuh-Min Chen in Therapeutic Advances in Medical Oncology
Footnotes
Appendix
Acknowledgements
The authors express their gratitude to the patients and their families for their valuable contributions, as well as to the investigators for their generous assistance with this research.
Declarations
Supplemental material
Supplemental material for this article is available online.
References
Supplementary Material
Please find the following supplemental material available below.
For Open Access articles published under a Creative Commons License, all supplemental material carries the same license as the article it is associated with.
For non-Open Access articles published, all supplemental material carries a non-exclusive license, and permission requests for re-use of supplemental material or any part of supplemental material shall be sent directly to the copyright owner as specified in the copyright notice associated with the article.