
Abstract
Background:
Serial analysis of circulating tumor DNA (ctDNA) levels is a promising tool for both relapse prediction in the curative setting, as well as predicting clinical benefit from systemic treatment in metastasic colorectal cancer (mCRC). Most data in this context are derived from treatment naive patients.
Objective:
To predict progressive disease (PD) as early as possible through monitoring of changes in ctDNA levels during systemic treatment in pretreated patients with mCRC.
Design:
A prospective, single-center, observational study.
Methods:
Patients treated beyond first-line were prospectively included between February 2020 and September 2021. Blood for ctDNA detection was taken before every treatment cycle from start of treatment until first restaging by CT-scan. ctDNA was detected by mutation- (mut-ctDNA) and methylation-specific ddPCR. Receiver Operating Characteristic (ROC)-analysis was used to describe sensitivity and specificity for prediction of PD at restaging for all time points.
Results:
A total of 42 patients were included who all carried a mutation in tumor tissue. Detection rate of mut-ctDNA was 88.1% and 74.4% for meth-ctDNA. Absolute ctDNA levels before treatment were prognostic in terms of overall survival. Levels of ctDNA were significantly higher in patients with PD at restaging. Median time from start of treatment to restaging was 93 days (95% CI 88.8–96). After a median of 19 days of treatment (95% CI 16.1–20.2), a decline of either mutation- or methylation-specific ctDNA levels of ⩽58% predicted PD at restaging with a sensitivity/specificity of 92.9/85.7% and 85.7/100%, respectively. Median time to restaging was 66 days (95% CI 56.8–75.2). There was no significant increase of sensitivity/specificity at later time points of ctDNA measurements.
Conclusion:
Monitoring early changes of ctDNA levels either by mut- or meth-ctDNA allows for early prediction of PD in pretreated patients with mCRC. This has the potential to complement RECIST-based treatment assessment with the aim to switch potentially insufficient treatments as early as possible, which is of particular interest in higher treatment lines.
Introduction
Colorectal cancer (CRC) is the fifth leading newly diagnosed tumor entity worldwide in 2020 and accounts for approximately 10% of all cancer-related deaths.1,2 Synchronous dissemination is observed in 20% of patients, and a further 25% of patients will develop metachronous metastases during the course of disease. 3 The mainstay of treatment in metastatic CRC (mCRC) is still chemotherapy in combination with monoclonal antibodies. Despite improvement in treatment over the last years, overall survival (OS) remains below 36 months.1,4,5 Maximizing clinical outcome by using biomarkers for individualization of treatment selection is almost exclusively limited to the first-line setting. It has been shown that sidedness of the primary tumor, RAS- and BRAF mutational status, microsatellite status, as well as multimodal treatment approaches including resection of metastases can be applied as treatment decisions in the first-line setting.2,6–10 Such highly stratified treatment decisions are not possible to a comparable extent in the context of second- and higher-treatment lines and additional factors such as quality of life and tumor control gain increasing importance for treatment decisions compared to response and toxicity. 11 Prediction of clinical benefit is therefore of special interest in this setting, and the lack of corresponding biomarkers could be overcome by treatment monitoring to estimate prediction of outcome to systemic treatment in advance. This issue has been mostly addressed for the first-line setting, thus far by applying a variety of methods including imaging and novel biomarkers like micro-RNA.12–15 Recently, this armamentarium of prognostic/predictive biomarkers has been complemented by the measurement of circulating tumor DNA (ctDNA) in peripheral blood.
Circulating tumor DNA derives from the apoptotic/necrotic cell turnover of cancer cells. The specific genetic profile of ctDNA corresponds to the profile of the cancer cell from which it was derived. Moreover, it is representative for the entire tumor genome.16–18 In metastatic CRC, it is considered to be a promising biomarker representing tumor burden irrespective of tumor stage. It is also of potential prognostic value when detectable prior to treatment initiation.16,19,20 Representing a subset (approximately <1%) of cell-free DNA (cfDNA), detection rates for ctDNA using liquid biopsy in CRC vary from 50% (localized) to about 90% in metastasized disease depending on the tumor stage. 16 The ideal method for detection of ctDNA should include both high sensitivity/specificity and a turnaround time that does not lead to an inacceptable delay of treatment start.
In mCRC, the dynamics of ctDNA during systemic treatment have been scarcely investigated. However, data describing the potential use of ctDNA-dynamics in the first-line setting for either tissue-informed mutation- or Neuropeptide Y (NPY)-methylation-specific detection of ctDNA are promising as ctDNA sampling performed at baseline and at one additional time point at treatment cycle two or three showed a positive correlation of the magnitude of reduction of ctDNA levels and progression-free survival (PFS).21–23 In recent years, mutation-independent, methylation-specific ctDNA detection has been increasingly been investigated as alternative method. Promoter regions of WNT-Inhibitory-Factor 1 (WIF-1) and NPY have been found to be frequently mutated in CRC, which makes these genes suitable candidates for this purpose.24,25
The aim of our study was to evaluate the serial dynamics of ctDNA during second- or higher treatment lines in mCRC in order to determine the earliest time point predicting a potential clinical benefit in terms of progressive disease (PD) or stabilization/remission in terms of a clinical benefit (CB) at restaging. Additionally, we compared the sensitivity and specificity of single-mutation-specific (mut-ctDNA) and methylation-specific ctDNA (meth-ctDNA) detection for that purpose.
Material and methods
Patients
A total of 42 patients receiving palliative chemotherapy after first-line treatment for mCRC at our oncological center between February 2020 and September 2021 were prospectively included in this study. Study participation did not affect the treatment decisions, which were blinded to study results. Clinical and follow-up data were obtained from the prospective cancer registry of the hospital.
Mutation analysis of tumor tissue
Tumor tissue was analyzed at first diagnosis. Formalin-fixed and paraffin-embedded (FFPE) tissue was used for genetic analysis with AmpliSeq Cancer Hotspot NGS Panel v2 (Illumina, San Diego, CA, USA). The panel detects single nucleotide variants (SNVs) and indels in hotspot regions of 50 genes (including KRAS, BRAF, NRAS, and TP53).
Mutations, plasma collection, and processing
Pretherapeutic plasma samples for the liquid biopsy analysis were collected from all 42 patients on the day before treatment initiation and at every treatment cycle thereafter until restaging, which was done by CT scan. A total of 28.5 mL of blood was drawn using cfDNA collection tubes (Roche, Basel, Switzerland). After centrifugation at 200g for 10 min, the supernatant was transferred into new 15 mL tubes (Sarstedt, Nümbrecht, Germany). Another centrifugation at 1500g for 10 min resulted in 10 mL plasma, which was then again transferred into a new 15 mL tube. Storage was at −20°C until the DNA was prepared.
Processing of circulating cfDNA
Circulating cfDNA preparation was done with 10 mL of plasma on the Chemagic 360 (Perkin Elmer, Waltham, MA, USA) using the kit CMG-1304 (Perkin Elmer, Waltham, MA, USA) according to the manufacturer’s instructions. DNA elution was prepared with a 70-µL elution buffer CMG-844 (Perkin Elmer, Waltham, MA, USA) resulting in a DNA volume of 40–50 µL (natural loss as residual liquid in the beads). Quantification was done using the Quantus fluorometer (Promega, Madison, WI, USA). Samples were stored at 4°C until the next use.
Detection of ctDNA
The QX200™ Droplet Digital™ PCR System from Bio-Rad (Bio-Rad Laboratories, Hercules, CA, USA) was used for detection of patient-specific mutations and WIF1 or NPY promoter hypermethylation detection.
Patient-specific mutations found by NGS analysis were detected using either one of the commercially available screening kits for KRAS G12/G13, KRAS Q61, NRAS G12/G13, NRAS Q61 or BRAF V600 or single-mutation detection assays (Bio-Rad Laboratories, Hercules, California, United States of America). For single-mutation detection assays were ordered using the proprietary online tool of the manufacturer. All mutations were confirmed in a DNA sample extracted from FFPE tumor tissue and, if positive, tested in the cfDNA. The sensitivity of the assay ranges from 0.13% to 0.17%. This sensitivity value is the average theoretical sensitivity calculated for each sample individually: 3/total copies × 100.
Analyses were performed as described by the provider. Duplicate reactions (20 µL each) were performed for every sample. For tumor samples, 10 ng of DNA per replicate was used. For cfDNA samples, 5 ng of cfDNA was screened per reaction whenever possible; otherwise, the maximum possible volume (19.2 µL) of cfDNA was utilized. Data analysis was performed using the QuantaSoft™ Analysis Pro software (version 1.0.596, Bio-Rad Laboratories). A sample was considered positive if three or more mutant droplets were detected. For quantitation of the mutant allele frequency (MAF), the fractional abundance value calculated by the software was used. For every patient the first, last, and the sample with the highest cfDNA yield were screened for the mutation. If one of those samples showed a positive result, all samples of the respective case were analyzed, otherwise the patient was considered negative.
WIF1 or NPY promoter hypermethylation detection was performed based on published protocols.24,26–28 Bisulfite conversion with the EZ methylation Lightning kit (Zymo Research, Irvine, CA, USA) was conducted according to the manufacturer’s instructions. As control for general DNA quantification a probe targeting C-LESS-C1 as described by Yu et al. was used. 29 Each assay consisted of a primer pair and a VIC-labeled probe targeting C-LESS-C1 as well as a primer pair and a FAM-labeled probe targeting WIF1 or NPY. All primers were ordered in standard quality (Metabion, Planegg, Germany), whereas the probes were purchased as TaqMan® MGB probes with a 5′ fluorescent label (Thermo Fisher Scientific, Waltham, MA, USA). The sequences of all probes can be found in Supplemental Table 2. Probes and primers for WIF1 or NPY and C-LESS-C1, respectively, were combined to a 20× concentrated master mix consisting of 18 µM of each primer and 5 µM of each probe. For PCR preparation and droplet generation, the manufacturer’s instruction was followed, and the same principles as for mutation detection were applied (two replicates with in total 20 ng for tumor DNA samples and 10 ng or 19.2 µL DNA for cfDNA specimen). All reactions were cycled with an initial denaturation step at 95°C for 10 min followed by 40 cycles of amplification (94°C for 15 s and 60°C for 1 min), a final inactivation step at 98°C for 10 min and hold at 4°C. For evaluation again, the QuantaSoft™ Analysis Pro software was utilized (Bio-Rad Laboratories, Hercules, California, United States of America). The degree of promoter hypermethylation of ctDNA was calculated by dividing the total measured cfDNA concentration determined by C-LESS-C1 by the fraction of WIF1 or NPY promoter hypermethylation-positive cfDNA. Positivity was defined again with a threshold of three positive droplets. Similar to mutation detection, the first, last, and the sample with the highest cfDNA yield of each patient were screened for WIF1 promoter hypermethylation. If at least one of those samples showed a positive result, all remaining samples of the patient were analyzed. In case of a negative results, the samples were screened for NPY hypermethylation in the same manner. In case of a negative result for both assays, the whole sample series was assumed negative. The sensitivity of the assay ranges from 0.2% to 0.5% as determined in a dilution series and a panel of normal-controls with similar properties compared to the actual sample.
Radiological analysis
All radiologic analyses, including staging and restaging, were performed by the same specialized radiologist who was blinded to treatment, laboratory, or outcome results. Evaluated images were contrast enhanced dual-energy CT scans in the arterial and portal venous phase prior to treatment initiation and at restaging using Syngo.via (Siemens Healthcare, Forchheim, Germany). Semiautomated lesion detection of the respective organ was used in MM Oncology Workflow mode of Syngo.via. If the software failed to define the lesion margin properly, manual correction was applied. All pathological solid organ lesions were included in the calculations of the total tumor volume and sum of the largest tumor diameter assessment regardless of their size. Adhering to RECIST criteria, pathological lymph nodes were only included when the short axis exceeded 10 mm in size.
Statistics
All statistical analyses were performed using the software R version 4.1.2. Survival analyses, Kaplan–Meier curves, and log-rank tests were done by the functions survfit, survdiff, and coxph from R survival package, respectively. OS was defined as the time from treatment initiation to death. ctDNA/methylation kinetics as an individual’s change of MAF or hypermethylated DNA fraction (HDF) over time were defined as the quotients of MAF/HDF after 2 weeks, 4 weeks, and so on until restaging respectively divided by its baseline value (time point 1), which thereby served as 100% reference. Area under the curve (AUC) analyses were run by the function roc (R package pROC). To identify the best cutoff in AUC analysis, the point closest to the top-left part of the plot (best combination of sensitivity and specificity) was chosen. A two-sided level of significance of 5% and 95% confidence intervals were used. PFS was defined from start of treatment to progress or dead.
Results
Characteristics of the patients
From February 2020 to September 2021, 42 patients with pretreated mCRC were included in the trial at start of systemic treatment. Characteristics of these patients is provided in Table 1. All patients progressed at least on first-line treatment and were started with second-line treatment or higher. The majority of patients were included starting with second-line treatment (54.8%), followed by third-line (31%), fourth-line (11.9%), and fifth-line of treatment (2.4%). Male patients were more frequent than female patients (61.9 versus 38.1%). Median age was 63 years (IQR 55.50, 69.75). Most patients had liver metastasis (78.6%), and at least 50% of the patients had metastatic involvement of liver and lung.
Patients.
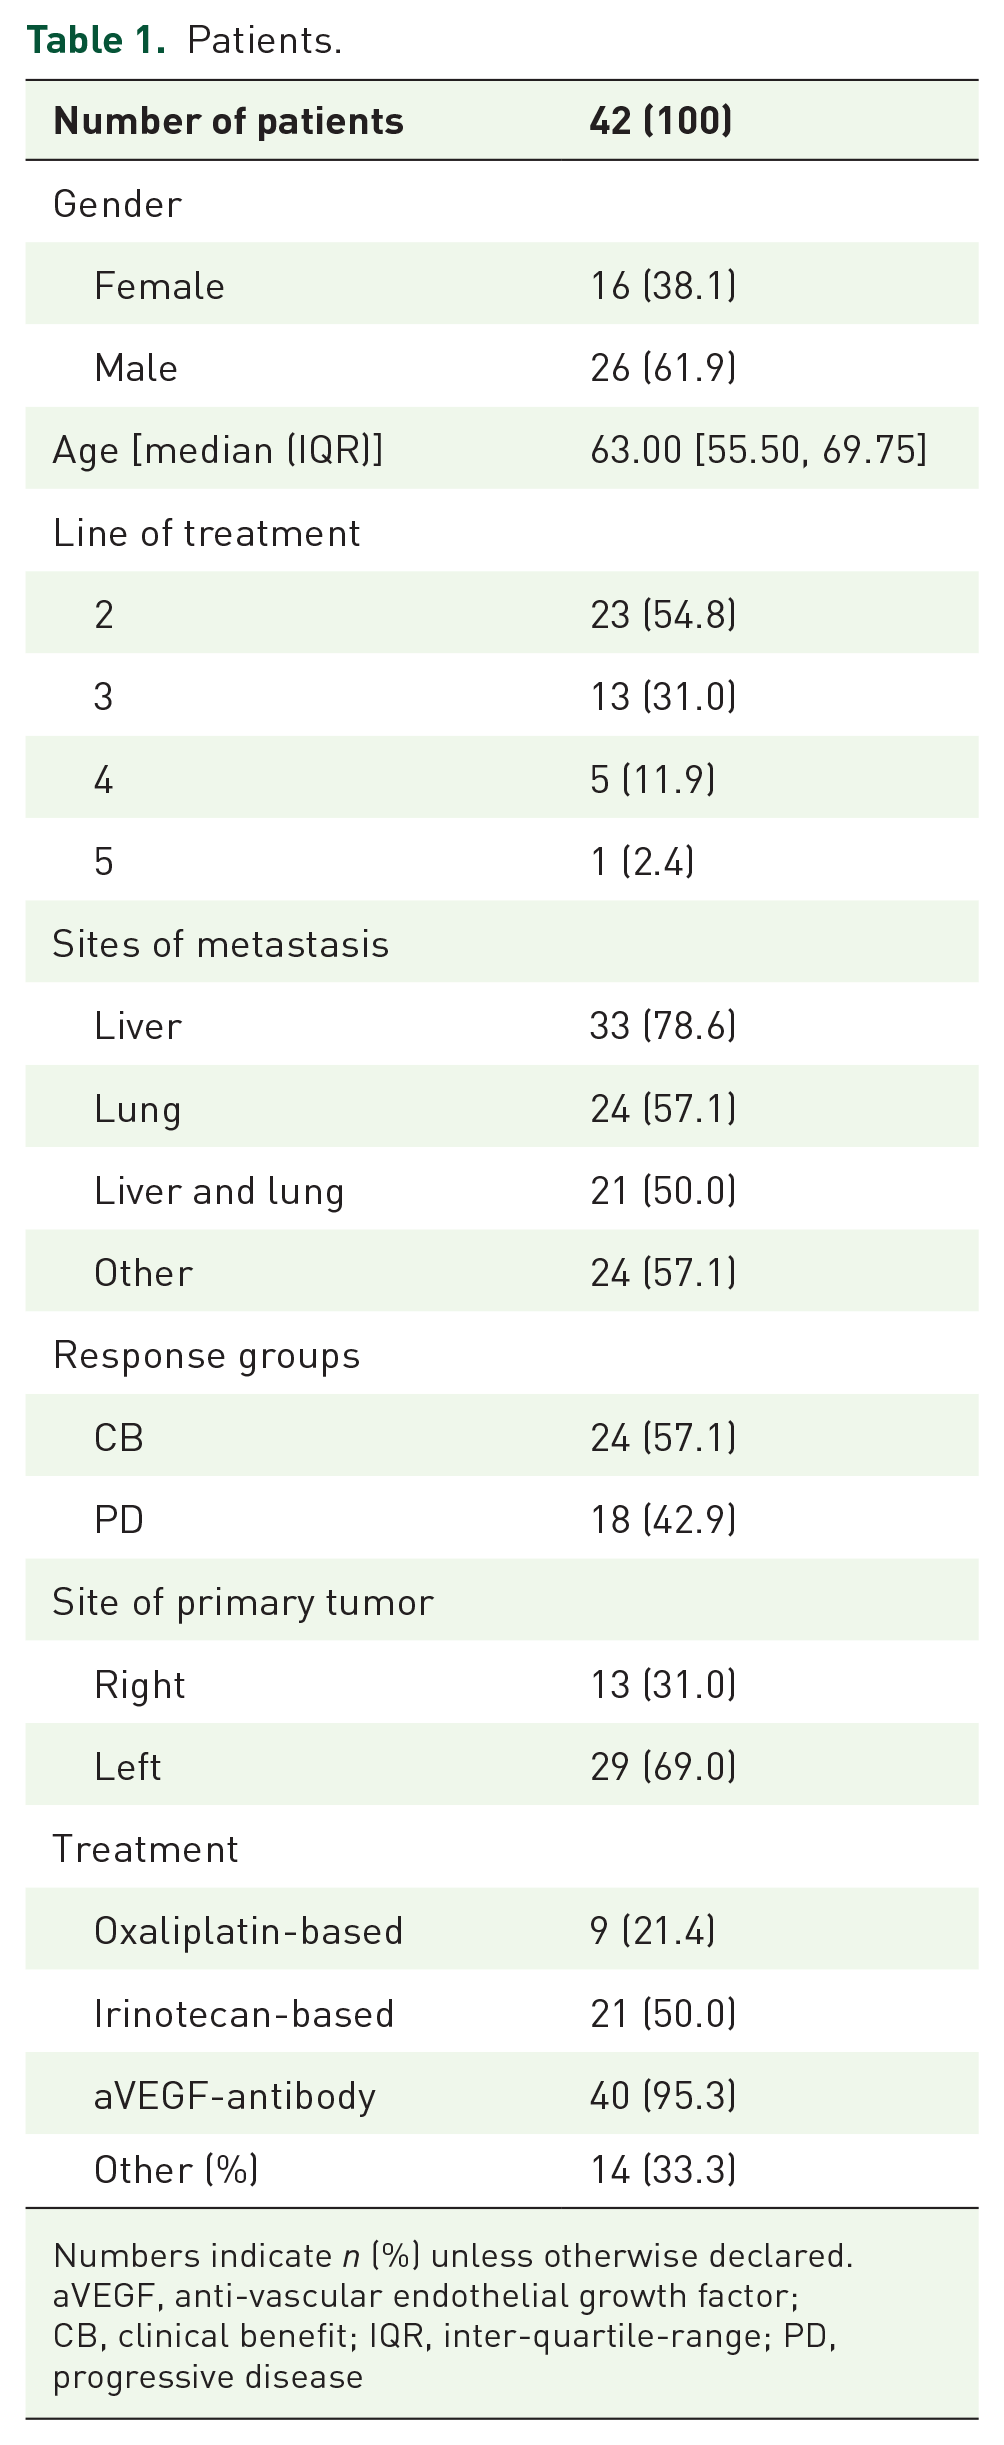
Numbers indicate n (%) unless otherwise declared.
aVEGF, anti-vascular endothelial growth factor; CB, clinical benefit; IQR, inter-quartile-range; PD, progressive disease
The left-sided primary tumor was more common than the right-sided (69.0% versus 31%). Patients were most frequently treated by irinotecan-based therapy (50%) in combination with a VEGF-antibody (95.4%). A proportion of 33.3% received other treatments including regorafenib or trifluridine/tipiracil. According to response to systemic treatment, 57.1% of patients had CB, whereas 42.9% of patients had PD.
Mutations and methylation in tissue and ctDNA
All patients carried mutations in the tumor-tissue. Most common were mutations in KRAS (74.2%), followed by p53-mutations (14.3%), BRAF V600E (7.1%), and NRAS G12D (4.8%). A proportion of 9.5% of these patients was negative after screening for WIF1- and NPY-methylation. WIF1 was methylated in 81% of the patients. In cases without WIF1 methylation, NPY-methylation was found in 50%, which equals to 9.5% in the entire patient population. Detection of mut-ctDNA was higher than that of meth-ctDNA (88.1% versus 74.1%). Results are depicted in Figure 1(a) and (b).
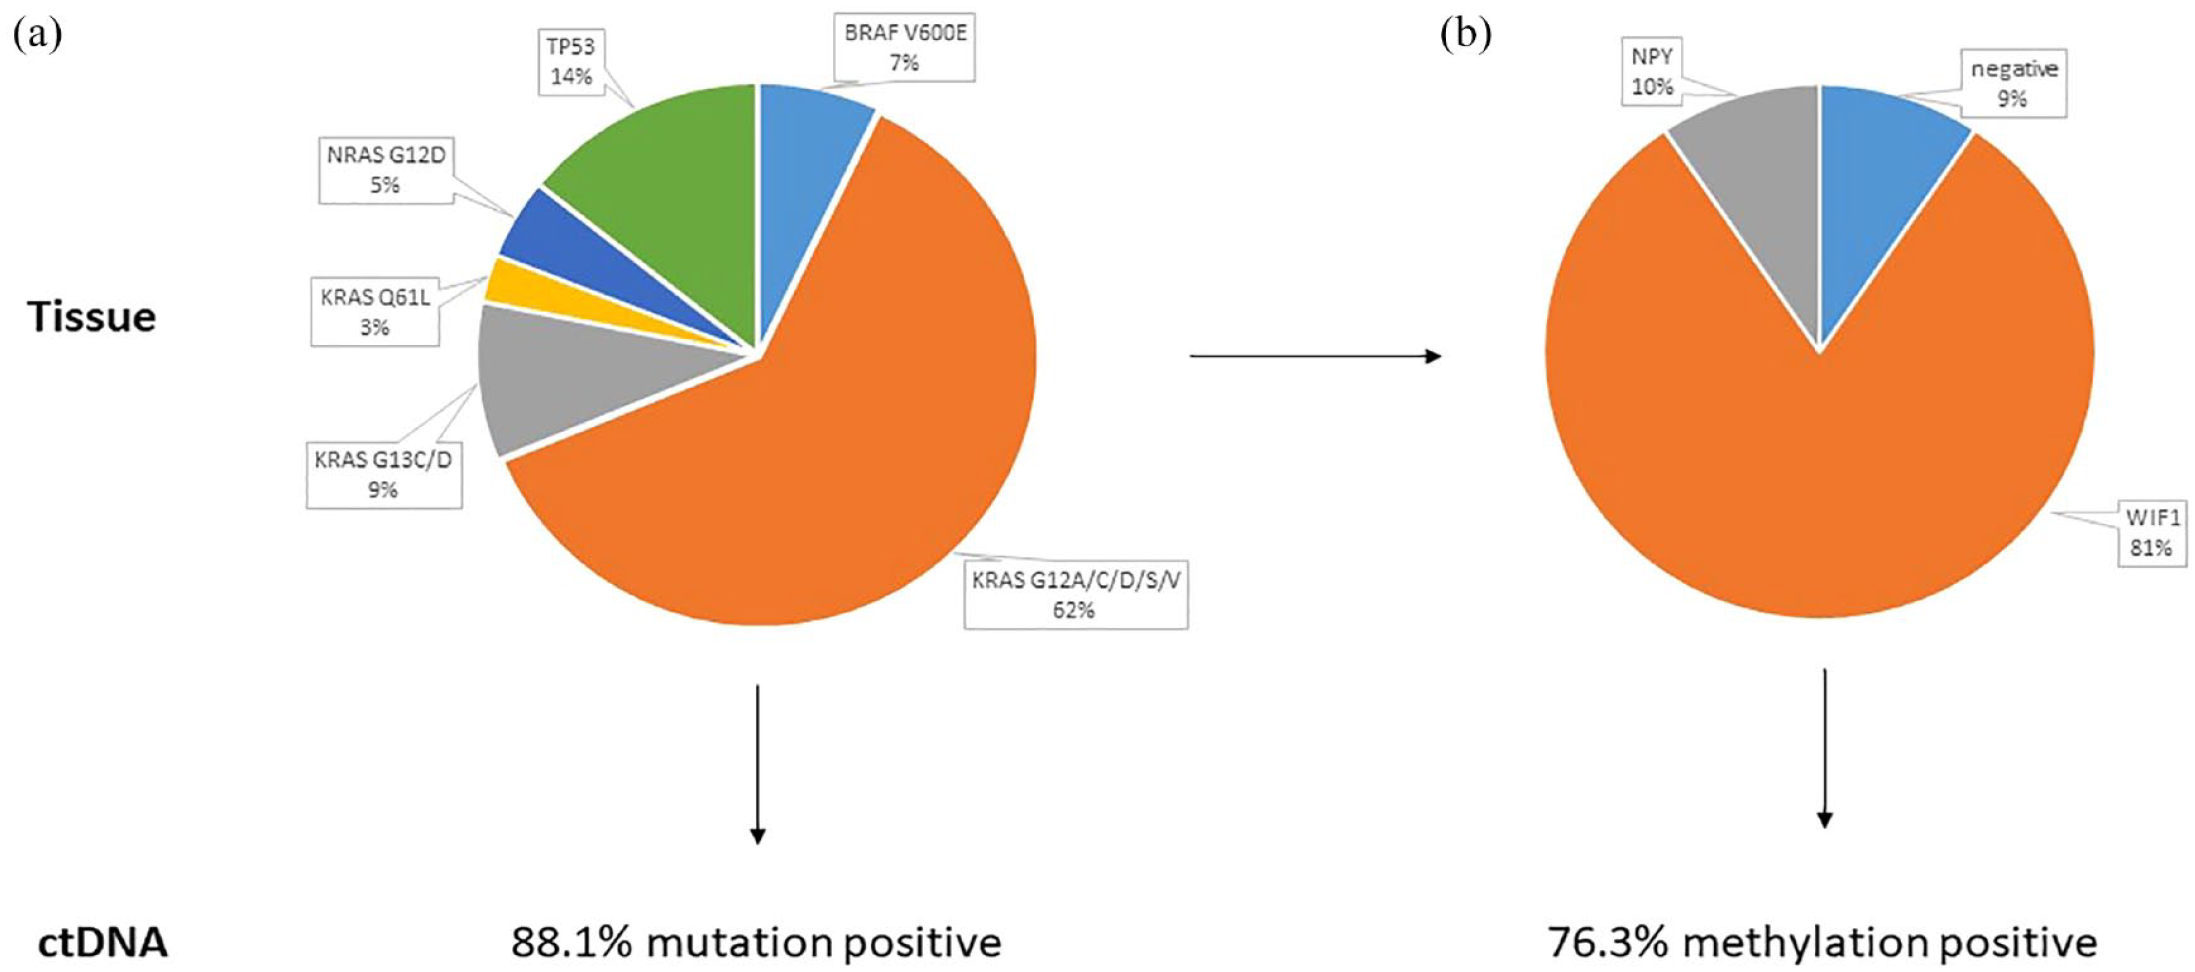
Frequencies of mutations (a) and methylation of WIF1 or NPY and (b) in tumor tissue and liquid biopsy.
Prognostic value of ctDNA before treatment
Levels of ctDNA above the median were prognostic for both mutation- and methylation-specific ctDNA detection. In patients with mut-ctDNA, median OS was 220 (CI 95% 165–NR) versus 559 days (CI 95% 438–NR), which was statistically significant (p = 0.002). For meth-ctDNA, median OS was 185 (CI 95% 139–NR) versus 559 days (CI 95% 385–NR), which was statistically significant (p = 0.001. Results are provided in Figure 2(a) and (b). PFS was in line with these results and are given in detail in the Supplemental Figure 3(a) and (b).

Overall survival (a and b) according to mut-ctDNA (a) or meth-ctDNA (b) levels above or below the median absolute level prior to start of treatment. CtDNA levels above the median are associated with worse survival according to the Kaplan–Meier analysis showed in the figure. Survival time is given in days.
Levels of ctDNA during treatment
Patients received seven treatment cycles with a mean of 93 days (CI 95% 88.5–96). Intervals between treatment cycles were 15.5 days in mean (IQR 13.5, 16.75). Levels of ctDNA were determined at the beginning of each treatment cycle, resulting in a total of 214 samples for ctDNA detection at seven time points. The ctDNA levels were significantly higher in the PD group compared to the CB-group over the entire treatment period. This was observed for both mut- and meth-ctDNA [Figure 3(a) and (b)] and Figure 4.
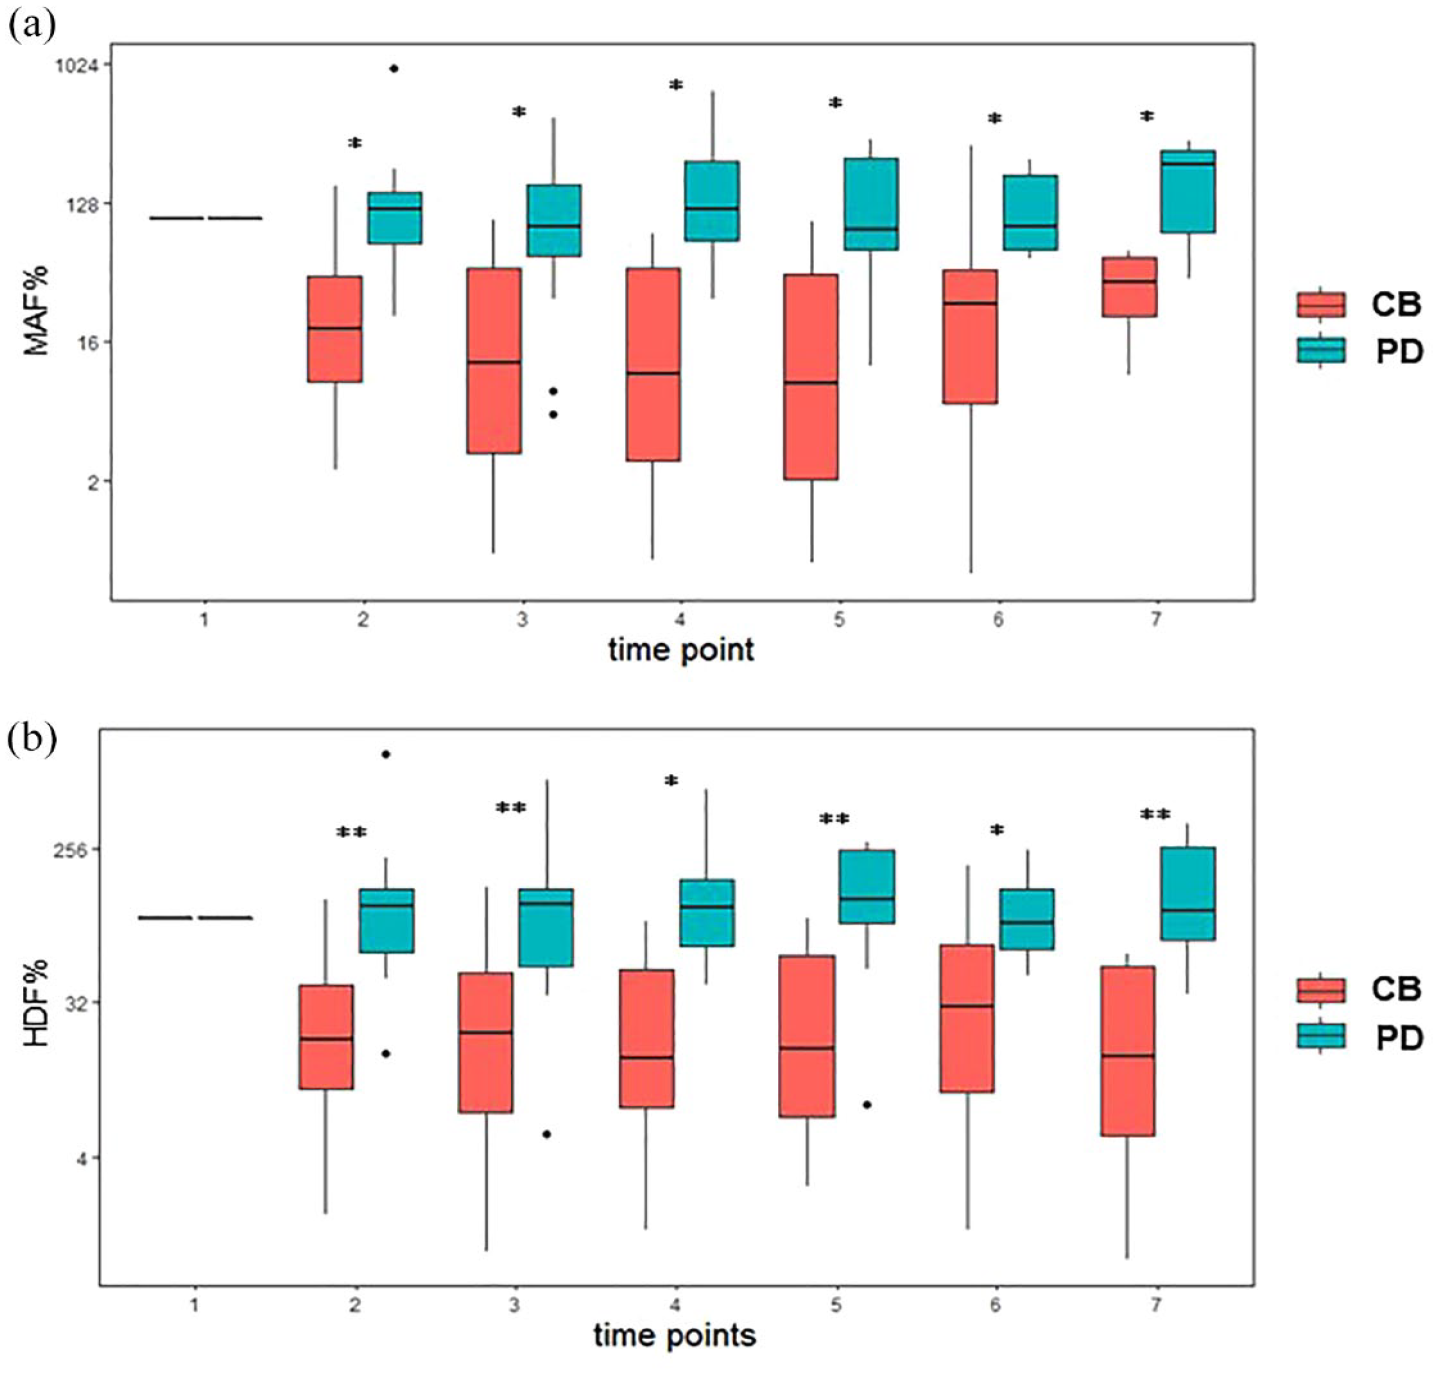
Levels of mut-ctDNA (a) and meth-ctDNA (b) from start of treatment until restaging according to response groups. Levels of ctDNA tend to be higher in the progressive disease group as shown by the box plots. The values of MAF and HDF, respectively, were compared between CB and PD for each time point (2–7) with a non-parametric Wilcoxon rank sum test. A level of significance of 5% was used. No adjustment for multiple testing was used as each comparison tests a separate null hypothesis for either time point.

ROC-analysis showing AUC values during systemic treatment of mut- and meth-ctDNA (a) and the respective curves (b and c). Highest sensitivity/specificity is reached at time point 2 with no additional increase in later time points.
Prediction of response to treatment by ctDNA dynamics
Setting the patient-specific mut-ctDNA level detected at time point 1–100% showed that a reduction of >57.22% at time point 2 predicts response to systemic treatment with an AUC value of 0.89 (CI 95% 0.765; 1.000), corresponding to a sensitivity of 92.3% and a specificity of 85.7%. Similar results were obtained for meth-ctDNA. Reduction of >57.45% at time point 2 predicted response to systemic treatment with an AUC value of 0.88 (CI 95% 0.718; 1.000), corresponding to a sensitivity of 100% and a specificity of 85.7%. The AUC values did not significantly improve over time until restaging for both mut- and meth-ctDNA [Figure 3(a) and (b)]. Mean days from time point 2 to restaging (equals time point 7) was 66 (CI 95% 56.8–75.2). Results are given in detail in Table 2.
Time span from start of treatment to restaging.

d: days; SOT: start of treatment.
Prognostic value of ctDNA-slope
Patients with a reduction of mut-ctDNA levels of more than 57.22% at time point 2 showed a numerically longer OS than patients with less decrease of ctDNA levels. Median OS was 251 days for patients with less than 57.22% reduction (CI 95% 220–NR). Median OS was not reached in patients with higher ctDNA reduction (CI 95% 360–NR); this was statistically not significant (p = 0.053).
Patients with a reduction of meth-ctDNA levels of more than 57.45% at time point 2 showed a longer OS than patients with less decrease of ctDNA levels. Median OS was 220 days for patients with less than 57.22% reduction (CI 95% 79–NR). Median OS was not reached in patients with higher ctDNA reduction (CI 95% 334–NR); this was statistically significant (p = 0.004). Results are depicted in Supplemental Figure 1(a) and (b), associated PFS values are given in the Supplemental Figure 3(c) and (d). Other covariates did not impact on OS in a univariate analysis (Supplemental Table 2).
Discussion
In our prospective observational trial, we describe the correlation of mut- and meth-ctDNA over time to predict response to systemic treatment in pretreated patients with mCRC. Detection of ctDNA was high for both mut- and meth ctDNA (88.1% versus 74.4%). For mut-ctDNA, this is within the range of the detection rate of 92.6% reported by Manca et al. and of 76.8% reported in the PLACOL trial.20,21 Our meth-ctDNA detection rate appears to be slightly lower as compared to the detection rate of around 87% described by others.22,30 This difference, however, can be relativized by the fact that in our approach 7% of patients had a negative WIF1 and NPY1 negative methylation-status in tumor tissue (Figure 1). Correcting for this results in a comparable detection rate of 81.4%. These high detection rates by single-mutation or single-methylation tracking are of particular interest for clinical usage in mCRC. Alternative methods including high-sensitive but complex tissue-informed broad sequencing approaches and multigene-detection in ctDNA have a high turnaround time, which, at least at the moment, limits the use in such a time-sensitive context investigated in our trial.31,32 This delay may hamper a broad clinical usability for timely decision-making.
The absolute levels of both mut- and meth-ctDNA before start of treatment was prognostically relevant for OS (Figure 2). This has been recently described for untreated patients in the VALENTINO-trial as well. 20 According to our findings, we suggest that levels of ctDNA prior to start of systemic therapy are prognostic in pretreated patients as well.
A central aspect of our trial was the prediction of response as a surrogate for CB of systemic treatment by the dynamics of mut- and meth-ctDNA in a pretreated patient population. This has been investigated mainly in untreated patients thus far. The only trial including patients treated beyond first-line was the PLACOL trial. In this trial, 17.1% were treated in second-line, and the majority of the patients received first-line treatment. 21 The first report on the clinical usability of mut-ctDNA in terms of early prediction of CB in mCRC was published by Tie et al. in a cohort of 48 untreated patients with mCRC. 19 In both, early decline of mut-ctDNA levels correlated with a prolongation of PFS. The magnitude of mut-ctDNA decrease was defined differently and was a composite endpoint in the PLACOL-trial (met-ctDNA levels had to be negative at time point 2, mut-ctDNA had to be below 0.1 ng/mL or a reduction of >80% at time point 2) and Tie et al. proposed a 10-fold decrease of ctDNA before treatment cycle 2.27,33 The predictive value of early changes of meth-ctDNA was recently reported. 22 In this untreated patient cohort, ctDNA levels of zero before treatment or before cycle 2 of treatment defined patients with good prognosis.
In contrast to these trials, we did serial mut- and meth-ctDNA analysis in a pretreated patient population from start of treatment until restaging. In patients showing PD at restaging, levels of both, mut- and meth-ctDNA were significantly higher as compared to patients with CB. PD could be predicted after 19 days already if mut-ctDNA levels did show a decrease of >57.22% or meth-ctDNA level did show a decrease of more than 57.45%. This implies that potentially 74 days of this low-value systemic treatment including toxicity concerns and resulting in disease progression could be avoided. This aspect is of particular interest in pretreated patients, as quality-of-life gains increasing importance as compared to the first-line setting where optimal multimodal treatment approaches may still have cure as treatment goal. Interestingly, the predictive value for PD did not improve over time as AUC values did not significantly increase until restaging. To our knowledge, this has not been reported so far as other authors determined ctDNA levels at treatment cycle 1 and 2 only.21,22,33 Both mut- and meth-ctDNA were comparable in predicting PD as AUC values, as well the magnitude of ctDNA reduction was similar. This is relevant as both methods for analyzing ctDNA levels are interchangeable, which is especially interesting for patients without mutations found in clinical routine.
Our study has several limitations. Most importantly, the number of patients is small, and the results have not yet been validated in an independent patient cohort. Another limitation is that patients are treated in second and higher lines, which is a cause for heterogeneity. However, this is also a strength of the trial as almost all data reporting on the prognostic value of ctDNA in mCRC are derived from studies including untreated patients only. Furthermore, the mutation analysis in the tissue have been performed at diagnosis of the patients (i.e. before first-line treatment). Our patient cohort predominantly comprises patients treated in the second-line setting. This causes a gap that could partially contribute to the reduction of our ctDNA-detection rate (especially for RAS-mutations). However, this seems not to be a major confounder, as our detection rates are comparable to the literature as mentioned above. It also shows that it might not be necessary in all cases to force a re-biopsy, which causes a further diagnostic risk to the patients.
In summary, early changes in ctDNA levels measured by mutation- or methylation-tracking are associated with PD or benefit of treatment in terms of response to treatment in pretreated patients with mCRC. Serial ctDNA measurement by either method has significant potential to complement RECIST-based treatment assessment. This implies that potentially low-value treatment can be switched to alternative combinations to minimize toxicity and increase quality of life in this patient population.
Supplemental Material
sj-docx-4-tam-10.1177_17588359231200462 – Supplemental material for Response prediction by mutation- or methylation-specific detection of ctDNA dynamics in pretreated metastatic colorectal cancer
Supplemental material, sj-docx-4-tam-10.1177_17588359231200462 for Response prediction by mutation- or methylation-specific detection of ctDNA dynamics in pretreated metastatic colorectal cancer by Bernhard Doleschal, Patrick Kirchweger, Simon Schwendinger, Alexander Kupferthaler, Jonathan Burghofer, Gerald Webersinke, Emina Jukic, Helwig Wundsam, Matthias Biebl, Andreas Petzer and Holger Rumpold in Therapeutic Advances in Medical Oncology
Supplemental Material
sj-docx-5-tam-10.1177_17588359231200462 – Supplemental material for Response prediction by mutation- or methylation-specific detection of ctDNA dynamics in pretreated metastatic colorectal cancer
Supplemental material, sj-docx-5-tam-10.1177_17588359231200462 for Response prediction by mutation- or methylation-specific detection of ctDNA dynamics in pretreated metastatic colorectal cancer by Bernhard Doleschal, Patrick Kirchweger, Simon Schwendinger, Alexander Kupferthaler, Jonathan Burghofer, Gerald Webersinke, Emina Jukic, Helwig Wundsam, Matthias Biebl, Andreas Petzer and Holger Rumpold in Therapeutic Advances in Medical Oncology
Supplemental Material
sj-jpg-1-tam-10.1177_17588359231200462 – Supplemental material for Response prediction by mutation- or methylation-specific detection of ctDNA dynamics in pretreated metastatic colorectal cancer
Supplemental material, sj-jpg-1-tam-10.1177_17588359231200462 for Response prediction by mutation- or methylation-specific detection of ctDNA dynamics in pretreated metastatic colorectal cancer by Bernhard Doleschal, Patrick Kirchweger, Simon Schwendinger, Alexander Kupferthaler, Jonathan Burghofer, Gerald Webersinke, Emina Jukic, Helwig Wundsam, Matthias Biebl, Andreas Petzer and Holger Rumpold in Therapeutic Advances in Medical Oncology
Supplemental Material
sj-jpg-2-tam-10.1177_17588359231200462 – Supplemental material for Response prediction by mutation- or methylation-specific detection of ctDNA dynamics in pretreated metastatic colorectal cancer
Supplemental material, sj-jpg-2-tam-10.1177_17588359231200462 for Response prediction by mutation- or methylation-specific detection of ctDNA dynamics in pretreated metastatic colorectal cancer by Bernhard Doleschal, Patrick Kirchweger, Simon Schwendinger, Alexander Kupferthaler, Jonathan Burghofer, Gerald Webersinke, Emina Jukic, Helwig Wundsam, Matthias Biebl, Andreas Petzer and Holger Rumpold in Therapeutic Advances in Medical Oncology
Supplemental Material
sj-jpg-3-tam-10.1177_17588359231200462 – Supplemental material for Response prediction by mutation- or methylation-specific detection of ctDNA dynamics in pretreated metastatic colorectal cancer
Supplemental material, sj-jpg-3-tam-10.1177_17588359231200462 for Response prediction by mutation- or methylation-specific detection of ctDNA dynamics in pretreated metastatic colorectal cancer by Bernhard Doleschal, Patrick Kirchweger, Simon Schwendinger, Alexander Kupferthaler, Jonathan Burghofer, Gerald Webersinke, Emina Jukic, Helwig Wundsam, Matthias Biebl, Andreas Petzer and Holger Rumpold in Therapeutic Advances in Medical Oncology
Supplemental Material
sj-xlsx-6-tam-10.1177_17588359231200462 – Supplemental material for Response prediction by mutation- or methylation-specific detection of ctDNA dynamics in pretreated metastatic colorectal cancer
Supplemental material, sj-xlsx-6-tam-10.1177_17588359231200462 for Response prediction by mutation- or methylation-specific detection of ctDNA dynamics in pretreated metastatic colorectal cancer by Bernhard Doleschal, Patrick Kirchweger, Simon Schwendinger, Alexander Kupferthaler, Jonathan Burghofer, Gerald Webersinke, Emina Jukic, Helwig Wundsam, Matthias Biebl, Andreas Petzer and Holger Rumpold in Therapeutic Advances in Medical Oncology
Footnotes
References
Supplementary Material
Please find the following supplemental material available below.
For Open Access articles published under a Creative Commons License, all supplemental material carries the same license as the article it is associated with.
For non-Open Access articles published, all supplemental material carries a non-exclusive license, and permission requests for re-use of supplemental material or any part of supplemental material shall be sent directly to the copyright owner as specified in the copyright notice associated with the article.