
Abstract
Background:
Trastuzumab (Herceptin) is the key systemic therapy for HER2-positive breast cancer. However, the initial response rate is limited to approximately 50% in patients. Moreover, most patients, especially at an advanced stage, eventually develop acquired resistance. Understanding the mechanisms of trastuzumab resistance is crucial for achieving better treatment outcome in this group of patients.
Methods:
A trastuzumab-resistant (TR) cell line was developed using the BT474 HER2-positive breast cancer cell line. Whole-transcriptome expression array was performed and the TR-related gene NDUFA4L2 was identified by differential expression analysis between BT474 and BT474-TR. Mitochondrial localization of NDUFA4L2 was confirmed by immunofluorescence and western blotting using mitochondrial fractionation. Mitochondrial function and energy metabolism were evaluated using Seahorse, ATP production, and lactate production assays, and cellular reactive oxygen species (ROS) levels were determined using DCFDA. NDUFA4L2 expression in patients was evaluated by immunohistochemistry, and relapse-free survival was analyzed using the Kaplan–Meier method.
Results:
NDUFA4L2 was highly expressed in the TR HER2-positive breast cancer cell line. High expression level of NDUFA4L2 was associated with shorter relapse-free intervals in trastuzumab-treated HER2-positive breast cancer patients. Overexpression of NDUFA4L2 enhanced Warburg effects, enhanced aerobic glycolysis, reduced oxygen consumption, and lowered ROS production. Mechanistically, overexpression of NDUFA4L2 facilitated mitochondrial relocalization of HER2 and suppressed ROS production, thus rendering cancer cells more resistant to trastuzumab treatment.
Conclusions:
We identified NDUFA4L2 as a new biomarker and potential therapeutic target for TR HER2-positive breast cancer.
Introduction
Human epidermal growth factor receptor 2 (HER2)-amplified breast cancer accounts for approximately 15–25% of all breast cancer cases. 1 HER2 is a transmembrane tyrosine kinase receptor belonging to the EGFR/ErbB family. HER2-mediated signaling, such as the well-studied Ras-Raf and the PI3K-Akt signaling pathways, promotes cell proliferation, survival, and invasion, and is a major driver for the HER2-amplified subtype of breast cancer. 2 HER2-positive breast cancer is highly proliferative and was associated with poor prognosis before the emergence of HER2-targeted therapy such as trastuzumab (Herceptin, Genentech, San Francisco, CA, USA) therapy. 3 Trastuzumab is a humanized monoclonal antibody specifically targeting the extracellular domain of HER2 and has been widely used in adjuvant and neoadjuvant settings as well as advanced stages. Despite the remarkable success of trastuzumab in improving overall survival, disease-free interval, and recurrence, the initial response rate to trastuzumab is approximately 50% depending on disease stages, and the majority of patients treated with this drug develop acquired resistance.3–5
Various mechanisms have been proposed for trastuzumab resistance, including expression of a truncated isoform of HER2 lacking the trastuzumab-HER2 binding site, increased expression of HER2 downstream signaling molecules, and bypass of the HER pathway entirely through other proliferation and survival promoting pathways such as IGF1R-mediated signaling. 6 Tyrosine kinase inhibitors such as lapatinib can target the intracellular kinase domain of HER2 and other members of the EGFR receptor family, and improve progression survival intervals in patients with failed trastuzumab treatment and multi-chemotherapy. 7
One of the relatively less elucidated mechanisms of HER2-driven carcinogenesis and drug resistance is the crosstalk between HER2 and tumor cell metabolism. Cancer cells strongly rely on glycolysis even under aerobic conditions, not only for production of energy but also for converting nutrients into biomass that is required for cell proliferation, which is known as the Warburg effect. 8 Chan et al. 9 reported that Skp2-SCF E3 ligase complex facilitates HER2-mediated Akt ubiquitination, Glut1 expression, glucose uptake, and glycolysis, altering trastuzumab sensitivity in mouse models. Using proteomic analysis, Zhang et al. 10 showed that overexpression of a number of proteins related to glycolysis and fatty acid metabolism occurs in HER2-positive breast cancer cell lines and tumor samples. Zhao et al.11,12 reported that HER2 overexpression dramatically increases glycolysis via upregulating the expression of lactate dehydrogenase A (LDH-A) and heat shock factor 1 (HSF1), and combination with a glycolysis inhibitor could reverse the trastuzumab resistance phenotype. Similarly, Tian et al. 13 reported that a novel EGFR/HER2 inhibitor, KU004, inhibits HER2-positive tumor growth by suppressing glycolysis via suppression of hexokinase II (HK2). In addition to regulating the expression of various glycolysis-related genes, it has also been reported that HER2 may translocate to mitochondria via association with the mtHSP70 chaperone and regulate oxygen consumption and glycolysis in mitochondria directly. 14
Here, we performed whole-transcriptome expression analysis of a trastuzumab-resistant (TR) HER2-positive breast cancer cell line, providing evidence that NADH dehydrogenase (ubiquinone) 1 alpha subcomplex 4-like 2 (NDUFA4L2) is part of a new mechanism underlying trastuzumab resistance, and may serve as a new biomarker for trastuzumab clinical response.
Materials and methods
Cell culture and treatment
The breast cancer cell lines BT474 and SK-BR-3 were purchased from ATCC and cultured in DMEM with 10% FBS. Trastuzumab-resistant BT474, named BT474TR, was obtained by continuously exposing cells to trastuzumab (10 μg/mL) for 6 months, at which point cells regained morphology resembling the parental line, and tested for dose response to trastuzumab. The cells were then maintained in the medium containing 10 μg/mL trastuzumab, a concentration at which the proliferation of the parental sensitive cells was inhibited. The cells were monthly tested for trastuzumab resistance. Cell cultures were incubated under 5% CO2-humidified atmosphere at 37°C and routinely checked for the absence of mycoplasma contamination.
Whole-transcriptome expression array and pathway analysis
Total RNA was isolated using a MagMAX™ Express-96 Magnetic Particle Processor and the MagMAX™-96 Total RNA Isolation Kit according to the manufacturer’s protocol. RNA concentration was measured using Qubit 3.0 (Thermo Fisher), and quality was characterized by the quotient of the 28S to 18S ribosomal RNAs electropherogram peaks using an Agilent 2100 Bioanalyzer and the RNA Nano Chip (Agilent, Wood Dale, IL, USA). cDNA libraries were prepared using the TotalPrep RNA Amplification Kit (Illumina, San Diego, CA, USA) according to the manufacturer’s recommendation. A total of 700 ng of cDNA was hybridized at 58°C for 16 h to the HumanHT-12 v3 Expression BeadChips (Illumina, San Diego, CA, USA). The BeadChips were then scanned using an Illumina Bead Array Reader and Bead Scan Software (Illumina, San Diego, CA, USA). All experiments were performed in triplicates.
The microarray data was quantile-normalized and log 2-transformed. Genes that failed to pass the detection limit in at least two replicates were excluded from further analysis. Differential expression analysis was performed using R software (www.r-project.org), with the empirical Bayes model of the limma package. A p-values of 0.05 or less after false discovery rate adjustment (FDR) were considered differentially expressed. Gene ontology (GO) and Kyoto Encyclopedia of Genes and Genomes (KEGG) pathway analyses were performed using the gonna and kegga functions of the limma package and ranked by enrichment p-values.
Tissue sample collection and ethics statement
This study was approved by the Ethical Committee of Nanjing Medical University (Protocol Number: 2017118). Due to the retrospective nature of the study, which does not involve personal privacy or commercial interests, formal consent for inclusion was waived by the ethics committee. A total of 68 patients were enrolled in this study. All patients received standard trastuzumab treatment in neoadjuvant settings followed by surgery and continued with trastuzumab treatment until progression or death. All cases have been followed up for at least 5 years. Trastuzumab resistance is defined as relapse or progression within 12 months after initial treatment of trastuzumab. Thirty out of 68 patients were classified as part of the trastuzumab resistance group. The biopsies and surgical sections were dissected (3 μm thickness), formalin-fixed, paraffin embedded, and mounted on charged slides (Thermo Scientific, Waltham, MA, USA) for storage.
Clinical and pathological correlation and relapse-free survival analyses
The clinical and pathological features of HER 2-positive patients were analyzed by a pathologist. The parameters included trastuzumab sensitivity and resistance. Relapse-free survival (RFS) was calculated from the date on which treatment with trastuzumab was initiated to the date of any progression, death, or last follow-up (censored). The prognostic significance of NDUFA4L2 overexpression was determined using the Kaplan–Meier method followed by log-rank test. A validation dataset of 252 HER2-positive breast cancer survival data was downloaded from KMplotter (https://kmplot.com/analysis/). RFS was evaluated against expression of NDUFA4L2 (probe 218484at), split by median.
Cell proliferation assays
Cells were plated on 96-well plates (3,000 cells per well) overnight, then treated with trastuzumab and incubated for 72 h. Live cell number was then determined using the CyQuant™ Direct assay kit (Thermo Fisher Scientific) according to the manufacturer’s instruction. Fluorescence intensity was normalized to vehicle treatment and presented as mean ± SD (n = 3). For RNAi experiments, siRNA targeting NDUFA4L2 (Horizon, Lafayette, CO) or scrambled siRNA was transfected into cells in 6-well plate using RNAiMax (Thermo) according to the manufacturer’s instruction; the cells were lifted after 16 h and reseeded into 96-wells as previously.
3D viability assay
Cancer cell (SKBR3 and BT474) spheroids were formed in Nunclon™ Sphera™ 96-well plates (Thermo Fisher, Waltham, MA, USA). The spheroids were treated with trastuzumab as indicated for 5 days. Viability was then determined using the Promega CellTiter-Glo™ 3D Cell Viability Assay according to the manufacturer’s instruction.
Immunohistochemistry
NDUFA4L2 expression in tissue samples was determined using immunohistochemistry. Histological sections were deparaffinized and rehydrated, and NDUFA4L2 antigens were retrieved by immersing in 10 mM citrate buffer, pH 6.0 in a steamer (95°C) for 40 min. The slides were then cooled to 18°C and blocked in 3% hydrogen peroxide and 5% BSA for 15 min and 1 h, respectively. The sections were then incubated with anti-NDUFA4L2 antibody (1:100, Proteintech, Chicago, IL, USA) at 4°C overnight, followed by 1 h incubation with the corresponding secondary antibody at room temperature and visualized using 3,3′-diaminobenzidine (ImmPACT DAB, Vector Laboratories). The pictures were captured with a semi-automated system (Stereo Investigator, MicroBright Field., Williston, VT, USA).
Mitochondria/cytosol fractionation preparation
Cells were cultured in 100 mm dishes, washed with 1 × PBS, trypisinized, and collected by centrifugation at 300 × g for 5 min. The Mitochondria/Cytosol Fractionation Kit (K256-25, BioVision, Milpitas, CA, USA) was used to isolate cellular mitochondria and cytosol.
Western blotting analysis
Cells in 35 mm dishes were rinsed with PBS and lysed by addition of sodium dodecylsulfate (SDS) sample buffer [2.5 mM Tris-HCl (pH 6.8), 2.5% SDS, 100 mM dithiothreitol, 10% glycerol, 0.025% bromophenol blue]. Proteins were separated in Bio-Rad precast polyacrylamide gels and transferred onto membranes using the Bio-Rad Transblot Turbo Semi-Dry Transfer System. PVDF membranes were blocked with 5% milk in 1 × TBST for 1 h and incubated with the primary antibody overnight at 4°C, followed by mouse or rabbit HRP-conjugated secondary antibody (CST, Danvers, MA, USA). Signals were detected with SuperSignal™ West Pico or Dura Substrate (Thermo Fisher, Waltham, MA, USA) using the Bio-Rad ChemiDoc™ Touch Imaging System. The antibodies used were as follows: anti-NDUFA4L2 (Proteintech, 66050-1), anti-NDUFB8 (20E9DH10C12) (Abcam, AB110242), anti-HER 2 (Cell signaling, Cat# 2242), anti-rabbit IgG, HRP-linked antibody (Sigma, 7074S), and anti-mouse IgG HRP-linked antibody (Sigma, 7076S).
Lactate production assay
Lactate production in the medium was detected using the Lactate Assay Kit (BioVision, Milpitas, CA, USA). The results were normalized based on the total protein concentration of the cell lysate.
Reactive oxygen species measurement
Trypsinized 2 × 10⁵ cells were washed with PBS and incubated with 20 µM of the reactive oxygen species (ROS) indicator chloromethyl-2′,7′-dichlorodihydrofluorescein diacetate (DCFDA; Abcam, ab113851) at 37°C for 30 min. The levels of ROS were analyzed using flow cytometry on a FACSCalibur™ platform (BD Biosciences), and the data were analyzed using FlowJo software (Tree Star, Ashland, OR, USA).
Establishment of the BT474 cell line stably overexpressing NDUFA4L2
BT474 cells were transfected with pCMV6-Entry-human wild type NDUFA4L2 (Origene, NM_020142) or vector only using Lipofectamine 2000 (Thermo Fisher, Waltham, MA, USA). Twenty-four hours after plasmid transfection, cells were cultured in medium containing a final concentration of 400 μg/mL G418 to screen for stably transfected single clones. Two clones, NDUFA4L2-1 and NDUFA4L2-2, were picked for subsequent experiments.
Semi-quantitative reverse transcription PCR (qRTPCR)
Total RNA was extracted from cells using the Quick-RNA™ Miniprep Kit (Zymo Research, Irvine, CA, USA). Real-time PCR was performed using a real-time Power SYBR® Green RNA-to-CT™ 1-Step Kit (Thermo Fisher, Waltham, MA, USA) in a StepOne Plus Real-Time PCR System (Applied Biosystems, Bedford, MA, USA). The following primers for real-time PCR were used: NDUFA4L2, forward, 5′-GCTGCGCTTTACTTGCGT-3′, reserve, 5′-AAGGAACTTGTATTGGTCATTGG-3′; and GAPDH, forward, 5′-GGAAGCTTGTCATCAATGGAAATC-3′, reserve, 5′-TGATGACCCTTTTGGCTCCC-3′.
Immunofluorescence
Cells were plated in 16-well cover-glass slips (Thermo Fisher, Waltham, MA, USA). They were washed with 1 × PBS before being fixed with 4% paraformaldehyde for 10 min, followed by permeabilization using 0.1% Triton X-100. Cells were then blocked with 3% BSA for 30 min and incubated with specific primary antibody overnight at 4°C, followed by appropriate Alexa Fluor conjugated antibody for 1 h at room temperature. Cells were counter-stained with DAPI before visualization using Zeiss LSM 780 Confocal Microscope at × 100 magnification. The antibodies used were as follows: anti-NDUFA4L2 (Proteintech, 66050-1), anti-PDHA1 (20E9DH10C12) (Abcam, AB110242 and Santa Cruz sc-377092), anti-HER2 (Cell signaling, Cat# 2165).
Metabolic measurements
Oxygen consumption rate (OCR) and extracellular acidification rate (ECAR) were measured using a Seahorse XFp Extracellular Flux Analyzer (Agilent Technologies) following the manufacturer’s protocols. Cells were seeded in a Seahorse XFp-well tissue culture plate at a density of 3.2 × 10⁴ cells/well in DMEM medium. After overnight attachment, the medium was replaced with prewarmed Seahorse XF DMEM medium (pH 7.4, #103575-100), supplemented with 100 mM sodium pyruvate, 1 mM glucose, and 200 mM glutamine, and then incubated in a non-CO2 incubator at 37°C for 60 min. ECAR and OCR were measured in real time with the Glycolysis Stress Test Kit (#103017-100) and the Mito Stress Test Kit (#103010-100), respectively, using a Seahorse XFp Analyser (Agilent Technologies) following the manufacturer’s instructions. Seahorse XFp Wave software was used to analyze the data. OCR is shown in pmols/min and ECAR in mpH/min. All values were normalized to cell density.
ATP assay
Cells were seeded into 6-well plates followed by overnight incubation. Fresh medium was provided for 72 h. Equal numbers of cells were lysed in each treatment group, and 10 µL from each sample was used for ATP assays following the manufacturer’s protocol (Invitrogen, ATP Determination Kit, A22066). Briefly, 100 µL of the standard reaction solution was measured in a luminometer for background luminescence. Next, 10 µL of the lysate supernatant was added to the reaction solution, and luminescence was again measured. Background luminescence was subtracted from total luminescence, and the results were plotted as fold-change corrected for the control samples.
Immunoprecipitation
Cell extracts were prepared using a lysis buffer consisting of 50 mM HEPES, (pH 7.5), 150 mM NaCl, 1 mM EDTA, 2.5 mM EGTA, 10% glycerol, 0.1% Tween-20, 1 mM DTT, 1 mM NaF, 0.1 mM Na3VO4, 10 μg/mL leupeptin, 2 μg/mL Aprotinin, and 0.1 mM PMSF. Extracts were briefly sonicated and then centrifuged at 14,000 rpm in a MicroCL17R refrigerated microcentrifuge at 4°C for 15 min. Protein concentration was determined using the Bradford protein assay (Bio-Rad). Equal amounts (0.5–1 mg) of total protein from each extract were subjected to immunoprecipitation. Cell lysates were incubated with 2 μg of anti-NDUFA4L2 (Proteintech, 66050-1) or anti-HER2 (CST #2165) antibodies overnight at 4°C on a rotator. Protein A-conjugated agarose beads (Pierce™ Protein A Agarose, 20,333) (30 μL) were then added and incubated for 1 h on a rotator at 4°C. The beads were pelleted at 4000 rpm at 4°C and then were washed five times in 500 μL lysis buffer. Precipitated proteins were then resuspended in SDS-containing sample buffer and separated by SDS-PAGE for western blotting.
Statistical analysis
The two-tailed unpaired Student’s t-test and the Mann–Whitney test were performed using GraphPad Prism 8.0 (GraphPad Software). All functional assays were representative of ⩾3 independent experiments and expressed as mean ± SD. A p-value less than 0.05 (*), 0.01 (**) or 0.001 (***) indicated statistical significance.
Results
NDUFA4L2 expression and the stress response pathway are significantly altered in a trastuzumab-resistant breast cancer cell line
The established BT474TR cell line exhibited strong resistance to trastuzumab treatment, showing no apparent cell growth inhibition up to 0.2 mg/mL, whereas the parental cell growth was inhibited by approximately 50% at a similar dosage under our experimental conditions (Supplemental Figure S1A). We then performed transcriptome-wide expression array analysis on the BT474TR and its parental cell line. A total of 487 probes mapped to 453 genes were significantly differentially expressed at a p-value of 0.05 after adjusting for FDR. Sixty-five and 58 genes were significantly up- and downregulated, respectively, in TR cell lines at a fold-change of at least two. The top genes are presented in Figure 1a and b. Among all the differentially expressed genes, the top ranked gene, NDUFA4L2, exhibited a strikingly large fold-change increase of more than four in the BT474TR cell line.
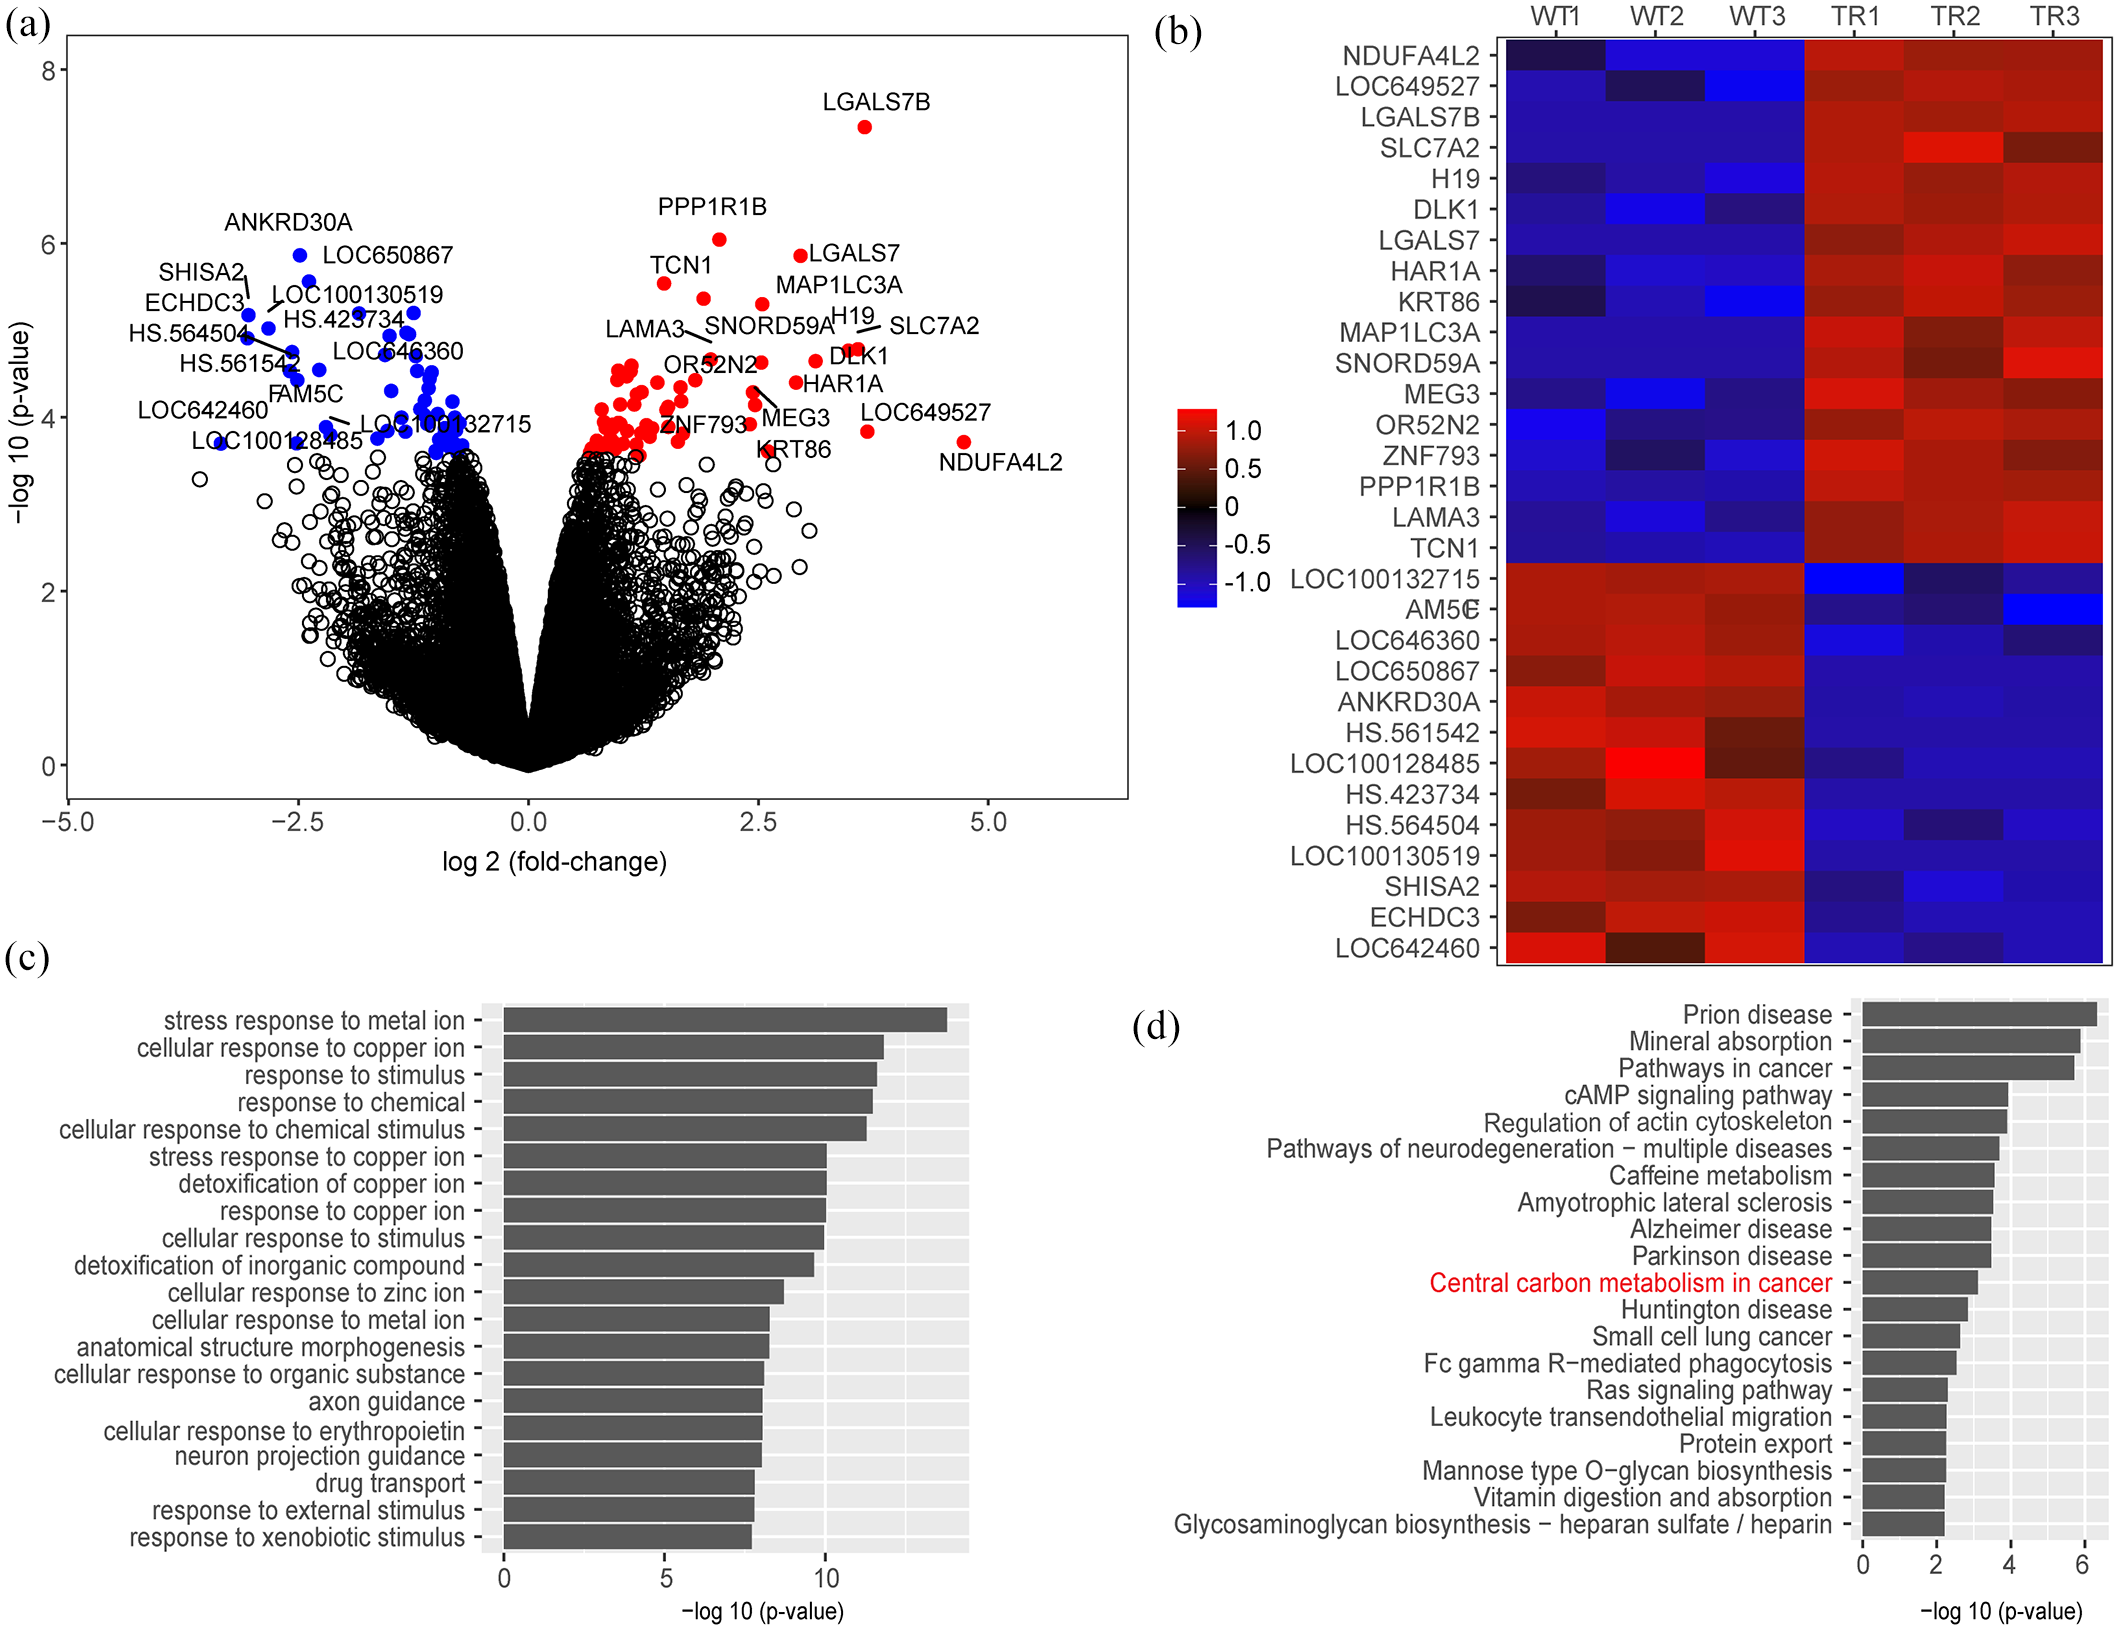
Differential expression and pathway analyses of trastuzumab-resistant versus parental BT474 cell lines. (a) Volcano plot of differential expression analysis of BT474TR versus BT474-parental cell lines with genes significantly up- and downregulated at an FDR of 0.05 marked in red and blue, respectively. (b) Heatmap of the top 30 differentially expressed genes, ordered by fold-change. Each column represents one replicate of BT474TR (TR1,2,3) or parental (WT1,2,3) cell line (c, d) Top enriched pathways by GO biological process and KEGG database, plotted and ranked by enrichment p-value.
To identify the biological processes and pathways significantly altered in the TR cell line, we performed GO and KEGG pathway analyses using all significantly differentially expressed genes (Figure 1c and d). Several pathways previously demonstrated to contribute to trastuzumab resistance were also found to be enriched in the GO or KEGG pathway analyses, such as drug transport pathway, Wnt signaling pathway, and Ras signaling pathway. Interestingly, the GO analysis also strongly indicated a number of exogenous stimuli and stress response pathways, including stress response to metal and organic substances. Except the classic cancer-related pathways, KEGG pathway analysis identified the central carbon metabolism among the top pathways, which primarily refers to the cancer-specific energy production and carbon metabolism preference, including bias toward aerobic glycolysis over oxidative phosphorylation (OXPHOS), also known as Warburg effects. NDUFA4L2 has been previously studied in clear cell renal cell carcinoma and implicated in modulating mitochondrial functions. 15 We thus decided to further investigate the potential role of NDUFA4L2 in metabolic modulation and trastuzumab resistance in HER2-positive breast cancer.
We first validated our finding of NDUFA4L2 overexpression in the BT474TR and parental cell lines by performing qRT-PCR, western blotting, and immunofluorescence analyses. We found that NDUFA4L2 expression was highly elevated at the mRNA level (Figure 2a). Although it was hardly detected in whole cell lysates, we found that NDUFA4L2 protein (13 kDa) was almost exclusively expressed in mitochondria and, to a lesser extent, in the perinuclear region, and was highly expressed in TR cell lines compared with parental cells (Figure 2b and l). The TR cells are significantly more resistant to trastuzumab treatment and proliferate at higher rate than parental cells. Knockdown of NDUFA4L2 significantly diminished the resistance phenotype of BT474-TR cell lines and partially slowed the proliferation advantage of TR cells while having minimal effects to parental cells (Figure 2d and e).
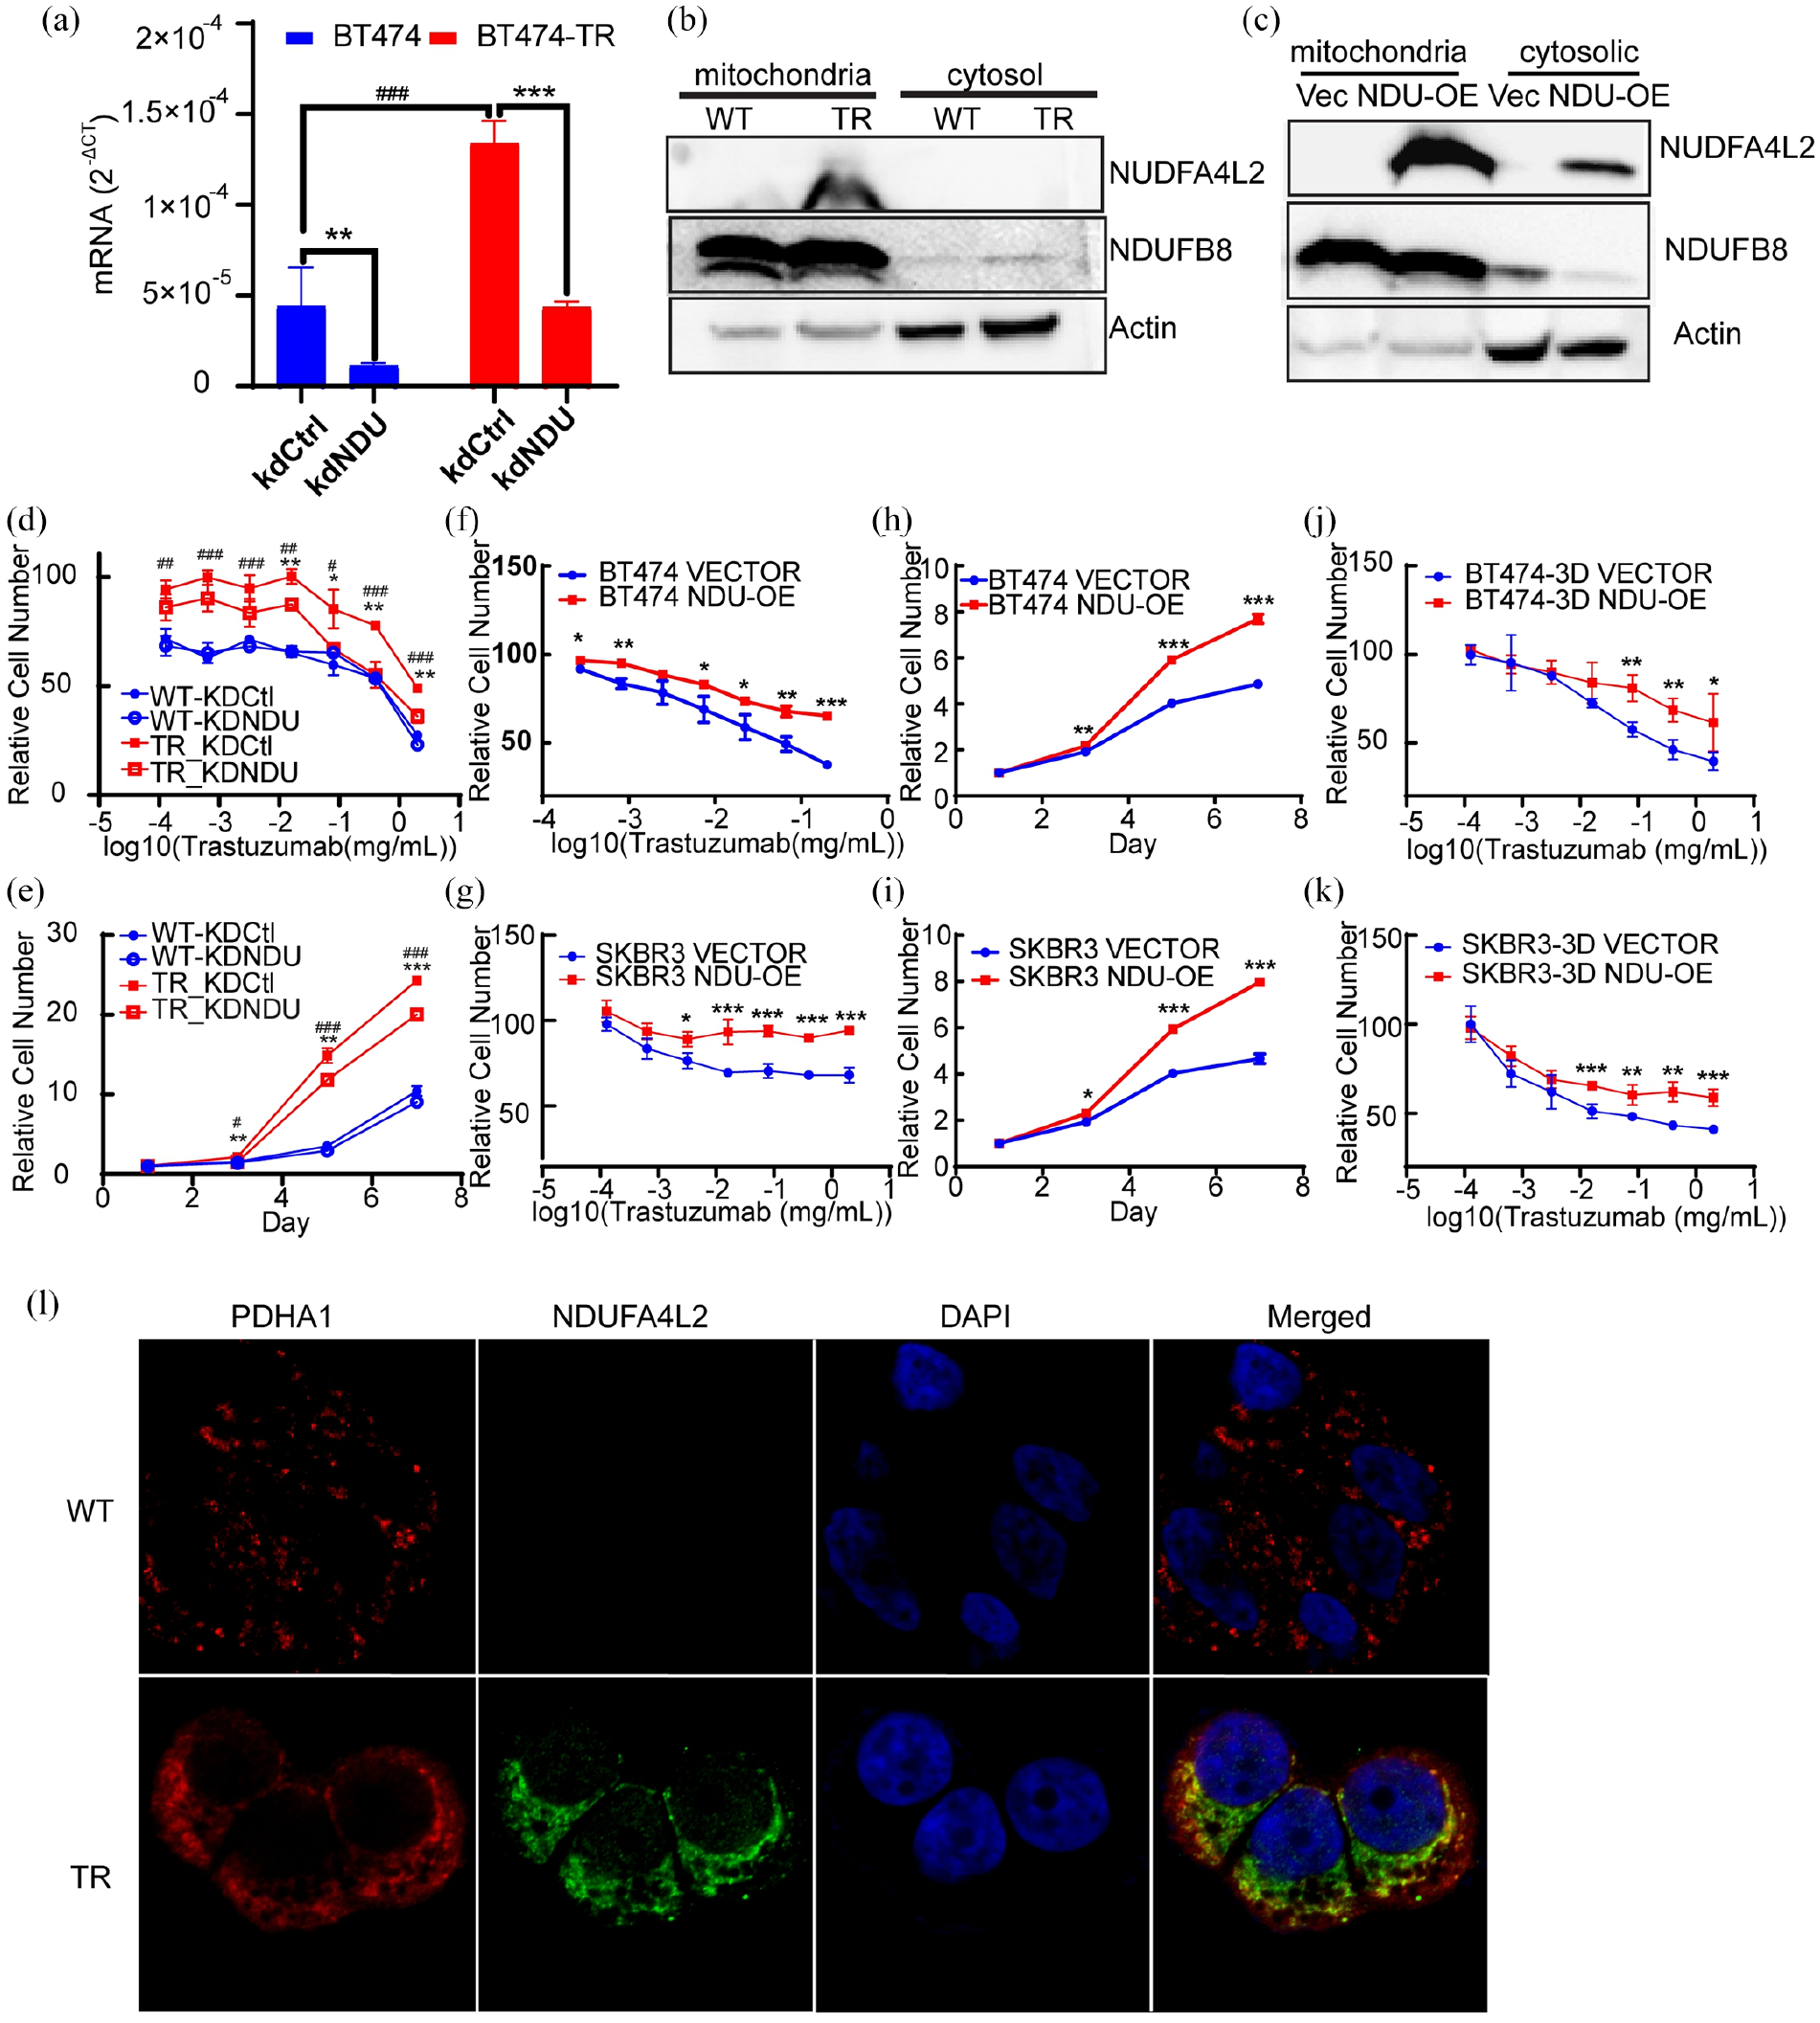
Upregulation of NDUFA4L2 in the BT474TR cell line. (a) Validation of NDUFA4L2 expression by qRTPCR and knockdown efficiency in the BT474TR and parental cell lines. Data are presented as mean ± SD of three independent replicates; significance was tested using Student’s t-test (###p < 0.001 TR versus parental, **p < 0.01, ***p < 0.001 knockdown-control versus NDUFA4L2 using Student’s t-test). (b) Protein expression of NDUFA4L2 in the BT474TR and parental cell lines in the mitochondria and cytosol, respectively, using NDUFB8 and β-actin as subcellular loading controls. (c) Overexpression of NDUFA4L2 in the mitochondria and cytosol, respectively, using NDUFB8 and β-actin as subcellular loading controls. (d–e) Cytotoxicity assay (d) and proliferation assay (e) of trastuzumab parental (WT) and TR cell lines after control or NDUFA4L2 knockdown (###p < 0.001, ##p < 0.01, #p < 0.05 TR-control versus parental-control, **p < 0.01, *p < 0.05 knockdown-control versus NDUFA4L2 using Student’s t-test). (f–k) Cytotoxicity and proliferation assays of BT474 and SKBR3 cell lines with overexpression of NDUFA4L2. (f) Cytotoxicity assay of BT474 in 2D culture overexpressing NDUFA4L2. (g) Cytotoxicity assay of SKBR3 in 2D culture overexpressing NDUFA4L2. (f) Proliferation assay of BT474 in 2D culture overexpressing NDUFA4L2. (g) Proliferation assay of SKBR3 in 2D culture overexpressing NDUFA4L2. (f) Cytotoxicity assay of BT474 in 3D culture overexpressing NDUFA4L2. (g) Cytotoxicity assay of SKBR3 in 3D culture overexpressing NDUFA4L2. Each point is represented by mean ± SD of at least three replicates. **p < 0.001, **p < 0.01, *p < 0.05 using Student’s t-test (l) Immunofluorescent staining of NDUFA4L2 and PDHA1 was used as a mitochondrial marker.
NDUFA4L2 overexpression enhances cell proliferation and reduces Trastuzumab antitumor effect
The overexpressed NDUFA4L2 in BT474 cell lines was primarily localized to the mitochondrial fraction, as evidenced by western blotting results of the mitochondria fractionation, although a small fraction was also observed in the cytosol. In contrast, BT474 cell lines transfected with empty vector showed undetectable levels of NDUFA4L2 (Figure 2c).
As shown in Figure 2h, the overexpression of NDUFA4L2 alone was able to promote proliferation in BT474 cells by approximately two-fold compared with the vector control, and was similar to that of BT474TR cells transfected with empty vector. Furthermore, cell lines overexpressing NDUFA4L2 exhibited high resistance to trastuzumab treatment compared with the control (Figure 2f). We further validated our results in another HER2-positive breast cancer cell line, SK-BR-3, and observed similar increase in proliferation and trastuzumab resistance after overexpression of NDUFA4L2 (Figure 2g and i). To evaluate the potential effect of NDUFA4L2 overexpression in vivo, we obtained 3D spheroid cultures from the BT474 and SK-BR-3 cell lines transfected with NDUFA4L2, and observed comparable degrees of resistance to trastuzumab in NDUFA4L2 overexpressing cells compared with the vector control (Figure 2j and k).
NDUFA4L2 overexpression alters the mitochondrial energy metabolic pathways
We identified the central carbon metabolic pathway as one of the top pathways enriched in differentially expressed genes between the TR and parental cell lines (Figure 1d). To investigate the roles of NDUFA4L2 in modulating metabolic pathways in TR cells, we evaluated changes in a number of phenotypes associated with energy production after NDUFA4L2 overexpression. We first obtained the BT474 cell line that stably expressed NDUFA4L2. Both NDUFA4L2-overexpressing clones exhibited highly similar effects on proliferation and trastuzumab resistance profiles compared with the transiently transfected cell lines (Supplemental Figure S1B and S1C), and thus the NDUFA4L2-1 clone was used for subsequent experiments. The intracellular ATP levels were moderately decreased in the BT474TR cell line compared with trastuzumab-sensitive cells. After trastuzumab treatment, intracellular ATP in the BT474 parental line decreased to levels similar to those of BT474TR, but this effect was completely abolished in the BT474TR cell line (Figure 3a, left). Similarly, upon trastuzumab treatment, the intracellular ATP levels were significantly decreased in the vector-transfected BT474 cell line, which was rescued by NDUFA4L2 overexpression (Figure 3a, right). On the other hand, cellular lactate levels in both TR and NDUFA4L2-overexpressing cell lines were significantly elevated regardless of trastuzumab treatment, which was in contrast to the trastuzumab-mediated inhibition of lactate production in parental or vector-transfected BT474 cells (Figure 3b).
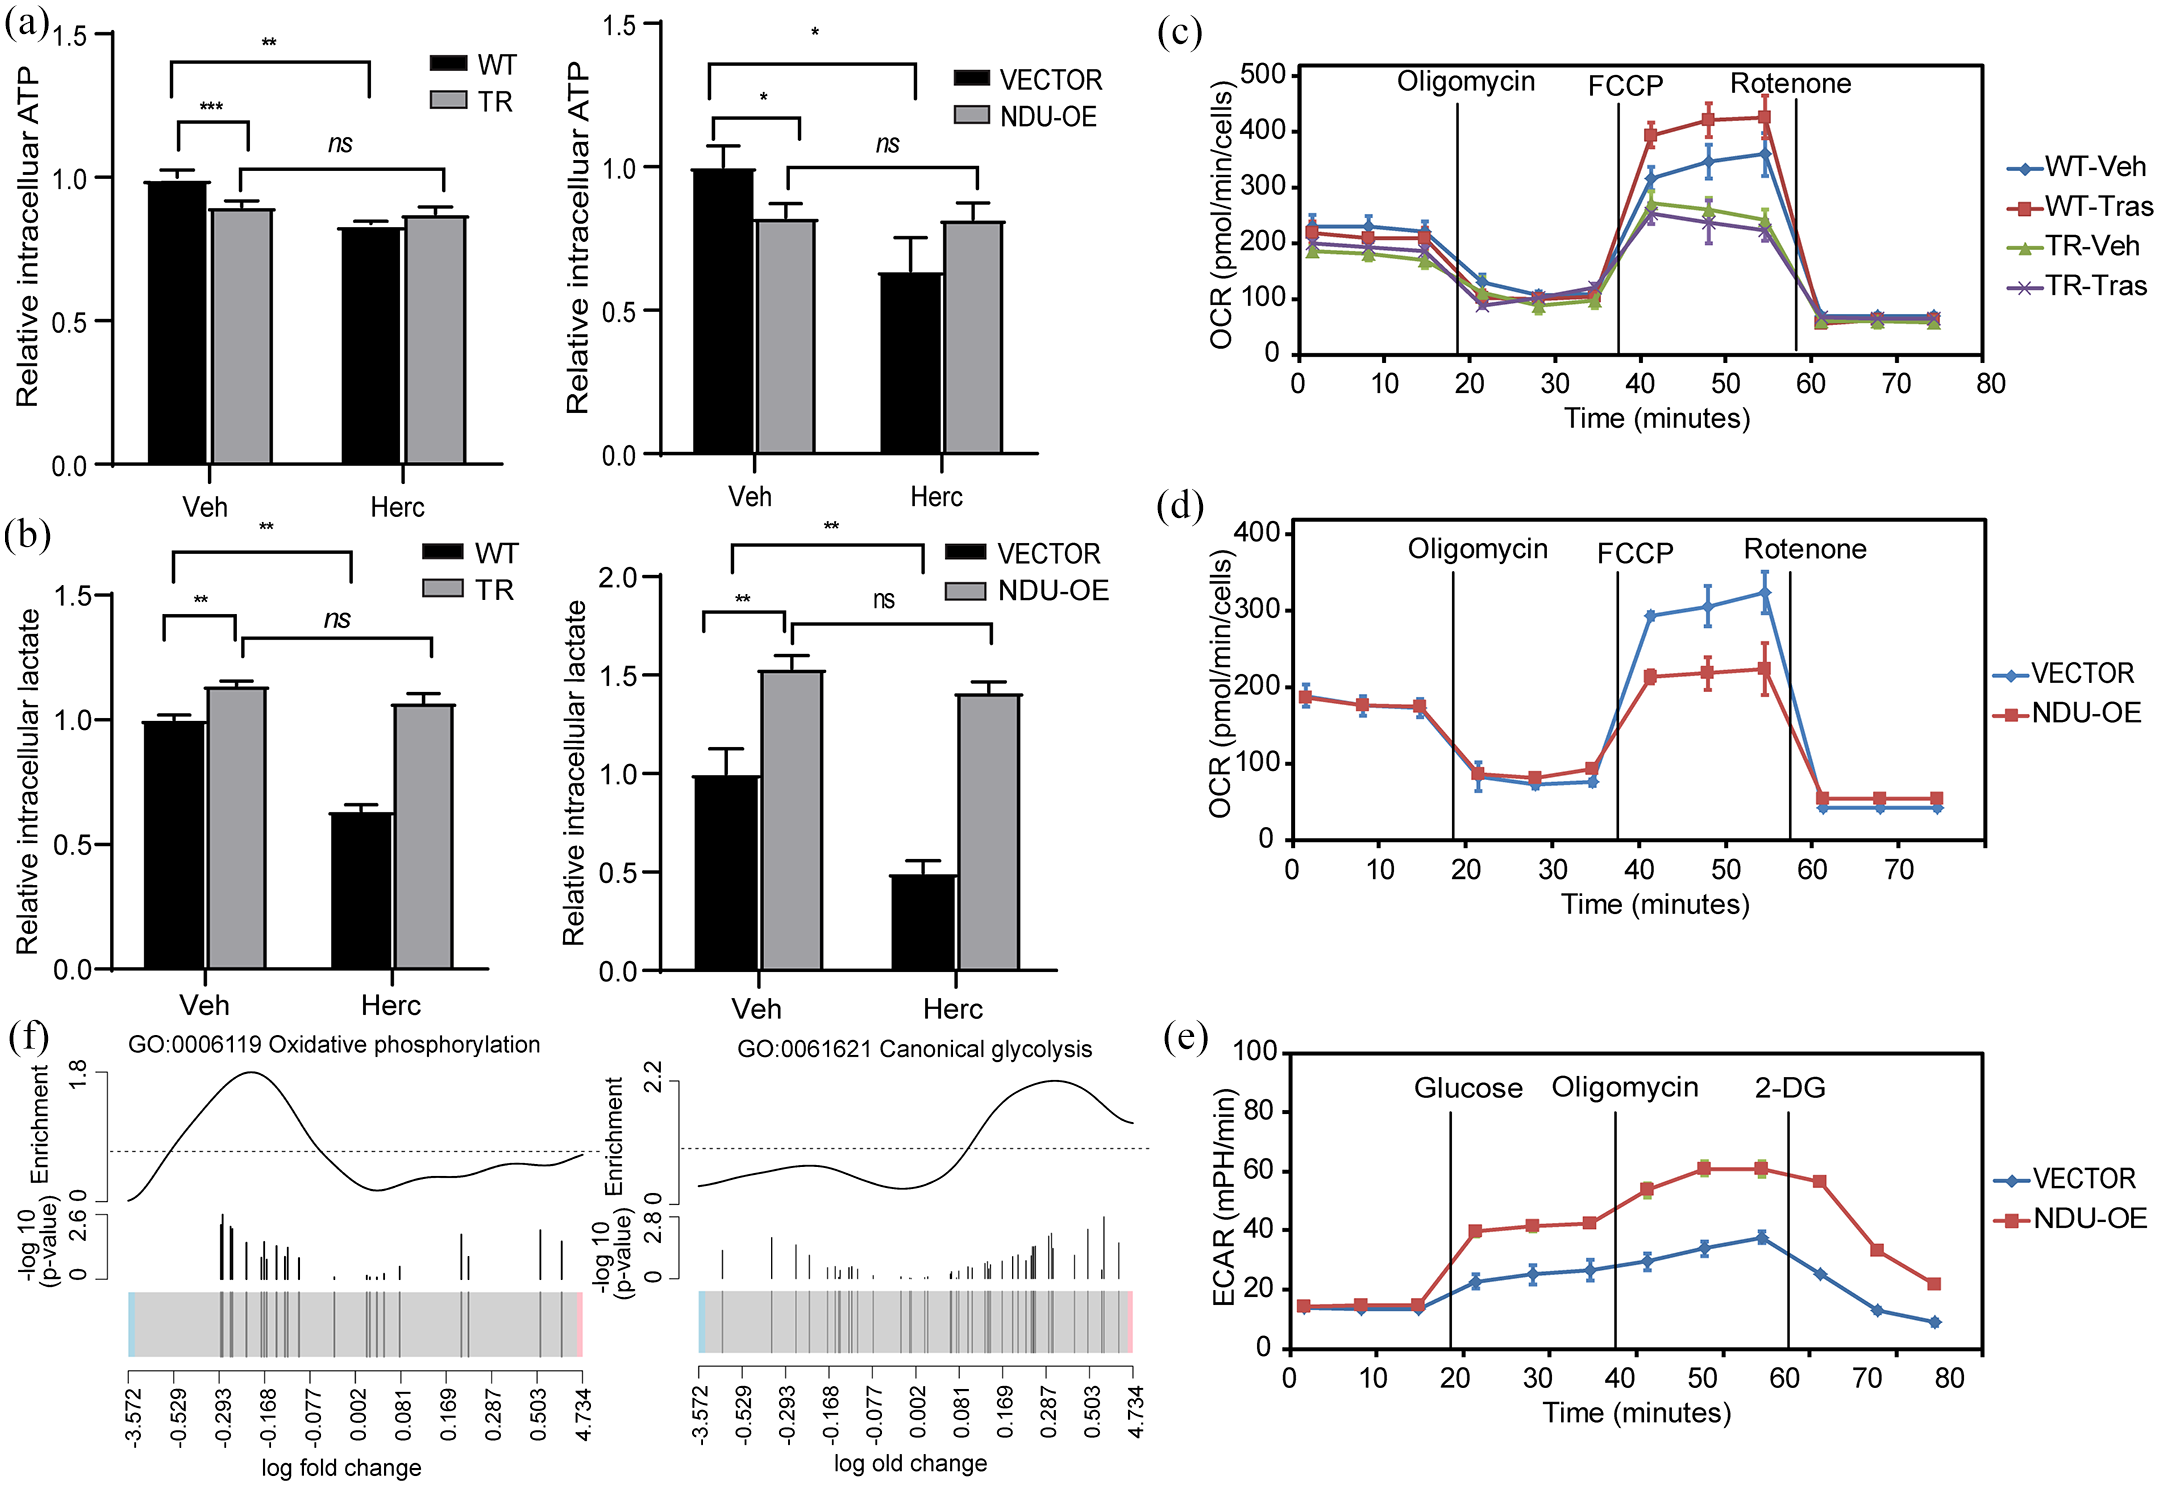
Switching metabolic pathways in trastuzumab-resistant cells and NDUFA4L2-overexpressing cells. (a) ATP consumption in the BT474TR, parental, stably expressing NDUFA4L2, and vector-transfected BT474 cells treated with trastuzumab or vehicle-only. Data are presented as mean ± SD of three independent replicates; significance was tested using Student’s t-test (*p ⩽ 0.05, **p ⩽ 0.01, ***p ⩽ 0.001; ns, not significant). (b) Lactate production in BT474TR, parental, stably expressing NDUFA4L2, and vector-transfected BT474 cells treated with trastuzumab or vehicle-only. Data are presented as mean ± SD of three independent replicates; significance was tested using Student’s t-test (**p ⩽ 0.01; ns, not significant). (c) Oxygen consumption rate (OCR) measured by Seahorse Analyzer of BT474TR and parental cells, treated with trastuzumab or vehicle-only. Data are presented as mean ± SD of three independent replicates. (d) OCR and (e) extracellular acidification rate (ECAR) measured by Seahorse Analyzer in stably overexpressing NDUFA4L2 and vector-transfected BT474 cells. Data are presented as mean ± SD of three independent replicates. (f) Barcode plot of oxidative phosphorylation and glycolysis pathway enrichment analysis using expression array data of BT474TR and parental cell lines. Genes belonging to specific pathways are marked with vertical lines in a fold-change scale and show -log 10 (p-values) of differential expression analysis.
To quantify OXPHOS versus glycolysis in each cell line, we measured OCR and ECAR using Seahorse XF Analyzer. As shown in Figure 3c, the parental cell line exhibited an approximately 50% increase in OCR after treatment with trastuzumab and FCCP stimulation. In contrast, the TR cell line showed slightly lower baseline OCR compared with the parental line and nearly no additional OCR potentials upon FCCP stimulation. Surprisingly, trastuzumab treatment further enhanced the OXPHOS potential, despite slightly decreased baseline levels. This observation was replicated in the NDUFA4L2 overexpressed cells (Figure 3d). However, NDUFA4L2 overexpression significantly increased glucose consumption and lactate production and doubled glycolysis potentials after inhibition of OXPHOS with oligomycin (Figure 3e). Consistent with the real-time metabolic potential measurements, we found that the genes related to OXPHOS (GO:0006119) were mostly downregulated, whereas genes involved in glycolysis (GO:0061621) were mostly upregulated in the BT474TR cells as shown by our expression array data (Figure 3f). Therefore, our data strongly suggest that NDUFA4L2 overexpression facilitated shifting from OXPHOS to glycolysis in TR cells.
NDUFA4L2 reduces ROS production and oxidative stress
As we showed that NDUFA4L2 was capable of shifting the energy metabolism from OXPHOS to glycolysis, we hypothesized that the shift of metabolism resulted in reduced cellular ROS level which in turn reduced cell sensitivity to trastuzumab. As shown in Figure 4a, trastuzumab treatment induced a 1.9-fold increase of median cellular levels of ROS in BT474 parental cells as compared with vehicle treatment, but no significant change was observed in TR cell line. Furthermore, baseline ROS levels in cell lines overexpressing of NDUFA4L2 was only 34% as compared with vector-transfected cells, and exhibited only 20% increase upon trastuzumab treatment, compared with additional 50% increase in vector-transfected cells from already high baseline levels (Figure 4b).

Fluorescent intensity distribution of DCFDA in (a) BT474TR and parental cells treated with trastuzumab or vehicle-only, and (b) BT474 stably transfected with NDUFA4L2 overexpression construct or vector. (c, d) Barcode plot for oxidative stress-related pathway enrichment analysis using expression array data of BT474TR and parental cell lines. Genes belonging to specific pathways are marked with vertical lines in a fold-change scale and show -log 10 (p-values) of differential expression analysis.
Since stress response pathways were enriched in our GO pathway analysis (Figure 1c), we further analyzed overall expression pattern of gene expression profiles related to oxidative stress response using our expression array data. Pathway enrichment analysis specifically on pathways related to oxidative stress response (GO:1900407 and GO:0036473) indicated a global downregulation of these genes with peak enrichment score of −2.6 and −2.3, respectively (Figure 4c and d). This is consistent with our hypothesis that reduction of cellular ROS level was due to the reduction of ROS production by inhibiting OXPHOS instead of enhanced ROS scavenging.
NDUFA4L2 is frequently expressed in trastuzumab-resistant HER2-positive breast cancer patient samples
To further evaluate whether NDUFA4L2 expression contributes to trastuzumab resistance in patients, we examined NDUFA4L2 expression using immunohistochemistry in a cohort of 68 HER2-positive breast cancer tumor tissue samples. As shown in Figure 5a and b and Supplemental Figure S2, NDUFA4L2 expression was highly increased in TR samples. The positive rate was 23/30 (76.6%) in TR versus 14/38 (36.8%) in trastuzumab-sensitive samples. The median of NDUFA4L2-positive cell density (positive cells per mm2) between sensitive and resistant groups was increased by almost five-fold (p < 0.001 by the Mann–Whitney test; Figure 5b), and the mean optical density measurement of NDUFA4L2-positive samples was also significantly increased by more than three-fold (Figure 5c). Kaplan–Meier curve analysis of RFS of patients with positive NDUFA4L2 staining presented significantly shorter relapse-free interval compared with those with negative NDUFA4L2 staining, with a hazard ratio of 2.14 (95% confidence interval 1.16–3.95) and a log-rank test p-value of 0.008 (Figure 5d). The relative risk ratios of NDUFA4L2-positive patients were 1.96-, 2.39-, and 2.17-fold higher than NDUFA4L2-negative patients at 24, 36, and 48 month periods, respectively (Table 1).
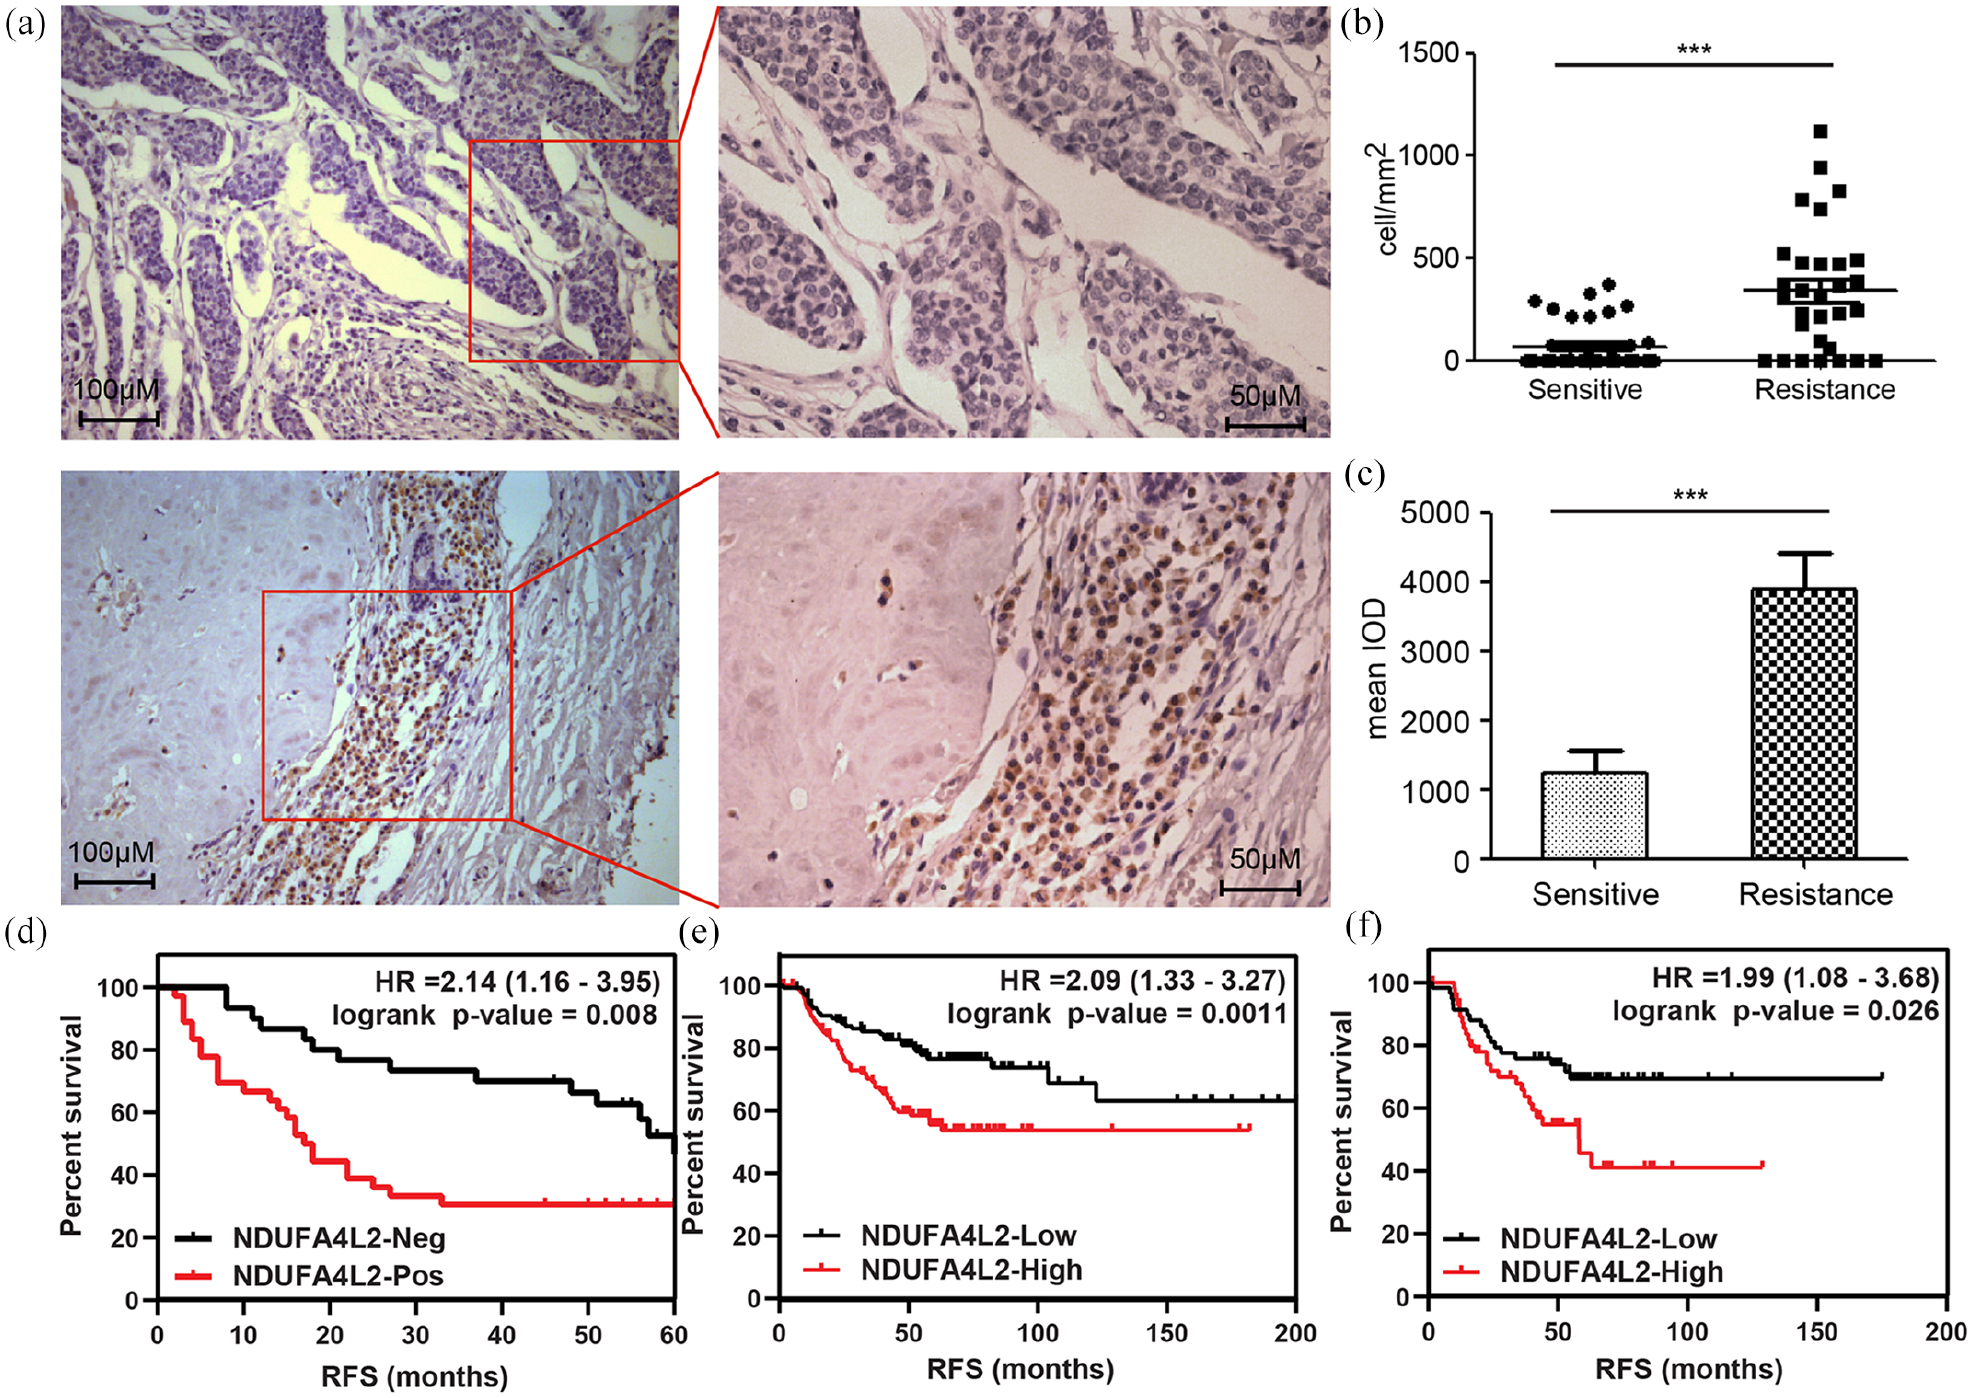
NDUFA4L2 expression in HER2-positive breast cancer patient samples and survival analysis of patients grouped by expression level of NDUFA4L2. (a) Representative pictures of immunohistochemistry (IHC) of NDUFA4L2 in tumor tissue biopsies in trastuzumab-sensitive (top) and -resistant (bottom) patients. (b) NDUFA4L2 IHC-positive cell densities in trastuzumab-sensitive versus -resistant patient samples. Horizontal line represents median positive cell density of the group; significance was tested with the Mann–Whitney’s test. (***, p-value < 0.001) (c) Optical density quantification of NDUFA4L2 IHC-positive cells in trastuzumab-sensitive versus -resistant patient samples, expressed as mean ± SD; significance was tested with the Mann–Whitney’s test. (***, p-value < 0.001) (d) Relapse-free survival plot of current cohort of patients, subgrouped by IHC NDUFA4L2 positivity. Significance was tested by log-rank test. (e) Relapse-free survival plot of KM plotter cohort, all HER2-positive patients and (f) HER2-positive, ER/PR-negative patients, subgrouped by median expression of NDUFA4L2 (probe 218484_at). Significance was tested by log-rank test.
Relative risk for relapse survival between NDUFA4L2-positive and NDUFA4L2-negative patients at different time points.

Relative risk and odds ratio are expressed as mean and 95% confidence interval.
To validate our findings, we analyzed another cohort of HER2-positive breast cancer patient samples from KMplotter (kmplot.com). Using the median expression levels of NDUFA4L2 (probe 218484_at) as the grouping cutoff, the analysis results of RFS were highly consistent with our cohort. The hazard ratio was 2.09 (95% confidence interval 1.33–3.27, log-rank test p = 0.0011) for all HER2-positive samples, and 1.99 (95% confidence interval 1.08–3.68, log-rank test p = 0.026) for HER2-positive, ER/PR-negative samples. The medium RFS interval in the low NDUFA4L2 expression group was significantly better than in the high NDUFA4L2 expression in all cases (Figure 5e and f). These results indicate that high NDUFA4L2 levels are correlated with poor prognosis in HER2-positive breast cancer patients receiving trastuzumab treatment. 15
NDUFA4L2 directly binds HER2 and modulates HER2 subcellular relocalization
We observed that HER2 translocated to the mitochondria, contributing to OXPHOS inhibition, in the BT474TR cell line. The mitochondria-localized HER2 was significantly more abundant, whereas plasma membrane/cytosolic HER2 was less abundant in the TR cell line (Figure 6a). More interestingly, in NDUFA4L2-overexpressing cells, the levels of HER2 in different subcellular factions exhibited very similar pattern as to those in TR cell lines (Figure 6a). We then examined whether NDUFA4L2 directly interacted with HER2 in NDUFA4L2-overexpressing cells using immunoprecipitation. As shown in Figure 6b, an antibody targeting NDUFA4L2 specifically pulled down HER2 protein, and an anti-HER2 antibody also specifically enriched NDUFA4L2, indicating the binding of the two proteins in the cells. Colocalization of NDUFA4L2 and HER2 and translocation of HER2 to mitochondria were further supported by immunofluorescence data (Figure 6c and d).
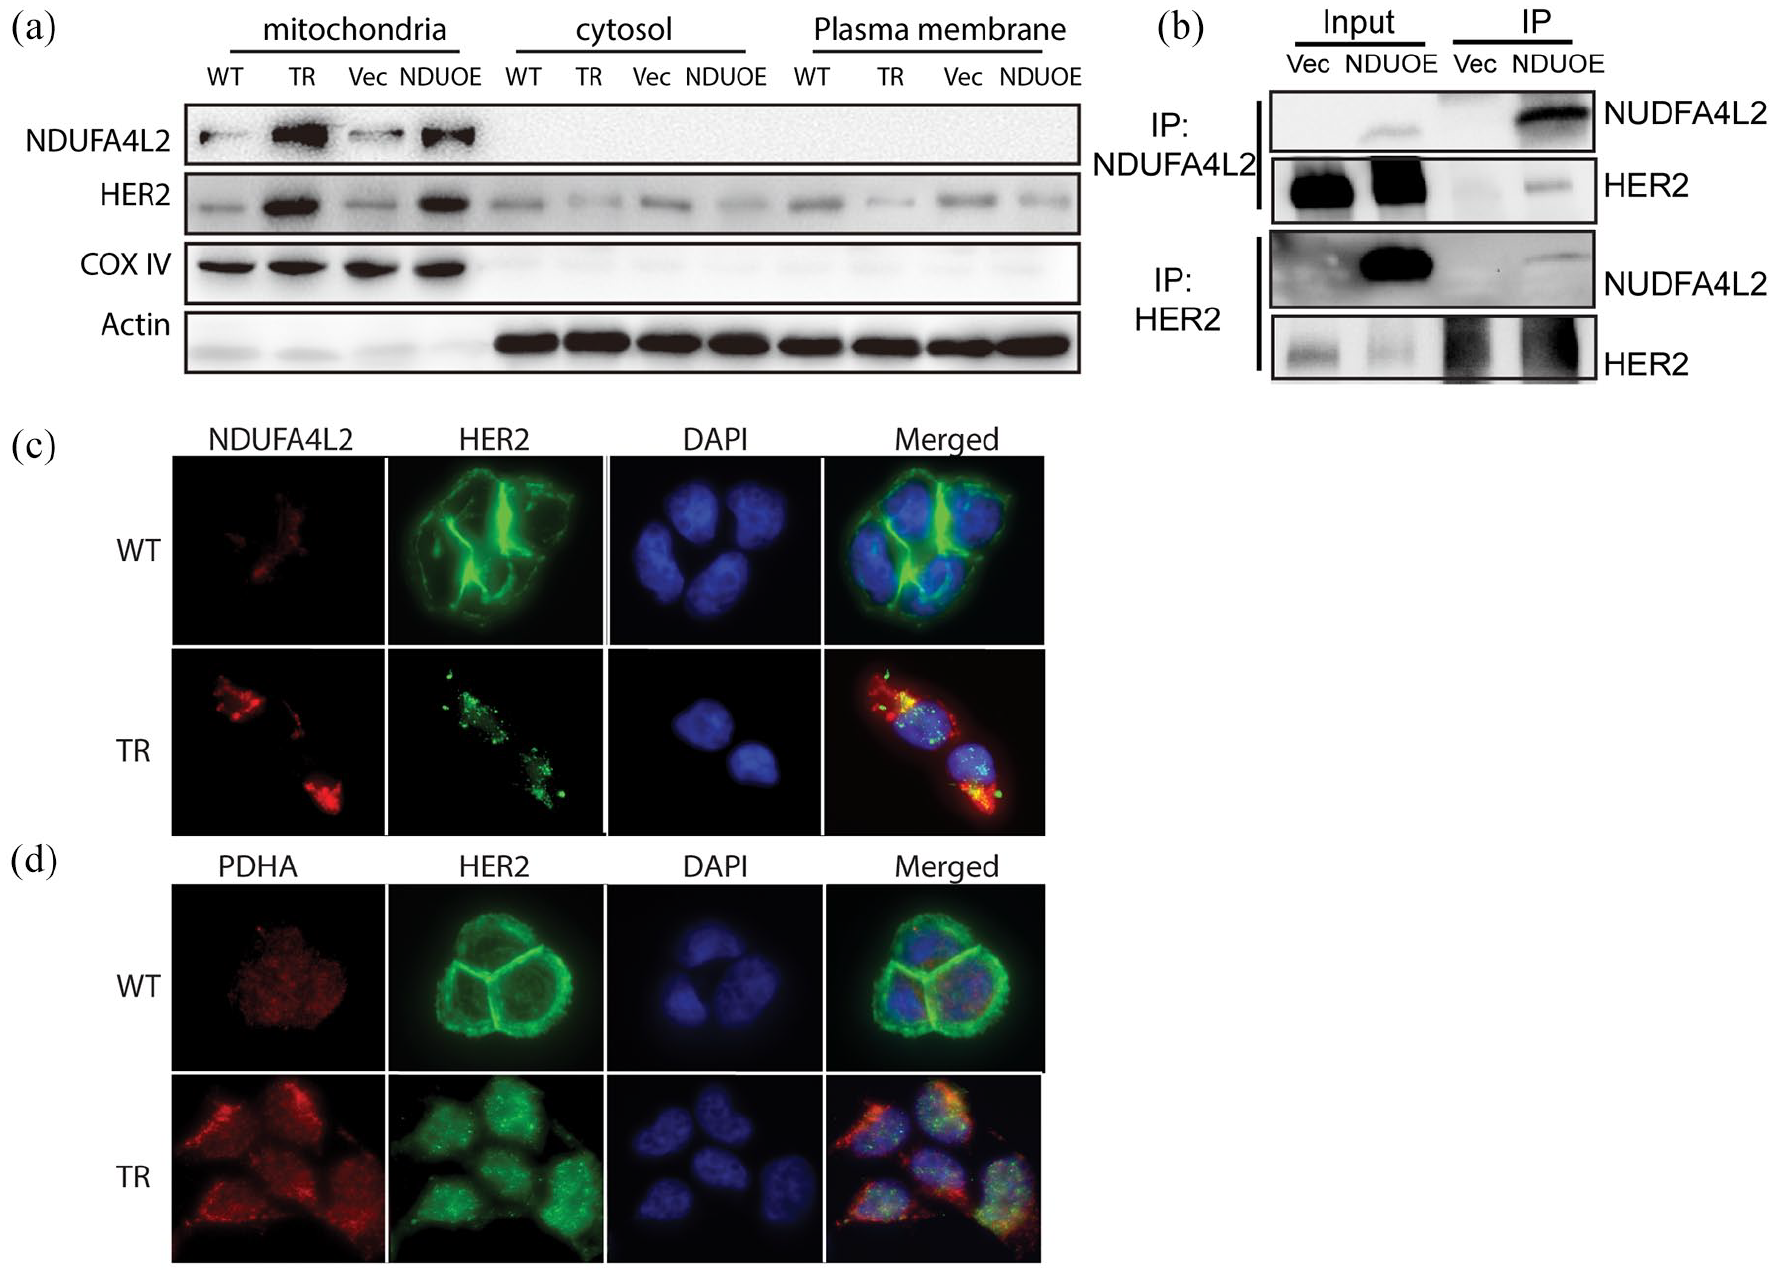
NDUFA4L2 and HER2 subcellular localization in the BT474 parental, TR and NDUFA4L2 overexpressed cell lines. (a) NDUFA4L2 and HER2 expression in BT474 cells with NDUFA4L2 overexpression in mitochondria, cytosol, and plasma membrane using COX IV and β-actin as subcellular location markers. (b) Immunoprecipitation with the lysate of BT474 stably transfected with NDUFA4L2 overexpressing construct 1 using a primary antibody against NDUFA4L2 (top) and HER2 (bottom). (c) Immunofluorescence of BT474 parental (WT) and TR cells of NDUFA4L2 and HER2. (d) Immunofluorescence of BT474 parental (WT) and TR cells of HER2 and mitochondrial marker PDHA1.
Discussion
NDUFA4L2 is a subunit of the mitochondrial electron transport chain (ETC) complex I (NADH: ubiquinone oxidoreductase). Complex I is involved in the first step of ETC, pumping electrons from NADH through a number of cofactors, including FMN and iron-sulfur clusters (Fe-S clusters), to ubiquinone acceptors. Increased complex I substrate NADH and deficiency of complex I have been associated with increased Akt-mediated cell survival and drug resistance. 16 Tello et al. 17 showed that NDUFA4L2 expression is induced by hypoxia/HIF-1 in both primary cultures as well as tumor cells, and it decreases oxygen consumption by inhibiting complex I activity and reducing ROS production. Lai et al. 18 reported that NDUFA4L2 is overexpressed in hepatocellular carcinoma and is associated with tumor formation, high invasion, and poor survival outcome. The authors showed that suppression of NDUFA4L2 via RNA interference induces high oxygen consumption, ROS production, and apoptosis in HCC cells. 18 Lucarelli et al. 15 also found elevated expression of NDUFA4L2 in clear cell renal cell carcinoma that is associated with dramatically altered mitochondrial function and cell metabolism and increased resistance to cisplatin chemotherapy. Consistent with these observations, we not only showed that expression of NDUFA4L2 was associated with mitochondrial energy metabolisms but also with trastuzumab resistance in both cell line models and in a patient cohort.
It has been reported that HER2 modulates mitochondrial functions partially via translocating to mitochondria by associating with mtHSP70 and participating in promoting glycolysis and inhibiting OXPHOS directly. Moreover, a triple negative breast cancer cell line (MDA-MB-231) overexpressing the engineered mitochondria-targeting HER2 is more resistant to trastuzumab treatment than a cell line overexpressing the WT HER2. 14 Intriguingly, we found that NDUFA4L2 directly interacted with HER2 (Figure 4), and that overexpression of NDUFA4L2 promoted HER2 enrichment in the mitochondria (Figure 2), supporting a potential role of NDUFA4L2 in modulating or stabilizing the mitochondrial translocalization of HER2.
Switching from OXPHOS to glycolysis reliance is a frequently observed mechanism for increased cancer cell proliferation and drug resistance. 19 This phenomenon has been linked to drug resistance in several cancer types, including, but not limited to, lung, ovarian, and melanoma. In breast cancer, enhanced glycolysis has been associated with lapatinib resistance, and the addition of glycolysis inhibitor has been shown to overcome trastuzumab resistance.11,20 In our study, we have shown that trastuzumab resistance is characterized by an enhancement in glycolysis similarly to what occurs in NDUFA4L2 overexpressing cells, low intrinsic ROS production at baseline, and trastuzumab treatment conditions. Most importantly, high expression levels of NDUFA4L2 were significantly associated with worse RFS in both our cohort and publicly available cohort, strongly supporting NDUFA4L2 as a biomarker for trastuzumab treatment prognosis. Furthermore, understanding the mechanisms of NDUFA4L2 in trastuzumab resistance in HER2-positive breast cancer will not only identify it as novel biomarker but also support the rationale to explore new therapies such as glycolysis inhibitors as combinational therapy with trastuzumab to prevent the development of trastuzumab resistance in the future studies.
Conclusions
Our major findings are summarized in the tentative model presented in Figure 7. Briefly, in trastuzumab-sensitive cells, the cell partially relied on OXPHOS for energy production. Upon trastuzumab treatment, OXPHOS was further elevated and cellular levels or ROS markedly increased, leading to cell death. In contrast, when NDUFA4L2 was overexpressed, probably via signaling through mitochondria-relocalized HER2, it further enhanced Warburg effects, inhibiting OXPHOS and promoting glycolysis. This led to lowering ROS production both at baseline and upon trastuzumab treatment, preventing cell death and contributing to trastuzumab resistance.

Tentative model for roles of NDUFA4L2 in modulating cell metabolism and trastuzumab sensitivity. (Top) In trastuzumab-sensitive cells, cell partially rely on OXPHOS for energy production, which, in combination with trastuzumab treatment, induces accumulation of cellular reactive oxygen species (ROS), resulting in oxidative stress and cell death. (Bottom) Overexpressed NDUFA4L2 bound to mitochondria-relocalized HER2 enhances the Warburg effects, inhibiting OXPHOS and promoting glycolysis, which in turn reduces ROS production and prevents cell death upon trastuzumab treatment.
Supplemental Material
sj-docx-1-tam-10.1177_17588359211027836 – Supplemental material for NDUFA4L2 promotes trastuzumab resistance in HER2-positive breast cancer
Supplemental material, sj-docx-1-tam-10.1177_17588359211027836 for NDUFA4L2 promotes trastuzumab resistance in HER2-positive breast cancer by Yuan Yuan, Huanyao Gao, Yongxian Zhuang, Lixuan Wei, Jia Yu, Zhe Zhang, Lili Zhang and Liewei Wang in Therapeutic Advances in Medical Oncology
Supplemental Material
sj-pdf-2-tam-10.1177_17588359211027836 – Supplemental material for NDUFA4L2 promotes trastuzumab resistance in HER2-positive breast cancer
Supplemental material, sj-pdf-2-tam-10.1177_17588359211027836 for NDUFA4L2 promotes trastuzumab resistance in HER2-positive breast cancer by Yuan Yuan, Huanyao Gao, Yongxian Zhuang, Lixuan Wei, Jia Yu, Zhe Zhang, Lili Zhang and Liewei Wang in Therapeutic Advances in Medical Oncology
Supplemental Material
sj-pdf-3-tam-10.1177_17588359211027836 – Supplemental material for NDUFA4L2 promotes trastuzumab resistance in HER2-positive breast cancer
Supplemental material, sj-pdf-3-tam-10.1177_17588359211027836 for NDUFA4L2 promotes trastuzumab resistance in HER2-positive breast cancer by Yuan Yuan, Huanyao Gao, Yongxian Zhuang, Lixuan Wei, Jia Yu, Zhe Zhang, Lili Zhang and Liewei Wang in Therapeutic Advances in Medical Oncology
Research Data
sj-tif-10-tam-10.1177_17588359211027836 – for NDUFA4L2 promotes trastuzumab resistance in HER2-positive breast cancer
sj-tif-10-tam-10.1177_17588359211027836 for NDUFA4L2 promotes trastuzumab resistance in HER2-positive breast cancer by Yuan Yuan, Huanyao Gao, Yongxian Zhuang, Lixuan Wei, Jia Yu, Zhe Zhang, Lili Zhang and Liewei Wang in Therapeutic Advances in Medical Oncology
Research Data
sj-tif-11-tam-10.1177_17588359211027836 – for NDUFA4L2 promotes trastuzumab resistance in HER2-positive breast cancer
sj-tif-11-tam-10.1177_17588359211027836 for NDUFA4L2 promotes trastuzumab resistance in HER2-positive breast cancer by Yuan Yuan, Huanyao Gao, Yongxian Zhuang, Lixuan Wei, Jia Yu, Zhe Zhang, Lili Zhang and Liewei Wang in Therapeutic Advances in Medical Oncology
Research Data
sj-tif-12-tam-10.1177_17588359211027836 – for NDUFA4L2 promotes trastuzumab resistance in HER2-positive breast cancer
sj-tif-12-tam-10.1177_17588359211027836 for NDUFA4L2 promotes trastuzumab resistance in HER2-positive breast cancer by Yuan Yuan, Huanyao Gao, Yongxian Zhuang, Lixuan Wei, Jia Yu, Zhe Zhang, Lili Zhang and Liewei Wang in Therapeutic Advances in Medical Oncology
Research Data
sj-tif-4-tam-10.1177_17588359211027836 – for NDUFA4L2 promotes trastuzumab resistance in HER2-positive breast cancer
sj-tif-4-tam-10.1177_17588359211027836 for NDUFA4L2 promotes trastuzumab resistance in HER2-positive breast cancer by Yuan Yuan, Huanyao Gao, Yongxian Zhuang, Lixuan Wei, Jia Yu, Zhe Zhang, Lili Zhang and Liewei Wang in Therapeutic Advances in Medical Oncology
Research Data
sj-tif-5-tam-10.1177_17588359211027836 – for NDUFA4L2 promotes trastuzumab resistance in HER2-positive breast cancer
sj-tif-5-tam-10.1177_17588359211027836 for NDUFA4L2 promotes trastuzumab resistance in HER2-positive breast cancer by Yuan Yuan, Huanyao Gao, Yongxian Zhuang, Lixuan Wei, Jia Yu, Zhe Zhang, Lili Zhang and Liewei Wang in Therapeutic Advances in Medical Oncology
Research Data
sj-tif-6-tam-10.1177_17588359211027836 – for NDUFA4L2 promotes trastuzumab resistance in HER2-positive breast cancer
sj-tif-6-tam-10.1177_17588359211027836 for NDUFA4L2 promotes trastuzumab resistance in HER2-positive breast cancer by Yuan Yuan, Huanyao Gao, Yongxian Zhuang, Lixuan Wei, Jia Yu, Zhe Zhang, Lili Zhang and Liewei Wang in Therapeutic Advances in Medical Oncology
Research Data
sj-tif-7-tam-10.1177_17588359211027836 – for NDUFA4L2 promotes trastuzumab resistance in HER2-positive breast cancer
sj-tif-7-tam-10.1177_17588359211027836 for NDUFA4L2 promotes trastuzumab resistance in HER2-positive breast cancer by Yuan Yuan, Huanyao Gao, Yongxian Zhuang, Lixuan Wei, Jia Yu, Zhe Zhang, Lili Zhang and Liewei Wang in Therapeutic Advances in Medical Oncology
Research Data
sj-tif-8-tam-10.1177_17588359211027836 – for NDUFA4L2 promotes trastuzumab resistance in HER2-positive breast cancer
sj-tif-8-tam-10.1177_17588359211027836 for NDUFA4L2 promotes trastuzumab resistance in HER2-positive breast cancer by Yuan Yuan, Huanyao Gao, Yongxian Zhuang, Lixuan Wei, Jia Yu, Zhe Zhang, Lili Zhang and Liewei Wang in Therapeutic Advances in Medical Oncology
Research Data
sj-tif-9-tam-10.1177_17588359211027836 – for NDUFA4L2 promotes trastuzumab resistance in HER2-positive breast cancer
sj-tif-9-tam-10.1177_17588359211027836 for NDUFA4L2 promotes trastuzumab resistance in HER2-positive breast cancer by Yuan Yuan, Huanyao Gao, Yongxian Zhuang, Lixuan Wei, Jia Yu, Zhe Zhang, Lili Zhang and Liewei Wang in Therapeutic Advances in Medical Oncology
Footnotes
Author contributions
YY and LW conceived the study; YY, YZ, HG, YJ, ZZ, and LW performed the experiments; YY and HG performed the analysis; YY, HG, YZ, YJ, LZ and LW wrote the manuscript.
Conflict of interest statement
Dr. Wang is the cofounder and stock holder of OneOme Inc. All other authors declare no competing interests for this work.
Funding
The authors disclosed receipt of the following financial support for the research, authorship, and/or publication of this article: The project was supported by the National Youth Natural Science Foundation of China (Grant No. 81703548) and by the Jiangsu Provincial Medical Youth Talent (QNRC2016647).
Data accessibility
Microarray expression data for the BT474 and BT474-TR cell lines are available for downloading on GEO.
Supplemental material
Supplemental material for this article is available online.
References
Supplementary Material
Please find the following supplemental material available below.
For Open Access articles published under a Creative Commons License, all supplemental material carries the same license as the article it is associated with.
For non-Open Access articles published, all supplemental material carries a non-exclusive license, and permission requests for re-use of supplemental material or any part of supplemental material shall be sent directly to the copyright owner as specified in the copyright notice associated with the article.