
Abstract
Background:
PARP inhibitor (PARPi) monotherapy is a new strategy in BRCA germ-line deficient triple negative breast cancer (TNBC). However, not all patients respond, and the development of resistance limits the use of PARPi monotherapy. Therefore, the development of alternative synthetic lethality strategy, including in sporadic TNBC, is a priority. XRCC1, a key player in base excision repair, single strand break repair, nucleotide excision repair and alternative non-homologous end joining, interacts with PARP1 and coordinates DNA repair. ATR, ATM and Wee1 have essential roles in DNA repair and cell cycle regulation.
Methods:
Highly selective inhibitors of ATR (AZD6738), ATM (AZ31) and Wee1 (AZD1775) either alone or in combination with olaparib were tested for synthetic lethality in XRCC1 deficient TNBC or HeLa cells. Clinicopathological significance of ATR, ATM or Wee1 co-expression in XRCC1 proficient or deficient tumours was evaluated in a large cohort of 1650 human breast cancers.
Results:
ATR (AZD6738), ATM (AZ31) or Wee1 (AZD1775) monotherapy was selectively toxic in XRCC1 deficient cells. Selective synergistic toxicity was evident when olaparib was combined with AZD6738, AZ31 or AZD1775. The most potent synergistic interaction was evident with the AZD6738 and olaparib combination therapy. In clinical cohorts, ATR, ATM or Wee1 overexpression in XRCC1 deficient breast cancer was associated with poor outcomes.
Conclusion:
XRCC1 stratified DNA repair targeted combinatorial approach is feasible and warrants further clinical evaluation in breast cancer.
Keywords
Introduction
PARP inhibitor monotherapy (olaparib, niraparib, rucaparib and talazoparib) is an exciting new strategy in BRCA germ-line deficient triple negative breast cancer (TNBC) or ovarian cancer and in platinum sensitive sporadic ovarian cancers.1–4 PARP inhibitors trap PARP on DNA, stall replication forks and ultimately generate double strand breaks (DSBs), which is processed through the homologous recombination repair (HR) pathway. Cancer cells with impaired HR due to BRCA deficiency will accumulate DSBs, which ultimately results in selective cell death. 5 Response rate of up to 50% has been observed in clinical studies but not all patients obtain benefit from PARP inhibitor monotherapy. In addition, a significant limitation is that BRCA germ-line mutations are rare and whether PARP inhibitors will have clinical impact in non-BRCA germ line mutated tumours (such as germ-line mutations in ATM, BARD1 or RAD51) or in sporadic TNBCs that have epigenetic silencing of BRCA1 is yet to be established. Furthermore, the development of resistance (intrinsic or acquired) to PARP inhibitors is an emerging clinical problem. 5 Whilst multiple mechanisms of resistance have been described, 6 induction of additional back-up DNA repair and/or cell cycle regulatory mechanisms is a key contributor to treatment failure. Therefore, the search for alternative synthetic lethality partners and combinations is needed to expand therapeutic opportunities.
X-ray repair cross-complementing gene 1 (XRCC1) is a multifunctional protein with roles in base excision repair (BER), single strand break repair (SSBR), alternative non-homologous end joining (alt-NHEJ) and nucleotide excision repair. 7 XRCC1 interacts with PARP1 and promotes coordination of DNA repair. Moreover, PARP-dependent recruitment of XRCC1 is also essential for protecting, repairing and restarting stalled replication forks generated due to genotoxic stress. 7 We have previously shown that XRCC1 deficiency is a feature of aggressive TNBCs. 8 Ataxia-telangiectasia related protein kinase (ATR) is a serine threonine kinase belonging to the PIKK family (phosphoinositide 3-kinase-like-family of protein kinase) and a key regulator of genomic integrity. ATR is activated by single stranded–double stranded DNA junctions generated at sites of DNA damage, during stalled replication forks and at resected double strand breaks. 9 Ataxia-telangiectasia mutated protein kinase (ATM), a member of the PIKK family of serine threonine kinases, is activated and recruited to sites of DSBs through the MRN (Mre11-Rad50-NBS1) complex. Activated ATM in turn phosphorylates several proteins involved in the coordination of DNA repair, cell cycle progression and apoptosis cellular homeostasis. 9 We have previously confirmed the clinicopathological significance of ATM 10 and ATR 11 in sporadic breast cancers including in TNBCs. Wee1 is a tyrosine kinase involved in the phosphorylation and inactivation of cyclin-dependent kinase 1 (CDK1/CDC2)-bound cyclin B, resulting in G2 cell cycle arrest in response to DNA damage to allow time for DNA repair. Recent preclinical data additionally implicates Wee1 in maintenance of genomic integrity during S phase. Both ATM and ATR can activate Chk1, which in turn phosphorylates Wee1. Activated Wee1 phosphorylates and inactivates cyclin dependent kinases (CDKs) 1 and 2, which in turn regulate intra-S and G2 cell cycle check points. Wee1 also has recognized roles during entry into mitosis, DNA replication and DNA repair. 12
Small molecular inhibitors of ATM, ATR and Wee1 have recently emerged as promising anti-cancer compounds in solid tumours. AZD6738 (hereafter ATRi) is a highly potent and specific ATP competitive orally bioavailable inhibitor of ATR with an in vitro enzyme IC50 of 0.001 µM and inhibition of ATR substrate CHK1 Ser345 phosphorylation in cells at IC50 of 0.074 µM.13–16 AZD6738 is currently under early phase clinical trial evaluation in various solid tumours either alone 17 or in combination with cytotoxic therapy (https://clinicaltrials.gov/ct2/results?term=AZD6738&Search=Search). AZ31 (hereafter ATMi) is a novel, potent and selective ATP competitive orally bioavailable inhibitor of ATM inhibitor with an in vitro enzyme IC50 of <0.002 µM. 18 AZ31 (hereafter ATRi) exhibits up to 20 times greater potency in cells and improved selectivity compared with KU55933 19 and KU60019. 20 AZD1775 (hereafter Wee1i) is a highly selective, potent, ATP competitive, orally bioavailable inhibitor of Wee1 kinase with an enzyme IC50 of 5.18 nM. In vitro, AZD1775 inhibits Wee1 activity and induces DNA damage as well as G2 checkpoint escape in cell based assays with an EC50 of about 80 nm.21–23 AZD1775 is under early phase clinical trial evaluation in solid tumours (https://clinicaltrials.gov/ct2/results?cond=&term=azd1775&cntry=&state=&city=&dist=). In the current study, we tested selective cytotoxicity of ATM, ATR or Wee1 blockade either alone or in combination with PARP inhibitor in XRCC1 deficient cancers.
Materials and methods
Compounds and reagents
Olaparib (AZD2281), ATM inhibitor (AZ31) and ATR inhibitor (AZD6738) were kindly provided by AstraZeneca Pharmaceuticals. Wee1 inhibitor (AZD1775) was purchased from Selleckchem, UK. The antibodies used in the current study are as follows; XRCC1 (clone 33-2-5, Thermofisher, UK), ATM (clone Y170, Abcam, UK), Wee1 (clone ab203236, Abcam, UK), ATR (clone 2790S, Cell Signaling, USA). Histone H2AX phosphorylated at Ser139 (Sigma, UK). Calcein AM and ethidium homodimer-1were purchased from Thermofisher, UK.
Cell lines and culture
MDA-MB-231 (XRCC1 proficient), MDA-MB-157 (XRCC1 deficient) cells were purchased from American Type Culture Collection (ATCC, Manassas, USA). Cell lines authentication was performed by AuthentiFiler™ PCR Amplification Kit. MDA-MB-231 was cultured in minimum essential amino acids medium supplemented with 10% FBS, 1% penicillin-streptomycin, 1% L-glutamine and 1% non-essential amino acids. MDA-MB-157 was grown in IMDM medium supplemented with 15% FBS and 1% penicillin/streptomycin). XRCC1-deficient HeLa SilenciX cells and controls XRCC1-proficient HeLa cells were purchased from Tebu-Bio (www.tebu-bio.com). SilenciX cells were grown in Dulbecco’s Modified Eagle’s Medium supplemented with 10% FBS, 1% penicillin/streptomycin and 125 μg/ml hygromycin B. Mycoplasma testing was performed using mycoProbe mycoplasma detection kit (R&D systems).
Generation of XRCC1 knockouts using CRISPR/Cas-9 system
MDA-MB-231 cells were transfected with oligonucleotides carrying gRNA silencing XRCC1cloned in a Plv-U6g-EPCG plasmid (Sigma, UK). Briefly, cells were seeded at 50–60% confluency in six-well plates overnight. DNA (2–3 µg) was delivered using Lipofectamine 3000 (Invitrogen, UK) in an Opti-MEM medium. Desired clones were selected in Puromycin (10 ug/ml) for 14 days.
Clonogenic assays
Two hundred and fifty cells were seeded in six-well plates overnight. Then cells were treated with AZ31 or AZD6738 or AZD1775 at the indicated concentrations alone or pre-treated with 5 µM of olaparib. The plates were left in the incubator for 14 days; after incubation colonies were washed with PBS, fixed and stained with crystal violet, acetic acid and methanol mixture and counted.
Combination index
The level of synergism was measured and quantified by the drug combination index using the Chou and Talalay method 24 based on experimental dose–response data.
Cell proliferation assays
XRCC1 proficient and deficient cells were seeded in 96-well plates (100 cells/well) overnight. Then cells were treated with 5 µM of olaparib for 24 h or left untreated. After that the inhibitors were added at the indicated concentrations for 5 days. Cell viability was measured by cell titre cell proliferation assay (MTS) (Promega, UK).
Functional studies
Cells were seeded in six-well plates overnight. Cells were treated with 5 µM of olaparib for 24 h or left untreated. Then cells were treated with AZ31 (10 µM) or AZD6738 (5 µM) or AZD1775 (10 µM) for another 24 h before following the flow cytometry analysis staining protocol. For cell cycle analysis, cells were collected by trypsinization and washed with ice-cold PBS, then fixed in 70% ethanol for 30 mins. After removal of the fixative solution by centrifugation cells were labelled with phospho histone (γH2AX) Ser139 FITC antibody. Cells were then treated with RNase (5 µg/ml) and propidium iodide (10 ug/ml) (Sigma Aldrich) for DNA staining. For apoptosis analysis cells were resuspended in annexin V binding buffer and stained with annexinV and propidium iodide as per the annexinV detection kit (BD Biosciences). Cells were run on FC500 (Beckman Coulter, USA). Data were analysed by Weasel software.
Generation of 3D spheroids
Cells were seeded in ultra-low attachment six-well plates using the promo cell serum-free cancer stem cells medium. After 14 days cells were treated with the indicated doses of the inhibitors alone or pre-treated with olaparib. For staining, cells were fixed with formaldehyde 37% and stained with 2 µM calcein AM and 1.5 µM ethidium homodimer-1. Imaging was carried out using Leica SP2 confocal laser scanning microscope.
Immunohistochemical staining of XRCC1, ATM, ATR, Wee1 and BRCA1 in clinical breast cancers
See Supplemental material methods online for full details. All patients provided informed consent for use of tissue samples. Patient demographics are summarized in Supplemental Table S3. Immunohistochemical staining was performed using the Thermo Scientific Shandon Sequenza chamber system (REF: 72110017), in combination with the Novolink Max Polymer Detection System (RE7280-K: 1250 tests), and the Leica Bond Primary Antibody Diluent (AR9352), each used according to the manufacturer’s instructions (Leica Microsystems). Supplemental Table S4 and Supplemental methods summarize antigens, primary antibodies, clone, source and optimal dilution used for each immunohistochemical marker. Whole field inspection of the core was scored and intensities of nuclear staining for DNA repair markers were grouped as follows: 0 = no staining, 1 = weak staining, 2 = moderate staining, 3 = strong staining. The percentage of each category was estimated (0–100%). H-score (range 0–300) was calculated by multiplying intensity of staining and percentage staining. Supplemental methods summarize the scoring system used for each immunohistochemical marker (XRCC1, ATM, ATR, Wee1 and BRCA1).
Results
We tested MDA-MB-231 wild type (TNBC, XRCC1 proficient), XRCC1 knockout (KO) MDA-MB-231 and MDA-MB-157 (TNBC, XRCC1 deficient) breast cancer cells. In addition, HeLa control cells and HeLa_XRCC1_deficient SilenciX cells were evaluated for additional validation in cytotoxicity studies.
Cytotoxicity of AZD6738 either alone or in combination with olaparib in XRCC1 deficient cells
All cell lines have robust expression of ATR (Supplemental Figure S1A). Single agent activity of AZD6738 is shown in Supplemental Figure S1B. AZD6738 monotherapy significantly increased cytotoxicity in MDA-MB-157 and MDA-MB-231_XRCC1_KO cells compared with control MDA-MB-231 cells. When olaparib and AZ31 were combined, we observed significantly increased sensitization in MDA-MB-231_XRCC1_KO cells and MDA-MB-157 cells compared with control cells [Figure 1(A)]. The combination index was 0.225 and 0.162 respectively, confirming a synergistic interaction (Supplemental Table S2). Increased cytotoxicity either with AZD6738 monotherapy or in combination with olaparib was associated with increased DSB accumulation [Figure 1(B)], S-phase arrest [Figure 1(C); Supplemental Table S1] and increased apoptotic cells [Figure 1(D)]. We also tested single agent activity of olaparib in XRCC1 deficient and proficient cells. As shown in Figure 1(E), selectively cytotoxicity of olaparib monotherapy in MDA-MB-157 and MDA-MB-231_XRCC1_KO cells compared with control MDA-MB-231 cells was comparable to AZD6738 monotherapy. Increased toxicity to olaparib was associated with DSB accumulation [Figure 1(F)], cell cycle arrest [G2/M arrest in MDA-MB-231_XRCC1_KO and S-phase arrest in MDA-MB-157 cells; Figure 1(G)] and increased apoptotic cells [Figure 1(H)].

(A) Clonogenic survival assay for AZD6738 in 231control and XRCC1_KO cells untreated or pre- treated with olaparib (5 μM). (B) Quantification of γH2AX levels by flow cytometry in 231control, 231 (XRCC1_KO) and 157 cells treated with AZD6738 (5 μM) or treated with AZD6738 (5 μM) plus olaparib (5 μM) for 24 h. (C) Quantification of cell cycle progression by flow cytometry in 231control, 231 (XRCC1_KO) and 157 cells treated with AZD6738 (5 μM) or treated with AZD6738 (5 μM) plus olaparib (5 μM) for 24 h. (D) Quantification of apoptotic cells by annexin V flow cytometry in 231control, 231 (XRCC1_KO) and 157 treated with AZD6738 (5 μM) or treated with AZD6738 (5 μM) plus olaparib (5 μM) for 24 h. Cells were plated overnight then treated with 5 μM of olaparib or left untreated for 24 h. The next day, untreated and olaparib pre-treated cells were treated with 5 μM of AZD6738 for another 24 h. After incubation cells were collected by trypsinization and stained for flow cytometry analysis as described in the Methods section. (E) Clonogenic survival assay for olaparib in 231control and XRCC1_KO cells untreated or pre-treated with olaparib. (F) Quantification of γH2AX levels by flow cytometry in 231control, 231 (XRCC1_KO) and 157 cells treated with olaparib. (G) Quantification of cell cycle progression by flow cytometry in 231control, 231 (XRCC1_KO) and 157 cells treated with olaparib. (H) Quantification of apoptotic cells by annexin V flow cytometry in 231control, 231 (XRCC1_KO) and 157 treated with olaparib. (I) Clonogenic survival assay for HeLa control and HeLa (XRCC1_KD) cells untreated or olaparib pre-treated (5 μM) in different doses of AZD6738. (J) Quantification of γH2AX levels by flow cytometry in HeLa control and (XRCC1_KO) cells treated with AZD6738 (5 μM) or treated with AZD6738 (5 μM) plus olaparib (5 μM) for 24 h. (K) Quantification of cell cycle progression by flow cytometry in HeLa control and (XRCC1_KO) cells treated with AZD6738 (5 μM) or treated with AZD6738 (5 μM) plus olaparib (5 μM) for 24 h. (L) Quantification of apoptotic cells by annexin V flow cytometry in HeLa control and (XRCC1_KO) cells treated with AZD6738 (5 μM) or treated with AZD6738 (5 μM) plus olaparib (5 μM) for 24 h. Cells were plated overnight then treated with 5 μM of olaparib or left un-treated for 24 h. The next day, untreated and olaparib pre-treated cells were treated with 5 μM of AZD6738 for another 24 h. After incubation cells were collected by trypsinization and stained for flow cytometry analysis as described in the Methods section.
We then tested in HeLa_XRCC1_KD cells compared with HeLa control cells. Single agent activity of AZD6738 is shown in Supplemental Figure S1B. When olaparib and AZD6738 were combined, synergistic cytotoxicity was evident in HeLa_XRCC1_KD cells compared with HeLa control cells [Figure 1(I)]. The combination index was 0.52 (Supplemental Table S2). Increased toxicity was associated with DSB accumulation [Figure 1(J)], cell cycle arrest cells [Figure 1(K); Supplemental Table S1) and increased apoptotic cells [Figure 1(L)]. We also tested single agent activity of olaparib in HeLa_XRCC1_KD cells compared with HeLa control cells. Selectively cytotoxicity of olaparib monotherapy was comparable to AZD6738 monotherapy [Figure 2(A)]. Increased toxicity to olaparib was associated with DSB accumulation [Figure 2(B)] in HeLa_XRCC1_KD cells, which was comparable to DSB accumulation observed in a BRCA2 deficient HeLa model [Figure 2(C)], S-phase cell cycle arrest [Figure 1(D)] and increased apoptotic cells [Figure 1(E)].
To recapitulate an in vivo system, we generated 3D-spheroids of MDA-MB-231 control, MDA-MB-231_XRCC1_KO and MDA-MB-157 cells [Figure 2(F)]. Similar to XRCC1 proficient cells, untreated XRCC1 KO cells retained spheroid forming capacity. AZD6738 monotherapy significantly reduced spheroid size [Figure 2(G)] and viability [Figure 2(H)]. AZD6738/olaparib combination therapy substantially reduced spheroid size [Figure 2(G)] and viability [Figure 2(H)]. Similarly, in HeLa_XRCC1_KD cells, AZD6738 monotherapy or in combination with olaparib significantly reduced spheroid size [Figure 2(I) and (J)] and viability [Figure 2(K)].

(A) Clonogenic survival assay for olaparib in HeLa control and HeLa_XRCC1_KO cells untreated or treated with olaparib. (B) Quantification of γH2AX levels by flow cytometry in HeLa control and HeLa_XRCC1_KO cells treated with olaparib. (C) Quantification of cell cycle progression by flow cytometry in in HeLa control and HeLa_XRCC1_KO cells treated with olaparib. (D) Quantification of apoptotic cells by annexin V flow cytometry in in HeLa control and HeLa_ XRCC1_KO cells treated with olaparib. (E) Quantification of γH2AX levels by flow cytometry in HeLa control and HeLa_BRCA2_KO cells treated with olaparib. (F) Representative photo micrographic images of 231 control, 231 (XRCC1_KO), 157 cells, HeLa control and HeLa_XRCC1_KD 3D-spheroids treated with AZD6738 (5 μM) or treated with AZD6738 (5 μM) plus olaparib (5 μM). (G) Quantification of spheroid size in 231control, 231 (XRCC1_KO) and 157 treated with AZD6738 (5 μM) or treated with AZD6738 (5 μM) plus olaparib (5 μM). (H) Quantification of viable, dead cells by flow cytometry in 231control, 231 (XRCC1_KO) and 157 treated with AZD6738 (5 μM) or treated with AZD6738 (5 μM) plus olaparib (5 μM). (I) Representative photo micrographic images of HeLa control and (XRCC1_KO) cells treated with AZD6738 (5 μM) or treated with AZD6738 (5 μM) plus olaparib (5 μM). (J) Quantification of spheroid size in 231control, 231 (XRCC1_KO) and 157 treated with AZD6738 (5 μM) or treated with AZD6738 (5 μM) plus olaparib (5 μM). (K) Quantification of viable, dead cells by flow cytometry in 231control, 231 (XRCC1_KO) and 157 treated with AZD6738 (5 μM) or treated with AZD6738 (5 μM) plus olaparib (5 μM).
AZ31 either alone or in combination with olaparib is selectively toxic in XRCC1 deficient cells
ATM protein expression was robust in all cell lines (Supplemental Figure S1C). Single agent activity of AZ31 is shown in Supplemental Figure S1D. AZ31 monotherapy significantly increased cytotoxicity in MDA-MB-157 and MDA-MB-231_XRCC1_KO cells compared with control MDA-MB-231 cells. When olaparib and AZ31 were combined, we observed significantly increased sensitization in MDA-MB-231_XRCC1_KO cells and MDA-MB-157 cells compared with control cells [Figure 3(A)]. The combination index was 0.62 and 0.75 respectively, confirming a synergistic interaction (Supplemental Table S2). AZ31 monotherapy or olaparib/AZ31 combination therapy substantially increased DSBs [Figure 3(B)], G1-arrested cells [Figure 3(C); Supplemental Table S1] and apoptotic cells [Figure 3(D)]. In HeLa cells similarly, AZ31 either alone or in combination with olaparib was selectively toxic in XRCC1 deficient cells [Figure 3(E)] and associated with DSB accumulation [Figure 3(F)], cell cycle arrest [Figure 3(G); Supplemental Table S1) and increased apoptosis [Figure 3(H)]. In 3D-spheroid models, AZ31 monotherapy or AZ31/olaparib combination therapy significantly reduced spheroid size [Figure 3(I) and (J)] and viability [Figure 3(K)]. Similarly, in HeLa_XRCC1_KD cells, AZ31monotherapy or in combination with olaparib significantly reduced spheroid size [Figure 3(L) and (M)] and viability [Figure 3(N)].

(A) Clonogenic survival assay for AZ31 in 231control and XRCC1_KO cells untreated or pre-treated with olaparib (5 μM). (B) Quantification of γH2AX levels by flow cytometry in 231control, 231 (XRCC1_KO) and 157 cells treated with AZ31 (10 μM) or treated with AZ31 (10 μM) plus olaparib (5 μM) for 24 h. (C) Quantification of cell cycle progression by flow cytometry in 231control, 231 (XRCC1_KO) and 157 cells treated with AZ31 (10 μM) or treated with AZ31 (10 μM) plus olaparib (5 μM) for 24 h. (D) Quantification of apoptotic cells by annexin V flow cytometry in 231control, 231 (XRCC1_KO) and 157 treated with AZ31 (10 μM) or treated with AZ31 (10 μM) plus olaparib (5 μM) for 24 h. Cells were plated overnight then treated with 5 μM of olaparib or left untreated for 24 h. The next day, untreated and olaparib pre-treated cells were treated with 10 μM of AZ31 for another 24 h. After incubation cells were collected by trypsinization and stained for flow cytometry analysis as described in the Methods section. (E) Clonogenic survival assay for HeLa control and HeLa (XRCC1_KD) cells untreated or olaparib pre-treated (5 μM) in different doses of AZ31. (F) Quantification of γH2AX levels by flow cytometry in HeLa control and (XRCC1_KO) cells treated with AZ31 (10 μM) or treated with AZ31 (10 μM) plus olaparib (5 μM) for 24 h. (G) Quantification of cell cycle progression by flow cytometry in HeLa control and (XRCC1_KO) cells treated with AZ31 (10 μM) or treated with AZ31 (10 μM) plus olaparib (5 μM) for 24 h. (H) Quantification of apoptotic cells by annexin V flow cytometry in HeLa control and (XRCC1_KO) cells treated with AZ31 (10 μM) or treated with AZ31 (10 μM) plus olaparib (5 μM) for 24 h. Cells were plated overnight then treated with 5 μM of olaparib or left untreated for 24 h. The next day, untreated and olaparib pre-treated cells were treated with 10 μM of AZ31 for another 24 h. After incubation cells were collected by trypsinization and stained for flow cytometry analysis as described in the Methods section. (I) Representative photo micrographic images of 231 control, 231 (XRCC1_KO), 157 cells, HeLa control and HeLa_XRCC1_KD 3D-spheroids treated with AZ31 (10 μM) or treated with AZ31 (10 μM) plus olaparib (5 μM). (J) Quantification of spheroid size in 231control, 231 (XRCC1_KO) and 157 treated with AZ31 (10 μM) or treated with AZ31 (10 μM) plus olaparib (5 μM). (K) Quantification of viable cells and dead cells by flow cytometry in 231control, 231 (XRCC1_KO) and 157 treated with AZ31 (10 μM) or treated with AZ31 (10 μM) plus olaparib (5 μM). (L) Representative photo micrographic images of HeLa control and (XRCC1_KO) cells treated with AZ31 (10 μM) or treated with AZ31 (10 μM) plus olaparib (5 μM). (M) Quantification of spheroid size in HeLa control, HeLa (XRCC1_KO treated with AZ31 (10 μM) or treated with AZ31 (10 μM) plus olaparib (5 μM). (L) Quantification of viable cells and dead cells by flow cytometry in HeLa control, HeLa (XRCC1_KO treated with AZ31 (10 μM) or treated with AZ31 (10 μM) plus olaparib (5 μM).
Cytotoxicity of AZD1775 either alone or in combination with olaparib in XRCC1 deficient cells
As shown in Supplemental Figure S1E, cell lines have robust Wee1 expression. Single agent activity of AZD1775 is shown in Supplemental Figure S1F. AZD1775 monotherapy significantly increased cytotoxicity in MDA-MB-157 and MDA-MB-231_XRCC1_KO cells compared with control MDA-MB-231 cells. When olaparib and AZ31 were combined, increased sensitization was evident in MDA-MB-231_XRCC1_KO cells and MDA-MB-157 cells compared with control cells [Figure 4(A)]. The combination index was 0.25 and 0.9 respectively, confirming a synergistic interaction (Supplemental Table S2). AZD1775 monotherapy or olaparib/AZD6738 combination therapy increased DSBs [Figure 4(B)], S-phase arrested cells [Figure 4(C); Supplemental Table S1) and apoptotic cells [Figure 4(D)].
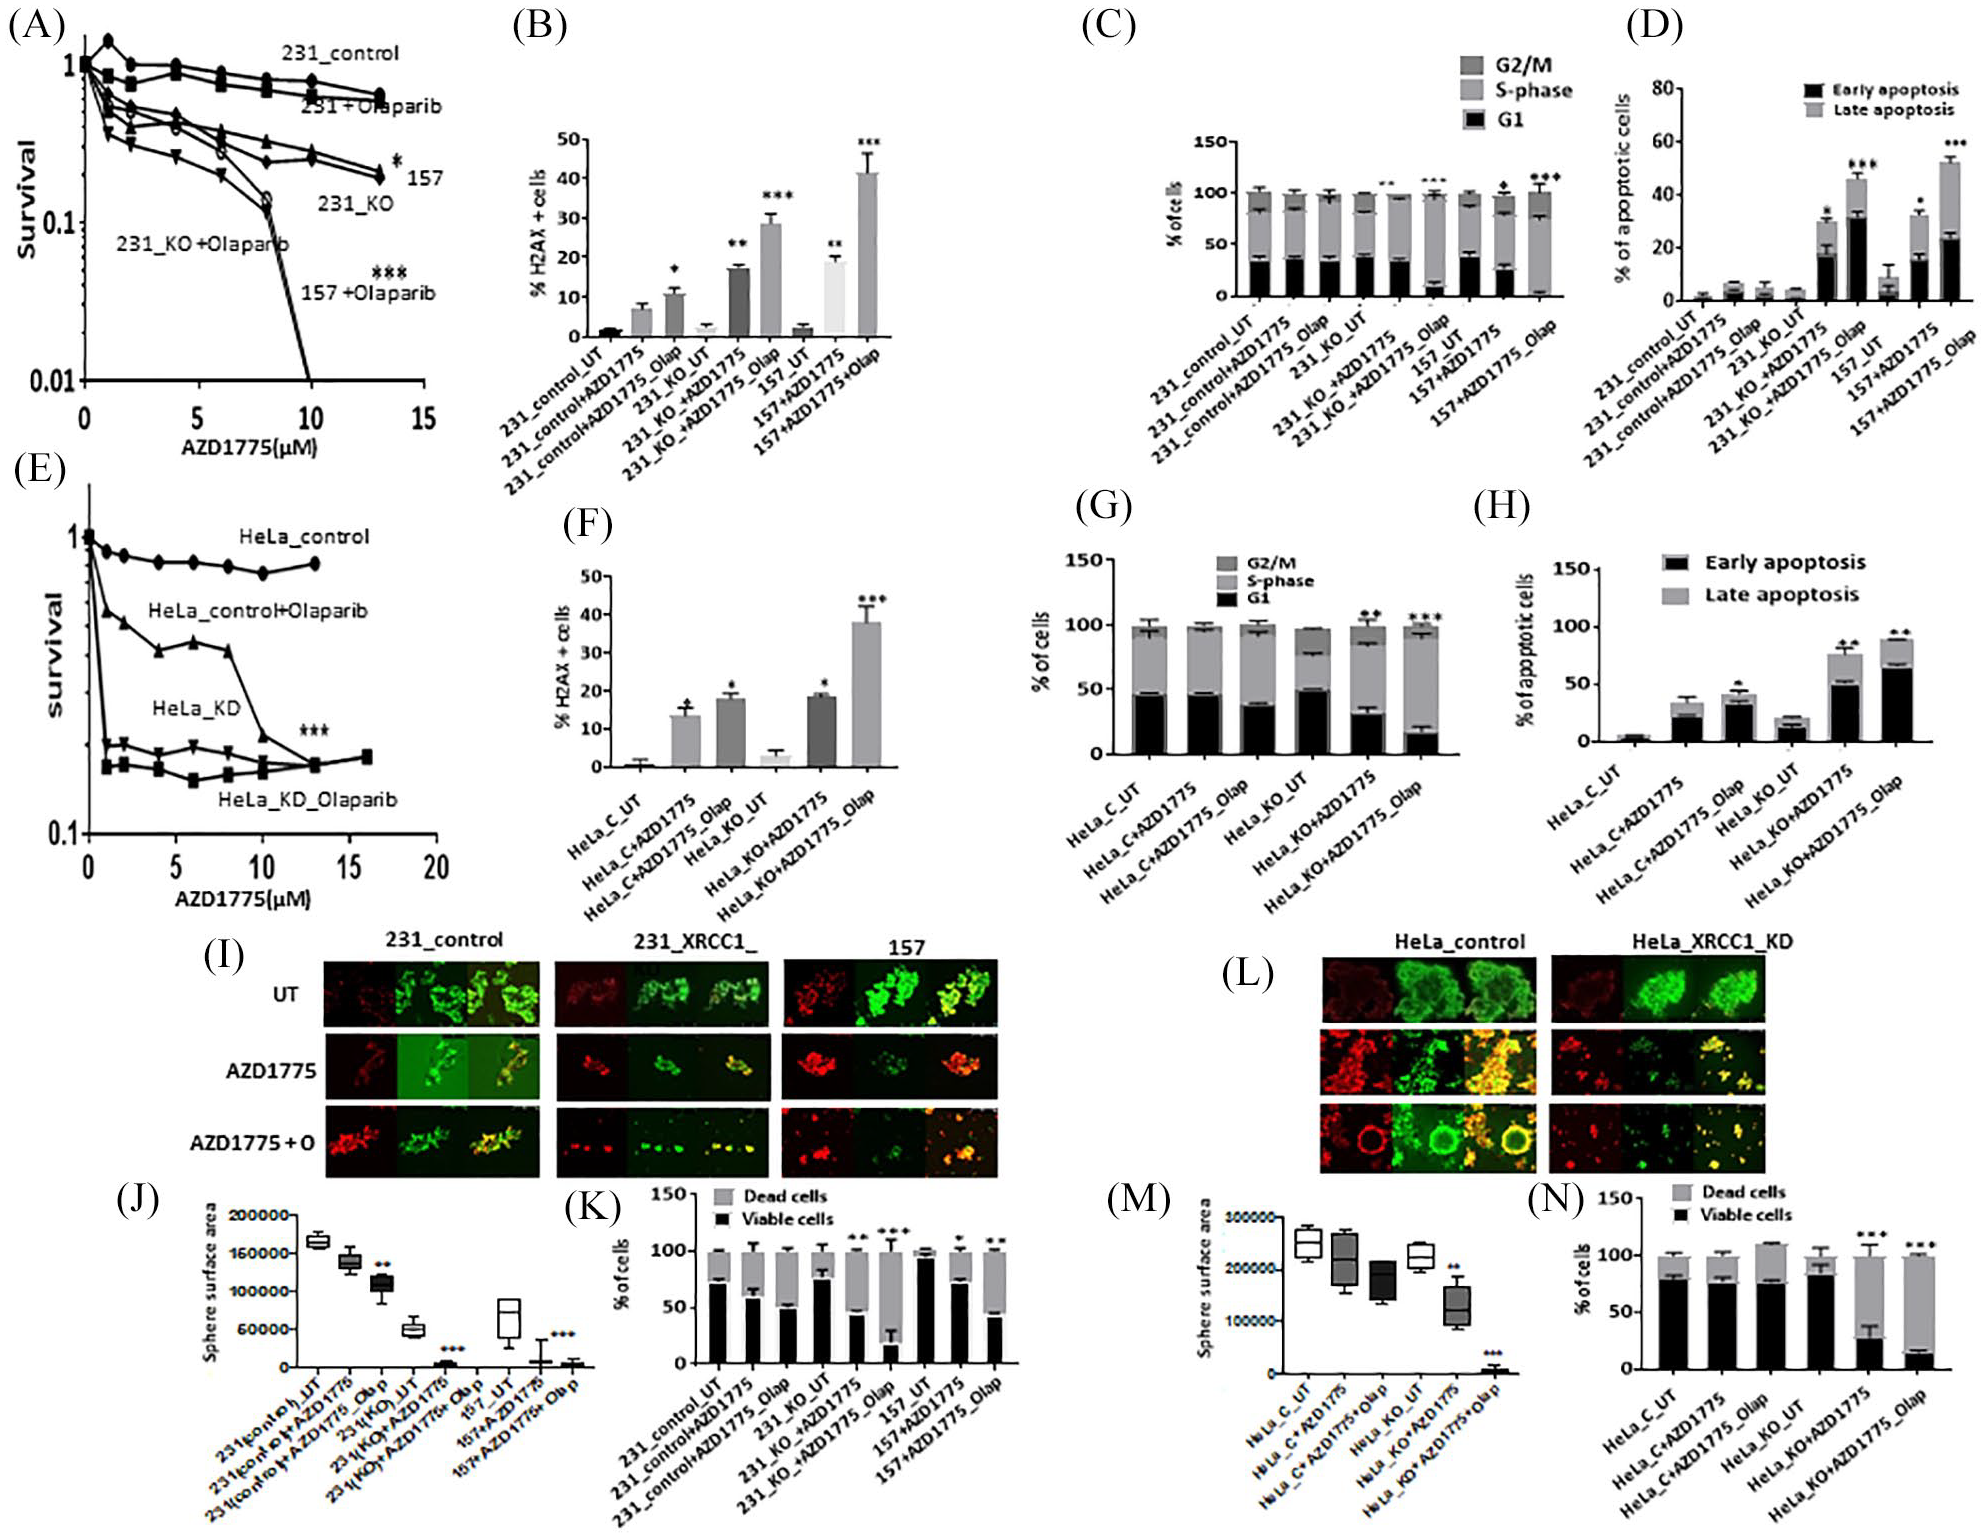
(A) Clonogenic survival assay for AZD1775 in 231control and XRCC1_KO cells untreated or pre-treated with olaparib (5 μM). (B) Quantification of γH2AX levels by flow cytometry in 231control, 231 (XRCC1_KO) and 157 cells treated with AZD1775 (10 μM) or treated with AZD1775 (10 μM) plus olaparib (5 μM) for 24 h. (C) Quantification of cell cycle progression by flow cytometry in 231control, 231 (XRCC1_KO) and 157 cells treated with AZD1775 (10 μM) or treated with AZD1775 (10 μM) plus olaparib (5 μM) for 24 h. (D) Quantification of apoptotic cells by annexin V flow cytometry in 231control, 231 (XRCC1_KO) and 157 treated with AZD1775 (10 μM) or treated with AZD1775 (10 μM) plus olaparib (5 μM) for 24 h. Cells were plated overnight then treated with 5 μM of olaparib or left untreated for 24 h. The next day, untreated and olaparib pre-treated cells were treated with 10 μM of AZD1775 for another 24 h. After incubation cells were collected by trypsinization and stained for flow cytometry analysis as described in the Methods section. (E) Clonogenic survival assay for HeLa control and HeLa (XRCC1_KD) cells untreated or olaparib pre-treated (5 μM) in different doses of AZD1775. (F) Quantification of γH2AX levels by flow cytometry in HeLa control and (XRCC1_KO) cells treated with AZD1775 (10 μM) or treated with AZD1775 (10 μM) plus olaparib (5 μM) for 24 h. (G) Quantification of cell cycle progression by flow cytometry in HeLa control and (XRCC1_KO) cells treated with AZD1775 (10 μM) or treated with AZD1775 (10 μM) plus olaparib (5 μM) for 24 h. (H) Quantification of apoptotic cells by annexin V flow cytometry in HeLa control and (XRCC1_KO) cells treated with AZD1775 (10 μM) or treated with AZD1775 (10 μM) plus olaparib (5 μM) for 24 h. Cells were plated overnight then treated with 5 μM of olaparib or left un-treated for 24 h. The next day, untreated and olaparib pre-treated cells were treated with 10 μM of AZD1775 for another 24 h. After incubation cells were collected by trypsinization and stained for flow cytometry analysis as described in the Methods section. (I) Representative photo micrographic images of 231 control, 231 (XRCC1_KO), 157 cells, HeLa control and HeLa_XRCC1_KD 3D-spheroids treated with AZD1775 (10 μM) or treated with AZD1775 (10 μM) plus olaparib (5 μM). (J) Quantification of spheroid size in 231control, 231 (XRCC1_KO) and 157 treated with AZD1775 (10 μM) or treated with AZD1775 (10 μM) plus olaparib (5 μM). (K) Quantification of viable, dead cells by flow cytometry in 231control, 231 (XRCC1_KO) and 157 treated with AZD1775 (10 μM) or treated with AZD1775 (10 μM) plus olaparib (5 μM). (L) Representative photo micrographic images of HeLa control and (XRCC1_KO) cells treated with AZD1775 (10 μM) or treated with AZD1775 (10 μM) plus olaparib (5 μM). (M) Quantification of spheroid size in HeLa control and HeLa (XRCC1_KO) treated with AZD1775 (10 μM) or treated with AZD1775 (10 μM) plus olaparib (5 μM). (N) Quantification of viable, dead cells by flow cytometry in HeLa control and HeLa (XRCC1_KO) treated with AZD1775 (10 μM) or treated with AZD1775 (10 μM) plus olaparib (5 μM).
In HeLa cells, similarly, AZD1775 either alone or in combination with olaparib was selectively toxic in XRCC1 deficient cells [Figure 4(E)] and associated with DSB accumulation [Figure 4(F)], cell cycle arrest [Figure 4(G); Supplemental Table S1) and increased apoptosis [Figure 4(H)]. In 3D-spheroid models, AZD1775 monotherapy or AZD1775/olaparib combination therapy significantly reduced spheroid size [Figure 4(I) and (J)] and viability [Figure 4(K)]. Similarly, in HeLa_XRCC1_KD cells, AZD1775 monotherapy or in combination with olaparib significantly reduced spheroid size [Figure 4(L) and (M)] and viability [Figure 4(N)].
Clinicopathological significance of XRCC1 and ATR, ATM or Wee1 protein co-expression in sporadic breast cancers
The pre-clinical data presented so far suggests that ATM, ATR or Wee1 blockade either alone or in combination with PARP inhibitor is selectively toxic in XRCC1 deficient cancer cells compared with XRCC1 proficient cancer cells. We immunohistochemically profiled XRCC1, ATR, ATM and Wee1 protein expression in a clinical cohort of 1650 sporadic breast tumours [Figure 5(A)] and evaluated their clinical significance. Patient demographics are summarized in Supplemental Table S3. We have previously shown that ATR overexpression, 11 ATM deficiency 10 and XRCC1 deficiency 8 are linked with aggressive breast cancers. Here we show that Wee1 overexpression is associated with aggressive phenotypes including larger tumours, higher grade, high mitotic index, pleomorphism, high risk NPI, her-2 overexpression, ER- and PR-phenotype (Supplemental Table S5) and poor breast cancer specific survival (BCSS) (Supplemental Figure S2). We then investigated XRCC1/ATR (Supplemental Table S6), XRCC1/ATM (Supplemental Table S7) or XRCC1/Wee1 (Supplemental Table S8) protein co-expression and observed an association with aggressive breast cancer phenotypes. In patients with XRCC1 deficient tumours, ATR, ATM or Wee1 expression was also linked with poor BCSS [Figure 5(B) to (D) respectively]. Taken together, pre-clinical and clinical data provides evidence that targeting ATM, ATR or Wee1 alone or in combination with olaparib could be a viable clinical strategy in XRCC1 deficient breast cancers.

(A) Representative photo micrographic images showing immunohistochemical staining of XRCC1, ATR, ATM and Wee1 in breast cancer tissue. (B) Kaplan–Meier curves for ATR and XRCC1 protein co-expression showing BCSS. (C) Kaplan–Meier curves for ATM and XRCC1 protein co-expression showing breast cancer specific survival (BCSS). (D) Kaplan–Meier curves for WEE1 and XRCC1 protein expression showing BCSS.
Clinical correlation between XRCC1 and BRCA1 protein expression in sporadic breast cancers
Previous studies indicate that BRCA1 is involved in the transcriptional regulation of key BER proteins, including XRCC1.25–27 We therefore investigated the clinical significance of XRCC1 based on BRCA1 protein expression status. In the evaluable cohort, 572 tumours were proficient for BRCA1 protein expression and 457 tumours were negative for BRCA1 expression by immunohistochemistry. In BRCA1 proficient tumours, 63/572 (11%) were deficient in XRCC1 protein expression. In BRCA1 deficient tumours, 105/457 (23%) were deficient in XRCC1 protein expression (Supplemental Table S9). As shown in Figure 6, low XRCC1 levels adversely impacted BCSS in both BRCA1 proficient (p < 0.0001) and BRCA1 deficient (p < 0.0001) breast tumours. The data provides evidence that XRCC1 deficiency has prognostic significance in both BRCA1 deficient and proficient breast cancers.

(A) Kaplan–Meier curves in BRCA1 proficient sporadic breast cancer based on XRCC1 expression status. (B) Kaplan–Meier curves in BRCA1 deficient sporadic breast cancer based on XRCC1 expression status.
Discussion
XRCC1 is a key player in BER, SSBR and alt-NHEJ. XRCC1 interacts with PARP1 and promotes coordination of SSBR. 7 ATM and ATR are critical DNA damage sensing proteins with essential roles in DNA repair and cell cycle checkpoint signalling during replicative or genotoxic stress. 9 Wee1 has important functions in cell cycle regulation, mitotic entry, DNA replication and DNA repair. 12 Pharmacological inhibitors of ATR, ATM and Wee1 are currently under clinical development. 28 There are two approaches to incorporate DNA repair inhibitors in cancer therapeutics: radiotherapy/chemotherapy sensitizers or synthetic lethality inducers. ATRi, ATMi or Wee1i therapy can potentiate cytotoxicity of chemotherapy and radiotherapy.16,18,29–33 Synthetic lethality studies evaluating ATRi, ATMi or Wee1i monotherapy in cancer have been reported. A study by Williamson et al. showed a synthetic lethality relationship between ATRi and AR1D1A deficiency. 34 ATM or p53 deficient chronic lymphocytic leukemia 35 or ATM deficient cancer cells are sensitive to ATR inhibitor (VE-821). 36 Previously, we have shown that ATR inhibitors (NU6027 or VE-821) are synthetically lethal in XRCC1 deficient ovarian cancer cells. 37 In another study AZD1775 monotherapy was shown to be synthetically lethal in p53 mutant cancer cells. 38 Although promising as monotherapy, the development of combinatorial approaches is also highly desirable.
We have previously shown that XRCC1 deficiency is linked to aggressive breast tumours. 8 BRCA1 is known to be involved in the transcriptional regulation of key BER proteins including XRCC1.25–27 As expected, in the current study, 23% of BRCA1 deficient tumours also had low XRCC1 expression. In BRCA1 proficient tumours we observed XRCC1 deficiency in 11% of tumours, indicating additional mechanisms operating in tumours to down regulate XRCC1. Recent evidence suggests that SP1 39 and E2F1 40 transcription factors can regulate XRCC1 expression. Interestingly, both ATM and ATR are involved in the phosphorylation and regulation of E2F1.41,42 Similarly, ATM has been shown to have a role in the phosphorylation and regulation of SP1. 39 Together, the emerging data suggests a role for BRCA1, SP1 and E2F1 mediated transcriptional dysregulation in the development of XRCC1 deficient aggressive breast cancer. However, detailed mechanistic studies will be required to confirm this hypothesis.
In the current study we provide the first translational evidence that potent inhibitors of ATM, ATR or Wee1 either alone or in combination with PARP inhibitor (PARPi) are selectively toxic in XRCC1 deficient breast cancers. We propose a model for such a synthetic lethality relationship as follows: XRCC1 deficient cells have elevated SSBs that are eventually converted to toxic DSBs. In cells deficient in DSB repair (such as by pharmacological inhibition of ATM, ATR or Wee1), DSBs would persist and lead to synthetic lethality. In cells that are proficient in XRCC1, there is no DSB accumulation and hence cells would survive. Interestingly, the extent of synthetic lethality observed for ATRi, ATMi or Wee1i monotherapy was also comparable to olaparib monotherapy. We have recently shown that PARP inhibitor monotherapy is synthetically lethal in XRCC1 deficient cells. 43 We therefore hypothesized that olaparib in combination with ATRi, ATMi or Wee1i will substantially increase selective toxicity for the following reasons: PARP1 binds to DNA repair intermediates such as single strand breaks and gets activated, which in turn leads to the synthesis of poly-ADP ribose (PAR) polymers. PARP1 auto-PARylation recruits other BER factors (including XRCC1) at sites of DNA damage, resulting in efficient DNA repair. Inhibition of PARP1 catalytic activity (by inhibitor) prevents auto-PARylation, impairs BER recruitment and stabilizes binding of PARP1 to DNA intermediate. DNA-bound immobilized PARP-1 disrupts replication fork progression, leading to DSB accumulation and DSB-mediated apoptosis. In XRCC1 deficient cells with increased SSB accumulation, PARP inhibition mediated accumulation of DSB is more pronounced compared with XRCC1 proficient cells, leading to synthetic lethality. In addition, PARPi mediated DSB accumulation will also activate ATM and/or ATR and/or Wee1 mediated DNA repair and cell cycle regulation. Therefore, pharmacological inhibition of ATR or ATM or Wee1 will lead to DSB accumulation, cell cycle arrest and apoptosis and induce synthetic lethality in XRCC1 deficient cells. A combination of PARPi with ATRi or ATMi or Wee1i will further substantially increase DSBs, leading on to cell death. The data presented here supports the hypothesis that olaparib in combination with AZD6738 or AZ31 or AZD1775 will enhance synthetic lethality in XRCC1 deficient breast cancer cells. Although we have observed XRCC1 deficiency in 16% of TNBCs, 8 the clinical application of DNA repair directed combination therapy is likely to be limited to a highly selective population of XRCC1 deficient breast cancer. Additional in vivo xenograft studies and prospective clinical evaluation will be required to confirm the potential of XRCC1 stratified personalized breast cancer therapy. Alternatively, data presented here could suggest that XRCC1 overexpression could be a marker of resistance to DNA repair targeted mono or combination therapy. A further limitation to the current study is that we did not directly monitor DNA damage response (DDR) functional status in XRCC1 deficient cells using assays such as genomic scar assays. 44 However, as a potential marker of DDR status, we evaluated basal levels of % γH2AX positive cells in control and XRCC1 deficient cells. Compared with proficient cells, basal level of % γH2AX positive cells in XRCC1 deficient cells was higher, suggesting that XRCC1 deficient cells may have increased levels of basal DNA damage. Moreover, although increased sensitivity observed in XRCC1 deficient cells following ATRi, ATMi or Wee1i treatment is likely related to DSB accumulation and synthetic lethality, we cannot exclude replication stress as contributing to the observed phenotype. Although the most potent synergistic activity in vitro was evident with the AZD6738 and olaparib combination in the current study, further in vivo studies will be required for translating to future clinical application. The combination of Wee1i and olaparib was previously shown to increase cytotoxicity in gastric cancer, 45 acute leukemia 46 and ovarian cancers, 47 although these studies did not investigate specific DNA repair deficient cancer models. Interestingly, Lallo et al. 23 have provided evidence that HR deficient small cell lung cancers may be more susceptible to Wee1i and olaparib combination therapy. 23 A combination of AZD6738 (ATRi) and AZD1775 (Wee1i) caused growth inhibition in a TNBC study. 48 Taken together, the data, including ours, provides evidence that DNA repair targeted combinatorial approaches may be more effective in certain DNA repair defective cancers. Ongoing early phase clinical trials of AZD6738 or AZD1775 monotherapy or in combination with olaparib including in HR deficient cancers (https://clinicaltrials.gov/ct2/results?term=AZD6738&Search=Search, https://clinicaltrials.gov/ct2/results?cond=&term=azd1775&cntry=&state=&city=&dist=) will, hopefully, provide further insights.
Supplemental Material
sj-pdf-1-tam-10.1177_1758835920974201 – Supplemental material for XRCC1 deficient triple negative breast cancers are sensitive to ATR, ATM and Wee1 inhibitor either alone or in combination with olaparib
Supplemental material, sj-pdf-1-tam-10.1177_1758835920974201 for XRCC1 deficient triple negative breast cancers are sensitive to ATR, ATM and Wee1 inhibitor either alone or in combination with olaparib by Reem Ali, Adel Alblihy, Michael S. Toss, Mashael Algethami, Rabab Al Sunni, Andrew R. Green, Emad A. Rakha and Srinivasan Madhusudan in Therapeutic Advances in Medical Oncology
Footnotes
Acknowledgements
We thank the Nottingham Health Science Biobank and Breast Cancer Now Tissue Bank for the provision of tissue samples.
Author contributions
Conception and design: Reem Ali, Mashael Algethami, Rabab Al Sunni, Andrew R Green, Emad A Rakha and Srinivasan Madhusudan. Cohort Identification, Collection and assembly of data: Reem Ali, Adel Alblihy, Mashael Algethami, Rabab Al Sunni, Michael S Toss, Andrew R Green. Staining and image analysis: Michael S Toss, Andrew R Green. Data analysis and interpretation: Reem Ali, Adel Alblihy, Mashael Algethami, Rabab Al Sunni, Michael S Toss, Andrew R Green, Emad A Rakha and Srinivasan Madhusudan. Manuscript writing: Reem Ali, Adel Alblihy, Michael S Toss, Mashael Algethami, Rabab Al Sunni, Andrew R Green, Emad A Rakha and Srinivasan Madhusudan. All authors contributed to revise and approve the final version of the manuscript
Conflict of interest statement
The authors declare that there is no conflict of interest.
Funding
This research received no specific grant from any funding agency in the public, commercial, or not-for-profit sectors.
Availability of data and materials
The authors confirm the data that has been used in this work is available on reasonable request.
Ethical approval and consent to participate
This work obtained ethics approval by the North West–Greater Manchester Central Research Ethics Committee under the title: Nottingham Health Science Biobank (NHSB), reference number 15/NW/0685. All samples from Nottingham used in this study were pseudo-anonymized and collected prior to 2006 and stored in compliance with the UK Human Tissue Act. All patients provided informed consent for use of tissue/samples.
Supplemental material
Supplemental material for this article is available online.
References
Supplementary Material
Please find the following supplemental material available below.
For Open Access articles published under a Creative Commons License, all supplemental material carries the same license as the article it is associated with.
For non-Open Access articles published, all supplemental material carries a non-exclusive license, and permission requests for re-use of supplemental material or any part of supplemental material shall be sent directly to the copyright owner as specified in the copyright notice associated with the article.