
Abstract
Background:
The aim of this study was to assess trophoblast antigen protein 2 (TROP2) expression in liver oligometastases and its prognostic value for colorectal liver oligometastasis (CLO) patients undergoing liver resection.
Methods:
We retrospectively selected 129 consecutive CLO patients who underwent curative liver resection between June 1999 and December 2016. Immunohistochemistry (IHC) was performed to detect TROP2 expression in paraffin-embedded specimens. Recurrence-free survival (RFS) and overall survival (OS) were analyzed using the Kaplan–Meier method and log-rank test, and independent prognostic factors were identified with Cox regression modeling.
Results:
TROP2 was expressed in 72.9% (94/129) of liver oligometastatic tissues. TROP2 expression in primary tumors and liver oligometastases was significantly positively correlated (r = 0.758, p < 0.001). Survival analysis indicated that CLO patients with high TROP2 expression had worse 3-year RFS (44.2% versus 66.4%, p = 0.007) and 3-year OS rates (70.3% versus 85.4%, p = 0.035) than did those with low TROP2 expression. Multivariate analysis indicated that high TROP2 expression was independently associated with poor RFS [hazard ratio (HR) = 2.017; 95% confidence interval (CI) 1.198–3.396; p = 0.023] and OS (HR = 2.090; 95% CI 1.037–4.214; p = 0.039). Gene expression profile analysis indicated that high TROP2 expression was associated with TNFα signaling via NF-κB, the inflammatory response and epithelial–mesenchymal transition (EMT).
Conclusions:
TROP2 overexpression was associated with an unfavorable oncologic prognosis in patients with CLO undergoing liver resection. Detecting TROP2 expression may be valuable for guiding postoperative treatment among CLO patients.
Introduction
Currently, colorectal cancer (CRC) is one of the most common human malignant diseases in China and worldwide.1,2 The development of distant metastasis is a leading cause of treatment failure and disease-related deaths. The liver is the most common site of metastasis in CRC patients, and approximately 50% of patients ultimately develop liver metastases during the course of disease progression.3,4 Liver curative resection offers a phase of no evidence of disease (NED) and a chance for long-term survival for 50% of patients.5,6 Unfortunately, more than 60% of patients develop recurrent disease during the subsequent follow-up after the initial liver resection.7,8
Under these circumstances, colorectal liver metastases (CRLMs) should be considered different tumor entities according to the severity of the metastatic disease and tumor biological aggressiveness. Recently, oligometastatic disease was highlighted by the latest version of the European Society for Medical Oncology (ESMO) guidelines for the management of metastatic CRC. 9 According to a previous definition, colorectal liver oligometastases (CLOs) are defined as no more than five liver metastases that are confined to the liver, representing a disease state that exists in a transitional zone between localized and widespread metastatic diseases and indicates the genuine potential for curable resection.10,11 In our previous study, CLO showed a 5-year overall survival (OS) rate of 45.9% after liver resection; however, the total recurrence rate was 57.3%, and the early recurrence rate was 16.0%. 12 In addition, adjuvant chemotherapy did not offer a prognostic benefit among all CLO patients but only among high-risk patients after curative liver resection. 13 Therefore, the management of CLO is challenging, and exploring novel biomarkers to screen various prognostic risk subgroups is urgently needed to guide the individualized treatment of CLO. To the best of the authors’ knowledge, no specific biomarker has been investigated for CLO.
Trophoblast antigen protein 2 (TROP2), also known as tumor-associated calcium signal transducer 2 (TACSTD2), is a 35.7 kDa transmembrane glycoprotein encoded by the TACSTD2 gene. TROP2 is a confirmed cell surface receptor and is highly expressed in a wide variety of epithelial cancers, including oral, lung, pancreatic, and gastric carcinoma.14,15 The functional role of TROP2 in cancer has been fully elucidated, and TROP2 is involved in regulating the growth of carcinoma cells and activating the signaling pathways involved in tumor invasiveness and metastasis.16,17 Moreover, notably, TROP2 protein is expressed at high levels in colon cancer tissues, and high TROP2 protein expression is associated with the development and pathological progression of colon cancer.18,19 Furthermore, TROP2 expression is necessary for the tumorigenesis and invasiveness of colon cancer cells and represents a therapeutic target for CRC. 20 Although the expression and biological function of TROP2 in primary colon tumors has been fully investigated, the expression of TROP2 in liver metastatic tumors and its related clinical implications remain unclear. In addition, TROP2 functions via different signaling pathways and involves the regulation of a complex network of multiple transcription factors. 15 However, the associations between gene expression profiles and TROP2 expression have not been well defined in CRC.
Therefore, the current study aimed to investigate the expression of TROP2 in liver oligometastases and to determine whether TROP2 expression has prognostic value for CLO patients undergoing curative liver resection. In addition, we described the gene expression profiles that were associated with TROP2 expression and accounted for the prognosis and outcome.
Materials and methods
Patients and treatments
We selected 129 consecutive CLO patients who underwent primary tumor and liver resection from June 1999 to December 2016 at Sun Yat-sen University Cancer Center. All included patients met the following inclusion criteria: (1) histologically confirmed colorectal adenocarcinoma, (2) colorectal single liver metastasis, (3) no preoperative extrahepatic metastases, (4) radical resection for both the colorectal primary tumor and liver metastasis, and (5) a postoperative follow-up period of at least 3 months. Demographic and clinicopathological characteristics were retrieved from the electronic medical records system, and follow-up data were collected from the follow-up system. The treatment strategy and operability of the liver metastases of each patient were determined based on the final agreement of the multidisciplinary team (MDT). Adjuvant chemotherapy was also determined by the MDT according to the Eastern Cooperative Oncology Group (ECOG) score, age and desire of the patients. If the patients presented poor ECOG performance status (3–4 score), age more than 75 years old, and refusal to undergo chemotherapy, adjuvant chemotherapy was not administered. Informed consent for the use of the tissue samples was obtained from the patients before tumor resection. The study was approved by the Institutional Research Ethics Committee of Sun Yat-sen University Cancer Center (approval number: GZR2019-180).
Immunohistochemical staining
The primary and liver metastatic tumor specimens of all included patients were formalin-fixed, paraffin-embedded and prepared for immunohistochemistry (IHC) analysis according to standard procedures. The paraffin-embedded samples were sectioned continuously into 4 μm thick sections, which were dewaxed in xylene, rehydrated, and rinsed in graded ethanol solutions. The antigens were retrieved by heating the tissue sections at 100°C for 5 min in an ethylenediaminetetraacetic acid (EDTA) solution (1 mmol/l, pH 8.0). The sections were then immersed in a 0.3% hydrogen peroxide solution for 10 min and rinsed with phosphate buffered saline (PBS) for 5 min. All sections were incubated with a primary TROP2 antibody (1:500 dilution, ab214488; Abcam, Cambridge, UK) at 4°C overnight. After washing with 1 × PBS, the sections were treated with an antirabbit secondary antibody (Zhongshan Golden Bridge Biotechnology, Beijing, China) at 37.5°C for 30 min. Finally, the staining was developed with 3,3’-diaminobenzidine tetrahydrochloride (DAB, Dako, Glostrup, Denmark).
IHC score
The IHC score for TROP2 expression was determined by a semiquantitative method, according to the percentage and intensity of the positively stained cells as described previously.21,22 The percentage of positively stained cells was scored as follows: (0) less than 5%, (1) 5–24%, (2) 25–49%, (3) 50–74%, and (4) 75–100%. The intensity was scored according to the following criteria: (0) negative staining, (1) weak staining, (2) moderate staining, and (3) strong staining. The final IHC score was generated by multiplying the percentage score by the staining intensity score. Two independent pathologists blindly evaluated the IHC score for TROP2 expression in all specimens. The final IHC score of each specimen was determined by agreement of the two pathologists. The cut-off value for the IHC score for the primary tumor and liver metastasis was defined as the median value of the IHC scores. High TROP2 expression was defined as an IHC score that exceeded the cut-off value.
Gene expression profiling with microarray analysis
Microarray experiments were performed by using an Affymetrix GeneChip Human Transcriptome Array 2.0 (HTA 2.0). RNA was isolated from 30 frozen colorectal tumor tissues, and the RNA samples were prepared using a WT PLUS Reagent kit, followed by hybridization to the HTA 2.0 microarray chips. In accordance with the Affymetrix manuals, the raw data from the HTA 2.0 chips were subjected to a quality control examination. The chips that passed the quality control criteria were further analyzed with Partek (Partek, St. Louis), a commercial software program that is used specifically for microarray data analysis. Using Partek, we conducted analysis of variance (ANOVA) and reported the p values of the comparisons of interest.
Gene set enrichment analysis
GSEA 2-2.2.3 (JAVA version) was downloaded from the GSEA website (http://software.broadinstitute.org/gsea/index.jsp). Then, the gene expression profiling dataset was imported using GSEA software. Gene sets that were identified as related to biological signal conduction on the MSigDB (Molecular Signatures Database; http://software.broadinstitute.org/gsea/msigdb), which can be found on the GSEA website, served as the reference gene sets. This process was repeated 1000 times for each analysis with the default weighted enrichment statistical method. Gene sets with a false discovery rate (FDR) <0.25 and a familywise error rate (FWR) <0.05. GSEA included four key statistics: the enrichment score (ES), normalized enrichment score (NES), FDR, and p value.
Follow-up
Patients were monitored through subsequent visits every 3 months for the first 2 years and then biannually for 5 years after the primary tumor resection. Clinical examinations, CEA and carbohydrate antigen 19-9 (CA19-9) detection, and chest radiography were performed every 3 months. Chest/abdominal/pelvic computed tomography (CT) and colonoscopy were conducted every year. Recurrence-free survival (RFS) was defined as the interval from the date of liver tumor resection to the date of disease recurrence, death, or the last follow-up. OS was defined as the interval from the date of liver tumor resection to the date of death from any cause or to the last follow-up. Random censoring was applied to patients without recurrence or death at the last follow-up date. The final follow-up visit occurred in January 2018.
Statistical analysis
Statistical analyses were performed using SPSS 20.0 software (IBM, Chicago, IL, USA), GraphPad Prism 7 software (GraphPad Software, Inc, San Diego, CA, USA), and R software packages. Categorical variables are presented as percentages, and categorical variables were compared using the chi-squared (χ2) test, Fisher’s exact test, or nonparametric Spearman’s correlation test. Continuous variables are presented as the median (range). The Kaplan–Meier method was used to estimate the survival rates for the different groups, and the differences in survival were compared with the log-rank test. A multivariate Cox proportional hazards analysis was performed using variables whose p value was less than 0.05 in the univariate analysis. Hazard ratios (HRs) and 95% confidence intervals (CIs) were subsequently calculated. A heat map of the gene expression profiling was generated with an R software package. p < 0.05 was considered statistically significant.
Results
Patient characteristics
Table 1 shows the clinical and pathological characteristics of the patients. The median age of all patients was 58 years old (range, 25–78), and 60.5% of the patients were male. A total of 31 patients underwent preoperative chemotherapy, and 87 patients received postoperative chemotherapy. Among those patients, 71 patients underwent synchronous resection for both the primary tumor and metastases. In addition, five patients underwent radiofrequency ablation (RFA) within 3 months before or after liver resection.
Clinical characteristics of 129 patients with colorectal liver oligometastases.
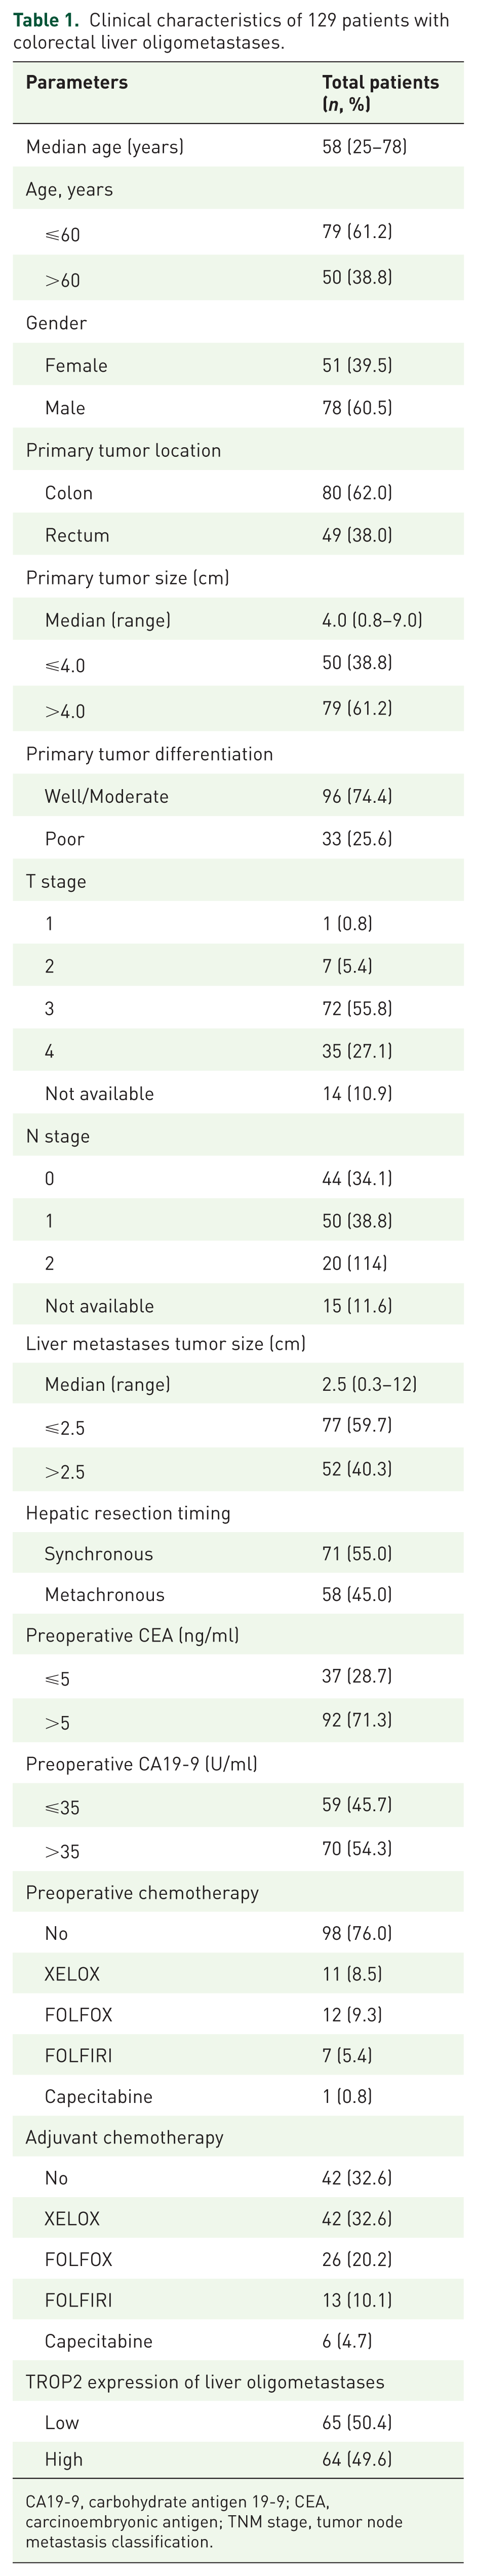
CA19-9, carbohydrate antigen 19-9; CEA, carcinoembryonic antigen; TNM stage, tumor node metastasis classification.
TROP2 expression in liver oligometastases
TROP2 expression was detected in 70 primary tumor tissues and 129 liver metastases. TROP2 was expressed on the membrane of tumor cells both in the primary tumor and liver oligometastases (Figure 1). Positive TROP2 expression was observed in 72.9% (94/129) of liver oligometastatic tissues and in 38% (49/70) of primary tumor tissues. There was no significant difference in TROP2 expression levels between the primary tumors and metastases (p = 0.112; Figure 2A), whereas a significant positive correlation of TROP2 expression was noted between primary tumors and liver metastases (r = 0.758, p < 0.001; Figure 2B).

Evaluation of trophoblast antigen protein 2 (TROP2) expression in primary tumor and liver metastases by immunohistochemistry (IHC). (A) Strong TROP2 expression in a primary tumor; (B) Moderate TROP2 expression in a primary tumor; (C) No TROP2 expression in a primary tumor; (D) Strong TROP2 expression in liver metastases; (E) Moderate TROP2 expression in liver metastases; and (F) No TROP2 expression in liver metastases. The original magnifications were 200× and 400× with a 100-μm scale.
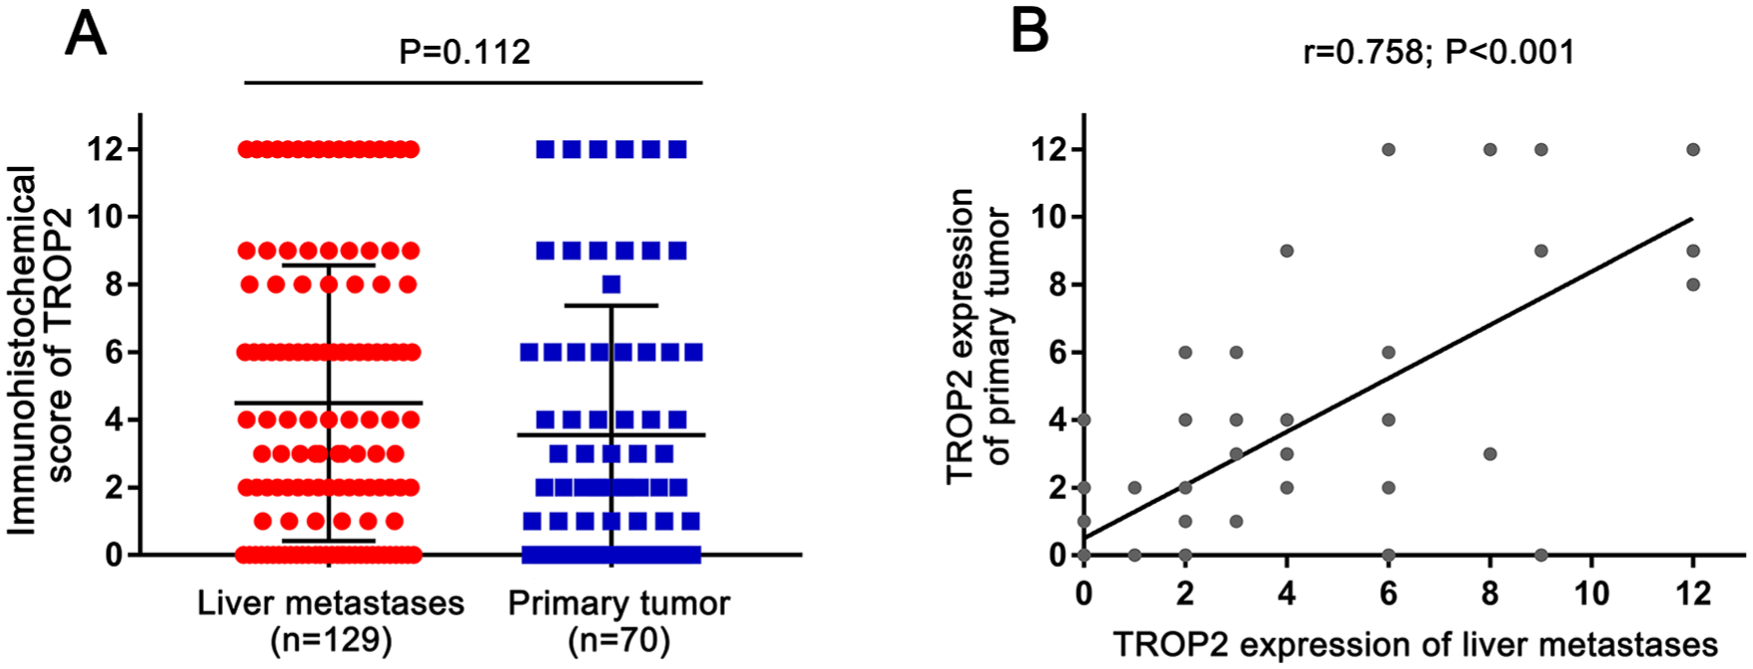
Analysis of trophoblast antigen protein 2 (TROP2) expression with immunohistochemistry (IHC) scores between the primary tumor and liver metastases: (A) comparison of TROP2 expression between primary tumors and liver metastases; (B) correlation of TROP2 expression levels between primary tumors and liver metastases.
Association of TROP2 expression and clinicopathologic characteristics
The median IHC score in liver oligometastases was 3. Accordingly, 65 patients were placed into the low-TROP2 expression group, whereas 64 patients were placed into the high-TROP2 expression group. The association between TROP2 expression of liver oligometastases and clinicopathological characteristics is listed in Table 2. Compared with low TROP2 expression, high TROP2 expression was associated with a worse histological grade (35.9% versus 15.4%, p = 0.007) and higher preoperative CA19-9 (67.2% versus 41.5%, p = 0.003). No significant association was found between TROP2 expression levels and other clinicopathological characteristics.
Association of the trophoblast antigen protein 2 (TROP2) expression of the liver oligometastases and the clinicopathological parameters of all patients.

CA19-9, carbohydrate antigen 19-9; CEA, carcinoembryonic antigen; TNM stage, tumor-node-metastasis classification.
Association between TROP2 expression and survival
With a median follow-up time of 35 months (range, 2–143 months) after liver resection, 34 (26.4%) patients experienced cancer-related mortality, and 49 (40.0%) patients experienced disease recurrence. Among the 49 patients with disease recurrence, 79.6% (39/49) had intrahepatic recurrence, 22.4% (11/49) had lung metastasis, and 16.3% (8/49) had abdominal/pelvic metastasis.
Kaplan–Meier analysis indicated that the 3-year RFS rate in the high-TROP2 expression group was significantly lower than that in the low-TROP2 expression group (44.2% versus 66.4%, p = 0.007; Figure 3A). Similarly, the 3-year OS rate in the high-TROP2 expression group was also significantly lower than that in the low-TROP2 expression group (70.3% versus 85.4%, p = 0.035; Figure 3B). Regarding the cumulative incidence of postoperative recurrence, the 3-year cumulative intrahepatic recurrence rates were 25.4% and 19.9% for the high- and low-TROP2 expression groups, respectively (HR = 1.397, 95% CI 0.678–2.879, p = 0.362, Figure 3C). The 3-year cumulative extrahepatic metastases rates were 26.0% and 10.4% for the high- and low-TROP2 expression groups, respectively (HR = 2.909, 95% CI 1.024–8.260, p = 0.036, Figure 3D).
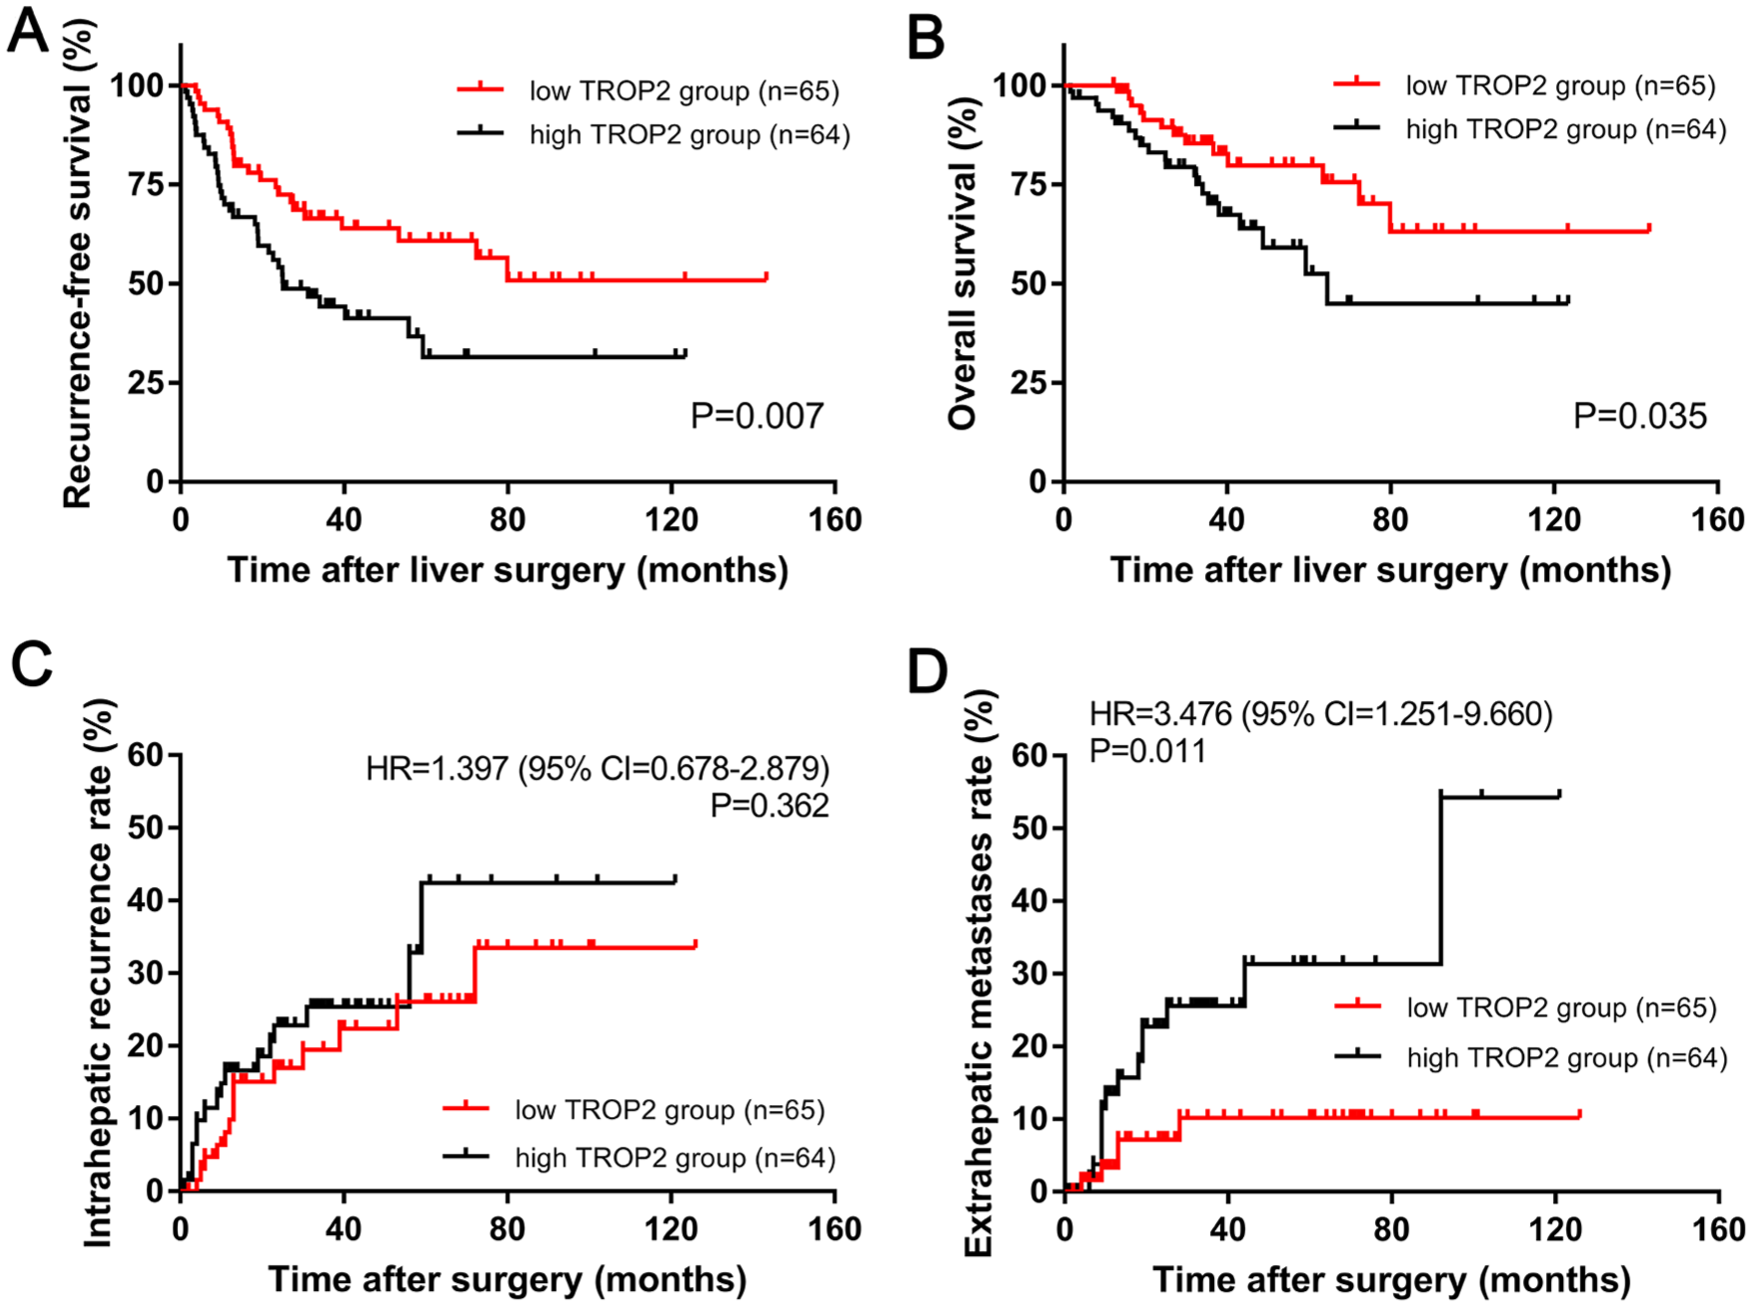
Kaplan–Meier long-term survival curves grouped by high and low trophoblast antigen protein 2 (TROP2) expression in colorectal liver oligometastasis (CLO) patients. (A) Overall survival (OS) rate and (B) recurrence-free survival (RFS) rate comparison analysis of patients with high and low TROP2 expression in liver metastases. (C) Cumulative incidence of intrahepatic recurrence and (D) extrahepatic metastasis in the high- and low-TROP2 expression groups.
Univariate and multivariate analyses of the prognostic factors
The univariate and multivariate analyses are summarized in Table 3. The univariate analysis revealed that the N1-2 stage (HR 2.205; 95% CI 1.213–4.007; p = 0.009) and high TROP2 expression in liver oligometastases (HR 2.017; 95% CI 1.198–3.396; p = 0.008) were associated with an unfavorable RFS. Multivariate analysis showed that the N1-2 stage (HR 2.235; 95% CI 1.229–4.064; p = 0.008) and high TROP2 expression in liver oligometastases (HR 1.877; 95% CI 1.091–3.230; p = 0.023) were also independent predictive factors for unfavorable RFS. In addition, both univariate and multivariate analyses showed that TROP2 expression in liver oligometastases was significantly associated with OS (HR 2.090; 95% CI 1.037–4.214, p = 0.039).
Univariate and multivariate analyses of the factors influencing OS and RFS with a Cox proportional hazard model.

CA19-9, carbohydrate antigen 19-9 before liver tumor resection; CEA, carcinoembryonic antigen before liver tumor resection; CI, confidence interval; HR, hazard ratio; OS, overall survival; RFS, recurrence-free survival; TROP2, trophoblast antigen protein 2.
Associations between the gene expression profiles and TROP2 expression
The clinical characteristics of the patients who were selected for gene expression profiling with microarray analysis are presented in Supplementary Table 1. Gene expression profiling identified 97 upregulated and 124 downregulated genes that were significantly associated with TROP2 expression (p < 0.05, fold change = 1.5, Figure 4A). The significantly upregulated and downregulated genes are presented in Figure 4B. These genes are presented in the aberrant expression heat map (Figure 4C). GSEA indicated that the genes that were positively associated with TROP2 expression were mainly involved in ‘TNFα via NF-κB’, ‘epithelial–mesenchymal transition’ (EMT), and ‘inflammatory response’, whereas the genes that were negatively associated with TROP2 expression were mainly involved in the ‘mTORC1 signaling’ and ‘G2-M DNA damage checkpoint’ pathways (Figure 4D).

Genome-wide gene expression profile and signaling pathways associated with trophoblast antigen protein 2 (TROP2) expression. (A) Volcano plot of the upregulated and downregulated genes associated with differential TROP2 expression. Significantly regulated genes associated with high TROP2 expression and low TROP2 expression are marked by red and blue circles, respectively. (B) Volcano plot of some of the significantly upregulated and downregulated genes. (C) Expression heatmap of TROP2 expression. (D) Gene set enrichment analysis (GSEA) of the cell signaling pathways related to TROP2 expression.
Discussion
Our results demonstrate that disease recurrence after liver resection is common and negatively affects the survival of CLO patients.10,12,13 To obtain further knowledge regarding disease progression and to explore novel prognostic biomarkers for CLO, our current study selected a tumor-associated biomarker, TROP2, and evaluated its expression in tumor tissue and its prognostic value for CLO patients undergoing curative liver resection. Although prognostic significance of TROP2 in CRC has been already investigated, we acknowledged that our current study indeed added two novel innovation points to the current knowledge of CRC. Unlike the previous studies only focusing on the expression of TROP2 in colorectal primary tumor,18,19,23 our data first revealed that TROP2 was commonly expressed in liver oligometastatic tissue, which was positively correlated with the expression in the primary tumor tissue (r = 0.758, p < 0.001). Another innovative point is that we have found a specific prognostic biomarker for CLO. Our results showed that TROP2 expression was an independent prognostic factor for 3-year RFS and OS.
According to previous studies, TROP2 overexpression can contribute to increased postoperative metastatic risk and, thus, reduce long-term survival in CRC patients. Ohmachi et al. firstly investigated the expression status of TROP2 in 74 CRC samples by quantitative real-time reverse transcription polymerase chain reaction (PCR) and subsequently found that patients with high TROP2 expression presented a higher frequency of liver metastasis (p = 0.005), more cancer-related deaths (p = 0.046), and a worse prognosis (HR 2.38; 95% CI 1.29–4.74; p < 0.01) than did those with lower TROP2 expression. 23 Fang et al. also demonstrated that compared with low TROP2 expression, elevated TROP2 expression levels were related to a decreased 5-year OS rate (72.0% versus 62.0%, p = 0.028). In addition, elevated TROP2 expression levels were a predictor of liver metastasis. 19 In the present study, TROP2 overexpression in liver oligometastases was correlated with a high cumulative incidence of extrahepatic metastasis and indicated poor RFS and OS.
The mechanistic link between overexpression of TROP2 and poor prognosis mainly presented in the two respects. First, the TROP2 protein was expressed at high levels in the primary tumor tissues, which was associated with the development and pathological progression of colon cancer. 18 Similarly, in our study, compared with low TROP2 expression in liver metastases, high TROP2 expression in liver metastases was associated with aggressive tumor pathological factors, including a worse histological grade and higher preoperative CA19-9, which might contribute to the increased development of postoperative metastasis and to poor prognosis. Second, we further investigated the potential molecular mechanisms of TROP2 that promote tumor progression by performing gene expression profiling with a microarray. The results indicated that high TROP2 expression might promote TNFα signaling via NF-κB, EMT, and inflammatory response leading to tumor progression and a poor prognosis. TNFα was a central proinflammatory cytokine that contributed to malignant tumor progression via the tumor microenvironment in CRC. The inhibition of TNFα and NF-κB resulted in a significant reduction in metastasis. 24 Guerra et al. investigated the TROP2 signaling network in cancer growth and revealed that TROP2 upregulation subsequently drove the expression and activation of the NF-κB pathway. 25 Zhao et al. demonstrated that TROP2 promoted metastasis by inducing EMT in gastric cancer and breast cancer. Importantly, the mechanism involved the physical binding of TROP2 and activated β-catenin, leading to the accumulation of β-catenin in the nucleus and the acceleration of EMT and metastasis in cancer cells.26,27 In addition, TROP2 could promote tumor progression via other growth-stimulatory signaling pathways, including the cyclin D1 and extracellular signal regulated kinase (ERK) pathways. 25 Cubas et al. reported that TROP2 expression increased the levels of phosphorylated ERK1/2, mediating cell cycle progression by increasing the levels of cyclin D1 and cyclin E as well as by downregulating p27. 28 These findings demonstrated the pathogenic effects induced by TROP2 expression in cancer cells and the importance of targeting this cell surface glycoprotein. However, the more detailed mechanism of TROP2 in CRC progression requires further study.
According to the results of our study, we suggest that TROP2 expression can be used to stratify CLO patients to predict prognosis. In addition, the determination of the TROP2 expression status can help to tailor adjuvant treatment with a comprehensive approach. For instance, if patients with high TROP2 expression are identified, the tumor behavior may be more aggressive, and the patient might be susceptible to extrahepatic metastasis. Thus, for these patients, a more aggressive postoperative chemotherapy regimen should be given, even with targeted therapy, and more frequent follow-up examinations should be performed. In contrast, for patients with low TROP2 expression, aggressive postoperative chemotherapy should be avoided because the patients might attain less benefit from postoperative chemotherapy because of their favorable prognosis. Therefore, these patients can be spared from the associated toxicity, cost, and inconvenience of overtreatment. Based on these results, the detection of TROP2 expression could be useful for personalizing treatment, which allows patients to maximize treatment benefits while minimizing harm, thus providing an optimal survival benefit and quality of life.
Some limitations to this study should be acknowledged. First, this retrospective study was conducted with an uncontrolled methodology and included a limited number of patients from a single center. Therefore, these findings need to be validated in multicenter studies or larger cohort studies. Second, the 5-year survival data were unavailable for some patients owing to an insufficient follow-up duration. This issue may have led to the underestimation or overestimation of the effect of TROP2 expression on intrahepatic recurrence. Third, the molecular mechanisms of TROP2 that promote tumor progression were not validated in the current study. A confirmation of the association of TROP2 with the potential molecular mechanisms that were indicated by the gene expression profiling would help us to further understand the impact of TROP2 on the progression of CLO. Despite these limitations, our findings suggest that TROP2 is an oncogene that has potential as a prognostic predictor and even as a therapeutic target.
Conclusion
The current study has demonstrated that TROP2 expression in liver oligometastases could serve as a predictor of prognosis in patients with CLO undergoing liver resection. Accordingly, the detection of TROP2 expression may help surgeons to evaluate the benefit of curative hepatectomy and to determine individualized postoperative treatment.
Supplemental Material
Supplemental_Table_1_1 – Supplemental material for TROP2 overexpression in colorectal liver oligometastases is associated with poor prognosis after liver resection
Supplemental material, Supplemental_Table_1_1 for TROP2 overexpression in colorectal liver oligometastases is associated with poor prognosis after liver resection by Jianhong Peng, Qingjian Ou, Yuxiang Deng, Binyi Xiao, Lin Zhang, Jibin Li, Yin Li, Desen Wan, Zhenhai Lu and Yujing Fang in Therapeutic Advances in Medical Oncology
Footnotes
Acknowledgements
Jianhong Peng, Qingjian Ou, and Yuxiang Deng contributed equally to this work. We deeply appreciate the help from all colleagues of the Department of Colorectal Surgery at Sun Yat-sen University Cancer Center who were involved in performing the treatment for the current study. The authenticity of this article has been validated by uploading the key raw data onto the Research Data Deposit public platform (![]() ), with the approval number RDDB2019000641.
), with the approval number RDDB2019000641.
Funding
The author(s) disclosed receipt of the following financial support for the research, authorship, and/or publication of this article: This work was funded by grants from Guangzhou Science and Technology Plan Projects (Health Medical Collaborative Innovation Program of Guangzhou; grant number 201803040019), National Natural Science Foundation of China (grant number 81871991), and Sun Yat-sen University Clinical Research 5010 Program (grant numbers 2015024 and 2013013).
Conflict of interest statement
The authors declare that there is no conflict of interest.
References
Supplementary Material
Please find the following supplemental material available below.
For Open Access articles published under a Creative Commons License, all supplemental material carries the same license as the article it is associated with.
For non-Open Access articles published, all supplemental material carries a non-exclusive license, and permission requests for re-use of supplemental material or any part of supplemental material shall be sent directly to the copyright owner as specified in the copyright notice associated with the article.