
Abstract
Background:
This study aims to investigate the combination effect of a novel sirtuin inhibitor (BZD9L1) with 5-fluorouracil (5-FU) and to determine its molecular mechanism of action in colorectal cancer (CRC).
Methods:
BZD9L1 and 5-FU either as single treatment or in combination were tested against CRC cells to evaluate synergism in cytotoxicity, senescence and formation of micronucleus, cell cycle and apoptosis, as well as the regulation of related molecular players. The effects of combined treatments at different doses on stress and apoptosis, migration, invasion and cell death mechanism were evaluated through two-dimensional and three-dimensional cultures. In vivo studies include investigation on the combination effects of BZD9L1 and 5-FU on colorectal tumour xenograft growth and an evaluation of tumour proliferation and apoptosis using immunohistochemistry.
Results:
Combination treatments exerted synergistic reduction on cell viability on HCT 116 cells but not on HT-29 cells. Combined treatments reduced survival, induced cell cycle arrest, apoptosis, senescence and micronucleation in HCT 116 cells through modulation of multiple responsible molecular players and apoptosis pathways, with no effect in epithelial mesenchymal transition (EMT). Combination treatments regulated SIRT1 and SIRT2 protein expression levels differently and changed SIRT2 protein localization. Combined treatment reduced growth, migration, invasion and viability of HCT 116 spheroids through apoptosis, when compared with the single treatment. In addition, combined treatment was found to reduce tumour growth in vivo through reduction of tumour proliferation and necrosis compared with the vehicle control group. This highlights the potential therapeutic effects of BZD9L1 and 5-FU towards CRC.
Conclusion:
This study may pave the way for use of BZD9L1 as an adjuvant to 5-FU in improving the therapeutic efficacy for the treatment of colorectal cancer.
Introduction
Colorectal cancer (CRC) is the third most common cancer in the world. 1 Despite advances in cancer therapeutics, late-stage metastatic CRC diagnosis is associated with a low survival rate. 2 Moreover, the emergence of acquired resistance to chemotherapies render many therapeutic drugs ineffective for CRC treatment.3,4 5-fluorouracil (5-FU) is often used as the first-line chemotherapy regimen for CRC.5–7 Over the years, efforts have been made to increase tumour chemosensitivity through adjuvant treatments to improve treatment efficacy and cost, and to reduce side effects.8–10 Targeted therapy is gaining greater recognition due to higher specificity and lower toxicity in many cancer treatments, but the lack of successful drug candidates used as an adjunct to chemotherapy in CRC highlights a need to identify novel therapeutic compounds.11,12
Sirtuins (SIRTs) are a family of proteins comprising seven members, SIRT1 to SIRT7, in mammals. SIRTs are class III histone deacetylases utilizing nicotinamide adenine dinucleotide (NAD+) as a substrate. 13 Among all SIRTs, SIRT1 and SIRT2 are highly expressed in CRC. 14 These SIRTs play important roles in CRC, including the promotion of epithelial–mesenchymal transition (EMT), chemoresistance, promotion of cancer cell survival and proliferation and involvement in tumour invasion and migration.15–20 Consequently, SIRTs are attractive targets for drug development, but the failure of existing SIRT modulators to reach clinical trials has led to the search for new SIRT modulators and ultimately the discovery of BZD9L1, a highly fluorescent benzimidazole derivative and novel SIRT1 and SIRT2 inhibitor. 14
We have previously reported the anti-cancer effects of BZD9L1 on CRC cells in vitro. 14 BZD9L1 curbed CRC cell growth through a reduction of cell viability, migration, survival and induction of apoptosis via the modulation of various cancer pathways. The shortcoming of using 5-FU is often linked to chemoresistance and severe unwanted side effects. As BZD9L1 is a cytotoxic agent, 14 its combination with 5-FU may increase treatment efficacy. The current study aims to provide novel insights into the potential development of BZD9L1 as an adjuvant to 5-FU in CRC therapy.
Methods and materials
Cell line and cell culture
Colorectal carcinoma HCT 116 (CCL-247) and colorectal adenocarcinoma HT-29 (HTB-38) were purchased from American Type Culture Collection (ATCC) (Rockwell, USA). Colorectal carcinoma LIM1215 and colorectal adenocarcinoma Caco-2 were kind gifts from Associate Professor Dr Tan Mei Lan from Universiti Sains Malaysia, Malaysia. HCT 116, HT-29 and LIM1215 cells were cultured in Roswell Park Memorial Institute (RPMI) 1640 medium (Nascalai Tesque, Japan) supplemented with 10% foetal bovine serum (Tico Europe, Netherlands). Caco-2 was cultured in Dulbecco’s Modified Eagle Medium (DMEM) (Nascalai Tesque, Japan) supplemented with 20% foetal bovine serum (Tico Europe, Netherlands). All media were supplemented with 100 units/ml penicillin (Biowest, USA) and 100 units/ml streptomycin (Biowest, USA).
Cell treatment
BZD9L1 was synthesized as previously reported. 21 Cells were seeded in plates at an appropriate density for each assay and allowed to adhere for 24 h prior to treatments. Dimethyl sulfoxide (DMSO) (Nascalai Tesque, Japan) was used as a vehicle control and cells were treated with 10 µM or 25 µM BZD9L1 and/or 5 µM 5-FU (Hospira, UK). Cisplatin (Hospira, UK), cyclophosphamide (Sigma, USA), etoposide (Nacalai Tesque, Japan) and TGF-β1 (Merck, USA) were used as positive controls according to assay requirements. Media and treatments were renewed every 3 days.
Cell viability assays
Cytotoxicity of BZD9L1 and/or 5-FU on monolayer cell cultures were evaluated using CyQUANT® Cell Proliferation Assay Kit (Invitrogen, USA) and 3-(4,5-dimethylthiazol-2-yl)-2,5-diphenyl tetrazolium bromide (MTT) assay based on the manufacturer’s protocol. Briefly, cells were plated and treated with BZD9L1 and/or 5-FU for 72 h. Fluorescent intensity via CyQUANT® assay was determined by reading the samples under 480 nm excitation and 520 nm emission, whereas formazan crystals formed in MTT assay were dissolved using DMSO and read under 570 nm. Both plates were scanned using the Tecan Infinite M200 microplate reader (Tecan, Switzerland).
Determination of drug synergism
The determination of a synergistic effect was calculated based on the Chou–Talalay equation where combination indices (CIs) were obtained based on the classic isobologram. Each CI was analysed using Calcusyn software (Biosoft). CI < 1, CI = 1 and CI > 1 indicates a synergistic, additive and antagonistic effect, respectively.
Colony-formation assay/clonogenic assay
Cells were seeded and treated for 72 h. At the end of the incubation period, the treatment media was replaced with complete medium (without treatment) and allowed to incubate for another 5 days. Cells were fixed with 4% formaldehyde (BioBasic, Canada) and subsequently stained with crystal violet solution (1% concentration in 20% methanol) (Riedel-de Haen, USA) for 2 h. Stained colonies were imaged and quantified using Image J software.
Senescence-associated beta-galactosidase (SA-β-gal) assay
Cellular senescence was determined through staining treated cells using a SA-β-gal Staining Kit (Cell Signaling Technology, USA) based on the manufacturer’s protocol. Cisplatin was used as the positive control.22,23 At the end of the incubation period, the treatment media was replaced by complete medium (without treatment) and allowed to incubate for another 3 days. The proportion of cells undergoing senescence was determined by calculating the ratio of blue cells over total cells, with a minimum scoring of 300 cells per condition using Image J software. Images were taken using an inverted microscope (AE31, Motic, Hong Kong) using a 5.0 MP Eyepiece digital camera (Olympus, Singapore) at 200× total magnification.
Cell cycle analysis
Briefly, HCT 116 cells were treated for 72 h. Cells were collected and prepared for cell cycle analysis using the Cell Cycle Phase Determination Kit (Cayman, USA) according to the manufacturer’s protocol. Distribution of cell cycle phases with different DNA content was analysed via flow cytometry (BD LSR II, BD Biosciences, USA).
Annexin V FITC: propidium iodide flow cytometric assay
Analysis of the HCT 116 apoptotic profile was performed using the Muse™ Annexin V and Dead Cell Assay Kit (Merck) based on the manufacturer’s protocols. Briefly, cells were collected 72 h post-treatment and prepared in suspension following the addition of Muse™ Annexin V and Dead Cell Reagent. Samples were then mixed well and incubated at room temperature for 20 min under dark conditions. Samples were analysed using the Muse™ Cell Analyzer (Merck) flow cytometer and with the Muse™ Annexin V and Dead Cell software module.
DAPI staining
At 72 h post-treatment, cells were fixed using 4% formaldehyde (BioBasic, Canada) and were rinsed with phosphate buffer saline (PBS). Cells were then incubated in ice-cold methanol for 20 min, followed by another rinse with PBS. Cells were mounted to glass slides using Fluoroshield with DAPI mounting media (Sigma), and imaged using an inverted fluorescent microscope (BX41, Olympus, Singapore) at a magnification of 400×.
Hoechst 33258 and PI double staining
At 72 h post-treatment, cells were co-stained with 1 µg/ml Hoechst 33258 (Biotium, USA) and 2.5 µg/ml PI (Biotium). Cells were subsequently imaged using an inverted fluorescent microscope (BX41, Olympus, Singapore) under a magnification of 400× to identify apoptotic cells.
Quantitative real-time PCR
Cells were plated and treated for a duration of 24, 48 and 72 h. Total RNA was obtained using GENEzol Reagent (Geneaid, Taiwan) according to the manufacturer’s protocol. RNA was converted to cDNA through reverse transcription using Tetro cDNA Synthesis Kit (BIOLINE, USA). Quantitative real-time PCR (QPCR) was performed using KAPA SYBR FAST qPCR Kit Master Mix (2X) Universal (KAPA reference dye BIOSYSTEMS, USA), and amplified with 7500 Fast Real-time PCR System (Applied Biosystems, USA). At the holding stage, the samples were incubated at 95°C for 20 s, followed by 40 cycles of amplification at 95°C for 3 s and 60°C for 30 s. The samples were further incubated at 95°C for 15 s, then 60°C for 1 min, 95°C for 15 s and 60°C incubation for 15 s at the melt curve stage. Genes of interest were normalized to the glyceraldehyde-3-phosphate dehydrogenase (GAPDH) housekeeping gene. Data was analysed using the comparative CT (ΔΔCT) method. Primer sequences for identifying genes of interest are as follows: GAPDH: Forward primer: 5′-TGAACGGGAAGCTCACTGG-3′ Reverse primer: 5′-TCCACCACCCTGTTGCTGTA-3′ BAX: Forward primer: 5′-CCCCGAGAGGTCTTTTCC-3′ Reverse primer: 5′-AAGATGGTCACGGTCCAACC-3′ BCL2: Forward primer: 5′-CAGGATAACGGAGGCTGGGATG-3′ Reverse primer: 5′-AGAAATCAAACAGAGGCCGCA-3′ GADD45A: Forward primer: 5′-GCTGCTCAACGTAATCCACA-3′ Reverse primer: 5′-ATCCAAACTATGGCTGCACA-3′ TRAF2: Forward primer: 5′-CGACCGTTGGGGCTTTGT-3′ Reverse primer: 5′-TCGTGGCAGCTCTCTGTATTC-3′ SNAI1: Forward primer: 5′-TCCTCCGCAATGTGTCCAG-3′ Reverse primer: 5′-AGATGAGCATTGGCAGCGAG-3′ SNAI2: Forward primer: 5′-CGAACTGGACACACATACAGTG-3′ Reverse primer: 5′-CTGAGGATCTCTGGTTGTGGT-3′ ZEB1: Forward primer: 5′-TTACACCTTTGCATACAGAACCC-3′ Reverse primer: 5′-TTTACGATTACACCCAGACTGC-3′ MMP9: Forward primer: 5′-GGGACGCAGACATCGTCATC-3′ Reverse primer: 5′-TCGTCATCGTCGAAATGGGC-3′ APC2: Forward primer: 5′-TCCTCCGCAATGTGTTCCAG -3′ Reverse primer: 5′-AGGCTGTGCGAAGTCAGATG -3′
Western blot
Protein was extracted from cells using 8M urea lysis buffer and quantified using bicinchoninic acid assay (Nacalai Tesque, Japan). Protein extracts were resolved by 10–14% bis-acrylamide gel (depending on the molecular size of the protein target) at a constant voltage of 150 V for 75 min. Proteins were then transferred onto a Amersham Hybond 0.45 µm PVDF (GE Healthcare Life Science, Germany) membrane and subsequently blocked with 5% skim milk in TBST for 1 h. The membrane was rinsed briefly with TBST prior to probing with primary antibodies: β-actin (Sigma, Cat#096 M4855 V, mouse monoclonal), caspase 3 (cleaved Asp175) (GeneTex, Cat#GTX86952, rabbit polyclonal), E-cadherin (24E10) (Cell Signaling Technology, Cat#3195, rabbit monoclonal), PARP (Cell Signaling Technology, Cat#9542, rabbit polyclonal), SIRT1 (C14H4) (Cell Signaling Technology, Cat#2496S, rabbit monoclonal), SIRT2 (H-95) (Santa Cruz, Cat#sc-20966, rabbit polyclonal), Smad4 (B-8) (Santa Cruz, Cat#sc-7966, mouse monoclonal), Twist (Abcam, Cat#ab49254, rabbit polyclonal) and vimentin (R28) (Cell Signaling Technology, Cat#3932, rabbit polyclonal) at 4°C overnight. Next, the membrane was washed with TBST and probed with appropriate HRP-conjugated secondary antibodies (anti-mouse or anti-rabbit IgG, HRP-linked antibody from Cell Signaling Technology, USA) at room temperature for 1 h. Bound antibodies were detected by incubating the blots in ChemiLumi One Super (Nacalai Tesque, Japan) for 1 min. Finally, the membrane was scanned using c-DiGit chemiluminescence scanner (Li-cor, USA).
Immunofluorescence staining
Cells were seeded in eight-well chamber slides and treated for 72 h. Media was removed and cells were rinsed with PBS. Cells were fixed with 4% paraformaldehyde for 15 min at room temperature followed by rinsing with PBS (three times, 5 min each). The cells were then permeabilized using ice-cold methanol and rinsed again with PBS as previously described. The cells were blocked with 5% BSA solution for 1 h, followed by rinsing with PBS again as previously described. Subsequently, 200 µl of primary antibodies: SIRT1 (B-10) (Santa Cruz, Cat#sc-74504, mouse monoclonal) and SIRT2 (H-95) (Santa Cruz, Cat#sc-20966, rabbit polyclonal) were added to the cells and incubated at 4°C overnight. Next, the cells were rinsed with PBS followed by incubation with secondary antibodies (anti-mouse or anti-rabbit IgG, highly cross-adsorbed secondary antibody, Alexa Fluor, Thermo Fisher, USA) for 1 h at room temperature. Cells were washed in PBS three more times (5 min each). The slides were removed from the chamber casket and mounted using Fluoroshield with DAPI mounting media (Sigma). Cells were viewed and imaged using an inverted fluorescent microscope (BX41, Olympus).
Stress and apoptosis array
The effect of BZD9L1 and/or 5-FU on HCT 116 stress and apoptosis signalling was studied using the PathScan® Stress and Apoptosis Signaling Antibody Array Kit (Cell Signaling Technology) according to the manufacturer’s protocol. Briefly, the array gasket was fixed onto the array slide, and the array was blocked with array blocking buffer for 15 min. Next, protein lysates (harvested from cells 72 h post-treatment) were added into the gasket, sealed and allowed to incubate at 4°C overnight. The gasket was subsequently washed with array washing buffer (four times, 5 min each) followed by incubation with detection antibody cocktail for 1 h at room temperature. The gasket was washed again with array washing buffer (four times, 5 min each) and incubated with HRP-linked streptavidin for 30 min at room temperature. At the end of the incubation period, the gasket was washed again in array washing buffer as previously described. The gasket was then removed and the array slide was briefly washed further. The slide was exposed to the scanning reagent for 1 min and scanned using a chemiluminescence imaging system (ChemiDoc XRS+, Bio-Rad, USA). The intensity of array dots were analysed using Bersoft Array Analyzer software (Bersoft Software and Technology, Canada
Generation of spheroids
Three-dimensional (3D) HCT 116 spheroids were formed using a hanging drop assay. Briefly, cell suspensions were prepared in complete media containing 0.24% methylcellulose (Sigma). Droplets with a final volume of 20 µl containing 1000 cells per drop were then formed by incubation in an inverted position on the inner side of a sterile petri dish lid for 3 days under normal conditions (37°C, 5% CO2) for the formation of functional spheroids. Methylcellulose media was prepared according to an established protocol. 24
Spheroid viability assay
The viability of treated HCT 116 spheroids was determined using WST-8 assay. 25 Briefly, 100 µl treatment media was placed in wells of a 96-well plate precoated with agarose (0.75%, 50 µl per well). Spheroids were subsequently inserted into each well and allowed to incubate for 72 h. At the end of the incubation period, 10 µl of WST-8 solution (Nascalai Tesque, Japan) was added into each well and allowed to further incubate for another 5 h. Spheroids were then scanned at 480 nm using Tecan Infinite M200 microplate reader (Tecan). Cell viability was determined using the following formula:

Live/dead staining and spheroid viability assay
Briefly, HCT 116 spheroids were inserted into agarose-coated plates containing treatment media (vehicle control, 25 µM BZD9L1 and/or 5 µM 5-FU, or etoposide). Spheroids were imaged using a phase contrast inverted fluorescent microscope (Axio Observer A1/Apotome, Zeiss, Germany) at magnification of 50× at 0, 24, 48 and 72 h time points. At the end of the experiment, spheroids were stained with 1 µg/ml Hoechst 33258, 2.5 µg/ml PI and 2 µg/ml calcein AM for 30 min. Spheroids were imaged using the same microscope at a magnification of 50×.
Spheroid migration assay
Briefly, spheroids were inserted into plates (precoated with 0.1% gelatin) containing treatment media (vehicle control, 25 µM BZD9L1 and/or 5 µM 5-FU, or TGF-β1). Spheroids were then incubated for 30 min under normal conditions (37°C, 5% CO2) to allow attachment, before being imaged at 0, 24, 48 and 72 h time points using a phase contrast inverted microscope (Axio Observer A1/Apotome) at 50× magnification. The migration area of spheroids at each time point was measured using Image J software.
Spheroid invasion assay
To study the invasion of HCT 116 spheroids post-treatment, spheroids were implanted into a matrix containing Matrigel (Corning, USA) and neutralized type 1 collagen (Thermo Fisher Scientific, USA) in a ratio of 1:1. The matrix-containing spheroids were allowed to solidify for 30 min in the incubator, followed by addition of treatment media. Spheroids were imaged at 0, 24, 48 and 72 h time points using a phase contrast inverted microscope (Axio Observer A1/Apotome) at 50× magnification. The invasion area of spheroids at each time point was measured using Image J software.
In vivo tumour xenograft model
Approximately 5 × 10⁶ HCT 116 cells in Matrigel (250 µl total injection volume, mixture of 1:1, media: Matrigel, v/v) were injected subcutaneously into the right flank of nude mice aged 6–8 weeks with an average weight of 25 g. When the tumour volume of any three mice reached 100 mm3, mice were dosed with vehicle control, 30 mg/kg 5-FU, 50 mg/kg BZD9L1 and a combination of 30 mg/kg 5-FU and 50 mg/kg BZD9L1 through intraperitoneal injection every 3 days. The growth of tumours was monitored three times per week by measuring the length (L), width (W) and height (H) of each tumour with a calliper. Tumour volumes (V) were calculated from the formula (V = 0.52 × L × W × H). Mice were weighed every 3 days. Mice were sacrificed when respective tumour size reached 1000 mm3, and all mice were sacrificed once half of the total number of animals from any treatment group were sacrificed. Tumours were harvested, weighed and fixed in 10% neutral buffered formalin, embedded in paraffin blocks and sectioned for immunohistochemistry studies. All animal experiments were conducted under protocols approved by the USM Animal Care and Use Committee (Reference number: USM/IACUC/2017/(105)(872)).
Immunohistochemistry staining
Sectioned tumour slides were deparaffinized and rehydrated. The sections were incubated in antigen retrieval (pH 9.0), washed with TBST washing buffer and incubated with Dako® peroxidase blocking reagent for 1 h. The sections were then washed with TBST (three times, 5 min per wash). The slides were blocked using blocking solution (10% goat serum and 5% BSA in TBST) for 1 h. Slides were then washed again and incubated with primary antibodies against Ki67 (Dako, Clone MIB-1, Cat#M7240, mouse monoclonal) overnight at 4°C. Subsequently, the slides were washed and incubated with biotinylated secondary antibody for 1 h, followed by washing with TBST (three times, 5 min each) to remove unbounded antibodies. The sections were incubated with ABC solution for 1 h, and remaining solutions were removed through washing with TBST as previously described. Finally, 200 µl of Dako® DAB solution was applied to each section, and samples were monitored closely to examine the development of stains. The slides were counterstained with haematoxylin, washed, left to dry overnight and mounted. Slides were imaged using a light microscope (CX41, Olympus) at 100× magnification. The ratio of stained cells versus total cells were scored using Image J software.
Haematoxylin and eosin staining of tumour sections
The paraffin embedded tumour sections were deparaffinized in xylene and rehydrated in graded ethanol. The sections were rinsed in distilled water and stained with haematoxylin for 5 min. The sections were washed again and counterstained with eosin for 2 min. Slides were washed to remove excess stain, air dried and mounted. Slides were imaged using a light microscope (CX41) at 100× magnification.
Statistical analysis
GraphPad Prism 6.0 (GraphPad, USA) software was used to analyse all data. Student’s t test was used to compare mean values between two datasets. The analysis of variance (ANOVA) test was used to compare mean values among three or more datasets. Bonferroni’s post-test was used to compare any two datasets among three or more sets. Statistical significance was indicated by */# where p < 0.05, **/## where p < 0.01, ***/### where p < 0.001 and ****/#### where p < 0.0001. All error bars depict standard error of the mean (SEM).
Results
BZD9L1 and 5-FU synergistically reduced HCT 116 cell viability
Synergism in reduction of cell viability was achieved in HCT 116 cells treated with combinations of 10 or 25 µM BZD9L1 and 5 or 10 µM 5-FU (Figure 1(b)(i–ii)). All four combinations: 10 µM BZD9L1 and 5 µM 5-FU, 10 µM BZD9L1 and 10 µM 5-FU, 25 µM BZD9L1 and 5 µM 5-FU, and 25 µM BZD9L1 and 10 µM 5-FU with CI of 0.80, 0.85, 0.70 and 0.72 respectively achieved moderate synergism (CI = 0.70 to 0.85) compared with single treatments. In HT-29 cells, treatment of all four combinations above lies in the range of nearly additive (CI =0.90 to 1.10) (Figure 1(a)(i–ii)). The CI of HT-29 cells treated with 10 µM BZD9L1 and 5 µM 5-FU, 10 µM BZD9L1 and 10 µM 5-FU, 25 µM BZD9L1 and 5 µM 5-FU, and 25 µM BZD9L1 and 10 µM 5-FU were 0.98, 0.88, 0.91 and 0.95 respectively. HCT 116 cells treated with high concentrations of BZD9L1 (40 µM BZD9L1) showed no additional effects in combination with 5-FU. However, combinations of either 10 or 25 µM BZD9L1 and 5 µM 5-FU reduced HCT 116 cell viability more effectively compared with sole treatments through a synergistic effect; thus these dosages were selected for downstream studies (Figure 1(b)(iii–iv)). Treatment of both HT-29 cells and LIM1215 cells with a combination of 10 µM BZD9L1 and 5 µM 5-FU showed a significant reduction in cell viability compared with single treatments (Supplementary Figure S1(b, c)). However, a combination of 25 µM BZD9L1 and 5 µM 5-FU in both HT-29 and LIM1215 cell lines did not reduce cell viability further (Supplementary Figure S1(b, c)). Surprisingly, combined 10 µM BZD9L1 and 5 µM 5-FU treatment is antagonistic in LIM1215 cells (Supplementary Figure S1(c)). Combined treatments in Caco-2 cells showed a significant reduction of cell viability compared with vehicle control through a synergistic effect between BZD9L1 and 5-FU (Supplementary Figure S1(d)).

Hereafter, 5 µM 5-FU will be termed 5-FU, combined treatment of 10 µM BZD9L1 and 5 µM 5-FU will be termed the lower dose combination, and combined treatment of 25 µM BZD9L1 and 5 µM 5-FU will be termed the higher dose combination.
Next, we studied the combination effect of BZD9L1 and 5-FU on HCT 116, HT-29, LIM1215 and Caco-2 cell survival using colony-formation assay (Figure 1(c); Supplementary Figure S2). Significant reduction of colonies was achieved post-treatment with the higher dose combination in HCT 116 cells and LIM1215 cells, the lower dose combination in HT-29 cells, and the combined treatment of 50 µM BZD9L1 and 5-FU in Caco-2 cells as compared with respective sole treatments (Figure 1(c); Supplementary Figure S2(a)(i, ii), (b)(i, iii), (c)(i, ii)). However, HCT 116 cells treated with the lower combination dose did not show a significantly improved effect on colony formation as compared with single 5-FU treatment (Figure 1(c)). No additional inhibition of colonies was observed in HT-29 cells post-treatment with the higher dose combination (Supplementary Figure S2(a)(i, iii)). Lower combination treatment in LIM1215, and combined 100 µM BZD9L1 and 5-FU in Caco-2 cells did not show additional reduction of survival compared with sole 5-FU treatments (Supplementary Figure S2(b)(ii) and (c)(iii)).
The higher dose combination treatment and respective BZD9L1 single treatment induced cleavage of caspase 3 proteins in LIM1215 cells (Supplementary Figure S3(a)(i)). Remarkably, cleaved caspase 3 was only observed in Caco-2 cells treated with lone 5-FU treatment but was not observed in other treatment regimens (Supplementary Figure S3(a)(ii)). Both combination treatments and single BZD9L1 treatments also induced cleavage of PARP proteins in LIM1215 cells (Supplementary Figure S3(b)(i)). In Caco-2 cells, a reduction in full-length PARP was observed post-treatment with both combination treatments and the higher dose BZD9L1 treatment as compared with the control (Supplementary Figure S3(b)(ii)). Although LIM1215 has no detected expression of Ki67 proteins, Caco-2 cells treated with the lower dose BZD9L1 and the lower dose combination treatment showed a reduction as compared with the vehicle control, whereas the higher dose BZD9L1 and the higher dose combination treatment depleted expression of Ki67 proteins (Supplementary Figure S3(c)).
Higher dose combination treatment induced S-phase cell cycle arrest while both combination treatments induced cellular senescence in HCT 116 cells
Cell cycle arrest was absent in cells treated with the lower dose combination, although significant reduction in the G0/G1 phase was observed in cells treated solely with 5-FU and in combination with 10 µM BZD9L1 (Figure 2(a)). Interestingly, the higher dose combination treatment induced S-phase arrest in HCT 116 cells (Figure 2(b)). Both lower and higher combination treatments induced cellular senescence compared with respective single treatments and vehicle control (Figure 2(c)). The high ratio of senescence cells in cisplatin-treated cells (positive control) as compared with the vehicle control indicated the validity of this assay (Figure 2(c)).

Combination of BZD9L1 and 5-FU increased apoptosis of HCT 116 cells
All treatments induced cell apoptosis as compared with the vehicle control (Figure 3(a–c)). An increase in early apoptotic cells was observed in HCT 116 cells treated with the lower dose combination as compared with respective single treatments (Figure 3(a)(ii)). Interestingly, the higher dose combination induced both early and late apoptosis in HCT 116 cells, which is remarkable as 25 µM BZD9L1 single treatment only induced late apoptosis, while 5-FU single treatment only induced early apoptosis in the cells (Figure 3(b)(ii)). In addition, formation of apoptotic features such as chromatin condensation and/or nuclear fragmentation was observed in all treatments except for the vehicle control (Figure 3(d)(i)). The induction of late-stage apoptosis was determined through Hoechst 33258/PI double staining and evaluation of PARP protein in each treatment. Combination treatments resulted in a higher ratio of apoptotic cells compared with their respective sole treatment counterparts (Figure 3(c)). Cleavage of PARP proteins were also present in all treatments except for the vehicle control (Figure 4(d)). Treatment by the high dose combination resulted in quenching of full-length PARP and yielding of cleaved PARP proteins (Figure 4(d)). Next, gene expression studies showed that combination treatments increased gene expression of pro-apoptotic genes BAX, BCL2 and GADD45A post-treatment as compared with the vehicle control (Figure 4(a)(i–iii), Figure 4(b)(i–iii))). Interestingly, the higher dose combination caused greater gene expression of BAX, BCL2 and GADD45A compared with single treatments at the 48 h time point (Figure 4(b)(i–iii)). Combination treatments also induced the expression of cleaved caspase 3 proteins (Figure 4(d)). In contrast, a decrease in TRAF2 anti-apoptotic gene expression was found in cells treated with all treatments except 10 µM BZD9L1 after 24 h as compared with the vehicle control (Figures 4(a)(iv) and 4(b)(iv)). Formation of micronuclei was seen in cells treated with both low and high dose combination but not in single doses and vehicle control (Figure 3(d)). The presence of micronuclei in cyclophosphamide-treated cells (positive control) indicated the validity of this assay (Figure 3(d)).


The array analysis showed that the lower dose combination treatment increased phosphorylation of protein kinase B (Akt), BCL2-associated agonist of cell death (BAD) protein, checkpoint kinase 2 (Chk2), eukaryotic translation initiation factor 2 (eIF2α), extracellular signal-regulated kinases 1 and 2 (ERK1/2), p38 mitogen-activated protein kinases (MAPKs), p53, stress-activated protein kinase/c-Jun NH(2)-terminal kinase (SAPK/JNK), mothers against decapentaplegic homolog 2 (Smad2) and transforming growth factor-β activated kinase-1 (TAK1) as compared with the vehicle control. Significant increase of Akt, Chk2, eIF2α, p38 MAPK, p53, Smad2 and TAK1 phosphorylation was also achieved in lower dose combination compared with lower BZD9L1 sole treatment (Figure 4(c)(i, ii)). In the higher dose combination treatment, treated cells possessed increased phosphorylation of Akt, Bad, Chk2, ERK1/2, p38 MAPK and TAK1 proteins. However, all levels of mentioned targets in the higher dose combination-treated cells except ERK1/2 were lower compared with higher BZD9L1 sole treatment. Remarkably, reduction of phosphorylated IκBα, total IκBα and survivin were observed in the higher dose combination treatment as compared with the vehicle control and BZD9L1 single treatment (Figure 4(c)(i, iii)). In addition, upregulation of MMP9 gene expression was observed in the higher dosage combination as compared with the 5-FU single treatment and the vehicle control, and upregulation of APC2 gene expression was attained compared with single treatments (Figure 4(e)(ii, iv)). No change in MMP9 and APC2 gene expression was observed in the lower dose combination treatment and respective single treatments (Figure 4(e)(i, iii)).
BZD9L1 and 5-FU combination treatment did not induce EMT in HCT 116 cells
The gene expression of SNAI2 was upregulated in both combination treatments, but no difference in regulation was observed for SNAIL1 and ZEB1 genes (Supplementary Figure S4(a, b)). This is corroborated by absence of TWIST and vimentin protein expression in all treatments (Supplementary Figure S4(c)(i)). Increased expression of E-cadherin was observed in HCT 116 cells treated with 25 µM BZD9L1 single treatment and in combination with 5-FU; and near-depletion of soluble E-cadherin proteins was achieved in higher dose combination-treated cells (Supplementary Figure S4(c)(ii)).
High dose of BZD9L1 and 5-FU combination treatment altered SIRT1 and SIRT2 protein expression levels and SIRT2 localization
The expression level of SIRT1 protein was notably increased upon treatment by 10 µM BZD9L1 as compared with control (Figure 5(b)). Surprisingly, the raised expression level of SIRT1 protein was suppressed in 10 µM BZD9L1 and 5-FU combined treatment. Both the high dose combination and the respective single BZD9L1 treatments marked a decrease in SIRT1 protein expression level (Figure 5(b)). All treatments except 10 µM BZD9L1 decreased SIRT2 protein expression levels as compared with the vehicle control (Figure 5(b)). Remarkably, 10 µM BZD9L1 did not alter overall SIRT2 protein expression level but caused a reduction of the SIRT2 isoform 1 and increase of the SIRT2 isoform 2 when treated in combination with 5-FU. Localization studies showed a shift of SIRT2 proteins from nucleus to cytoplasm in HCT 116 cells treated with combined treatments of 25 µM BZD9L1 and 5-FU compared with single treatments and the vehicle control (Figure 5(a)). SIRT1 protein localization remained mainly in the cytoplasm in all treatment conditions.

BZD9L1 and 5-FU combination treatment reduced HCT 116 spheroid viability and migration but had no effect on spheroid invasion
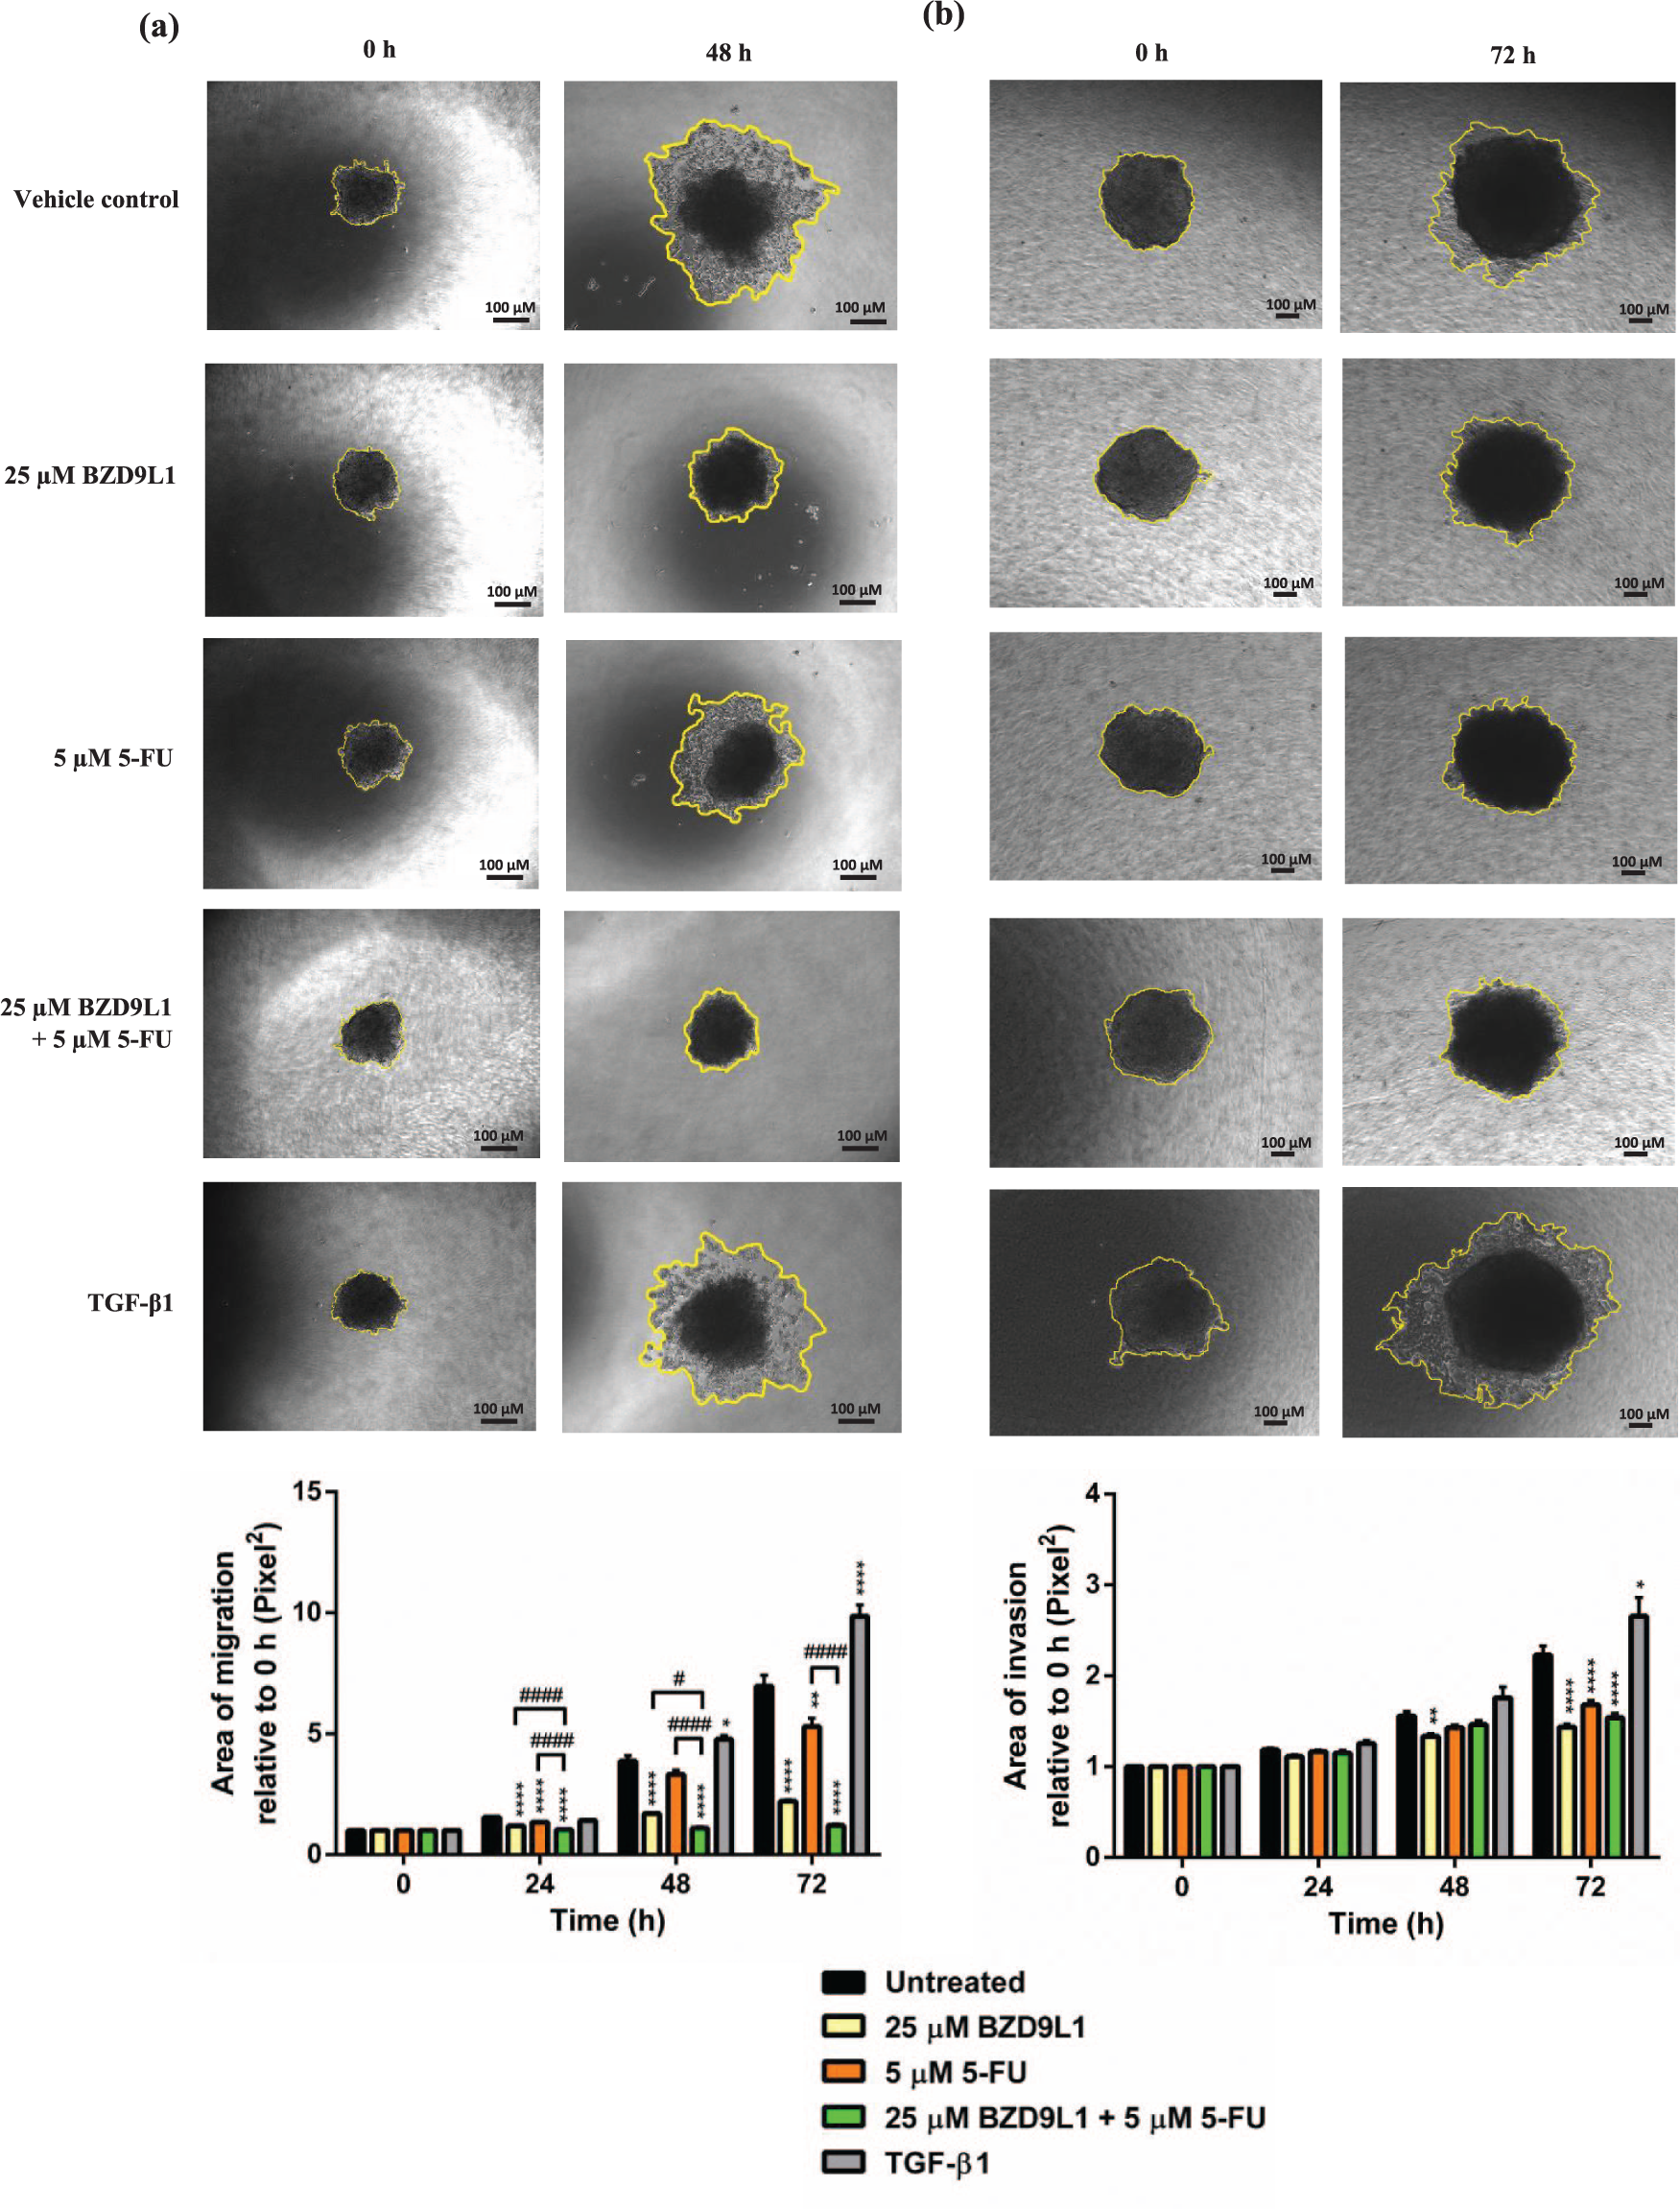
The IC50 of BZD9L1 and 5-FU on HCT 116 spheroid is 99.6 µM BZD9L1 and 18.0 µM 5-FU respectively (Supplementary Figure S5(a, b)). Combined treatment of 25 µM BZD9L1 and 5 µM 5-FU reduced the viability of HCT 116 spheroids more effectively as compared with single treatments (Figure 6(a); Supplementary Figure S5(c)). Combined treatments also marked a smaller spheroid area compared with 5-FU single treatment at the 24 h time point and BZD9L1 single treatment at the 48 h time point (Figure 6(b), Supplementary Figure S5(d)). Spheroids treated with BZD9L1 either as a single treatment or in combination with 5-FU are found to become less compact at 48 h onwards, and the spheroid was observed to begin losing three-dimensional spheroid integrity (Figure 6(b, c); Supplementary Figure S5(d)). Treatment with both compounds increased apoptosis of the spheroids as compared with single treatments, as evidenced by increased expression of cleaved PARP protein and PI in fluorescent staining (Figure 6(c, d)). The migration of spheroids treated with BZD9L1, 5-FU and a combination of both is inhibited after 24 h as compared with the vehicle control (Figure 7(a)). The migration of spheroids treated with combined treatments is significantly lower as compared with sole treatments at 24 h and 48 h post-treatment. However, the combination treatment only reduced the migration area more effectively than 5-FU and vehicle control after 72 h. In contrast, sole BZD9L1 treatment inhibited invasion as compared with the vehicle control at the 48 h time point (Figure 7(b)). Although all treatments involving BZD9L1 and 5-FU successfully inhibited invasion of HCT 116 spheroids after 72 h compared with the vehicle control, no addition or further inhibition was attained between the combined treatment and the single treatments (Figure 7(b)). TGF-β1 as the positive control treatment successfully induced both migration and invasion at the 48 h time point, and only invasion after 72 h (Figure 7(a, b)).

BZD9L1 and 5-FU combination treatment reduced xenograft tumour growth compared with sole treatments in vivo
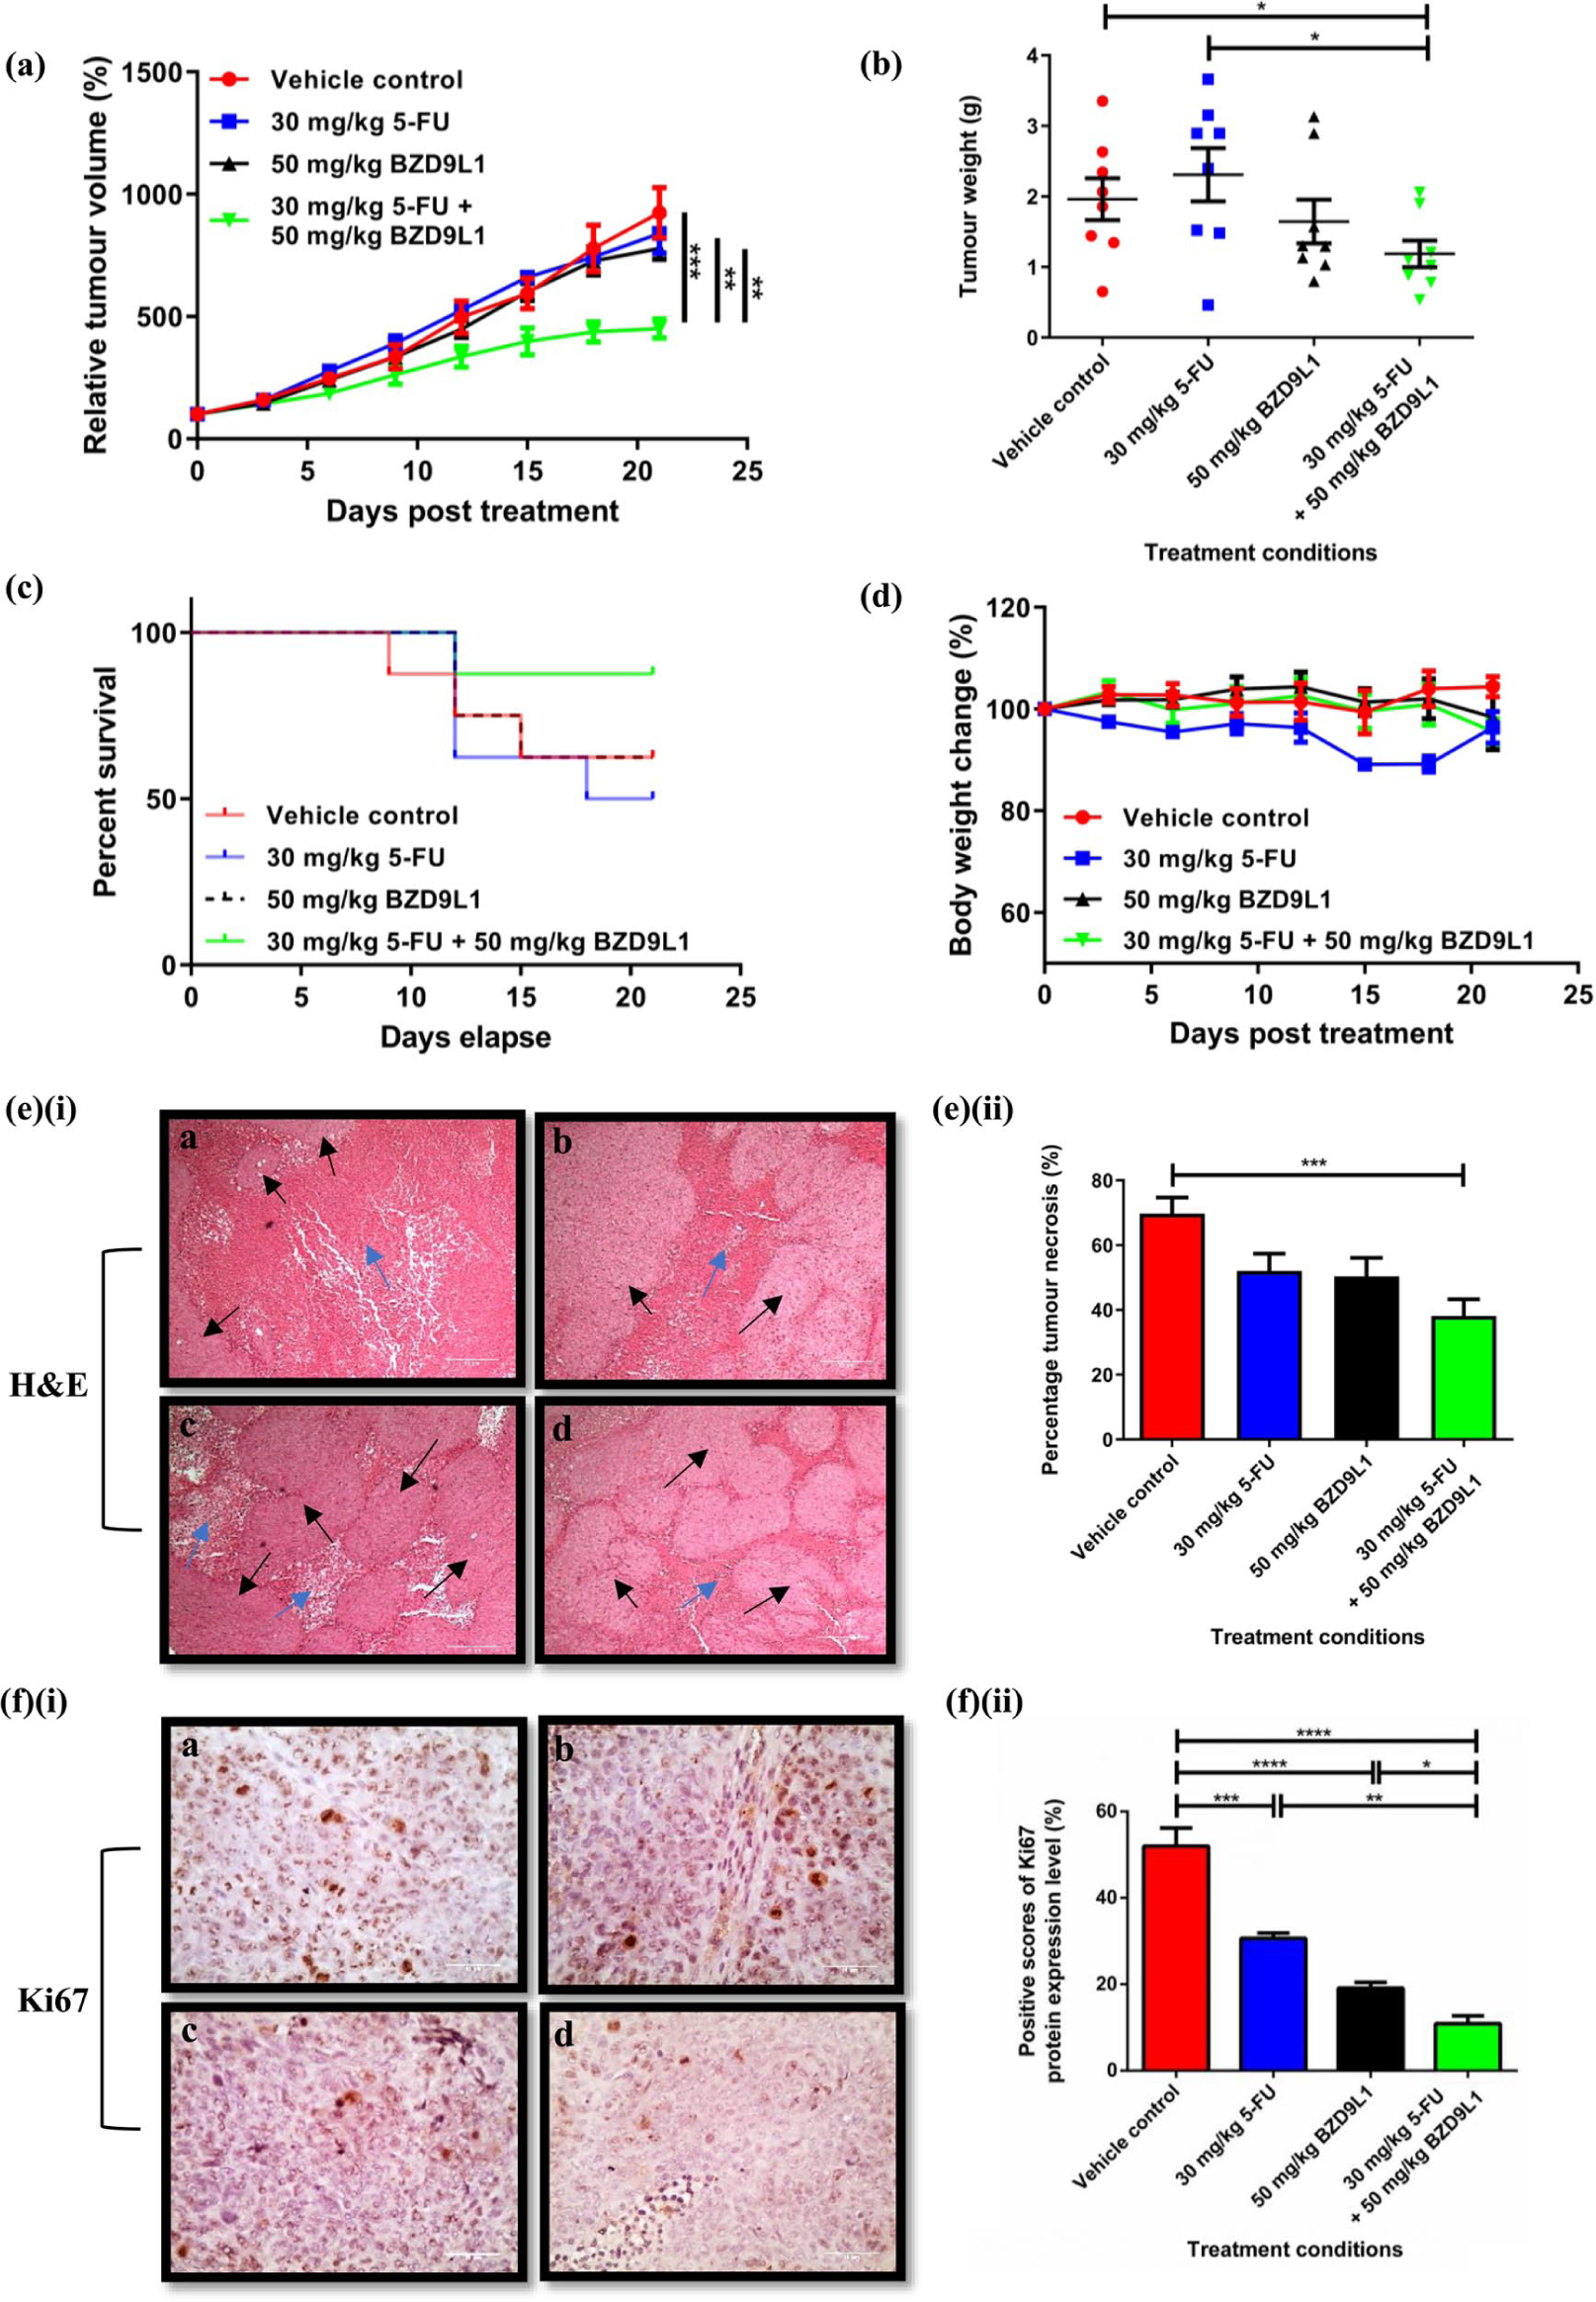
A significant inhibition of HCT 116 tumour growth was achieved in the combination treatment compared with single treatments, represented by a reduction of tumour weight and tumour volume after 18 days post-treatment to the time of mice sacrifice (Figure 8(a, b)). The relative tumour volume from groups treated with 5-FU and BZD9L1 single treatment was reduced to 90.8% and 84.2% respectively as compared with the control (100.0%), which observed a 9.2% and 15.8% tumour growth reduction as compared with the vehicle control group. Remarkably, the relative tumour volume of mice treated with a combination of both compounds exhibited a 51.2% reduction as compared with the vehicle control. Combination treatment reduced tumour volume further by 49.0% and 35.4% as compared with 5-FU or BZD9L1 single treatments respectively. Mice treated with combined treatments also harboured tumours weighing 48.6% and 27.8% less than 5-FU or BZD9L1 respectively, and were 39.5% lower in weight than the vehicle control group. Ki67 protein expression was significantly reduced in the combined treatment group when compared with the vehicle control group as well as single treatment groups (Figure 8(f)(i–ii)). Interestingly, the percentage survival of mice in combined treatment groups was higher than that of the vehicle control and single treatment groups (Figure 8(c)). Analysis of stained tumour sections revealed that the combined treatment group had decreased incidence of necrosis as compared with the vehicle control (Figure 8(e)(i–ii)). All treatments had no significant effect on mice body weights (Figure 8(d)).
Discussions
We previously reported the cytotoxic effect of BZD9L1 on HCT 116 and HT-29 CRC cell lines through targeting SIRT1 and SIRT2 proteins. 14 In this study, the basis of dosage selection for combination treatments was determined through a selection of three dosages higher/lower than the IC50 of BZD9L1/5-FU, to determine potential effective combinations and for the calculation of the CI. The treatment doses of BZD9L1/5-FU on all cell lines – HCT 116, HT-29, LIM1215 and Caco-2 – were determined based on the respective IC50 values (Supplementary Table S1; Supplementary Figure S1(a)). To determine the combination effect with 5-FU in HCT 116, a lower dose (10 μM) and higher dose (25 μM) of BZD9L1 were selected based on previous studies. 14 The use of DMSO as a vehicle control did not affect the viability of either cell line (data not shown). Combined treatments of BZD9L1 and 5-FU yielded distinctive anti-cancer effects on CRC cell lines harbouring different mutation profiles. Results suggest that the combination of both BZD9L1 and 5-FU possess enhanced effects for the viability and survival reduction of CRC cell lines harbouring mutation of at least one cancer gene, as outlined in Supplementary Table S2 (see also Figure 1; Supplementary Figures S1 and S2). This is reflected via drug synergism and additive effects of combined treatments observed in HCT 116, HT-29 and Caco-2 cells. In contrast, microsatellite unstable LIM1215 cells which do not carry mutations of p53, kRAS, BRAF, PIK3CA and PTEN genes resulted in drug antagonism in the combined treatment group. This finding could be indicative of a positive feedback loop 26 (Supplementary Figure S1; Supplementary Table S2), and is particularly interesting as it highlights different outcomes of BZD9L1 in combination with 5-FU against colorectal cell lines with different mutation profiles. The application of combined treatments on LIM1215 and Caco-2 showed a modulation of cell viability and a reduction in cell survival via different molecular players. The reduction of LIM1215 cell viability and survival may be attributed to the different status of activated caspase 3 and cleavage of PARP. For instance, treatment with the lower dose combination induced apoptosis via the cleavage of PARP and reduced LIM1215 cell viability (Supplementary Figures S1(c) and S3(a)(i)). On the other hand, PARP and caspase 3 cleavage was induced in the higher dose combination and hampered the survival of LIM1215 cells more effectively than sole treatments (Supplementary Figures S2(b)(i, iii), S3(b)(i) and S3(b)(i)). Furthermore, the reduction of viability and survival in Caco-2 cells treated with the combination treatments may be due to a reduction of full-length PARP and Ki67 proteins, the latter being a proliferation marker (Supplementary Figures S1(d), S2(c)(i, ii), S3(b)(ii) and S3(c)(ii)). Hence, BZD9L1 in combination with 5-FU may have affected CRC cell lines differently based on the level of BZD9L1 and cell mutation profiles.
Cell cycle arrest at the S-phase in HCT 116 cells using the higher dose combination may be attributed to the sufficient inhibition of SIRT1 protein level in combination with the presence of 5-FU (Figures 2(b) and 5(b)). Different levels of SIRT1 inhibition were reported to cause apoptosis or S-phase cell cycle arrest through a subsequent increase of acetylated p53 proteins. 27 SIRT1 inhibition may restore p53-dependent S-phase arrest in the event of DNA damage.28,29 In addition, inhibition of SIRT1 by a pan-sirtuin inhibitor nicotinamide (NAM) was also reported to cripple S-phase progression as a result of telomere dysregulation. 30 Furthermore, 5-FU may cause DNA damage during the S-phase which may further contribute to cell cycle arrest. 31 As SIRT1 and SIRT2 are paramount to regulation of DNA repair, sufficient inhibition of both proteins by BZD9L1 may impede a certain degree of DNA repair and result in cell cycle arrest. 32 The degree of DNA damage will influence the activation of cell cycle arrest, whereby S-phase arrested cells or in some circumstances cells that have exited the cell cycle will undergo onset of senescence, 33 as observed in both combined treatments (Figure 2(c)).
Epithelial–mesenchymal transition (EMT) is a biological process that allows the transformation of polarized epithelial cells to assume a mesenchymal cell phenotype that can promote tumour migration and invasion.34,35 No expression or change in regulation of all studied EMT targets were observed in all treatments except the upregulation of SNAI2 gene expression in HCT 116 cells treated with combination treatments (Supplementary Figure S4). HCT 116 is a TGFBR2 mutant cell line consisting of microsatellite instability (MSI) properties. A study conducted by Pino and colleagues demonstrated that TGFBR2 genotype is a key determinant of EMT response in tumours with MSI. They showed that HCT 116 did not significantly express EMT markers such as vimentin protein expression or snail and slug gene expression in 2D cultures. 36 This may help to explain our observations.
To explore the mechanistic interactions underlying the observed synergy between BZD9L1 and 5-FU, the effect of treatments on SIRT1 and SIRT2 proteins was investigated. The different effects of BZD9L1 dose level as a single agent or in combined treatments towards SIRT1 and SIRT2 protein levels highlighted a distinct role of the compound towards SIRT protein modulation (Figure 5(b)). Interestingly, a shift in SIRT2 localization from mostly nucleus to cytoplasm in the higher dosage combination treatment may indicate a change in SIRT2 roles and functions, including the arrest of mitosis and a reduction of CRC proliferation and survival (Figure 5(a)).37–39 The shift of SIRT2 from the nucleus of HCT 116 cells post-treatment may indicate an ability of the combined treatment to induce cell cycle arrest and block unchecked cell divisions.
The effect of the combined treatments on HCT 116 spheroids was clearly shown in 3D spheroids. The combined treatment successfully reduced the viability of spheroids via induction of apoptosis, as evidenced by the presence of cleaved PARP and high red fluorescent intensity of PI (Figure 6). PI is a membrane integrity dye that exclusively permeates membrane-compromised dead cells, which gives a red fluorescence. Calcein AM is a cell viability dye that gives green fluorescence upon hydrolysis by intracellular esterases in live cells and is used as an indicator of live cells. The PI staining in the combination treatment is brighter, and calcein AM is dimmer in combination treatment compared with the vehicle control, depicting fewer live cells and more dead cells in the combination treatment (Figure 6(c)). The effect of the combined treatments in metastasis and migration inhibition were also observed via the successful reduction of spheroid migration compared with sole treatments (Figure 7). The loss of integrity in spheroids treated with BZD9L1 and in combined treatments may be attributed to cell death in spheroids post-treatment, hence causing the outer layer of spheroids to become dissociated.
In order to study the mechanism of action fundamental to the inhibition of HCT 116 by different levels of BZD9L1 (as sole treatment or in combination with 5-FU), the status of several molecular players involved in cellular stress and apoptosis was evaluated. Chk2 is an enzyme involved in determining cell cycle arrest and apoptosis upon DNA damage. 40 Activation of Chk2 through phosphorylation is negatively regulated by SIRT1 but positively regulated by 5-FU,41,42 which is apparent through lower dose combination treatment (Figure 4(c)). Chk2 is involved in the positive modulation of S-phase cell cycle arrest and cell senescence,43,44 which is in line with our observations (Figures 2(b, c) and 4(c)). The activation of apoptosis pathways in response to DNA damage involves increased levels of phosphorylated Chk2 and p53 proteins, 45 which is consistent with our findings on HCT 116 cells treated with the lower dose combination (Figures 3(a, c) and 4(c)(i, ii)). Activation and stability of p53 protein may be achieved via inhibition of SIRT1 and SIRT2 proteins, which were also reported to sensitize various types of cancer cells towards cytotoxic agents.46–48 In addition, 5-FU treatment was reported to increase p53 activation and stabilization. 49 This could explain the increase of p53 downstream target gene expressions, including BAX, BCL2 and GADD45A in the lower combination treatment, leading to increased apoptosis, and further confirms previous studies(Figures 3(a, c) and 4(a, c)).21,50 Apoptotic cell death resulting from the combination treatments is evidenced by increased pro-apoptotic gene expression, and the cleavage of both PARP and caspase 3 proteins in HCT 116 cells (Figure 4(a, b, d)).
Various studies have shown that the activation of ERK1/2 and p38 MAPK pathways could induce apoptosis in CRC.51–55 Although the mechanism of combined treatments on ERK1/2 needs to be further elucidated, the p38 MAPK pathway can be activated by TAK1 56 and GADD45A, 57 as is consistent with our findings (Figure 4(a, b, c)). Various studies reported that activation of the p38 MAPK pathway may correlate with SIRT1 activation58,59 and 5-FU treatment. 60 Conversely, apoptosis dependent on p38 MAPK activation in HeLa cells was reported via downregulation of SIRT2 proteins. 61 Consequently, the difference in activated p38 MAPK protein levels between the two combined treatments and respective single BZD9L1 treatments may be attributed to the fine-tuning of SIRT1 and SIRT2 inhibition. The eIF2α plays a critical role in regulation of cellular stress response that may lead to apoptosis.62,63 The phosphorylation of eIF2α is shown to increase through loss of SIRT1, 64 or be induced in 5-FU treatment. 62 Combined treatment of BZD9L1 and 5-FU in the lower dose combination may have induced apoptosis through an eIF2α-related pathway (Figures 3(a, c) and 4(c)(ii)).
The Akt protein is a target of SIRT1 and SIRT2, although phosphorylation levels of Akt can be caused by activation or deactivation of both SIRTs,65–68 as well as the presence of 5-FU. 69 Activated Akt proteins may play roles in promoting cell survival and inhibit apoptotic activities modulated by Bad protein. 70 The different levels of activated Akt proteins in both combination treatments, relative to BZD9L1 or 5-FU sole treatment, may be attributed to the fine-tuning of SIRT1 and SIRT2 inhibition (Figure 4(c)). Survivin is overexpressed in CRC and may hamper apoptosis through the inhibition of caspase activity. 71 Survivin is also a downstream molecule of the Akt signalling pathway that favours EMT. 72 The reduction of survivin levels observed in cells post-treatment with the higher dose combination may have resulted in further enhancement of apoptosis in the presence of increased Bad proteins (Figure 4(c)(ii)) as well as inhibition of cancer cell viability and migration (Figures 1(b) and 7(a)).
Smad2 and Smad4 are proteins in the TGF-β pathway that are involved in cell migration and invasion through activation of ERKs, JNKs and p38 kinases signalling pathways.73,74 Increased expression of phosphorylated Smad2, which may be the result of SIRT1 inhibition, 75 was found in the lower dosage combination treatment, while 25 µM BZD9L1 sole treatment and higher dosage combination marked a decrease in Smad4 protein (Figure 4(c, d)). The absence of Smad2 and downregulation of Smad4 proteins in the higher dosage combination treatment may explain the inhibition of HCT 116 cell migration and invasion (Figure 4(c, d)). The IKBα and TRAF proteins are inhibitor and activator proteins respectively that target the NF-κB signalling pathway.76,77 The regulation of the NF-κB signalling pathway related genes was previously reported as a target of both SIRT1 and SIRT2. 78 In this study, the higher dosage combination treatment successfully inhibited the NF-κB pathway via downregulation of both the TRAF2 gene, and phosphorylated and total IKBα proteins (Figure 4(b)(iv) and 4(d)). As the role of the NF-κB signalling pathway in cancer cell survival involves highly phosphorylated IKBα, 79 successful suppression of phosphorylated IKBα proteins through the higher dose combination treatment may effectively keep the survival of HCT 116 cells in check (Figures 1(c) and 4(c)(ii)).
The matrix metalloproteinases (MMPs) are key enzymes responsible for the degradation of the extracellular matrix, which may lead to tumour metastasis. 80 The upregulation of MMP9 gene expression may be caused by the activation of the WNT signalling pathway (Figure 4(e)(ii)). 81 However, the effect of WNT signalling may have been negated by pathway inhibitor protein adenomatous polyposis coli (APC), whose gene expression was increased in the higher dose combination treatment (Figure 4(e)(iv)). In contrast, phosphorylated TAK1 protein, which is an inhibitor for caspase activation that functions to block apoptotic cell death, 82 was found in all treatments. Furthermore, TGFβ-mediated TAK1 was reported to regulate MMP9 expression through NF-κB signalling. 83 As TGFβ-mediated metastasis requires the full activation of the TAK1–NF-κB–MMP9 pathway, 83 reduction of NF-κB proteins IκBα and phosphorylation in the higher dosage combination treatment may hamper migration (Figure 4(c)(ii)). The fate of cancer cells post treatment depended critically on the expression of anti- and pro-apoptotic proteins, in which a decrease of the former and an increase in the latter resulted in a better therapeutic outcome in the combination treatment group.
The combined effect of BZD9L1 and 5-FU were investigated in vivo through the HCT 116 tumour xenograft model using nude mice. Neither BZD9L1 or 5-FU single treatments at the doses used inhibited tumour growth compared with the vehicle group; however, the combination treatment successfully inhibited HCT 116 tumour growth compared with single treatments (Figure 8(a, b)). Remarkably, the survival rate of mice in the combination group was also found to be highest followed by both single treatment groups, and then the vehicle control group (Figure 8(c)), highlighting the potential of a combined BZD9L1 and 5-FU treatment regime to improve therapeutic outcome. Interestingly, a reduction in the percentage of tumour necrosis was observed in the combination treatment group as compared with the vehicle control group (Figure 8(e)). Tumour necrosis has been reported to positively associate with poor prognosis and overall survival of CRC patients.84,85 Necrotic cells may also release proinflammatory and tumour-promoting cytokines that will increase the probability of proto-oncogenic mutations or epigenetic alterations, inducing angiogenesis, cancer cell proliferation and chemoresistance.86,87 The reduction of tumour necrosis in the combination group may further highlight the therapeutic potential of this adjuvant treatment. Next, a significant reduction of the Ki67 proliferation marker was observed in tumour sections from the combination treatment as compared with single treatments (Figure 8(f)), suggesting that reduced cell proliferation could contribute to the reduction of tumour growth in the combination group compared with the vehicle control and single treatment groups in vivo. Moreover, the loss of Ki67 protein expression has also been reported to cause cell cycle arrest in tumours, 88 as also observed in vitro (Figure 2(b)). The absence of body weight change in animals from all groups suggests minimal side effects and drug toxicity of BZD9L1, 5-FU or the combination of both in all treatment groups (Figure 8(d)).
Conclusion and future perspectives
Our current findings show that BZD9L1 potentiates the antitumor effects of 5-FU via a reduction in cell viability, induction of cell cycle arrest and cellular senescence and by promoting apoptosis in CRC in vitro. The combined treatment of BZD9L1 and 5-FU inhibited tumour growth and increased the survival rate of mice in vivo, without a detectable toxic effect. This study indicates that BZD9L1 may be an excellent candidate as an adjuvant to 5-FU in improving the therapeutic efficacy for the treatment of CRC. However, deeper studies need to be carried out to study how BZD9L1 may fare as an adjunct to chemotherapy in mutation-specific models using isogenic cells. Future studies include further elucidation of cancer pathways, and the study of combined treatments on drug-resistant targets through in silico modelling. The proposed model for the combination treatments in the regulation of HCT 116 cell death are shown in Figure 9.

Supplemental Material
Figure_S1 – Supplemental material for BZD9L1 sirtuin inhibitor as a potential adjuvant for sensitization of colorectal cancer cells to 5-fluorouracil
Supplemental material, Figure_S1 for BZD9L1 sirtuin inhibitor as a potential adjuvant for sensitization of colorectal cancer cells to 5-fluorouracil by Yi Jer Tan, Yeuan Ting Lee, Sven H. Petersen, Gurjeet Kaur, Koji Kono, Soo Choon Tan, Amin M. S. Abdul Majid and Chern Ein Oon in Therapeutic Advances in Medical Oncology
Supplemental Material
Figure_S2 – Supplemental material for BZD9L1 sirtuin inhibitor as a potential adjuvant for sensitization of colorectal cancer cells to 5-fluorouracil
Supplemental material, Figure_S2 for BZD9L1 sirtuin inhibitor as a potential adjuvant for sensitization of colorectal cancer cells to 5-fluorouracil by Yi Jer Tan, Yeuan Ting Lee, Sven H. Petersen, Gurjeet Kaur, Koji Kono, Soo Choon Tan, Amin M. S. Abdul Majid and Chern Ein Oon in Therapeutic Advances in Medical Oncology
Supplemental Material
Figure_S3 – Supplemental material for BZD9L1 sirtuin inhibitor as a potential adjuvant for sensitization of colorectal cancer cells to 5-fluorouracil
Supplemental material, Figure_S3 for BZD9L1 sirtuin inhibitor as a potential adjuvant for sensitization of colorectal cancer cells to 5-fluorouracil by Yi Jer Tan, Yeuan Ting Lee, Sven H. Petersen, Gurjeet Kaur, Koji Kono, Soo Choon Tan, Amin M. S. Abdul Majid and Chern Ein Oon in Therapeutic Advances in Medical Oncology
Supplemental Material
Figure_S4 – Supplemental material for BZD9L1 sirtuin inhibitor as a potential adjuvant for sensitization of colorectal cancer cells to 5-fluorouracil
Supplemental material, Figure_S4 for BZD9L1 sirtuin inhibitor as a potential adjuvant for sensitization of colorectal cancer cells to 5-fluorouracil by Yi Jer Tan, Yeuan Ting Lee, Sven H. Petersen, Gurjeet Kaur, Koji Kono, Soo Choon Tan, Amin M. S. Abdul Majid and Chern Ein Oon in Therapeutic Advances in Medical Oncology
Supplemental Material
Figure_S5 – Supplemental material for BZD9L1 sirtuin inhibitor as a potential adjuvant for sensitization of colorectal cancer cells to 5-fluorouracil
Supplemental material, Figure_S5 for BZD9L1 sirtuin inhibitor as a potential adjuvant for sensitization of colorectal cancer cells to 5-fluorouracil by Yi Jer Tan, Yeuan Ting Lee, Sven H. Petersen, Gurjeet Kaur, Koji Kono, Soo Choon Tan, Amin M. S. Abdul Majid and Chern Ein Oon in Therapeutic Advances in Medical Oncology
Supplemental Material
Supplementary_Table_S1_1 – Supplemental material for BZD9L1 sirtuin inhibitor as a potential adjuvant for sensitization of colorectal cancer cells to 5-fluorouracil
Supplemental material, Supplementary_Table_S1_1 for BZD9L1 sirtuin inhibitor as a potential adjuvant for sensitization of colorectal cancer cells to 5-fluorouracil by Yi Jer Tan, Yeuan Ting Lee, Sven H. Petersen, Gurjeet Kaur, Koji Kono, Soo Choon Tan, Amin M. S. Abdul Majid and Chern Ein Oon in Therapeutic Advances in Medical Oncology
Footnotes
Acknowledgements
The authors would like to thank Dr Sy Bing Choi from the Malaysian Institute of Pharmaceuticals and Nutraceuticals (IPharm) for access to the Tecan Infinite M200 microplate reader and ChemiDoc XRS+ imager. The authors would also like to acknowledge Chris Malajczuk from the Biomolecular Modelling Group in the School of Pharmacy and Biomedical Sciences at Curtin University, Australia for proofreading the manuscript.
Funding
The authors disclosed receipt of the following financial support for the research, authorship and/or publication of this article: This work was supported by the EScience Fund (Ministry of Energy, Science, Technology, Environment & Climate Change, MESTECC) (grant no. 305/CIPPM/613620) and MAKNA Cancer Research Award (grant no. 304/CIPPM/650859/M122).
Conflict of interest statement
The authors declare that there is no conflict of interest.
Supplemental material
Supplemental material for this article is available online.
References
Supplementary Material
Please find the following supplemental material available below.
For Open Access articles published under a Creative Commons License, all supplemental material carries the same license as the article it is associated with.
For non-Open Access articles published, all supplemental material carries a non-exclusive license, and permission requests for re-use of supplemental material or any part of supplemental material shall be sent directly to the copyright owner as specified in the copyright notice associated with the article.