
Abstract
Background:
Since tumor cells may escape from immune surveillance through the programmed cell death 1 (PD-1)/programmed death ligand (PD-L)1 axis, this study was designed in order to evaluate whether there is a correlation between the levels of PD-1+ and PD-L1+-expressing immune cells (ICs) and circulating tumor cells (CTCs) in patients with non-small cell lung cancer (NSCLC).
Patients and methods:
Peripheral blood was obtained from 37 chemotherapy-naïve patients with metastatic NSCLC before treatment. PD-1 and PD-L1 expression was evaluated (1) on ICs with anti-tumor function (CD4+ and CD8+ T-cells, B-cells, monocytes/dendritic cells) using flow cytometry, (2) on CTCs by immunofluorescence and (3) on cells from tumor tissues by immunohistochemistry. The levels of PD-1+ and PD-L1+-expressing ICs were correlated with progression-free survival (PFS).
Results:
The presence of PD-1+ CD8+ cells, with reduced interferon (IFN)-γ expression, but not other ICs, were positively correlated with PD-L1+ CTCs (p < 0.04). Increased percentages of PD-1+ CD8+ T-cells, were associated with a worse response to treatment (p = 0.032) and shorter PFS (p = 0.023) which, in multivariate analysis, was revealed as an independent predictor for decreased PFS [hazard ratio (HR): 4.1, p = 0.0007].
Conclusion:
The results of the current study, for first time, provide evidence for a possible interaction between ICs and CTCs in NSCLC patients via the PD-1/PD-L1 axis and strongly support that the levels of PD-1+ CD8+ in these patients may be of clinical relevance.
Introduction
The immune system exerts a protective role against cancer, mainly via the capacity of the CD8+ cytotoxic T lymphocytes to recognize and kill cancer cells. 1 However, cancer cells often develop mechanisms to escape the immune surveillance leading, thus, to the development of metastases. 2 One of the escape mechanisms is the activation of the programmed cell death-1 (PD-1) receptor, an inhibitory immune checkpoint, mostly expressed on the surface of T-cells. The engagement between the PD-1 receptor and its ligands, PD-L1 or PD-L2, 3 results in the suppression of effector cell function via the induction of anergy, apoptosis, inhibition of their proliferation and secretion of inflammatory cytokines such as interferon gamma (IFN-γ), interleukin (IL)-4 and IL-2. 4 PD-1 and PD-L1 are typically expressed on both activated and exhausted immune cells (ICs) and are upregulated under the influence of IFN-γ. 5
One of the mechanisms that cancer cells use to escape immune surveillance is the activation of the PD-1/PD-L1 pathway.6,7 High expression of PD-L1 on tumor cells or on tumor-infiltrating immune cells (TILs) has been associated with a worse prognosis and has been proposed as a potential biomarker for the response to PD-1/PD-L1 inhibitors.8–10 Nevertheless, the role of PD-1 and PD-L1 expression on peripheral blood immune cells (ICs) from patients with non-small cell lung cancer (NSCLC) has not been sufficiently studied.
The treatment of patients with different tumor types with antibodies targeting either PD-1 or PD-L1 resulted in impressive clinical efficacy and, thus, has emerged as a new therapeutic modality.9,11 Indeed, phase III studies have clearly demonstrated that these antibodies induce objective clinical responses (RRs) and prolong overall survival (OS) in pretreated patients with advanced melanoma,12–14 NSCLC,8,15,16 head and neck cancer (SCCHN), renal and urothelial carcinomas. 17 In these studies, the tumoral expression of PD-L1 was investigated as a potential predictive biomarker; however, the results were not conclusive. There are some studies showing effectiveness of immune checkpoint inhibitors regardless of the PD-L1 expression on tumor cells, 16 while other demonstrated its predictive value. 18
Circulating tumor cells (CTCs) have been proposed as a ‘liquid biopsy’ allowing the assessment of tumor changes over time. 19 CTCs have been identified in several tumor types.20–22 In NSCLC, the presence of CTCs has been associated with a poor clinical outcome.23,24 Recent studies have shown a high expression of PD-L1 on the surface of CTCs in patients with oral squamous cell carcinoma, 25 colorectal cancer (CRC), 26 prostate cancer, 27 breast cancer 28 and NSCLC.29,30 Moreover, nuclear PD-L1 expression in CTCs from patients with CRC and prostate cancer was correlated with shorter OS. 26 We have recently reported that both PD-1 and PD-L1 molecules are expressed in newly diagnosed chemotherapy-naïve patients with NSCLC, suggesting a potential crosstalk between ICs and CTCs in the blood stream. 31
The present study evaluated the expression of PD-1 and PD-L1 on circulating effector ICs and CTCs, the association between the expression of PD-1+ and PD-L1+ on CTCs, on tumor cells and ICs as a possible mechanism of CTC escape from immune system surveillance and, finally, their possible clinical relevance in patients with NSCLC.
Materials and methods
Patients
A total of 37, treatment-naïve patients, with histologically documented, EGFR wild
20 ml of peripheral blood was collected in K2 ethylenediaminetetraacetic acid (EDTA; BD Biosciences, Germany) at the time of diagnosis and before the administration of any treatment. The study complied with the Ethical Principles for Medical Research Involving Human Subjects according to the World Medical Association Declaration of Helsinki and was approved by the local ethics and scientific committees of the University Hospital of Heraklion, Greece (No.20068–30/1/2015). All patients provided written informed consent in order to participate in the study.
Flow cytometry for immunophenotypic analysis and enumeration of ICs
Blood samples (10 ml) underwent red blood cell lysis using red blood cell lysing buffer according to the manufacturer instructions (BD Biosciences, Heidelberg, Germany). Freshly isolated white blood cells were stained for expression of surface markers using the following anti-human fluorochrome-conjugated monoclonal antibodies: anti-PD-1 BV605, anti-PD-L1 BV655 and (1) for dendritic cells (DCs)/monocytes: anti-CD14 PE Cy7; anti-HLA-DR APC-H7; anti-Lin (CD3/CD56/CD19) PE, (2) T-cells: anti-CD3 PE-CF594; anti-CD4 V500; anti-CD8 APC-Cy7; anti-CD45RO Alexa700; anti-CCR7 PE; anti-CD127 Pacific Blue (3) B-cells: anti-CD19-V450; anti-CD3 PE-CF594 (all antibodies were purchased from Biolegend, San Diego, CA, USA). Staining was performed for 30 min on ice in the dark. For IFN-γ intracellular staining, the cells were fixed and permeabilized using the fixation/permeabilization solution kit (BD Biosciences, Heidelberg, Germany) according to the manufacturer’s instructions and stained for 1 h on ice in the dark. After washing, cells were resuspended in 0.5 ml fluorescence-activated cell sorter (FACS) buffer. Acquisition and multicolor analysis were performed using FACS Diva software on a BD LSR II flow cytometer (BD Biosciences, Heidelberg, Germany). For T-cell subsets and B-cells, the analysis gates were restricted to the lymphocytic population, whereas for DC/monocyte analysis, gates were restricted to the monocytic population. Each measurement contained 106 single events. Unstained cells were used as negative control in order to set the gates. The gating strategy for each IC is shown in Suppl. Figure 3. The expression levels of IFN-γ and PD-1 are reported as ΔMFI (median fluorescence intensity of the specific antibody minus the corresponding median fluorescence intensity of the negative control).
Immunohistochemistry and scoring
The 4-μm sections from NSCLC biopsy samples were stained using the VENTANA PD-L1 (SP142 clone) assay (Roche Diagnostics, Basel, Switzerland), OptiView DAB IHC Detection (Roche Diagnostics, Basel, Switzerland) and OptiView Amplification Kit (Roche Diagnostics, Basel, Switzerland) on a Ventana BenchMark ULTRA instrument (Roche Diagnostics, Basel, Switzerland). In addition, a primary antibody against CD8 was used followed by the horseradish peroxidase (HRP) system to detect signal. The 4-μm thick tissue sections from prequalified benign tonsil tissue were used as positive control for both markers. The percentage of PD-L1+ tumor cells was scored using the proposed VENTANA PD-L1 assay scoring algorithm. Tumor area was defined as the area occupied by viable tumor cells, and their associated intra- and contiguous peritumoral stroma, excluding necrotic tumor. Sections containing at least 100 viable tumor cells with associated stroma were evaluable for PD-L1 expression. Epithelial cells were evaluated as the proportion of viable tumor cells showing PD-L1 membrane staining of any intensity. PD-L1 positivity was defined as >1% cells with membranous staining. Positive and negative controls were included in every experiment for better evaluation of the staining. In this study the SP142 clone (Ventana assay) was used in accordance to two big clinical studies (Poplar and Oak) and it was also proposed as a companion diagnostic test by Roche at the time point this study was conducted.
Isolation and detection of CTCs
Blood samples (10 ml) were diluted 1:10 in an erythrocyte lysis buffer [Isolation by Size of Epithelial Tumor (ISET)] for 10 min at room temperature and filtered on the ISET device (RareCells Diagnostics, Paris, France). Next, the membranes were washed with phosphate-buffered saline (PBS)and permeabilized with 2% Triton X100/PBS (Sigma, Germany) for 10 min and incubated in blocking solution [10% fetal bovine serum (FBS) in PBS] for 30 min. For PD-1 detection, the spots were incubated with anti-cytokeratin antibodies (A45-B/B3, 1:70; Micromet Munich, Germany, and CK-7, 1:70; Abcam, Cambridge, UK), followed by anti-mouse Alexa 555 (1:500; Invitrogen, Carlsbad, USA) secondary antibody; after three washes with PBS, spots were incubated with anti- PD-1-FITC (1:20; Biolegend, San Diego, CA, USA) and anti-CD45 Alexa 637 (1:70; Santa Cruz Biotechnology Inc., CA, USA) for 1 h in the dark.
To stain for PD-L1, the spots were incubated with anti-cytokeratin antibodies (as above) conjugated with fluorescein isothiocyanate (FITC) using Zenon technology (Molecular Probes, Massachusetts, USA). After three washes with PBS, spots were incubated with anti- PD-L1 (1:200; Biolegend, San Diego, CA, USA) followed by anti-mouse Alexa 555 (1:500; Invitrogen, Carlsbad, USA) secondary antibody; subsequently, anti-CD45 Alexa 637 (1:70; Santa CruzBiotechnology Inc., CA, USA) was added for 1 h in the dark followed by 4′,6-diamidino-2-phenylindole (DAPI) staining. Stained nucleated cells were analyzed using the automated Ariol microscopy system (Genetix Group, Ltd., New Milton, UK).
Statistical analysis
Because of the observational nature of the study and the lack of data regarding the correlation of CTCs and the number of ICs, no sample size estimation could be calculated in the current study. Statistical analysis was performed using GraphPad Prism version 6.0 (GraphPad Institute Inc., San Diego, CA, USA). Data are presented as mean ± standard error of the mean. Differences between groups were determined using the nonparametric Mann–Whitney U test, Wilcoxon matched-pairs signed rank test and Freidman test with Dunn’s multiple comparison test correction, as stated. Spearman’s rank correlation tests were used to assess the relationships between the levels of CTCs and tested IC types. For PFS and OS analysis, IC percentages were divided into low and high using the mean value of all patients in corresponding cell type. Median OS and PFS were estimated using the Kaplan–Meier method with groups compared using the log-rank test. OS was defined as the time from the study enrolment to death. PFS was defined as the time between the enrolment and the date of first observation of clinical progression or death. Univariate and multivariate Cox regression hazards models were performed using the SPSS Statistics 23 software (SPSS Inc., Armonk, NY, USA). Differences and associations were considered significant when p < 0.05. All p values were two sided.
Results
Patient demographics
Patient demographics are presented in Table 1. The median age was 68 years, 89.2% were men, 85% had an Eastern Cooperative Oncology Group performance status of 0–1, 54.1% had an adenocarcinoma, 62.2% had M1b stage IV disease and 4 (12.1%) were never smokers. All patients but 6, (16.2%) who refused any treatment, received 4–6 cycles of first-line chemotherapy (pemetrexed/carboplatin: n = 4 pts; pemetrexed/cisplatin: n = 5 pts; paclitaxel/carboplatin: n = 17 pts; gemcitabine/carboplatin: n = 3 pts; cisplatin/docetaxel: n = 1 pt and docetaxel: n = 1 pt) and 31 (83.8%) of them were assessed for clinical outcome.
Patient demographics.

N, number of patients; NE, nonevaluated; PD, progressive disease; PR, partial response; SD, stable disease.
PD-1 and PD-L1 effector ICs in the peripheral blood of NSCLC patients
Figure 1 indicates that, before treatment initiation, CD4+ and CD8+ T-cells expressed PD-1 and PD-L1 on their surface. In addition, DCs/monocytes and B-cells also expressed the PD-1 and PD-L1 molecules on their surface, though at lower levels compared with the other tested effector cells [Figure 1(a)]. There was not any correlation between the histological subtype and the expression of PD-1 and PD-L1 on effector cells, apart from the CD4+ PD-L1+ T-cells (Suppl. Table 1).
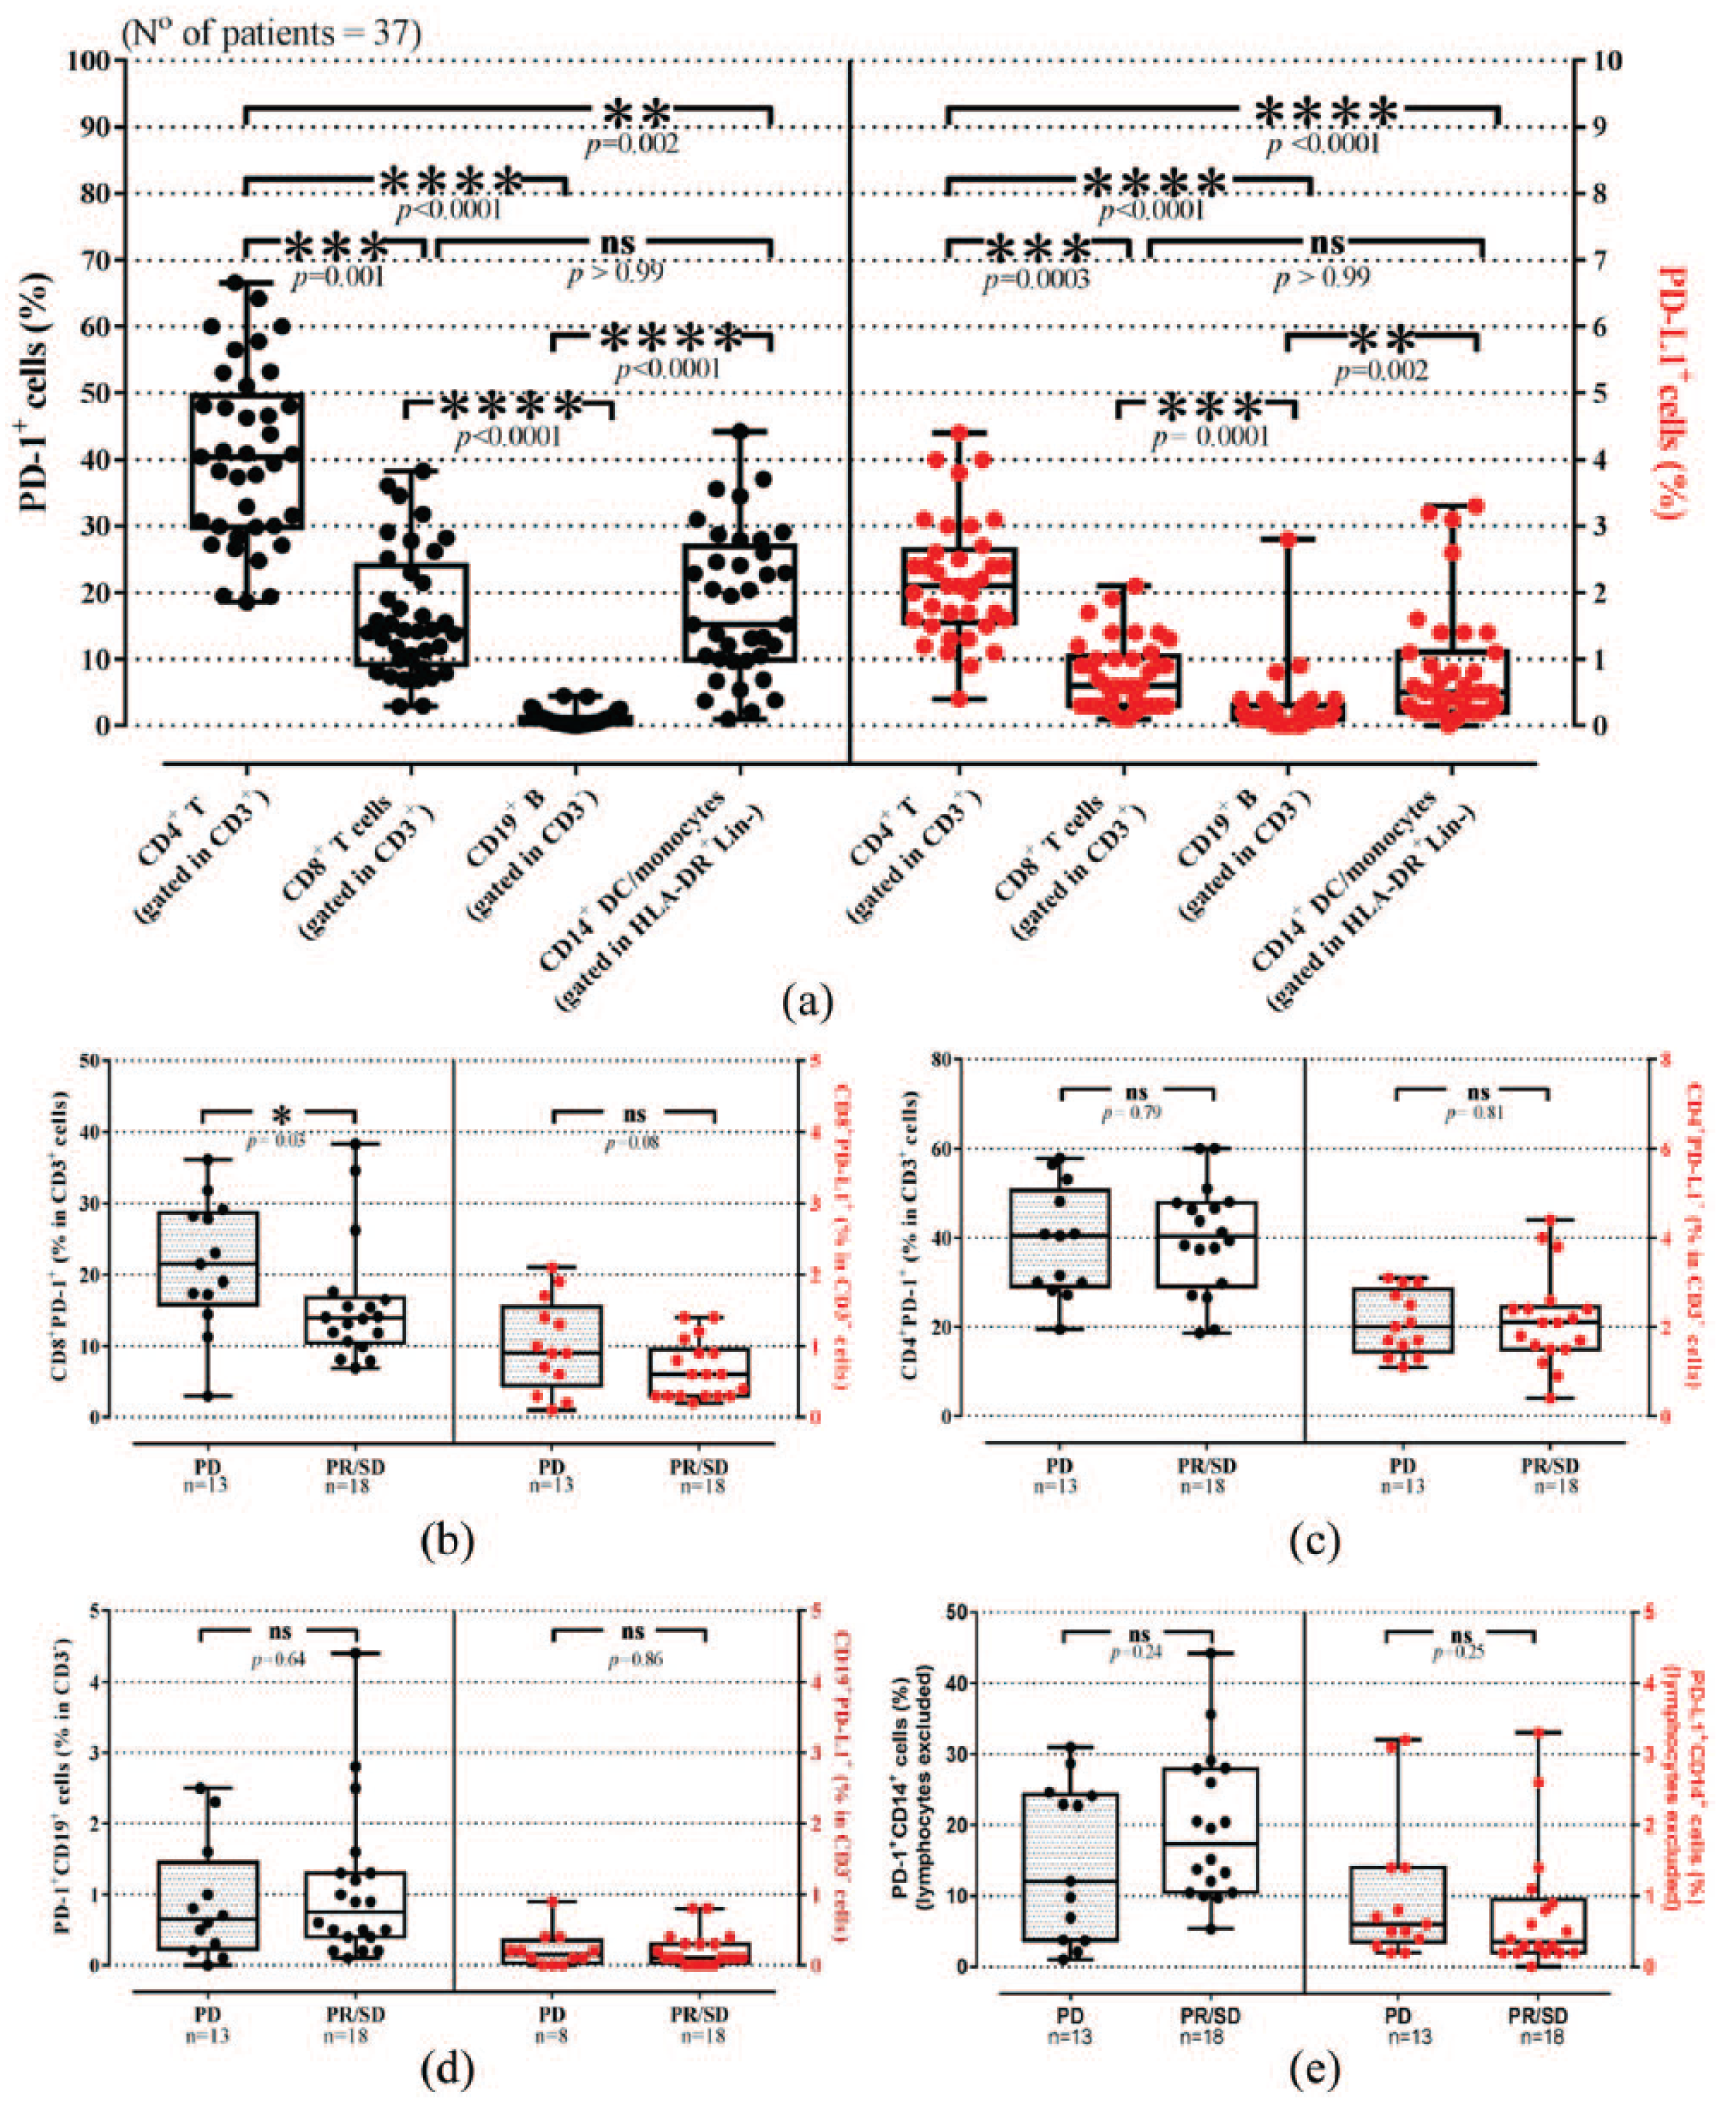
Baseline percentages of PD-1+ and PD-L1+ effector immune cells and their correlation with response to 1st line treatment in patients with NSCLC. The percentages of (a) PD-1+ and PD-L1+ CD4+ T-cells were higher compared with all tested effector cells, (b) the percentages of PD-1+ CD8+ T-cells were increased in patients with disease progression (PD; dotted boxes) compared with those with disease control (open boxes) after three cycles of first-line chemotherapy, whereas CD8+ PD-L1+ T-cells were not associated with response to treatment, (c) PD-1+ or PD-L1+ CD4+ T-cells, (d) PD-1+ or PD-L1+ B-cells and (e) PD-1+ or PD-L1+ DC/monocytes were not associated with response to treatment after three cycles of first-line chemotherapy. Each point corresponds to an individual patient (black circles = PD-1, red circles = PD-L1, dotted boxes = patients with PD, open boxes = patients with SD/PR). The medians, 75 percentile (box), and max and min (whiskers) are represented. Percentages of cells were compared by non-parametric Friedman test with Dunn’s multiple comparison test corrections. Patient groups were compared by Mann–Whitney U test. The phenotype of each cell type is presented in the x axis. (Lin−:CD3−CD19−CD56−).
PD-1+ and PD-L1+ expression on primary and circulating tumor cells in correlation with the percentages of distinct peripheral blood ICs
Immunohistochemical staining for PD-L1 was performed in 10 available patients’ primary tumors and revealed PD-L1 expression on the cancer cells [Suppl. Figure1(a); blue arrow]. Using a cut-off of 1% membranous staining, 40% of patients had PD-L1+ tumor cells. CD8+ T-cells were identified in close proximity to PD-L1+ tumor cells [Suppl. Figure 1(a); black arrow]. Moreover, the number of PD-L1+ tumor cells was found to be inversely correlated with the percentage of circulating CD4+ and CD4+PD-1+ T-cells (r2 = −0.514; p = 0.012). On the contrary, no correlation was observed between the PD-L1+ tumor cells and the percentage of circulating CD8+PD-1+ T-cells (r2 = −0.032; p = 0.58).
CTCs were detected in 16 (53%) out of 30 tested patients available for CTC evaluation, with a median number of 1 CTC/ml of blood (range, 0–25). PD-L1 expression was also investigated on CTCs [Suppl. Figure1(b)]. PD-L1-expressing CTCs, at baseline, were detected in 7 (24%) patients. PD-L1+ CTCs could be detected both in patients with PD-L1+ (33.3%) and PD-L1− (28.6%) tumors (Suppl. Table 2).
The number of CTCs, regardless of PD-1 and PD-L1 expression, was found to be inversely correlated with the percentage of CD4+ PD-L1+ T-cells (r2 = −0.351; p = 0.033), whereas they were positively correlated with the levels of CD8+ and CD8+ PD-1+ T-cells (r2 = 0.459; p = 0.004 and r2 = 0.461; p = 0.004, respectively). The number of PD-1-expressing CTCs was significantly correlated with CD8+ and CD8+ PD-1+ T-cells (r2 = 0.431, p = 0.017 and r2 = 0.410, p = 0.025, respectively). In addition, PD-L1-expressing CTCs were found to be associated with CD8+ PD-1+ T-cells (r2 = 0.380, p = 0.02) and inversely correlated with CD4+ and CD4+PD-L1+ T-cells (r2 = −0.329, p = 0.047 and r2 = 0.375, p = 0.022, respectively). There was no correlation between the number of CTC and the percentages of B-cells and DC/monocytes, expressing or not, the PD-1 or PD-L1 molecules (Table 2).
Correlation of CTCs with different subpopulations of immune cells in respect to PD-1 or PD-L1 expression.

CTC, circulating tumor cell; DC, dendritic cell; PD-1, programmed cell death receptor 1; PD-L1, programmed death ligand 1.
Correlation of peripheral blood CD8+ PD-1+cells with patient clinical outcome
Patients with progressive disease (PD) upon first-line chemotherapy had significantly increased percentages of PD-1+ CD8+ T-cells (21.52 ± 2.5%) at baseline compared with nonprogressors [(15.9 ± 2.0%, p = 0.03; Figure 1(b)]. Conversely, none of the other tested PD-1-expressing IC was associated with response to treatment. Similarly, no correlation was observed between PD-L1-expressing ICs and response to treatment [Figure 1(c–e)].
Based on the frequencies of the ICs, patients were dichotomized into those with high and low IC frequencies using the patients’ mean value of the corresponding cell population as the cut-off level, in order to group patients with the two possible extreme values. Low levels of CD8+PD-1+ T-cells, at baseline, were associated with longer PFS compared with high levels (4.8 versus 2.8 months, respectively; p = 0.02). Moreover, high levels of DCs/monocytes were associated with marginally significantly longer PFS (4.4 months versus 3.3 months, p = 0.05) and significant OS (10.4 months versus 5.3 months, p = 0.04) compared with low levels. There was no any correlation between the other evaluated ICs and the PFS and OS (Table 3, Suppl. Table 3).
Association of immune cells and clinical outcome of treatment-naïve patients with NSCLC.
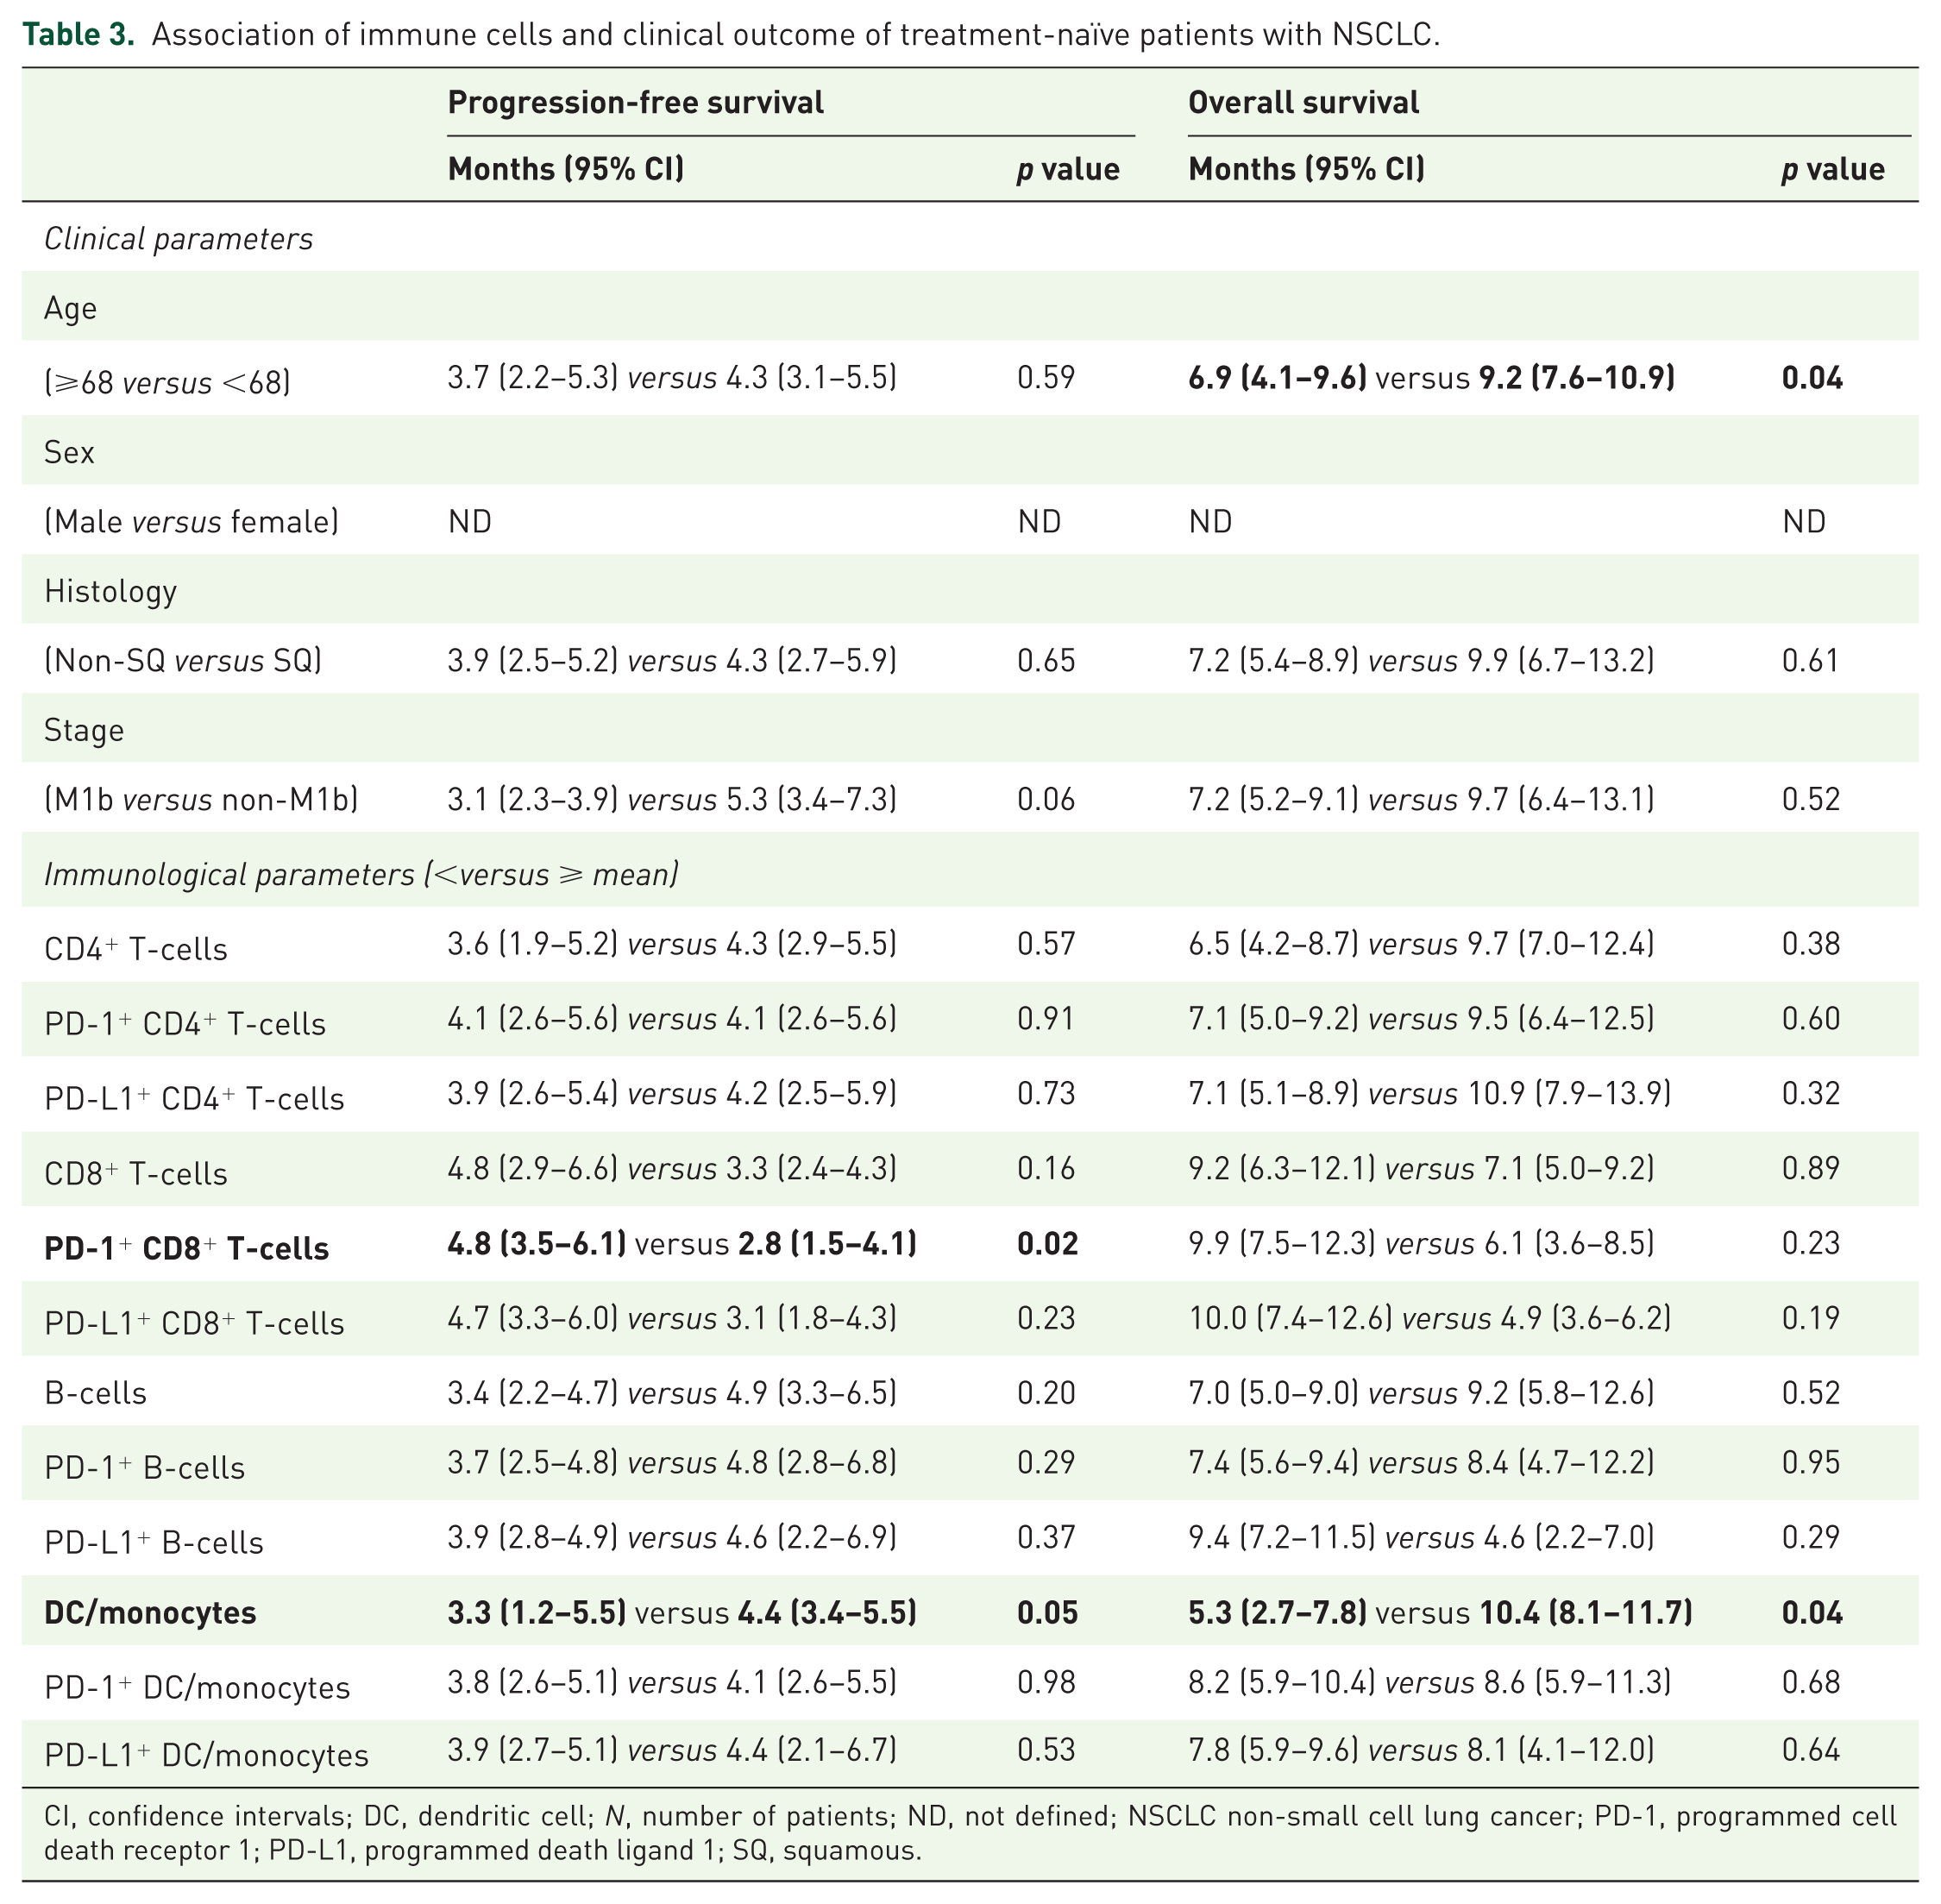
CI, confidence intervals; DC, dendritic cell; N, number of patients; ND, not defined; NSCLC non-small cell lung cancer; PD-1, programmed cell death receptor 1; PD-L1, programmed death ligand 1; SQ, squamous.
Univariate analysis revealed that both high percentages of CD8+ PD-1+ T-cells [hazard ratio (HR) = 2.1, p = 0.034] and M1b (HR = 2.3, p = 0.049) were significantly correlated with decreased PFS. Moreover, decreased OS was significantly associated with age (HR = 3.6, p = 0.049) and low percentages of DCs/monocytes (HR = 2.9, p = 0.047; Table 4). In addition, the multivariate analysis showed that M1b versus M1a and increased percentages of CD8+ PD-1+ T-cells were independent prognostic factors for decreased PFS (HR = 3.8, p = 0.012; HR = 3.7, p = 0.009, respectively), while increased age was the only independent prognostic factor associated with decreased OS (HR = 0.281, p = 0.049; Table 4).
Univariate and multivariate analysis of PFS and median OS for patients with untreated NSCLC.
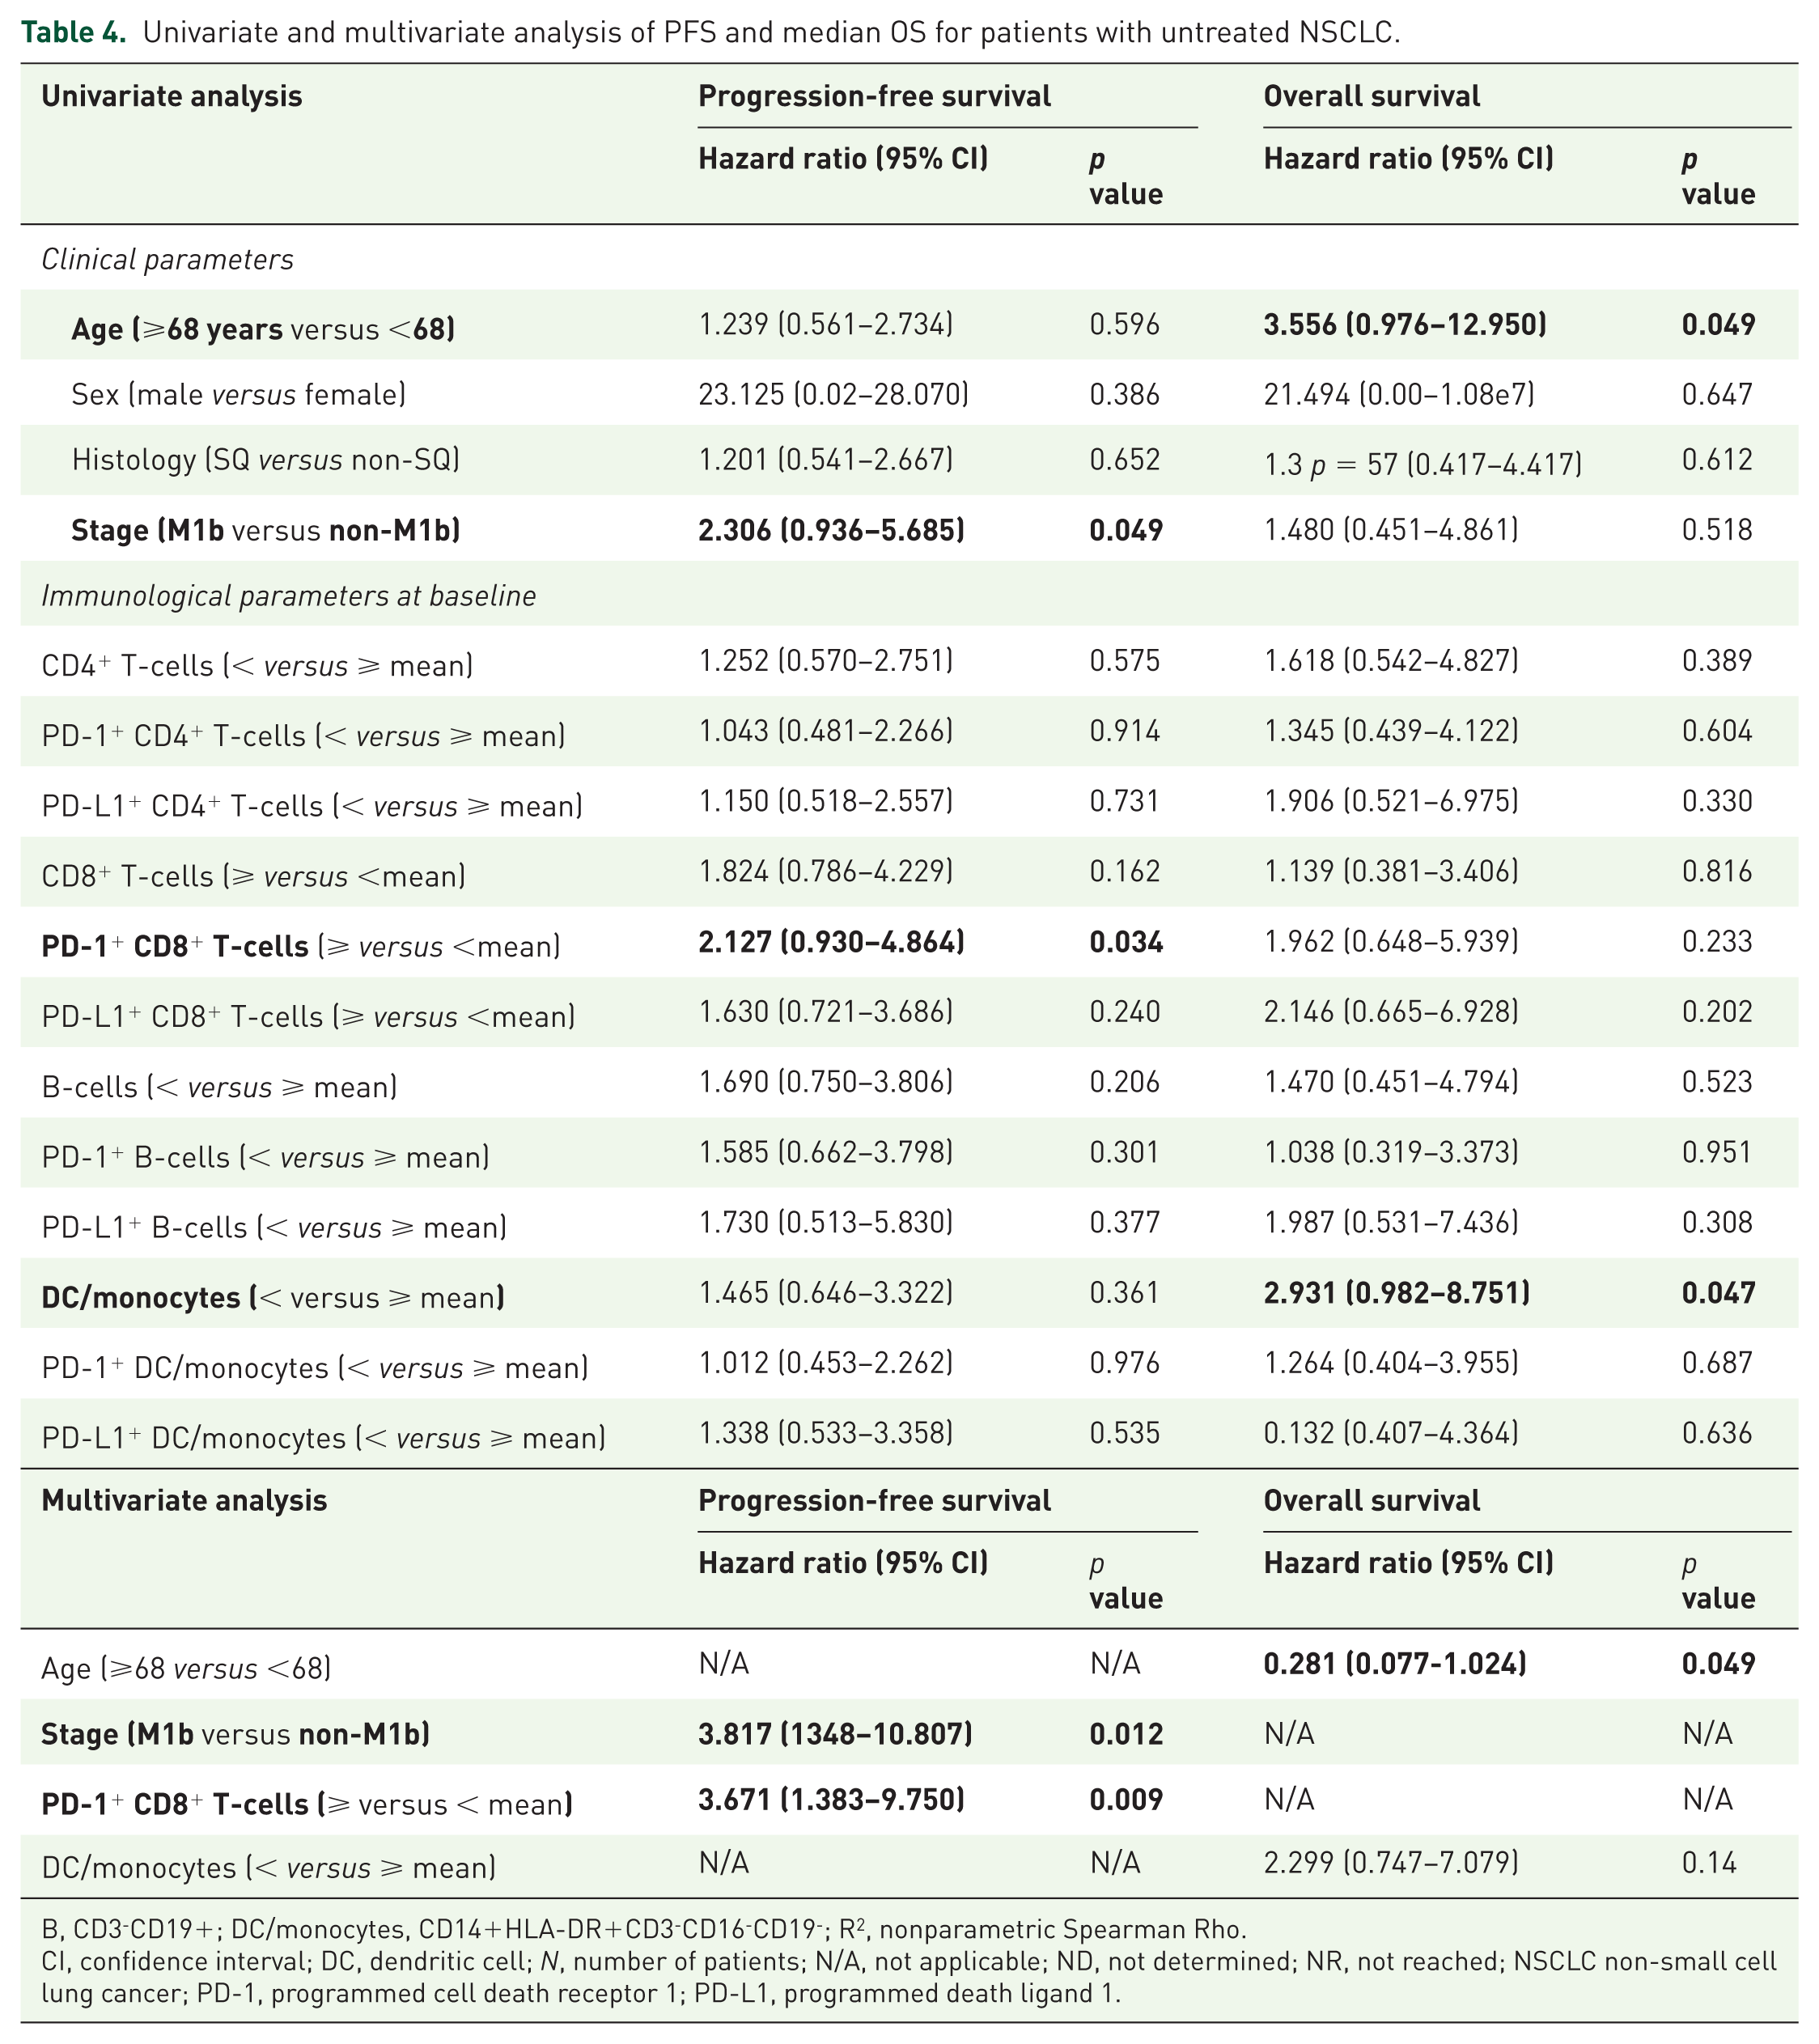
B, CD3−CD19+; DC/monocytes, CD14+HLA-DR+CD3−CD16−CD19−; R2, nonparametric Spearman Rho.
CI, confidence interval; DC, dendritic cell; N, number of patients; N/A, not applicable; ND, not determined; NR, not reached; NSCLC non-small cell lung cancer; PD-1, programmed cell death receptor 1; PD-L1, programmed death ligand 1.
IFN-γ production by PD-1+ and PD-1− CD8+peripheral blood T-cells
Since PD-L1 is expressed on CTCs and CD8+ PD-1+ cells were associated with shorter PFS, the functionality of these cells was assessed by determining intracellular IFN-γ production using flow cytometry (Suppl. Figure 2). Although the percentage of CD8+ IFN-γ+ T-cells was not significantly different between PD-1+ and PD-1− cells, the expression levels of IFN-γ, as determined by mean fluorescence intensity (MFI), was higher in PD-1− CD8+ T-cells (188.0 ± 49.2) compared with PD-1+ CD8+ T-cells [106.4 ± 56.2; p = 0.04; Figure 2(a)]. Further analysis of the composition of PD-1+ CD8+ T-cell subsets, revealed that the effector (CD45RO−CCR7−CD127+; 37.5 ± 2.5%) T-cell was the most prevalent subset compared with effector/memory (CD45RO+CCR7−CD127+; 5.6 ± 0.9%) and central memory (CD45RO+CCR7+CD127+; 0.8 ± 0.1%) subsets [Figure 2(b)] suggesting that PD-1 expression corresponds to effector T-cells with reduced functional capabilities.

(a) Percentages (black dot) and intracellular levels (red dot) of IFN-γ in PD-1+ (dotted boxes) or PD-1− (open boxes) CD8+ T-cells of patients with NSCLC. (b) Percentages of T-cell subsets within the CD8+PD-1+ T-cells. (c) Percentages (black dot) and intracellular levels (red dot) of PD-1 in IFN-γ+ (dotted boxes) or IFN-γ− (open boxes) CD8+ T-cells of patients with NSCLC. The expression levels are the ΔMFI. The medians, 75 percentile (box), and 10–90 percentiles (whiskers-dot) are represented. Groups were compared by the Wilcoxon matched-paired signed rank test.
The analysis of the percentages and expression of the PD-1 molecule in effector (IFN-γ+) and anergic (IFN-γ−) CD8+ T-cells was performed, indicating [Figure 2(c)] that although similar percentages of PD-1+ cells were observed between effector and anergic CD8+ T-cells, IFN-γ− T-cells had higher PD-1 expression (MFI: 400.8 ± 65.6) compared with IFN-γ+ T-cells (MFI: 197.2 ± 56.6, p = 0.02).
Clinical outcome according to the presence of PD-L1+ CTCs
Patients harvesting >1 PD-L1+ CTCs (n = 7) had a significantly shorter PFS compared with patients without PD-L1+ CTCs [n = 27; 2.70 versus 4.38 months respectively; HR = 2.71, p = 0.036; Figure 3(a)]. There was no significant difference in terms of OS among the two groups of patients. No correlation was observed between the PD-L1-expressing primary tumors and PFS (data not shown).

Prognostic significance of PD-L1+ CTCs and CD8+ PD-1+/PD-L1+ CTCs in patients with NSCLC.
Since PD-L1-expressing CTCs were found to be associated with CD8+ PD-1+ T-cells, patients were further divided into two groups; group A who had high CD8+ PD-1+ T-cell frequencies (above mean value) and CTC-expressing PD-L1, and group B who had low CD8+ PD-1+ T-cell frequencies (below mean value) and CTC without PD-L1 expression at baseline. Patients in group A were associated with a significant shorter PFS compared with patients in group B [1.91 versus 5.53 months, respectively; HR = 5.26, p = 0.007; Figure 3(b)]. No correlation was observed between the PD-L1-expressing primary tumors with high levels of CD8+ PD-1+ T-cells and PFS (data not shown).
Discussion
The present study evaluated the expression of PD-1 and PD-L1 on effector ICs and their association with the CTCs isolated from the peripheral blood of newly diagnosed and untreated patients with NSCLC. The results demonstrate an association of CD8+ PD-1+ T-cells with the PD-L1+ CTCs; indeed, there was a positive correlation between the CTCs and CD8+ T-cells. This finding is reported for the first time in the literature and provides strong evidence of immune surveillance of circulating tumor cells. In particular, it was shown that the presence of PD-L1+ CTCs was correlated with increased frequencies of CD8+ PD-1+ in treatment-naïve patients, suggesting a possible mechanism for the evasion of CTCs from immune surveillance. This evasion mechanism could be attributed, at least partially, to CD8+ T-cell exhaustion since these effector CD8+ PD-1+ T-cells have an exhausted/anergic phenotype, based on their low IFN-γ expression. Studies have already shown that PD-1 expression is present on exhausted T-cells with effector phenotype characterized by reduced, both, proliferation and cytokine-producing function. 34 It should also be noted that immunostaining of tumor samples revealed the presence of CD8+ TILs within tumor cells and most importantly, they were in close proximity to PD-L1+ cancer cells. This finding supports the hypothesis of existence of immune response against tumor cells, as well as a possible mechanism by which these cells suppress immune stimulation via the PD-L1/PD-1 pathway. Thus, based on these observations it is reasonable to hypothesize that CTCs use this mechanism in order to escape the immune surveillance and promote the metastasis which could be, probably, abrogated by anti-PD-1 antibodies.
Recently, anti-PD-1/PD-L1 therapies have demonstrated a greater benefit in patients with PD-L1+ tumors.8,15,35 PD-1 is a major negative immune mediator contributing to immunosuppression when interacts with its ligand, PD-L1, on tumor cells and antigen-presenting cells. 36 The current study demonstrated that several subtypes of ICs, from chemotherapy-naïve patients with NSCLC, expressed on their surface both PD-1 and PD-L1. Moreover, it was observed that the baseline percentages of CD8+ PD-1+ in patients who experienced disease progression upon front-line chemotherapy were increased compared with the percentages observed in nonprogressors. This could be related to the fact that these effector CD8+ PD-1+ have an exhausted/anergic phenotype, as mentioned above. Therefore, it is reasonable to hypothesize that the immune suppression and evasion of tumor cells due to the high percentage of CD8+ PD-1+ cells might contribute to the poor clinical outcome of patients treated with front-line chemotherapy. In addition, the multivariate analysis revealed that the high percentages of CD8+ PD-1+ before initiation of any systemic treatment were associated with a shorter PFS; although this finding should be interpreted with caution taking into account the low number of patients enrolled in this study, this observation seems to indicate that baseline levels of CD8+ PD-1+ cells could represent an independent prognostic factor for PFS in patients with stage IV NSCLC.
These results are in accordance with those observed in hepatocellular cancer, where the increased circulating CD8+ PD-1+ T-cells could predict shorter PFS. 37 Despite the fact that our findings have to be validated in an larger independent cohort of patients, taken together with those of the literature support the hypothesis that circulating CD8+ PD-1+ T-cells could be used as a surrogate marker for selecting patients who will more likely respond to anti-PD-1 immunotherapy or even immuno-chemotherapy; whether a such front-line therapeutic approach represents a more appropriate option remains to be tested in a prospective well-controlled clinical trial. Furthermore, it is possible that treatment of the patients harboring CD8+PD-1+ T-cells with anti-PD-1 or anti-PD-L1 therapies after the relapse to first-line chemotherapy, could improve their outcome. However, this notion remains to be improved in future studies.
The difficulty in obtaining re-biopsies of the primary tumor or metastatic lesions in patients with NSCLC is well known.38,39 It has been suggested that CTCs, in the peripheral blood of patients with cancer, contribute to the metastatic procedure in both late and early phase of the disease.40–42 Therefore, CTCs have been proposed as an interesting tool to evaluate the expression of PD-1 and PD-L1. The current study also confirmed previous studies demonstrating that CTCs express PD-1 and PD-L1.29,30 However, analyzing a small number of patients with available primary tumor material, there was no clear correlation between the expression of PD-L1 on primary tumor cells and the CTCs. The well-known tumor heterogeneity of NSCLC could be a possible explanation for this finding. In contrast to primary tumor, we found a positive correlation between PD-L1-expressing CTCs and CD8+ PD-1+ T-cells (r2 = 0.380, p = 0.02). More interestingly, the patients who had both high levels of CD8+ PD-1+ T-cells and CTC-expressing PD-L1 had a further significantly shorter PFS compared with patients with low levels of CD8+ PD-1+ T-cells and CTC not expressing PD-L1. A larger study in patients treated with immunotherapy is needed in order to evaluate the presence of PD-L1+ CTCs as an alternative source of biological material in order to assess the expression of PD-1 and PD-L1.
In conclusion, the current study indicated that high percentages of circulating CD8+ PD-1+ are associated with the presence of PD-L1+ CTCs, as well as that both could emerge as potential prognostic factors for patients with un-treated NSCLC. However due to the pilot nature of our study and the small number of patients, further studies in a larger cohort will be performed in the future to confirm the clinical findings of these results. Since the patients harboring PD-1+CD8+ T-cells in their blood revealed shorter PFS, it is possible that treatment of these patients with an anti-PD-1 or PD-L1 therapies after first-line relapse could improve their outcome. Therefore, future studies in a larger group of patients would help to confirm this notion. Whether the presence of PD-L1+ CTCs provides useful information regarding patient selection for immunotherapy with anti-PD-1/PD-L1 monoclonal antibodies remains to be confirmed and validated in future studies. Moreover, both CD8+ PD-1+ and PD-L1+ CTCs could also facilitate the on-treatment monitoring of patient immunological response during treatment with chemotherapy or immune checkpoint inhibitors.
Supplemental Material
Supplementary_material – Supplemental material for CD8+ PD-1+ T-cells and PD-L1+ circulating tumor cells in chemotherapy-naïve non-small cell lung cancer: towards their clinical relevance?
Supplemental material, Supplementary_material for CD8+ PD-1+ T-cells and PD-L1+ circulating tumor cells in chemotherapy-naïve non-small cell lung cancer: towards their clinical relevance? by Athanasios Kotsakis, Galatea Kallergi, Despoina Aggouraki, Zaharoula Lyristi, Filippos Koinis, Eleni Lagoudaki, Anastasios Koutsopoulos, Vassilis Georgoulias and Eleni-Kyriaki Vetsika in Therapeutic Advances in Medical Oncology
Footnotes
Acknowledgements
Special thanks are given to Ms Vasso Athanasaki for her excellent scientific secretary assistance.
Author contributions
E-KV, VG, and Athanasios Kotsakis participated in the study concept, design and review; E-KV and Athanasios Kotsakis supervised the study; E-KV, DA, and Athanasios Kotsakis wrote the paper; E-KV developed the methodology; E-KV, DA, GK, ZL, FK, EL, Athanasios Kotsakis and Anastasios Koutsopoulos analyzed and interpreted the data; E-KV, DA, GK, ZL, EL and Athanasios Kotsakis executed the experiments; E-KV, DA and Athanasios Kotsakis administrative, technical and material support; VG and Athanasios Kotsakis enrolment of patients.
Funding
This work in part supported by grants from the Cretan Association for Biomedical Research (CABR), the Hellenic Oncology Research Group, the Special Account for Research of University of Crete, the Hellenic Society of Immuno-Oncology and the Society of Clinical and Experimental Research in Oncology, Greece.
Conflict of interest statement
The authors declare that there is no conflict of interest.
Supplemental material
Supplemental material for this article is available online.
References
Supplementary Material
Please find the following supplemental material available below.
For Open Access articles published under a Creative Commons License, all supplemental material carries the same license as the article it is associated with.
For non-Open Access articles published, all supplemental material carries a non-exclusive license, and permission requests for re-use of supplemental material or any part of supplemental material shall be sent directly to the copyright owner as specified in the copyright notice associated with the article.