
Abstract
Background:
Chemoresistance hampers the treatment of patients suffering from pancreatic ductal adenocarcinoma (PDAC). Here we aimed to evaluate the (phospho)proteome of gemcitabine-sensitive and gemcitabine-resistant PDAC cells to identify novel therapeutic targets and predictive biomarkers.
Methods:
The oncogenic capabilities of gemcitabine-sensitive and resistant PDAC cells were evaluated in vitro and in vivo. Cultured cells were analyzed by label-free proteomics. Differential proteins and phosphopeptides were evaluated by gene ontology and for their predictive or prognostic biomarker potential with immunohistochemistry of tissue microarrays.
Results:
Gemcitabine-resistant cells had increased potential to induce xenograft tumours (p value < 0.001). Differential analyses showed that proteins associated with gemcitabine resistance are correlated with microtubule regulation. Indeed, gemcitabine-resistant cells displayed an increased sensitivity for paclitaxel in vitro (p < 0.001) and nab-paclitaxel had a strong anti-tumour efficacy in vivo. Microtubule-associated protein 2 (MAP2) was found to be highly upregulated (p = 0.002, fold change = 10) and phosphorylated in these resistant cells. Expression of MAP2 was correlated with a poorer overall survival in patients treated with gemcitabine in the palliative (p = 0.037) and adjuvant setting (p = 0.014).
Conclusions:
These data show an explanation as to why the combination of gemcitabine with nab-paclitaxel is effective in PDAC patients. The identified gemcitabine-resistance marker, MAP2, emerged as a novel prognostic marker in PDAC patients treated with gemcitabine and warrants further clinical investigation.
Background
Pancreatic ductal adenocarcinoma (PDAC) is characterized by a high lethality, with only 7% of patients alive 5 years after diagnosis. 1 Most patients present with advanced disease stages, either locally advanced (stage III) or with distant metastases (stage IV), leaving palliative chemotherapy as the only therapeutic option. 2 Aggressive multimodal therapy offers the best survival chances for patients diagnosed with early stage disease (stage I–IIb). 3 This treatment consists of a combination of resection followed by adjuvant chemotherapy. Currently, standard adjuvant therapy consists of six cycles of gemcitabine improving disease-free survival (DFS) from 6.7 to 13.4 months.3,4
Gemcitabine is the most commonly used cytotoxic drug backbone in Europe for the treatment of PDAC. 5 It is a deoxycytidine nucleoside analogue that, after intracellular transport, is phosphorylated to its activated form. The cytotoxic function is exerted via two mechanisms; interaction with ribonucleotide reductase results in the depletion of deoxynucleotides. In addition, gemcitabine itself is incorporated in DNA. Both functions lead to DNA synthesis arrest, followed by apoptosis and cell death. 6 Unfortunately, not all patients with PDAC benefit from adjuvant therapy with gemcitabine. Surgical complications and early disease progression hamper the completion of adjuvant therapy. 7 In addition, chemoresistance, including gemcitabine resistance, is a hallmark of PDAC biology, leading to reduced efficacy of cytotoxic agents in the adjuvant and metastatic setting. No predictive biomarkers are currently used to guide clinical decision-making for gemcitabine therapy.
The chemoresistance features of PDAC are multifactorial. These tumours are notorious for their large fibrotic tissue surrounding tumour cells in a hypovascular and hypoxic environment. 8 This dense tissue forms a physical barrier for drug delivery. 9 Moreover, cancer-associated fibroblasts reduce gemcitabine levels, further inhibiting local concentrations available to target tumour cells. 10 Additional paracrine and autocrine signalling axes can also impair gemcitabine efficacy. 11
Most importantly, PDAC cells themselves harbour several intrinsic resistance mechanisms that overcome cytotoxic effects. For example, epithelial-to-mesenchymal transition (EMT) and the existence of cancer stem cell (CSC) subclones can contribute to intrinsic resistance.12–14
Previously, Quint and colleagues 13 established a resistant subclone of a pancreatic cancer cell line after short-term treatment with a high dose of gemcitabine in order to study the potential mechanisms of gemcitabine resistance. These gemcitabine-resistant cells exhibited increased mRNA of EMT and CSC markers, as well as a significantly enhanced capability to migrate. We hypothesized that by analyzing this model, novel prognostic/predictive protein markers could be identified and that their expression and phosphoprotein state could guide innovative therapeutic approaches. To this aim, we investigated protein expression in-depth and evaluated pathway activation of gemcitabine-resistant cells via an unbiased proteomic approach. We found that gemcitabine-resistant PDAC cells are sensitive to taxane-based treatment in vitro and in vivo. Furthermore, we uncovered microtubule-associated protein 2 (MAP2) as a potential biomarker for gemcitabine resistance in two cohorts of PDAC patients.
Methods
Cell culture and drugs
In this study, a gemcitabine-sensitive cell line, PANC1, and a gemcitabine-resistant PANC1 cell line, PANC1R, were kindly supplied by the Institute for Surgical Research, Philipps-University of Marburg, Marburg, Germany. 13 Cells were cultured in Roswell Park Memorial Institute (RPMI) medium (Lonza, Switzerland) supplemented with 10% heat-inactivated foetal calf serum (Biowest, Nuaillé, France) and 1% penicillin and streptomycin (Lonza, Switzerland). Cells were maintained at low passage and tested negatively for mycoplasma contamination. Hs766t cells and Capan-2 (ATCC, Manassas, USA) were cultured in supplemented Dulbecco’s Modified Eagle Medium (Lonza) and several primary cell lines (PDAC1-4) 15 and Capan-1 (ATCC) were grown at low density in supplemented RPMI medium. Paclitaxel (Bristol-Meyers Squibb, New York, USA) and docetaxel (Sigma-Aldrich, St. Lous, USA) were dissolved in 50% ethanol and sterile H2O. Gemcitabine was kindly provided by Eli Lilly Corporation (Indianapolis, USA) and dissolved in sterile water. Nab-paclitaxel was kindly supplied by the Pharmacy of New York Presbyterian Hospital (New York, NY, USA) and was dissolved in NaCl.
Cell lysis and protein digestion
Cell line lysates were prepared as described before in 9 M urea buffer containing 4-(2-hydroxyethyl)-1-piperazineethanesulfonic acid (HEPES) and phosphatase inhibitors. 16 Biological duplicates of different passages were prepared. Lysates were sonicated on ice and protein concentration was measured using the Bicinchoninic Acid (BCA) method (ThermoPierce, Waltham, USA). For protein expression analysis, protein digestion and extraction was performed with our whole-in-gel protocol described previously. 17 In short, 50 μg of protein was mixed with NUpage lithium dodecyl sulfate (LDS) sample buffer (Invitrogen, Carlsbad, USA) containing dithiothreitol (DTT; Sigma-Aldrich, St. Lous, USA) and loaded on a NUpage 4–12% gradient gel (Invitrogen). After electrophoresis, gels were fixed and stained with Coomassie Brilliant Blue solution. After reduction and alkylation, proteins were digested overnight with trypsin (Promega, Madison, USA) and extracted from the gel for further analysis.
Phosphopeptide enrichment
For phosphoprotein analysis, 500 μg of lysates were digested in solution after reduction and alkylation. Digestion was stopped by acidification and phosphopeptides were enriched according to our laboratory’s protocol. 16 Briefly, peptides were desalted with C18 cartridges (Waters, Milford, USA). Global phosphopeptide enrichment was performed using titanium dioxide beads (10 µm, GL Sciences, Tokyo, Japan) using 300 mM lactic acid and 80% acetonitrile (ACN). Phosphopeptides were eluted by 0.5% and 5% piperidine. After enrichment, phosphopeptides were desalted in 20 µl StageTips using 0.1% trifluoroacetic acid (TFA) and were eluted with 80% ACN/0.1% TFA into glass-lined autosampler vials. Eluates were dried in a speedvac and resolved in 20 µl loading solvent (4% ACN in 0.5% TFA) and stored at 4°C until liquid chromatography-mass spectroscopy (LC-MS)/MS measurement on the same day.
Nano-LC-MS/MS and protein identification
Peptides were separated by an Ultimate 3000 nanoLC-MS/MS system (Dionex LC-Packings, Amsterdam, the Netherlands) equipped with a 40 cm × 75 μm ID fused silica column custom packed with 1.9 μm 120 Å ReproSil Pur C18 aqua (Dr Maisch GMBH, Beim Brückle, Germany). After injection, peptides were trapped at 6 μl/min on a 10 mm × 100 μm ID trap column packed with 5 μm 120 Å ReproSil Pur C18 aqua at 2% buffer B [buffer A: 0.5% acetic acid (Fischer Scientific, Hampton, USA), buffer B: 80% ACN, 0.5% acetic acid] and separated at 300 nl/min in a 10–40% buffer B gradient in 90 min (120 min inject-to-inject) at 35°C. Eluting peptides were ionized at a potential of +2 kVa into a Q Exactive mass spectrometer (Thermo Fisher, Erlangen, Germany). Intact masses were measured at resolution 70,000 (at m/z 200) in the orbitrap using an Automatic Gain Control (AGC) target value of 3 × 10⁶ charges. The top 10 peptide signals (charge states 2+ and higher) were submitted to tandem mass spectrometry (MS/MS) in the Higher-energy collisional dissociation (HCD) (higher-energy collision) cell (1.6 amu isolation width, 25% normalized collision energy). MS/MS spectra were acquired at resolution 17,500 (at m/z 200) in the orbitrap using an AGC target value of 2 × 10⁵ charges and an under-fill ratio of 0.1%. Dynamic exclusion was applied with a repeat count of 1 and an exclusion time of 30 s.
Protein identification
MS/MS spectra were searched against the uniprot human reference proteome 2014_01_NO_fragments FASTA file (61,552 entries) using MaxQuant 1.5.2.8 18 (protein expression) and the 2015_08_NO_fragments FASTA file (62,447 entries; phosphoproteomics). Enzyme specificity was set to trypsin and up to two missed cleavages were allowed. Cysteine carboxyamidomethylation (Cys, +57.021464 Da) was treated as fixed modification and serine, threonine and tyrosine phosphorylation (+79.966330 Da), methionine oxidation (Met, +15.994915 Da) and N-terminal acetylation (N-terminal, +42.010565 Da) as variable modifications. Peptide precursor ions were searched with a maximum mass deviation of 4.5 ppm and fragment ions with a maximum mass deviation of 20 ppm. Peptide, protein and site identifications were filtered at an false discovery rate (FDR) of 1% using the decoy database strategy. The minimal peptide length was 7 amino-acids and the minimum Andromeda score for modified peptides was 40 and the corresponding minimum delta score was 6. Proteins that could not be differentiated based on MS/MS spectra alone were grouped to protein groups (default MaxQuant settings). Phosphopeptide identifications were propagated across samples using the match between runs option checked. Protein expression searches were performed with the label-free quantification option selected.
Label-free phosphopeptide quantification
Phosphopeptides were quantified by their extracted ion intensities (‘Intensity’ in MaxQuant). For each sample, the phosphopeptide intensities were normalized on the median intensity of all identified phosphopeptides of the dataset (‘normalized intensity’).
Label-free protein quantification
Proteins were quantified by spectral counting, that is, the number of identified MS/MS spectra for a given protein. Raw counts were normalized on the sum of spectral counts for all identified proteins in a particular sample, relative to the average sample sum determined with all samples. Identified proteins and phosphopeptides are listed in Supplemental Table 1(a and b), respectively. Supplemental Table 1(c) contains identified phosphosites.
The MS proteomics data have been deposited to the ProteomeXchange Consortium via the PRIDE 19 partner repository with the dataset identifier PXD010112.
Drug inhibitory assays
For the drug inhibitory assays, PANC1 and PANC1R cells were seeded in triplicate onto 96-wells plates with a density of 3000 cells per well. Hs766t, Capan2, Capan1 and PDAC1-4 were seeded with a density of 3000–5000 cells per well. Cells were attached overnight and cytotoxic drugs (paclitaxel, docetaxel, gemcitabine) were added in different concentration ranges. Drugs were incubated for 72 h, after which proteins of viable cells were precipitated and subsequently stained with sulforhodamine B (SRB) and measured for absorbance at 492 nm in the Synergy microplate reader (Biotek Cytation3 Cell Imaging Multi-Mode Reader, Winooski, USA). The inhibitory concentration of 50% of the cells (IC50) was determined by nonlinear least squares curve fitting with Graphpad Prism (version 7.0, Intuitive Software for Science, San Diego, USA). For combination treatment, a fixed concentration of paclitaxel combined with gemcitabine was evaluated against a dose-response curve of gemcitabine alone.
Immunofluorescence
Cells were plated in Chamber-Slides System (Lab-Tek, Thermo Fisher Scientific, Waltham, USA) with a density of 104 per well and attached overnight. Cells were treated with gemcitabine (1 µM) or vehicle for 24 hours. Subsequently, cells were fixed with 4% paraformaldehyde and stained with a specific monoclonal rabbit anti-human MAP2 antibody (1:200, #MA5-12823), followed by Alexa Fluor 594 goat anti-rabbit (Product#A-11032) and anti-mouse (Cat#A-11032). Nuclear DNA was stained with 4′,6-diamidino-2-phenylindole (DAPI). Digital images were captured with a Zeiss Laser Scanning Microscope and processed with Axiovision 4.1 software (Zeiss Microimaging, Thornwood, USA).
Western blot analysis
In brief, 20 µg of total protein was loaded on 10% sodium dodecyl sulphate/polyacrylamide gels after denaturation. After electrophoresis, proteins were transferred onto nitrocellulose membranes (Millipore, Temecula, USA) overnight. Membranes were blocked in 5% blotting-grade blocker nonfat dry milk (Biorad, Hercules, USA) in phosphate buffered saline (PBS) and 0.1% Tween20 (PBST). Primary antibodies were incubated in 5% bovine serum albumin (Sigma-Aldrich) in PBST at room temperature and membranes were subsequently washed and incubated with secondary antibodies in 5% blocking buffer. Proteins were detected with SuperSignal West Pico Chemoluminescent substrate (Thermo Scientific, Waltham, USA) and visualized by an Uvitec Imaging station (Cleaver Scientific, Rugby, UK). Antibodies used for western blot analysis were anti-MAP2 (1:200, Invitrogen), anti-ankyrin-3 (ANK3; 1: 1000, HPA0556439, Human Protein Atlas), anti-nestin (NES; 1:200, HPA007007, Human Protein Atlas), anti-beta-actin (1:1000, CA # 4967S, Cell Signaling), anti-mouse-horseradish peroxidase (HRP; 1:2000, CA # 7076S, Cell Signaling), anti-rabbit-HRP (1:2000, CA# 7074S, Cell Signaling).
Quantitative real-time polymerase chain reaction
Quantitative real-time polymerase chain reaction (RT-qPCR) was performed according to a previous protocol. 20 In short, cells were harvested in Trizol Reagent (ThermoFisher, Waltham, USA ) and RNA was isolated according to the manufacturer’s protocol. Complimentary DNA (cDNA) was created with a DyNAmo cDNA Synthesis Kit (ThermoFisher). RT-qPCR was performed on the CFX Manager CFX96 (Biorad) with MAP2 and ACTB primers (Taqman, code 4453320 and 4326315E respectively). The ∆∆CT method was used to evaluate MAP2 expression levels compared with PANC1, and to evaluate MAP2 expression upon gemcitabine treatment.
Fluorescence-activated cell sorting analysis
For microtubule stabilization analysis, fluorescence-activated cell sorting analysis was performed as described previously. 21 In short, cells were seeded and treated with either vehicle or paclitaxel (200 ng/ml). After incubation of 2 h, cells were harvested, fixed and microtubules stabilized. Staining was performed with anti-tubulin-Fitc conjugated antibody (1:50, CA #8058 Cell Signaling). Cells were analyzed by flow cytometry on a FACSCalibur (Becton Dickinson, Franklin Lakes, USA) in triplicate.
In vivo tumorigenesis and drug evaluation
Mouse experiments were performed in accordance with the National Institutes of Health Guidelines for animal research and procedures were approved by the Institutional Animal Care and Use Committee of the Columbia University (IACUC; number AC-AAAQ1415). A total of 36 mice were utilized in this study. To establish xenograft tumours, 50 µl containing 3 × 10⁶ cells, suspended in 50% sterile Matrigel and PBS, were injected into the flanks of 6–8-week-old athymic nude mice (Taconic Labs & the Jackson Laboratory, Rensselaer, New York, USA). A total of 18 mice in each arm were inoculated with either PANC1 or PANC1R cells. Growth of tumours was evaluated weekly by ultrasound (Verasonics, Kirkland, USA) while mice were anaesthetized with 1–2% isoflurane (Halocarbon, Peachtree Corners, USA) in oxygen. A 3D positioner (Velmex Inc., Bloomfield, USA) was used to mechanistically ultrasound the full tumour with 1-mm horizontal step-wise imaging. Volumetric reconstructions were performed to evaluate tumour volume and growth. Mice were enrolled once their tumour size was at least 100 mm3. They were treated intravenously with either vehicle (NaCl) as control or nab-paclitaxel (60 mg/kg). They received three doses of treatment over a period of 8 days. During treatment and tumour progression, tumour volume was evaluated twice a week. If no tumour residue or progression was observed after treatment, mice were censored at day 120. End points were tumour volume larger than 1000 mm2, weight loss over 20% after start of treatment or clinical signs of suffering. Mice were excluded from survival analysis if they suffered from extreme side effects from therapy within the first 8 days (n = 2). Tumour tissues were stored in formalin-fixed paraffin embedded (FFPE) blocks.
Tissue microarrays
To evaluate novel proteins as prognostic biomarker in relation with gemcitabine response, two patient cohorts were evaluated. The first cohort consisted of metastatic patients (stage IV, n = 36) treated with gemcitabine in the palliative setting. The second validation cohort consisted of early stage patients (stage I–IIb, n = 86) treated with gemcitabine in the adjuvant setting. Representative cores of individual primary PDAC FFPE tissues prior to treatment were selected and combined in tissue microarrays (TMAs). Immunohistochemistry (IHC) staining of MAP2 was performed according to manufacturer’s protocol. As a positive control, human brain cortex FFPE material was used. As negative control, slides stained with no primary antibody were used. Visualization was obtained with BenchMark Special Stain Automation system (Ventana Medical Systems, Export, USA). Staining was evaluated by a molecular pathologist, assessing the amount of tumour and tissue loss, background, and overall interpretability. Immunostaining intensity was classified into two grades: 0 (absent) and 1 (present). All patients provided written informed consent for the storage, analysis of their tumour material and survival data. This study was approved by the Local Ethics Committee of the University of Pisa (Ethics approval no 3909, on 3 July 2013) and patients signed an informed consent for the use of tissue samples.
Statistics
Data were analyzed with Graphpad Prism Software, version 7 (Intuitive Software for Science, San Diego, USA), R Project (version 3.3.4) and SPSS, version 21 (IBM, Chicago, USA). Differential expression of proteomic data was analyzed with the beta-binomial test. 22 Fold changes (FCs) were expressed per group comparison. Heatmap visualization and hierarchical clustering was done with R package gplots (Euclidean distance function, with default complete linkage). Gene ontology mining was performed with Cytoscape, version 3.5.0, in addition with the ClueGO, version 2.5.0. 23 In vitro experiments were performed with a minimum of three biological replicates. Curves were compared by nonlinear regression analysis and the F test. Group comparisons were evaluated with the unpaired nonparametric Mann–Whitney U test or unpaired Student’s t test. Fishers exact test was used for categorical analysis. Correlation with clinicopathological characteristics, including progression-free survival (PFS) or DFS and overall survival (OS), was tested with Kaplan–Meier curves and the log-rank test. Univariate analysis was performed and factors with a p value below 0.1 were evaluated in the multivariate analysis according to the Wald model. Statistical significance was set at p values below 0.05.
Results
In vitro and in vivo characterization of gemcitabine-resistant PDAC cells
Gemcitabine-resistant PDAC cells survived treatment with higher doses of gemcitabine [Figure 1(a), F test on log-IC50, p = 0.032] compared with sensitive PANC1 cells. To evaluate tumorigenic capabilities, we performed an in vivo experiment. Only 28% of nude mice harboured a xenograft tumour within 90 days after subcutaneous injection with PANC1 cells, compared with an implantation rate of 95% upon injection with the gemcitabine-resistant PANC1R cells [Figure 1(b), Fisher’s exact test p < 0.0001]. Upon successful tumour engraftment, PANC1R tumours developed an evident tumour nodule, defined by a volume of 100 mm3, significantly faster than PANC1 cells [Figure 1(c), median 35 versus 139 days, Mann–Whitney U test, p < 0.0001]. Moreover, PANC1R mice reached their endpoint faster [Figure 1(d), median OS 30 versus 61.5 days, log-rank test p = 0.003]. These results highlight the enhanced take rate and growth rate of these gemcitabine-resistant PDAC cells in vivo.
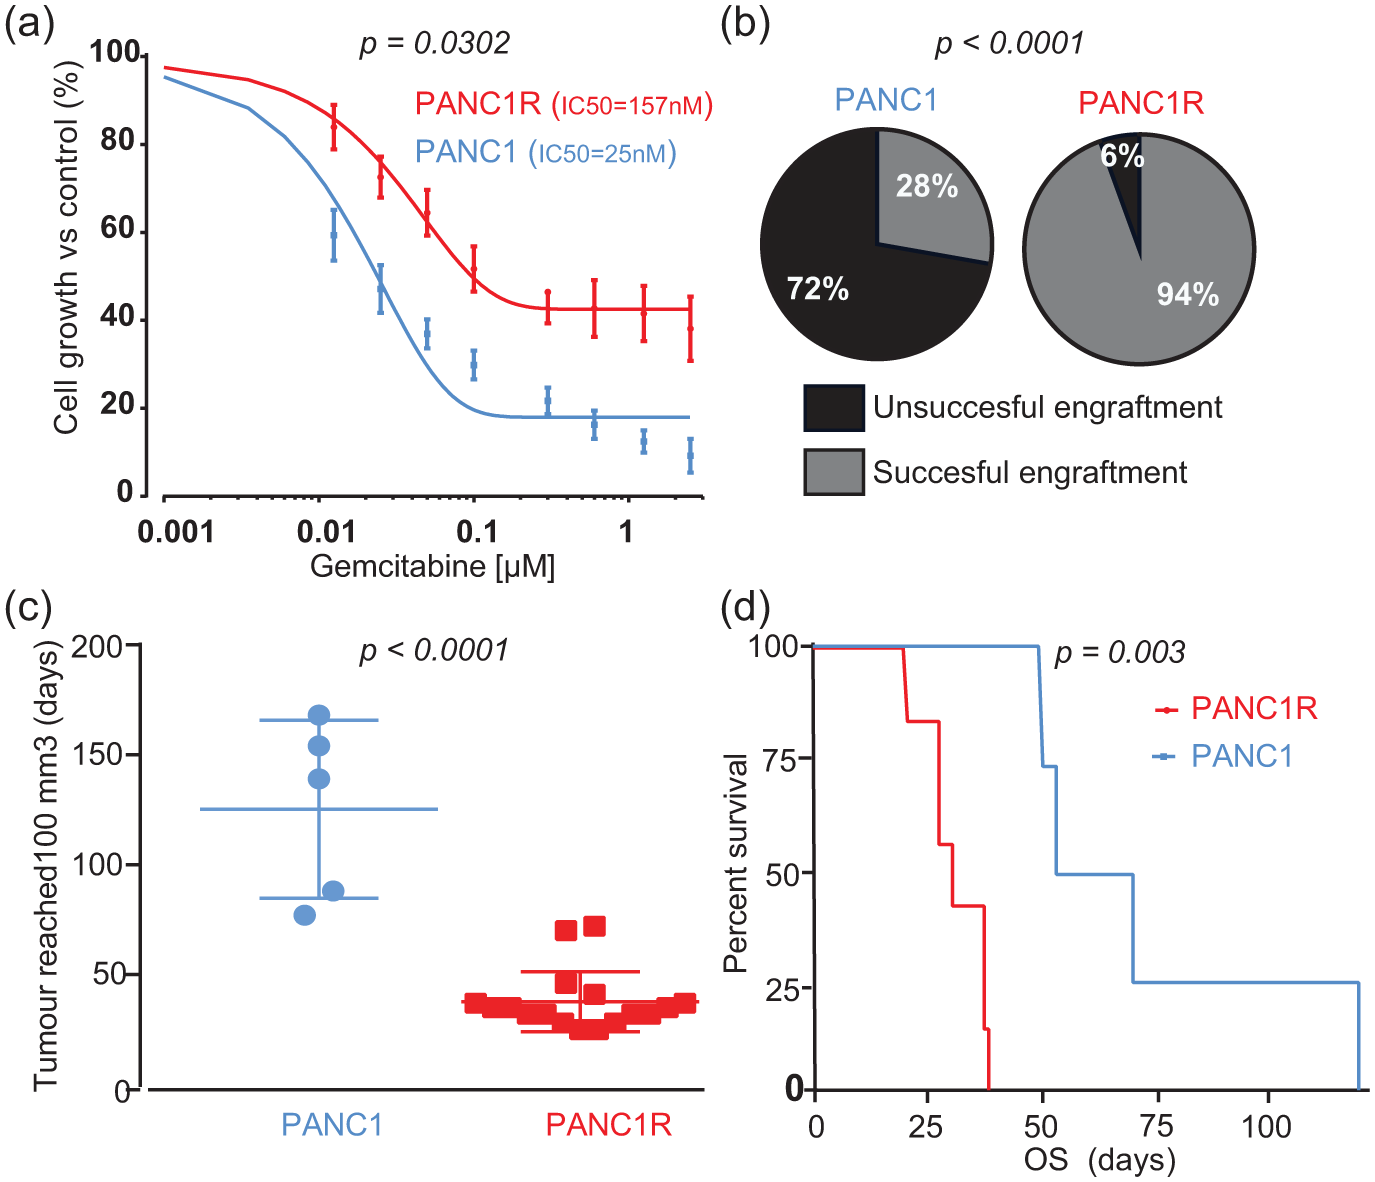
Characterization of sensitive PANC1 and resistant PANC1R cells in vitro and in vivo.
Differential protein expression and pathway analysis
Protein expression and protein phosphorylation are tightly regulated mechanisms to induce protein activity and regulate biological functions. 24 To explore the underlying tumorigenic capability, and understand the biology of gemcitabine-resistant cells, we performed an unbiased protein expression and protein phosphorylation analysis by MS. We obtained a dataset of 6074 proteins [Supplemental Table 1(a)] and 10,623 phosphopeptides [Supplemental Table 1(b)], mapping to 2626 phosphoproteins with 262 proteins and 143 phosphopeptides differentially regulated in gemcitabine-resistant PANC1R cells compared with sensitive PANC1 cells [Supplemental Table 1(e and f)]. Biological replicates of both cell lines cluster together, indicating differential biology (Supplemental Figure 1). Since PANC1R cells were proven resistant to gemcitabine, gemcitabine pathway elements and known resistance mechanisms (e.g. membrane transporters, CSC markers) were evaluated (Supplemental Table 2). The gemcitabine transporter SLC29A1 (ENT) was decreased (FC = −1.5), while the dephosphorylating enzyme NT5C was increased (FC = 2.3) in PANC1R, although both not significantly. These two shifts in gemcitabine pathway modulators could partly explain the gemcitabine-resistant phenotype.25,26 Anion-exchange transporters SLC5A3 and SLC4A2 were significantly upregulated, while SLC25A5 and SLC7A6 were significantly downregulated. However, these transporters have no known functions in resistance against anticancer drugs. Overall expression of CSC markers was inconclusive between the two cell lines indicating no clear relation of CSC markers with resistance in our cells. To further understand the biological features that underlie the differential sensitivity to gemcitabine between PANC1 and PANC1R, gene ontology mining was performed. Upregulated proteins of PANC1R cells were enriched in biological processes of regulation of (endo)membrane and cell projection organization. Moreover, these cells express proteins associated with vesicle localization, a possible method for drug resistance via drug efflux mechanisms via vesicles 27 [Supplemental Figure 2(a and b)]. Observed downregulated processes involved metabolic and differentiation processes. Downregulated phosphorylation events were correlated with intrinsic apoptotic signalling pathways to DNA damage. This potentially indicates another adaptation to gemcitabine response in our resistant cells. Interestingly, upregulated phosphoproteins were associated with microtubule regulation [Supplemental Figure 3(a and b)], which could highlight a therapeutic window for microtubule inhibitors.
Exploration of microtubule inhibitors as a therapeutic option
Given the established clinical effectiveness of combining gemcitabine with the microtubule stabilizing agent nab-paclitaxel 28 and our finding of upregulation of microtubule-associated processes in a gemcitabine-resistant cell line, we next evaluated the effect of microtubule inhibitors on our in vitro model. The two microtubule stabilizing agents, paclitaxel and docetaxel, were both effective against gemcitabine-sensitive and resistant cells [Supplemental Figure 4(a)]. Interestingly, cell viability was more affected in gemcitabine-resistant cells than in the gemcitabine-sensitive cells at low paclitaxel doses [Figure 2(a), unpaired Student’s t test p = 0.0082 and 0.0335, respectively]. This difference diminished when exposing cells to higher concentrations of paclitaxel (>5 nM, p = ns). Conversely, docetaxel had an equal impact on viability of PANC1 and PANC1R cells [Supplemental Figure 4(a)]. These results are important since they underline that chemoresistant mechanisms can be drug-specific, highlighting opportunities for other therapeutic targets when the disease progresses during gemcitabine treatment.

Cytotoxic effects of (nab-)paclitaxel on resistant PANC1R cells in vitro and in vivo.
To understand the mechanism of enhanced paclitaxel toxicity in PANC1R, we quantified microtubule polymerization, the target of paclitaxel. Upon treatment, PANC1R cells showed significant increase in microtubule stabilization [Supplemental Figure 4(b)]. This suggests that the increased sensitivity to paclitaxel of resistant cells can be attributed to the increased microtubule stabilization effect of taxanes in these cells. Moreover, combination treatment with gemcitabine and a fixed dose of paclitaxel resulted in an increased inhibition of proliferation of resistant cells compared with monotherapy with gemcitabine [Supplemental Figure 4(c)]. These findings provide functional proof for combination treatment to target gemcitabine-resistant cells in PDAC tumours.
To further validate our results, mice harbouring PANC1R tumours were treated with three doses of nab-paclitaxel (n = 7), a paclitaxel-derivative bound to albumin, which is currently registered in the clinic for multiple solid tumour types including metastatic PDAC 28 or were treated with vehicle (n = 7). Nab-paclitaxel-treated mice showed significantly improved survival [Figure 2(b)] and effective tumour growth inhibition [Figure 2(c), Supplemental Figure 5]. In five out of seven mice, treatment resulted in complete tumour regression. These results suggest that gemcitabine-resistant cells can be effectively targeted by (nab-)paclitaxel and suggests that the efficacy of gemcitabine with the addition of nab-paclitaxel in patients might not only rely on drug synergism, but also on targeting of resistant subclones.
Validation of MAP2 as a predictive marker of gemcitabine sensitivity
In the proteomic screen, several upregulated proteins were identified in the gemcitabine-resistant cells (Table 1) and we reasoned that these proteins could be predictive for gemcitabine resistance in patients. A total of three proteins were selected, based on FCs and significant upregulation in resistant cells; MAP2, ANK3 and NES. Western blot analysis validated our proteomic analysis for MAP2 and ANK3 as upregulated proteins in our cell-line model [Figure 3(a)]. Unfortunately, low levels of NES precluded quantitative evaluation and this candidate was omitted from further analysis.
Top 10 upregulated proteins and phosphoproteins in gemcitabine-resistant PANC1 cells versus sensitive cells. Proteins or peptides were filtered based on a FC increase of minimally 2.5-fold and ordered on p value. NA indicates that the protein was not identified in one of the groups, thus a FC could not be calculated.

FC, fold change; PANC1, gemcitabine-sensitive cell line.

Identification of predictive markers of gemcitabine resistance.
To validate the clinically applicable value of our proteome screen, MAP2 and ANK3 protein expression were evaluated by IHC on two independent PDAC cohorts. The first cohort consisted of metastatic patients who received gemcitabine monotherapy in the palliative setting. The second cohort encompassed stage IIb patients who received gemcitabine as adjuvant therapy after resection of the primary tumour (clinicopathological characteristics of both cohorts are shown in Table 2). Of note, sex was significantly correlated with OS in these cohorts. ANK3 was expressed at equal levels in all tumours and scoring on high versus low expression did not predict gemcitabine resistance. MAP2 had a variable expression pattern between patients [Figure 3(b)]. Positive staining for MAP2 correlated significantly with shorter OS in metastatic patients [Figure 4(a), median OS 11 versus 7.5 months, log-rank test p = 0.037], in line with our cell line and xenograft model [Figure 5(a and b)]. A trend towards worse PFS in this cohort was also seen (log-rank test p = 0.1). Moreover, MAP2 expression in surgical specimens of patients subsequently treated with adjuvant therapy was correlated to decreased OS [Figure 4(b), median OS 21.7 versus 15.1 months, log-rank test p = 0.014] and DFS [log-rank test p = 0.010, Figure 4(c)]. High expression of MAP2 was not correlated with other clinicopathological features. In the multivariate analysis, MAP2 and sex were prognostic factors for OS. MAP2 expression emerged also as an independent prognostic factor for a worse DFS (Table 2). To further explore the possible predictive value of MAP2 and gemcitabine resistance, we evaluated primary cell lines and ATCC lines for MAP2 expression. MAP2 was identified as upregulated on mRNA level in our model by RNAseq 29 [Supplemental Figure 6(a)]. Interestingly, high expression of MAP2 was not a common feature in PDAC cell lines, which is in concordance with our clinical data, which showed 19% MAP2 positivity in both cohorts (Table 2). Cell line Hs766t showed high baseline expression of MAP2 [Supplemental Figure 6(b)]. High or intermediate expression of MAP2 was associated with reduced efficacy of gemcitabine [Supplemental Figure 6(c)]. Importantly, all cells were sensitive to paclitaxel treatment (IC50 range from 1.4 to 14.6 nM), irrespective of their gemcitabine sensitivity levels. Of note, Capan1, a cell line with low MAP2 mRNA, showed an increase of MAP2 upon treatment of gemcitabine, further supporting the potential role of this protein in inducing a rapid mechanism of acquired resistance [Supplemental Figure 6(d)], but further studies are needed in order to develop additional appropriate models of resistance.
Clinicopathological characteristics of two TMA cohorts.

CI, confidence interval; df, degrees of freedom; DFS, disease-free survival; HR, hazard ratio; OS, overall survival; MAP2, microtubule-associated protein 2; PANC1, gemcitabine-sensitive cell line; TMA, tissue microarray.
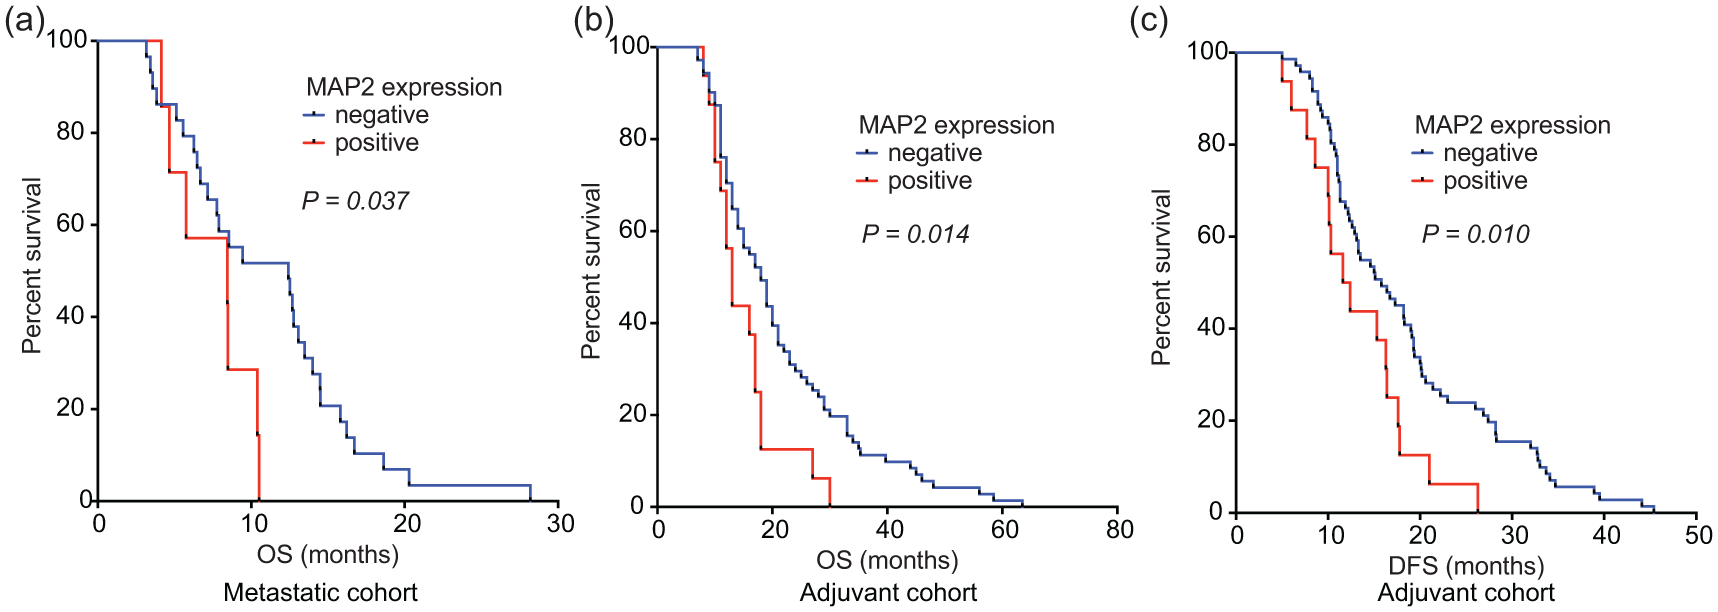
Correlation of MAP2 expression and OS and DFS upon gemcitabine treatment.

Immunofluorescence and immunohistochemistry of MAP2 in PANC1 and PANC1R cells and xenografts. (a) Immunofluorescence of PANC1 and PANC1R cells grown in chamber slides, and imaged at 100× magnification, showing a strong MAP2 (red)cytoplasmic staining in the PANC1R cells and low expression in PANC1, confirming our proteomic analysis. CK7 staining was performed as positive control (green), and DAPI was used to stain the nuclei (blue). This phenotype was conserved in our xenograft model as is shown by IHC (b), where MAP2 expression was overexpressed in the PANC1R tumours in vivo.
Discussion
We used comprehensive proteomic and phosphoproteomic strategies to understand the gemcitabine-resistant mechanism in our PDAC model and to evaluate treatment options. We identified MAP2 as an upregulated protein in gemcitabine-resistant cells. Gemcitabine-resistant cells expressing MAP2 had an increased sensitivity to (nab-)paclitaxel treatment in vitro, induced significant tumour reduction in vivo, and showed a benefit of combination therapy with gemcitabine. Moreover, MAP2-positive staining was validated as a prognostic biomarker in two patient cohorts treated with gemcitabine monotherapy, either in the palliative or adjuvant setting. In both cohorts, expression of MAP2 was correlated with poorer survival and thus, reduced treatment response.
The protein MAP2 has an important microtubule stabilization function 30 and is required for neurite outgrowth. 31 It has been described as a marker of neuronal differentiation and interacts with tubulins. Phosphorylation of MAP2 is an important regulator of its function, thus guiding microtubule dynamics.32–34 Importantly, microtubules have an important function in intracellular transport machinery. 35 Changing microtubule dynamics by higher expression of MAP2 might result in changed drug transport and efficacy intracellularly. Cytotoxic agents that act as microtubule polymerization stabilizers, like docetaxel, paclitaxel and its albumin-bound derivative nab-paclitaxel, function via multiple pathways that involve MAP2. These anticancer drugs inhibit the disassembly of polymerized microtubules. Subsequently, this aberrant stabilization results in mitotic cell cycle arrest or multispindle segregation, and cell death. 36 Interestingly, paclitaxel was shown to increase assembly of MAP2 onto polymerizing tubulins. 37 High MAP2 expression in mouse PDAC cell lines was correlated with sensitivity for docetaxel. 38 We did not observe an increased sensitivity for docetaxel but identified an increased sensitivity for paclitaxel. The association between paclitaxel and MAP2 assembly on tubulins could explain our observation of increased sensitivity of gemcitabine-resistant cells to paclitaxel treatment and increased stable microtubules upon treatment with paclitaxel.
A previous study showed that modulation of microtubule dynamics by the silencing of tubulin binding cofactor C and cell cycle distribution enhanced the sensitivity to gemcitabine in breast cancer cells. 39 Furthermore, the combination of the benzophenone analogue S516, which changed the cellular microtubule network, with gemcitabine significantly delayed the growth of lung cancer tumours as compared with control and gemcitabine alone. 40
Similarly, we identified an increased cytotoxic effect of combination treatment with gemcitabine in resistant cells, which provides a functional rationale for gemcitabine/nab-paclitaxel regimens in the metastatic and possibly the (neo)adjuvant setting. Our results suggest that gemcitabine-resistant cells are targeted effectively by (nab-)paclitaxel in vitro and in vivo, explaining the effectiveness of this combination therapy in the clinic. 41
Expression of MAP2 has previously been described in several other solid tumours, such as oral squamous carcinoma, 42 lung cancer 43 and breast cancer. 44 Importantly, in two studies evaluating clinical samples from patients with breast cancer treated with taxanes, MAP2 was identified as a predictive marker for clinical response44,45 in line with our results of sensitivity to (nab)-paclitaxel. Lack of expression of MAP2 was associated with significantly longer DFS and OS upon monotherapy with gemcitabine in our two cohorts, evoking the question of its potential as prognostic or predictive marker for gemcitabine response. Expression of MAP2 showed an association with gemcitabine sensitivity in cell lines as well. This biomarker can be essential to select patients in advance for taxane-based combination regimens. Further prospective trials to establish its predictive value in the adjuvant setting after a nab-paclitaxel/gemcitabine combination are therefore warranted.
Another interesting result of the present study is that the gemcitabine-resistant cells were capable of establishing xenograft tumours significantly better than their parental cells. This indicates a higher clonogenic potential, a CSC characteristic previously associated with gemcitabine resistance. 13 In our proteomic screen, NES was identified as significantly upregulated. NES has previously been described as a CSC marker in pancreatic cancer,46,47 as well as in cells which are known to feature chemoresistance. 12 However, although identified in our proteomic analysis, we did not detect this protein in TMAs with the current antibody. A possible reason might be low expression of this marker; however, this hampers the potential for clinical implementation. Another potential predictive marker identified from the proteomic screen, ANK3, has not been extensively described in cancer. It plays an important role in axon initiation and functions as an anchorage between membrane and cytoskeleton. 48 Even though we validated this protein as upregulated in our cell-line model, it was not a prognostic marker in our gemcitabine treated cohort. Of note, ANK3 has different isoforms and our western blot analysis showed multiple bands. Unfortunately, multiple bands are well-known issues of antibody-based validation. This might also explain why we could not validate the predictive results of ANK3 in our clinical data. These results also highlight the limitations of this study, namely the caution that is desired with a discovery analysis on a cell-line model instead of patient material. However, by implementation of clinical validation cohorts treated by gemcitabine monotherapy, an additional confirmation has been performed to conclude our clinically relevant findings.
The lethality of PDAC remains a problem to be solved in the upcoming decades. Our findings support the current trend towards combination therapy for the treatment of patients suffering from pancreatic cancer. Chemotherapeutic regimens for PDAC have recently shifted towards combination of multiple cytotoxic agents. Landmark trials have indeed demonstrated significant improvements in survival when gemcitabine was supplemented with nab-paclitaxel 28 or substituted for the more aggressive FOLFIRINOX (folic acid, fluorouracil, irinotecan, oxaliplatin) combination. 2 A shift towards combination treatment in the adjuvant setting is currently tested in clinical trials. Addition of capecitabine to the backbone of adjuvant gemcitabine was shown to increase the survival benefit by an additional 3 months. 49 Also, the Unicancer GI PRODIGE 24/CCTG PA.6 study recently showed an increase in OS of almost 20 months for adjuvant treatment with FOLFIRINOX. 50 Addition of nab-paclitaxel to gemcitabine after resection is currently being evaluated (ClinicalTrials.gov identifier: NCT02023021). Part of the success of combination therapy might be, as our results imply, due to cytotoxic effect of resistant cells by additional chemotherapeutics. Although promising results of FOLFIRINOX in attacking PDAC, gemcitabine-based therapy remains commonly advised as second-line therapy and for patients with reduced physical reserve. 51 Thus, gemcitabine resistance still needs be addressed in the upcoming years.
The present study has several limitations. Firstly, our most promising marker MAP2 was identified in only a cell-line resistance model. Additional models and knock-out experiments would be of interest to evaluate and validate the role of MAP2 in gemcitabine resistance into depth. To overcome the scarcity of gemcitabine-resistance models, we validated our result in two PDAC patient cohorts and a panel of cell lines. Additionally, we had a relatively low yield of xenograft tumours from the original PANC1 cells. This might be caused by the use of a nude mice strain, which retains a native immune response. However, the exceptional take rate of our gemcitabine-resistant cells is thereby emphasized. Finally, since multiple new drug regimens are under development for the treatment of PDAC, correlation as a predictive marker for other cytostatic agents would enhance the importance of our findings.
Conclusion
By the use of powerful high-throughput proteomic techniques, we unravelled new differentially expressed proteins in a gemcitabine-resistant model of PDAC, including MAP2. Expression of this protein was correlated with a worse clinical outcome in patients with PDAC treated with gemcitabine. Further, we obtained preclinical data, in vitro and in vivo, showing that (nab-)/paclitaxel was effective against resistant/MAP2-overexpression cells, supporting new studies on this biomarker both to predict gemcitabine resistance and to guide better therapeutic choices.
Supplemental Material
supplemental_figure_2_ – Supplemental material for Proteomic analysis of gemcitabine-resistant pancreatic cancer cells reveals that microtubule-associated protein 2 upregulation associates with taxane treatment
Supplemental material, supplemental_figure_2_ for Proteomic analysis of gemcitabine-resistant pancreatic cancer cells reveals that microtubule-associated protein 2 upregulation associates with taxane treatment by Tessa Ya Sung Le Large, Btissame El Hassouni, Niccola Funel, Bart Kok, Sander R. Piersma, Thang V. Pham, Kenneth P. Olive, Geert Kazemier, Hanneke W.M. van Laarhoven, Connie R. Jimenez, Maarten F. Bijlsma and Elisa Giovannetti in Therapeutic Advances in Medical Oncology
Supplemental Material
supplemental_figure_3 – Supplemental material for Proteomic analysis of gemcitabine-resistant pancreatic cancer cells reveals that microtubule-associated protein 2 upregulation associates with taxane treatment
Supplemental material, supplemental_figure_3 for Proteomic analysis of gemcitabine-resistant pancreatic cancer cells reveals that microtubule-associated protein 2 upregulation associates with taxane treatment by Tessa Ya Sung Le Large, Btissame El Hassouni, Niccola Funel, Bart Kok, Sander R. Piersma, Thang V. Pham, Kenneth P. Olive, Geert Kazemier, Hanneke W.M. van Laarhoven, Connie R. Jimenez, Maarten F. Bijlsma and Elisa Giovannetti in Therapeutic Advances in Medical Oncology
Supplemental Material
supplemental_table_1D – Supplemental material for Proteomic analysis of gemcitabine-resistant pancreatic cancer cells reveals that microtubule-associated protein 2 upregulation associates with taxane treatment
Supplemental material, supplemental_table_1D for Proteomic analysis of gemcitabine-resistant pancreatic cancer cells reveals that microtubule-associated protein 2 upregulation associates with taxane treatment by Tessa Ya Sung Le Large, Btissame El Hassouni, Niccola Funel, Bart Kok, Sander R. Piersma, Thang V. Pham, Kenneth P. Olive, Geert Kazemier, Hanneke W.M. van Laarhoven, Connie R. Jimenez, Maarten F. Bijlsma and Elisa Giovannetti in Therapeutic Advances in Medical Oncology
Supplemental Material
Supplemental_table_1E – Supplemental material for Proteomic analysis of gemcitabine-resistant pancreatic cancer cells reveals that microtubule-associated protein 2 upregulation associates with taxane treatment
Supplemental material, Supplemental_table_1E for Proteomic analysis of gemcitabine-resistant pancreatic cancer cells reveals that microtubule-associated protein 2 upregulation associates with taxane treatment by Tessa Ya Sung Le Large, Btissame El Hassouni, Niccola Funel, Bart Kok, Sander R. Piersma, Thang V. Pham, Kenneth P. Olive, Geert Kazemier, Hanneke W.M. van Laarhoven, Connie R. Jimenez, Maarten F. Bijlsma and Elisa Giovannetti in Therapeutic Advances in Medical Oncology
Supplemental Material
Supplemental_table_1F – Supplemental material for Proteomic analysis of gemcitabine-resistant pancreatic cancer cells reveals that microtubule-associated protein 2 upregulation associates with taxane treatment
Supplemental material, Supplemental_table_1F for Proteomic analysis of gemcitabine-resistant pancreatic cancer cells reveals that microtubule-associated protein 2 upregulation associates with taxane treatment by Tessa Ya Sung Le Large, Btissame El Hassouni, Niccola Funel, Bart Kok, Sander R. Piersma, Thang V. Pham, Kenneth P. Olive, Geert Kazemier, Hanneke W.M. van Laarhoven, Connie R. Jimenez, Maarten F. Bijlsma and Elisa Giovannetti in Therapeutic Advances in Medical Oncology
Supplemental Material
Supplemental_table_2 – Supplemental material for Proteomic analysis of gemcitabine-resistant pancreatic cancer cells reveals that microtubule-associated protein 2 upregulation associates with taxane treatment
Supplemental material, Supplemental_table_2 for Proteomic analysis of gemcitabine-resistant pancreatic cancer cells reveals that microtubule-associated protein 2 upregulation associates with taxane treatment by Tessa Ya Sung Le Large, Btissame El Hassouni, Niccola Funel, Bart Kok, Sander R. Piersma, Thang V. Pham, Kenneth P. Olive, Geert Kazemier, Hanneke W.M. van Laarhoven, Connie R. Jimenez, Maarten F. Bijlsma and Elisa Giovannetti in Therapeutic Advances in Medical Oncology
Supplemental Material
Supplementary_Table_1A – Supplemental material for Proteomic analysis of gemcitabine-resistant pancreatic cancer cells reveals that microtubule-associated protein 2 upregulation associates with taxane treatment
Supplemental material, Supplementary_Table_1A for Proteomic analysis of gemcitabine-resistant pancreatic cancer cells reveals that microtubule-associated protein 2 upregulation associates with taxane treatment by Tessa Ya Sung Le Large, Btissame El Hassouni, Niccola Funel, Bart Kok, Sander R. Piersma, Thang V. Pham, Kenneth P. Olive, Geert Kazemier, Hanneke W.M. van Laarhoven, Connie R. Jimenez, Maarten F. Bijlsma and Elisa Giovannetti in Therapeutic Advances in Medical Oncology
Supplemental Material
supplementary_table_1B – Supplemental material for Proteomic analysis of gemcitabine-resistant pancreatic cancer cells reveals that microtubule-associated protein 2 upregulation associates with taxane treatment
Supplemental material, supplementary_table_1B for Proteomic analysis of gemcitabine-resistant pancreatic cancer cells reveals that microtubule-associated protein 2 upregulation associates with taxane treatment by Tessa Ya Sung Le Large, Btissame El Hassouni, Niccola Funel, Bart Kok, Sander R. Piersma, Thang V. Pham, Kenneth P. Olive, Geert Kazemier, Hanneke W.M. van Laarhoven, Connie R. Jimenez, Maarten F. Bijlsma and Elisa Giovannetti in Therapeutic Advances in Medical Oncology
Supplemental Material
supplementary_table_1C – Supplemental material for Proteomic analysis of gemcitabine-resistant pancreatic cancer cells reveals that microtubule-associated protein 2 upregulation associates with taxane treatment
Supplemental material, supplementary_table_1C for Proteomic analysis of gemcitabine-resistant pancreatic cancer cells reveals that microtubule-associated protein 2 upregulation associates with taxane treatment by Tessa Ya Sung Le Large, Btissame El Hassouni, Niccola Funel, Bart Kok, Sander R. Piersma, Thang V. Pham, Kenneth P. Olive, Geert Kazemier, Hanneke W.M. van Laarhoven, Connie R. Jimenez, Maarten F. Bijlsma and Elisa Giovannetti in Therapeutic Advances in Medical Oncology
Supplemental Material
suppl_fig4_ – Supplemental material for Proteomic analysis of gemcitabine-resistant pancreatic cancer cells reveals that microtubule-associated protein 2 upregulation associates with taxane treatment
Supplemental material, suppl_fig4_ for Proteomic analysis of gemcitabine-resistant pancreatic cancer cells reveals that microtubule-associated protein 2 upregulation associates with taxane treatment by Tessa Ya Sung Le Large, Btissame El Hassouni, Niccola Funel, Bart Kok, Sander R. Piersma, Thang V. Pham, Kenneth P. Olive, Geert Kazemier, Hanneke W.M. van Laarhoven, Connie R. Jimenez, Maarten F. Bijlsma and Elisa Giovannetti in Therapeutic Advances in Medical Oncology
Supplemental Material
suppl_fig5_ – Supplemental material for Proteomic analysis of gemcitabine-resistant pancreatic cancer cells reveals that microtubule-associated protein 2 upregulation associates with taxane treatment
Supplemental material, suppl_fig5_ for Proteomic analysis of gemcitabine-resistant pancreatic cancer cells reveals that microtubule-associated protein 2 upregulation associates with taxane treatment by Tessa Ya Sung Le Large, Btissame El Hassouni, Niccola Funel, Bart Kok, Sander R. Piersma, Thang V. Pham, Kenneth P. Olive, Geert Kazemier, Hanneke W.M. van Laarhoven, Connie R. Jimenez, Maarten F. Bijlsma and Elisa Giovannetti in Therapeutic Advances in Medical Oncology
Supplemental Material
suppl_fig_1_10-12-2018 – Supplemental material for Proteomic analysis of gemcitabine-resistant pancreatic cancer cells reveals that microtubule-associated protein 2 upregulation associates with taxane treatment
Supplemental material, suppl_fig_1_10-12-2018 for Proteomic analysis of gemcitabine-resistant pancreatic cancer cells reveals that microtubule-associated protein 2 upregulation associates with taxane treatment by Tessa Ya Sung Le Large, Btissame El Hassouni, Niccola Funel, Bart Kok, Sander R. Piersma, Thang V. Pham, Kenneth P. Olive, Geert Kazemier, Hanneke W.M. van Laarhoven, Connie R. Jimenez, Maarten F. Bijlsma and Elisa Giovannetti in Therapeutic Advances in Medical Oncology
Supplemental Material
suppl_fig_6 – Supplemental material for Proteomic analysis of gemcitabine-resistant pancreatic cancer cells reveals that microtubule-associated protein 2 upregulation associates with taxane treatment
Supplemental material, suppl_fig_6 for Proteomic analysis of gemcitabine-resistant pancreatic cancer cells reveals that microtubule-associated protein 2 upregulation associates with taxane treatment by Tessa Ya Sung Le Large, Btissame El Hassouni, Niccola Funel, Bart Kok, Sander R. Piersma, Thang V. Pham, Kenneth P. Olive, Geert Kazemier, Hanneke W.M. van Laarhoven, Connie R. Jimenez, Maarten F. Bijlsma and Elisa Giovannetti in Therapeutic Advances in Medical Oncology
Footnotes
Acknowledgements
We would like to acknowledge Steve Sastra and Carmine Palermo for their assistance with mouse experiments and the patients for participating in the study. Further, we would like to acknowledge Dr M. Bugiani from the Department of Pathology (VU University Medical Center) for the FFPE material from the tissues of the brain cortex.
Connie R. Jimenez, Maarten F. Bijlsma and Elisa Giovannetti contributed equally to this work.
TLL performed proteomic analysis, experimental work and wrote the manuscript. BEH and GK assisted with experimental work. NF performed immunohistochemistry and clinical data analysis. SRP and TVP were responsible for experimental design, MS/MS and bioinformatic analysis. KPOO, GK and HWML designed experiments and reviewed the manuscript. CRJ, MFB, EG were responsible for experimental design and helped to write the manuscript.
Funding
This work was supported by the Cancer Center Amsterdam (Alliantie-AIO grant September 2014, the Netherlands), the Bennink Foundation (the Netherlands), Italian Association for Cancer Research (AIRC/Start-Up, Italy), Lisa Waller Hayes Foundation (the Netherlands), KWF Dutch Cancer Society (KWF project 10212 and 10401, the Netherlands) and NIH (1R01CA215607 and1R21CA188857).
Conflict of interest statement
MFB has received research funding from Celgene for a different study. This party was not involved in designing the study or drafting the manuscript.
Ethics approval and consent to participate
The animal study has been approved by the Institutional Animal Care and Use Committee of the Columbia University (IACUC number AC-AAAQ1415). The study of clinical cohorts has been approved by the local medical ethical committee of Pisa University (Medical Ethical number 3909). The study was performed in accordance with the Declaration of Helsinki.
Availability of data and material
Raw proteomics data has been deposited on ProteomeXchange under accession PXD010112.
Supplemental material
Supplemental material for this article is available online.
References
Supplementary Material
Please find the following supplemental material available below.
For Open Access articles published under a Creative Commons License, all supplemental material carries the same license as the article it is associated with.
For non-Open Access articles published, all supplemental material carries a non-exclusive license, and permission requests for re-use of supplemental material or any part of supplemental material shall be sent directly to the copyright owner as specified in the copyright notice associated with the article.