
Abstract
Background:
Oral cancer metastasis is a devastating process that contributes to poor prognosis and high mortality, yet its detailed underlying mechanisms remain unclear. Here, we aimed to evaluate metastasis-specific markers in oral cancer and to provide comprehensive recognition concerning functional roles of the specific target in oral cancer metastasis.
Methods:
Lectin, galactoside-binding, soluble, 1 (LGALS1) was identified by secretomic analysis. LGALS1 expression of patient samples with oral cancer on the tissue microarray were examined by immunochemical (IHC) staining. Small interfering RNA (siRNA)-mediated knockdown of LGALS1 revealed the role of LGALS1 in oral cancer metastasis in vitro and in vivo.
Results:
LGALS1 was observed to be upregulated in highly invasive oral cancer cells, and elevated LGALS1 expression was correlated with cancer progression and lymph node metastasis in oral cancer tissue specimens. Functionally, silencing LGALS1 resulted in suppressed cell growth, wound healing, cell migration, and cell invasion in oral cancer cells in vitro. Knockdown of LGALS1 in highly invasive oral cancer cells dramatically inhibited lung metastasis in an in vivo mouse model. Mechanistic studies suggested p38 mitogen-activated protein kinase (MAPK) phosphorylation, upregulated MMP-9, and mesenchymal phenotypes of epithelial-mesenchymal transition (EMT) in highly invasive oral cancer cells, whereas siRNA against LGALS1 resulted in the inactivation of p38 MAPK pathway, downregulated MMP-9, and EMT inhibition.
Conclusions:
These findings demonstrate that elevated LGALS1 is strongly correlated with oral cancer progression and metastasis, and that it could potentially serve as a prognostic biomarker and an innovative target for oral cancer therapy.
Introduction
Oral cancer, the most prevalent among head and neck cancers, is the leading cause of cancer death worldwide. 1 More than 90% of cancers in the oral cavity are classified as oral squamous cell carcinoma (OSCC). In 2012, approximately 300,400 new cases occurred and 145,400 patients with oral cancer died worldwide. 2 Of all the types of cancers affecting males in Taiwan, oral cancer has established itself as the fourth highest in terms of mortality rates since 1995. 3 The incidence of oral cancer is associated with strong risk factors such as tobacco abuse, alcohol consumption, and chewing betel quid. Currently, the increasing rate of oral cancer incidence could be correlated with the growing population of betel quid chewers in Taiwan. The chronic irritant substance may potentially damage the buccal mucosa of the oral cavity and stimulate genetic or nongenetic effects for tumor initiation, promotion, and progression in oral cancer. 4
Metastasis is a complex process that promotes the dissemination of cancer cells from the primary tumor to distant sites. Cervical lymph node metastases (LNMs) is an essential malignancy criterion in oral cancer, and nearly 40% of patients with oral cancer suffered from lymph node metastatic tumors.5,6 Epidemiological data indicated that the 5-year survival rates of oral cancer patients were 80%, 70%, 56.9%, and 36.8% with stage I, II, III, and IV, respectively. 7 In Taiwanese medical centers, more than half of the oral cancer patients are diagnosed at stage III and stage IV, which is associated with a low overall 5-year survival rate.8,9 However, the process of metastasis in oral cancer remains the most enigmatic aspect of the disease.
Therefore, the discovery of novel and promising biomarkers related to metastasis for early diagnosis, prognosis and therapeutic information becomes imperative. 10 Secreted proteins, responsible for cell-to-cell and cell-to-extracellular matrix (ECM) interactions, are required for various physiological processes and are involved in the pathological processes of differentiation, invasion, metastasis and angiogenesis of cancers.11,12 Proteomic profiling is one of the most direct approaches for biomarker discovery generally utilized in secretomic analysis, which is based on two-dimensional difference gel electrophoresis (2D-DIGE) and matrix-assisted laser desorption/ionization time-of-flight mass spectrometry (MALDI-TOF MS), providing a powerful platform for the discovery of metastasis-specific biomarkers.
Lectin, galactoside-binding, soluble, 1 (LGALS1) is a β-galactoside-binding protein that recognizes glycoconjugates which are displayed on cell surfaces and extracellular matrices. 13 Secreted LGALS1 is highly expressed in almost all types of malignant tumor cells, and plays a pivotal pro-tumorigenic role within the tumor microenvironment. 14 The expression of LGALS1 has been well recognized in several different tumor types including prostate, thyroid, bladder, and ovarian carcinomas. 15
Intriguingly, the expression of LGALS1 was shown to be associated with the aggressiveness of tumors and the procurement of the metastatic phenotype; however, its effect on the disease outcome still remains elusive. Therefore, it is necessary to evaluate the role of the secreted LGALS1 in cancer progression and metastasis, and investigating the underlying metastatic mechanisms in oral cancer.
Materials and methods
Chemicals and reagents
Fluorescent dyes (Cy2, Cy3, and Cy5) and reagents for 2D-DIGE were purchased from GE Healthcare (Uppsala, Sweden). Lipofectamine® RNAiMAX Transfection Reagent and OPTI-MEM were purchased from Invitrogen (Waltham, MA, USA). MTT (3-(4,5-Dimethylthiazol-2-yl)-2,5-diphenyltetrazolium bromide) was purchased from USB Corp. (Cleveland, OH, USA). Propidium iodide (PI) was purchased from Sigma-Aldrich (St. Louis, MO, USA). Recombinant human LGALS1 protein (rhLGALS1) was purchased from BioLegend, Inc. (San Diego, CA, USA). LGALS1, cyclin A2, cdk2, phosphor-ERK (Thr202), MMP-9, MMP-3, ZEB2, SNAI1, TWIST, E-cadherin, N-cadherin, and vimentin primary antibodies were purchased from Genetex Inc. (Hsinchu, Taiwan). Phospho-p38 MAPK (Thr180/Tyr182) and p38 MAPK primary antibodies were purchased from Cell Signaling Technology (Danvers, MA, USA). Cyclin D2, cdk4, cyclin E, and p27 primary antibodies were purchased from Santa Cruz Biotechnology, Inc. (Dallas, TX, USA). ERK1/2 primary antibody was purchased from Promega Corp. (Madison, WI, USA). Anti-rabbit and anti-mouse immunoglobulin (Ig)G secondary antibodies were purchased from Jackson ImmunoResearch Laboratories, Inc. (West Grove, PA, USA). All the chemicals and reagents used in this study were of analytic grade.
Cell lines and cell cultures
Human oral cancer cell lines, OC3 16 and CGHNC9 (C9), 17 were both derived from patients with OSCC and the highly invasive oral cancer cell lines, OC3-IV2 and C9-IV2, were selected in vivo. 18 All of the human oral cancer cell lines were obtained from Prof. Lu-Hai Wang, China Medical University, Taiwan. OC3 and OC3-IV2 cells were maintained in a 1:1 mixture of Dulbecco’s modified Eagle’s medium (DMEM) and keratinocyte serum-free medium supplemented with 10% fetal bovine serum (FBS) and 1% penicillin-streptomycin. C9 and C9-IV2 cells were maintained in DMEM with 10% FBS and 1% penicillin-streptomycin. (all from Gibco-Invitrogen Corp., Paisley, UK). All cells were incubated at 37°C with 5% CO2.
Sample preparation and 2D-DIGE-based secretomic analysis
Approximately 9 × 10⁶ cells were seeded into 15-cm cell culture dishes for each cell line condition. After an overnight incubation, the media was discarded, and the cells were rinsed thrice with phosphate-buffered saline (PBS). Serum-free medium was subsequently added, and the cells were incubated for an additional 30 h, following which the media was collected and filtered through 0.45 μm microfilters to remove cell debris. Next, the filtered media was concentrated 1000-fold with 10-kDa molecular mass cutoff concentrators (Millipore, Billerica, MA, USA). The concentrated media were precipitated by adding 1 volume of 100% TCA stock to 4 volumes of protein sample, and then incubated for 10 min at 4°C. After the proteins were precipitated by centrifugation at 13,000 rpm for 10 min, the resulting pellets were washed twice with ice-cold acetone. Finally, the air-dried pellets were resuspended in lysis buffer for 2D-DIGE analysis. The detailed experimental procedures for 2D-DIGE analysis were performed as described. 19
Oral cancer tissue microarray and immunohistochemistry (IHC)
LGALS1 expression in oral cancer was observed using the tissue microarray, OR802, purchased from US Biomax, Inc. (Derwood, MD, USA). For immunochemical staining of LGALS1 within the tissue array slide, specimens were incubated with anti-LGALS1 antibody (Genetex). The staining intensity of LGALS1 was measured and analyzed via the ImageJ software (National Institute of Health, Bethesda, MD, USA).
siRNA design and transfection
The small interfering RNA (siRNA) against LGALS1 was designed and synthesized by Invitrogen Corp. (Waltham, MA, USA). The targeting sequence against LGALS1 was 5’-ACC UGA AUC UCA AAC CUG GAG AGU G-3’. The targeting sequence against p38 MAPK was 5’-CCU AAA ACC UAG UAA UCU ATT -3’. When cells were 50% confluent, transfection was mediated using the Lipofectamine® RNAiMAX Transfection Reagent (Invitrogen) according to the manufacturer’s instructions. In brief, the cells were transfected with 40 nM of LGALS1 siRNA (siLGALS1) or p38 MAPK siRNA (sip38 MAPK) or the corresponding negative control (siCtrl; GE Healthcare Dharmacon Inc., Lafayette, CO, USA) in OPTI-MEM medium (Invitrogen) containing Lipofectamine® for 8 h. The cells then recovered in fresh complete medium for at least 24 h. The efficiency of the siRNA knockdown was monitored with immunoblotting analysis.
Proliferation assay
Proliferation assays were performed in vitro using MTT (USB Corp.). The cells were trypsinized and seeded into 96-well plates at a density of 1 × 10⁴ cells per well. After a 24-h incubation (Day 0), the media was removed, and the cells were incubated in 100 μl of MTT solution (1 mg/ml) per well for 4 h at 37°C. The supernatant was then discarded and 100 μl of dimethyl sulfoxide (DMSO) was added per well. After the 96-well plates were shaken for 5 min to dissolve the insoluble formazan, the absorbance was measured by an enzyme-linked immunosorbent assay (ELISA) reader at 545 nm. The cell growth in each experimental group was determined by a similar method after 48 h (Day 1), 72 h (Day 2), and 96 h (Day 3). The proliferation rates were shown as a value relative to Day 0.
Flow cytometry for cell cycle analysis
Cells (1 × 10⁶) were trypsinized from the dish and collected via centrifugation. After the cells were resuspended in 320 μl of PBS, 880 μl of 95% ethanol was gently added into the tube while the cell suspension was vortexed at a slow speed. The cells were then incubated overnight at 4°C for fixation. The next day, the ethanol was removed, and the cells were washed twice with PBS. The cell pellet was subsequently resuspended in PI staining solution (20 μg/ml PI and 100 μg/ml RNase A in PBS) and incubated at room temperature for 20 min in the dark. The stained samples were analyzed using the BD Accuri™ C6 Flow Cytometer (BD Biosciences, San Jose, CA, USA). CFlow Plus analysis software (BD Biosciences) was used for further analysis of the collected data.
Scratch wound healing assay
Cells were seeded into 12-well plates at a density of 5 × 10⁵ cells per well. After 24 h of incubation, scratched wounds were made using sterile 10 μl pipette tips through a pre-marked line. The cells were rinsed twice with PBS and complete medium was subsequently added per well. The specific wound areas, over or under pre-marked lines, were displayed at 0 h, 8 h, 12 h, and 24 h by taking images under the optical microscope (Carl Zeiss, Germany) at 100 × magnification. The wound areas were quantified and analyzed using the AxioVision Rel. 4.8 software (Carl Zeiss).
Transwell migration and matrigel invasion assay
SPL cell culture insert systems with polyethylene terephthalate (PET) membranes containing 8-μm pores (SPL Life Sciences Corp., Korea) were used to examine cell migration and invasion. Cells (1 × 10⁵) in serum-free medium were seeded into the upper chamber, while complete medium supplemented with 10% FBS was added into the lower chambers to attract migratory cells. The cells were incubated for 20 h at 37°C, and the number of cells that migrated through the membrane to the underside was determined by crystal violet staining. Cells that were able to pass through the membrane were observed at a 40 × magnification using optical microscope (Carl Zeiss, Germany). The crystal violet-stained migratory cells on the underside of the PET membrane were suspended in ethanol-water mixtures, and the absorbance was measured using an ELISA reader at 595 nm. For matrigel invasion assay preparation, the upper chambers with the PET membrane containing the 8-μm pores were coated with Matrigel™ (BD Biosciences, San Jose, CA, USA) diluted with 3 volumes of serum-free medium. The cells were seeded in the upper chamber at a density of 3 × 10⁵ cells in serum-free medium and incubated for 22 h at 37°C. The steps that followed were the same as those described for the transwell migration assay.
Metastasis assays in mouse models
All animal experiments were performed in accordance with the Institutional Animal Care and Use Committee (IACUC) guidelines and approved by the IACUC (Approval No.: 10657) of National Tsing Hua University. A xenograft model of tail vein injection in mice was performed to assess metastatic activity in vivo. C9-IV2 cells were transfected with 40 nM of siCtrl or siLGALS1. After 48 h of incubation, 3 × 10⁵ cells per mouse were resuspended in 100 μl of PBS and injected intravenously into the lateral tail veins of 6- to 8-week-old female CB17-SCID mice (BioLASCO, Taiwan). All the mice were euthanized 2.5 months later. Lung tissues were harvested and examined for lung metastases using hematoxylin and eosin (H&E) staining and quantitative polymerase chain reaction (qPCR). The injected cells in the lung tissues were determined by specific qPCR primers for human glyceraldehyde-3-phosphate dehydrogenase (GAPDH), while mouse actin mRNA served as the internal control.
Immunoblotting analysis
Protein samples were separated via 12% 1D-SDS-PAGE and transferred to polyvinylidene difluoride (PVDF) membranes (Pall Corp., Port Washington, NY, USA). After the membranes were blocked with 5% (w/v) skimmed milk or bovine serum albumin in Tris-buffered saline with Tween-20 (TBST; 50 mM Tris, 150 mM NaCl, and 0.1% Tween-20 (v/v); pH 8.0) for 1 h, the primary antibodies were probed onto the membranes overnight at 4°C. Next, the membranes were washed in TBST (4 × 10 min) followed by incubation in TBST solution containing appropriate horseradish peroxidase-coupled secondary antibodies (Jackson ImmunoResearch Laboratories, Inc.) for 1 h. The membranes were then washed in TBST again (6 × 10 min), and the immunoprobed proteins were visualized using an enhanced chemiluminescence method (Visual Protein Biotech Corp., Taiwan).
Treatment of cells with recombinant human LGALS1
Cells were maintained in serum-free medium for 24 h. After incubation, the cells were either subjected to a 45-minute treatment with 200 ng/ml recombinant human LGALS1 proteins or were left untreated. Whole cell extracts were prepared in the lysis buffer for immunoblotting analysis. Recombinant human LGALS1 protein at concentration of 500 ng/ml was added into the upper chambers for transwell migration assay.
Statistical analysis
Data are presented as mean ± standard error of the mean (SEM). Differences between the experimental groups were assessed using a paired Student’s t test or a one-way analysis of variance followed by Tukey’s multiple comparison test. Test results with p < 0.05 were considered statistically significant.
Results
Identification of upregulated LGALS1 in highly invasive oral cancer cells via secretomic analysis
To monitor the metastatic potential of oral cancer cells, highly invasive oral cancer cell lines were established by in vivo selection. OC3 and C9 cells were induced into CB17-SCID mice via tail vein injection, followed by selection for two cycles. The isogenic OC3-IV2 and C9-IV2 cell lines were isolated from the lung metastases of the CB17-SCID mice. 18 Confirming the migration and invasiveness of the isogenic cell lines, the relative migration and invasive ability of the OC3-IV2 cells significantly increased when compared to the OC3 cells [Figure S1(a), (b)]. Additionally, high-throughput secretomic analysis of parental OC3 and isogenic OC3-IV2 cells was performed. The 2D-DIGE images of differentially expressed protein profiles are also shown in Figure 1(a). DeCyder™ analysis revealed that 211 proteins displayed differential expression with respect to the set values [average ratio ⩾2-fold or ⩽−2-fold; p < 0.05; Figure 1(b)]. We finally identified proteins in 158 of these features via MALDI-TOF MS (Table S1). Among these identified proteins, LGALS1 was found to be upregulated in OC3-IV2 cells based on 2D gel patterns, 3D images, and statistical data [Figure 1(c)]. To further clarify the LGALS1 protein expression identified via MALDI-TOF MS, immunoblotting analysis was performed to reveal the expression level of the secreted LGALS1. The expression of the secreted LGALS1 in OC3-IV2 cells was greater than that in OC3 cells [Figure 1(e), top]. Additionally, LGALS1 protein expression, normalized to whole secreted proteins [Figure 1(d)], was statistically analyzed and shown to be significantly increased in OC3-IV2 cells when compared to parental OC3 cells [Figure 1(e), bottom]. These results not only strengthen the data obtained by the 2D-DIGE analysis, but also suggest that secreted LGALS1 is overexpressed in highly invasive oral cancer cells.
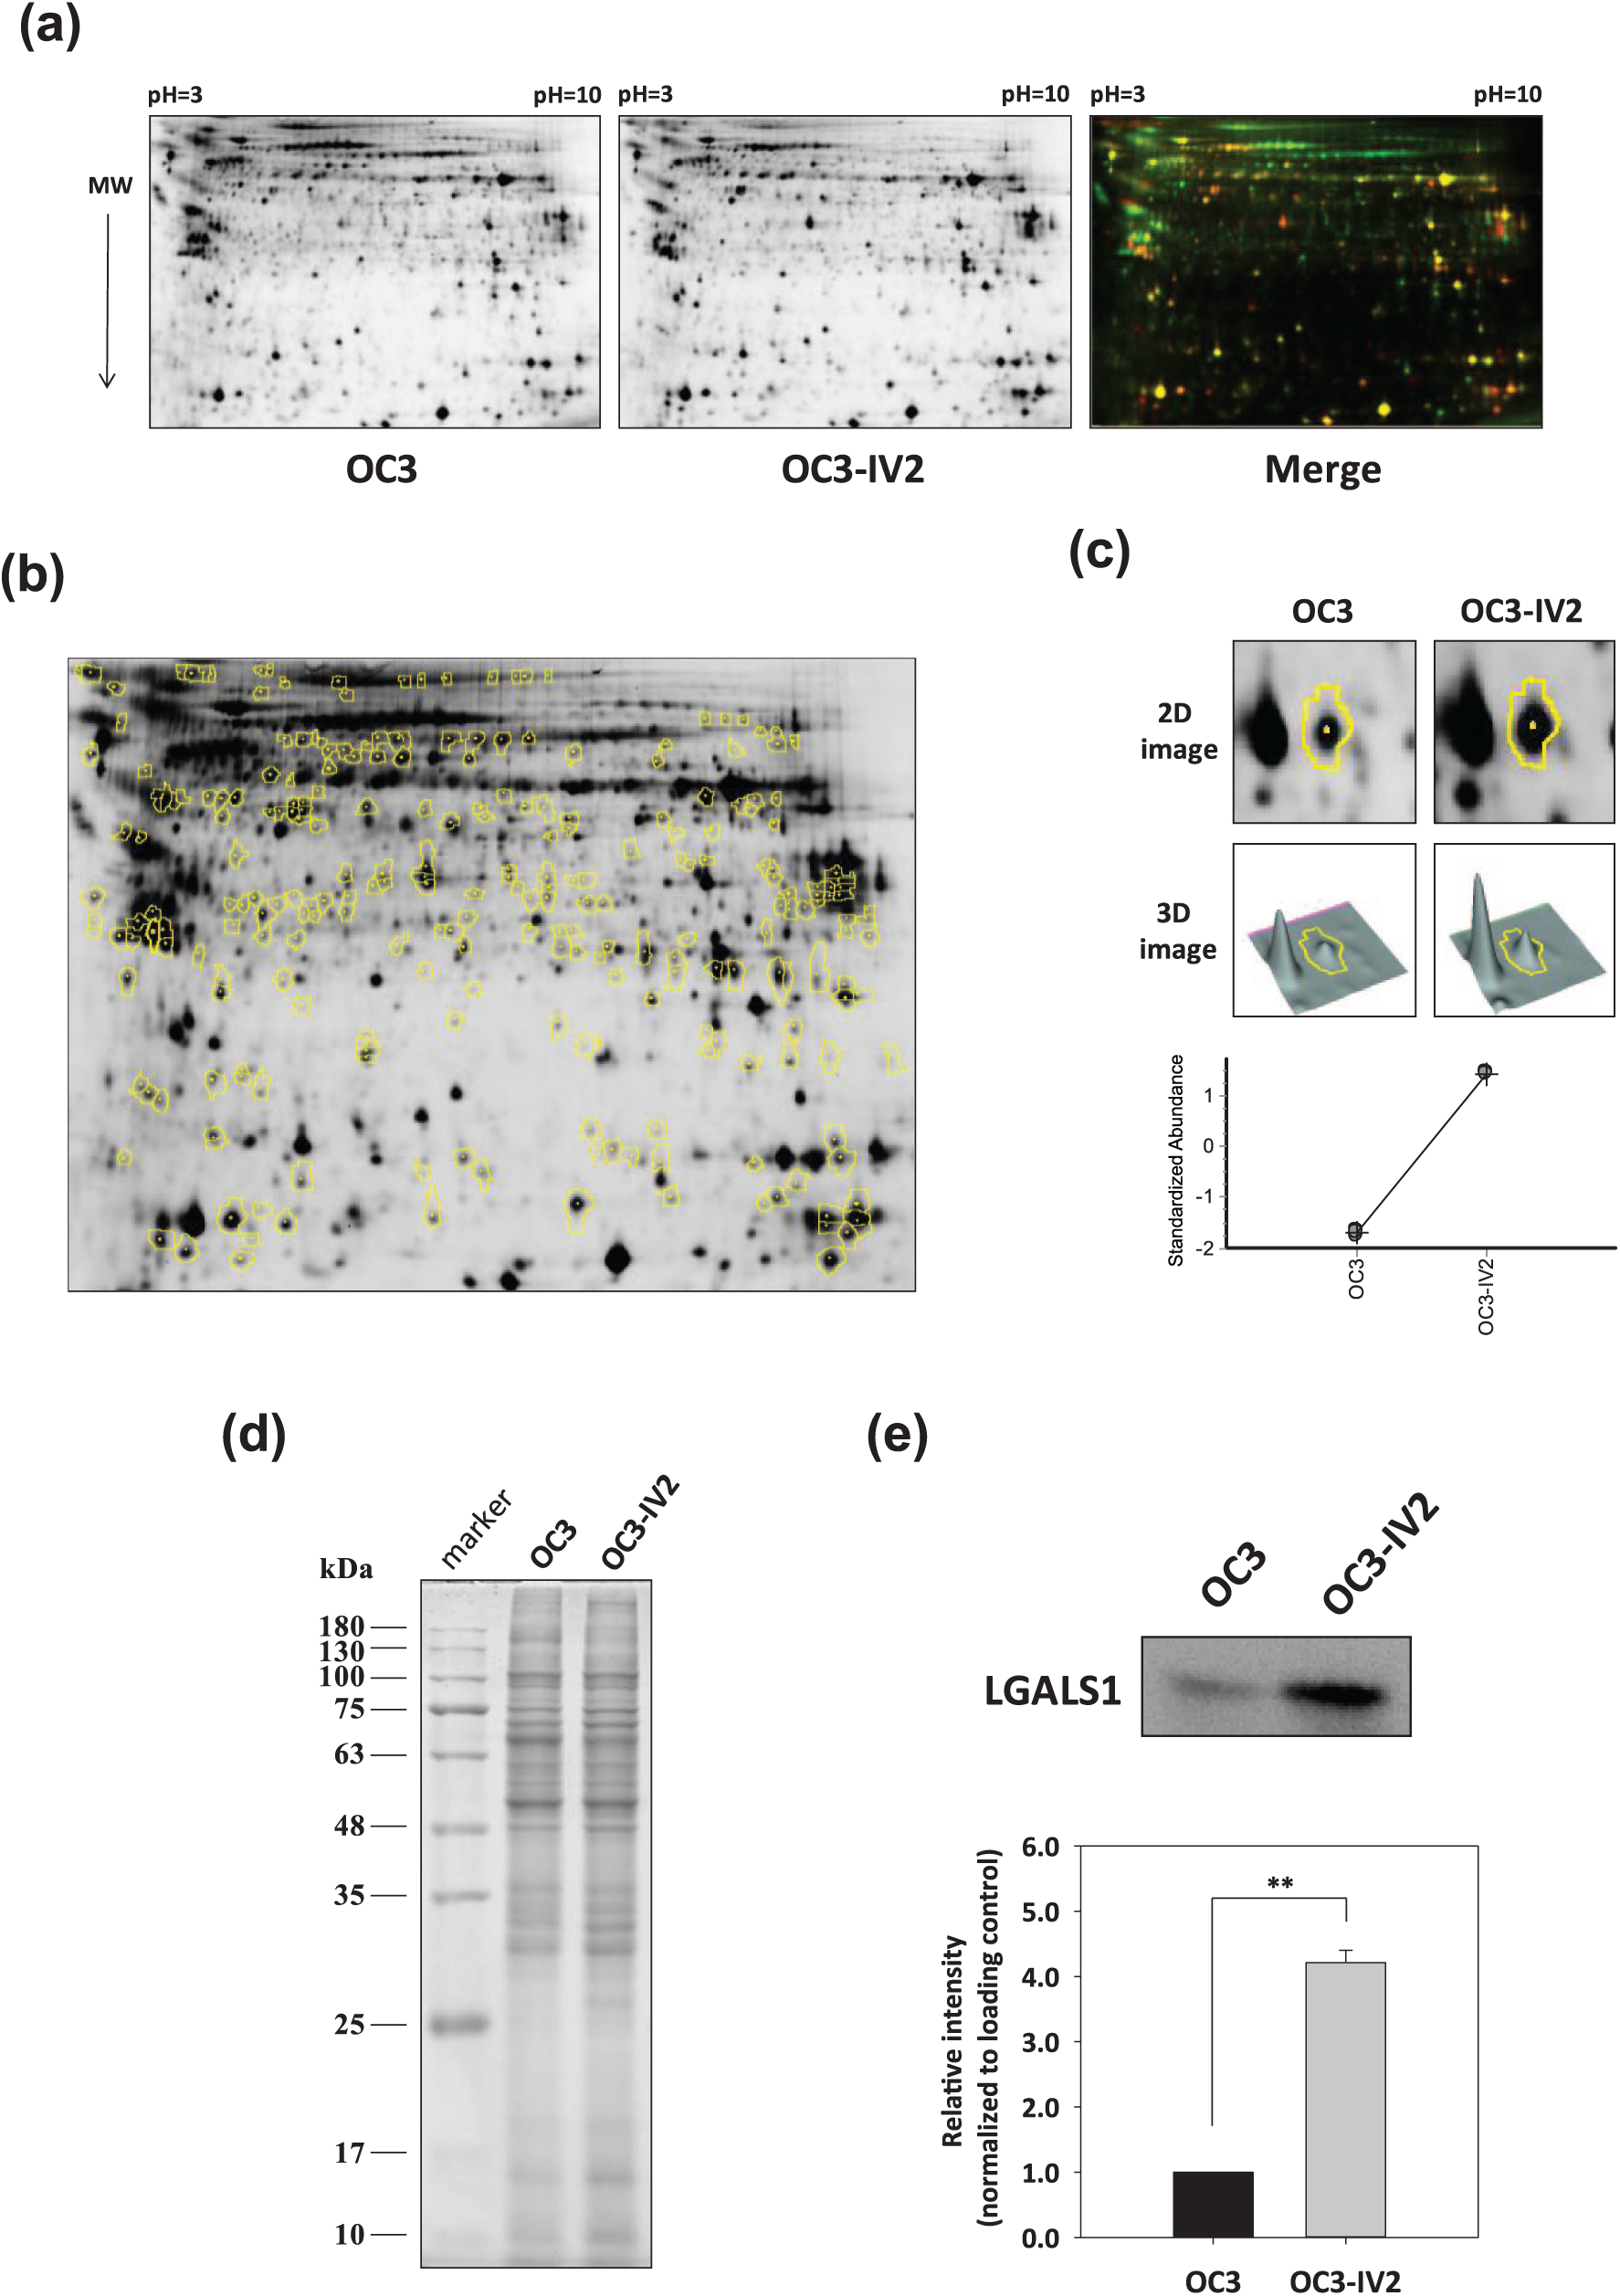
Secretomic analysis of metastasis-related differentially expressed proteins in oral cancer cells. (a) After sample preparation of each cell condition, protein samples were lysed and arranged for a triplicate 2D-DIGE experiment. The black and white images are shown as the protein profiles of the OC3 and OC3-IV2 cells. Differentially expressed proteins are indicated as red or green spots in the overlaid pseudo-colored image. (b) Numerous protein spots annotated with yellow circles represent the differentially expressed proteins with greater than 2-fold or lesser than −2-fold differences using the DeCyder™ software. (c) Upregulated LGALS1 in OC3-IV2 cells was revealed according to the 2D image, 3D image, and statistical data from the DeCyder™ analysis. (d) There is no specific loading control for secreted proteins. The whole secreted proteins were used as protein loading control. (e) Top: validation by immunoblotting analysis between OC3 and OC3-IV2 cells. Bottom: relative LGALS1 expression was quantified and normalized with respect to the loading control. Data derived from three independent experiments are presented as mean ± SEM. **, p < 0.01 when compared to OC3.
Elevated LGALS1 is correlated with oral cancer progression especially in lymph node metastases of oral cancer
We revealed the upregulation of LGALS1 in highly invasive oral cancer cells. This result compelled us to investigate the association of LGALS1 expression with the progression and metastasis of oral cancer in tissue specimens. We performed IHC staining of oral cancer tissue arrays and analyzed LGALS1 expression. Weak expression of LGALS1 was observed in normal/adjacent normal tissues, whereas LNMs displayed significantly strong LGALS1 expression [Figure 2(a)]. To determine its expression in all microarray cases, LGALS1 expression was quantified based on overall staining intensity. No statistical difference in LGALS1 expression was observed between normal/adjacent normal tissues (n = 10) and malignant tumors (n = 42), but LGALS1 staining intensity was distinctly increased in malignant tumors when compared to normal/adjacent normal tissues [Figure 2(b)]. LNMs (n = 4) exhibited a significantly higher expression of the LGALS1 protein when compared to malignant tumors and normal/adjacent normal tissues [p < 0.05 and p < 0.01, respectively; Figure 2(b); Table S2]. The overexpressed LGALS1 in lymph node metastasis agreed with our findings that indicated the presence of upregulated LGALS1 in highly invasive oral cancer cells, implying that LGALS1 possibly played a crucial role in oral cancer progression and metastasis. The data suggested that LGALS1 overexpression was proportional to the invasiveness and metastasis of oral cancer, and that it could act as a potential prognostic marker for oral cancer metastasis.

LGALS1 protein expression in tissue specimens of oral cancer. (a) Clinical tissue samples of oral cancer on the tissue microarray comprises of normal/adjacent normal tissue, malignant tumor, and lymph node metastatic tissue. LGALS1 expression was examined by immunochemical staining. From weak to strong, LGALS1 expression during different stages of the clinical samples (top, scale bar: 500 μm). The bottom images represent the magnification of the tissues (scale bar: 100 μm). (b) The LGALS1 staining intensity in normal/adjacent normal tissue (n = 10), malignant tumor (n = 42), and lymph node metastasis (n = 4) was assessed using ImageJ. Tukey’s post-hoc test for statistical analysis of LGALS1 expression was performed to clarify the role of LGALS1 in clinical samples. Data are represented as mean ± SEM. *, p < 0.05 when compared to the malignant tumor group and **, p < 0.01 when compared to the normal/adjacent normal tissue group.
siRNA-mediated LGALS1 knockdown reduces cell proliferation in oral cancer by inducing S phase arrest
To investigate the knockdown efficiency of LGALS1 in oral cancer cells, various concentrations of LGALS1 siRNA (siLGALS1) we used to determine its optimal concentration for transfection (data not shown). Oral cancer cells were transfected with 40 nM of control siRNA (siCtrl) or siLGALS1 and secreted LGALS1 expression was examined using immunoblotting analysis. As shown in Figure 3(a), LGALS1 protein expression in siLGALS1-transfected OC3 and OC3-IV2 cells decreased over 70% when compared to OC3 and OC3-IV2 cells transfected with siCtrl. Transfection of siLGALS1 also led to over 70% reduction of LGALS1 expression in C9 and C9-IV2 cells when compared to siCtrl-transfected C9 and C9-IV2 cells. LGALS1 overexpression was also observed in the highly invasive C9-IV2 cells [Figure 3(b)].

Effect of LGALS1 knockdown on cell proliferation and cell cycle regulation in oral cancer. (a, b) OC3, OC3-IV2, C9, and C9-IV2 cells were transfected with 40 nM of siCtrl or siLGALS1, and the secreted protein samples of each cell line were collected and concentrated from the conditioned medium. The knockdown efficiency of secreted LGALS1 was monitored via immunoblotting analysis. Coomassie blue images demonstrate the protein loading control. (c, d) Cell proliferation was observed from Day 0 to Day 3 using the MTT assay. The values of Day 1, Day 2, and Day 3 were normalized to Day 0. Data are represented as mean ± SEM. *, p < 0.05; **, p < 0.01; and ***, p < 0.001 when compared to siCtrl. (e, f) Representative plots of cell cycle analysis using a flow cytometer. siCtrl- or siLGALS1-transfected OC3 and OC3-IV2 cells were stained with PI to analyze DNA content. The percentage of cells in the G0/G1, S, and G2/M phases were displayed on the FL2-A fluorescent channel of the flow cytometer. The percentage of total cells at different stages were statistically analyzed on the right histogram. Data derived from three independent experiments are presented as mean ± SEM. *, p < 0.05; **, p < 0.01; and ***, p < 0.001 when compared to siCtrl. (g) Cell cycle regulatory proteins were differentially expressed in response to LGALS1 knockdown. Immunoblotting analysis of cyclin D2, cdk4, cyclin E, cyclin A2, cdk2, and p27 proteins in OC3 and OC3-IV2 cells transfected with control or LGALS1 siRNA was carried out. Immunoblotting results of the indicated proteins were quantified by ImageJ and normalized to GAPDH. The protein intensity values were relative to the siCtrl-transfected OC3 cells.
To monitor the effect of LGALS1 knockdown on oral cancer cell growth, MTT-based cell proliferation assay was performed from Day 0 to Day 3. The relative proliferation rates of siLGALS1-transfected OC3 and OC3-IV2 cells were significantly slower than that of siCtrl-transfected cells from Day 1 to Day 3 [Figure 3(c)]. Transfection of siLGALS1 in C9 and C9-IV2 cells also resulted in significantly reduced cell proliferation rates when compared to siCtrl-transfected C9 and C9-IV2 cells [Figure 3(d)]. The data indicated that the downregulation of LGALS1 had a great effect on the inhibition of cell proliferation in oral cancer.
To clarify the effect of LGALS1 knockdown on cell cycle regulation, we utilized PI staining to analyze the DNA content of oral cancer cells via flow cytometry. A decrease in the percentage of G0/G1 phase cells (69.1–64.5%) and an increase in the percentage of S phase cells (15.7–20.1%) was observed in siLGALS1-transfected OC3 cells compared with siCtrl-transfected OC3 cells [Figure 3(e)]. OC3-IV2 cells transfected with siLGALS1 also demonstrated a decrease in the percentage of G0/G1 phase cells (70.3–66.7%) and an increase in the percentage of S phase cells (16.3–19.1%) when compared to cells transfected with siCtrl [Figure 3(f)]. We further examined the differential expression of cell cycle regulatory proteins underlying LGALS1 knockdown via immunoblotting analysis. The protein expression of cyclin D2 and cdk4 was downregulated, whereas cyclin E, cyclin A2, cdk2, and p27 was upregulated in response to LGALS1 knockdown in both OC3 and OC3-IV2 cells when compared to OC3 and OC3-IV2 control cells [Figure 3(g)]. Altogether, LGALS1-silenced OC3 and OC3-IV2 cells induced a decrease in the percentage of G0/G1 phase cells and an increase in the percentage of S phase cells by downregulating mid-G1 cyclin D2-cdk4 and upregulating late-G1 cyclin E-cdk2 and S phase cyclin A2-cdk2. Additionally, upregulation of the CDK inhibitory protein, p27, may contribute to cell cycle arrest. Based on these findings, we concluded that silencing LGALS1 suppressed oral cancer cell proliferation and induced cell cycle arrest at the S phase.
LGALS1 knockdown inhibited wound healing and migration of oral cancer cells
To characterize the effect of LGALS1 knockdown on wound healing and oral cancer cell migration, wound healing assay and transwell migration assay were performed. The wound areas were generated by a scratch and the progression of wound healing at the indicated times was observed. The wound areas in OC3-IV2 cells transfected with siCtrl were significantly decreased when compared to OC3 transfected with siLGALS1 at 8 h, 12 h, and 24 h [Figure 4(a)]. This indicated that the wound healing ability of OC3-IV2 cells was greater than that of OC3 cells. OC3-IV2 cells transfected with siLGALS1 showed more remaining wound areas than siCtrl-transfected OC3-IV2 cells at 12 h and 24 h [Figure 4(a)]. The data suggested that LGALS1 knockdown significantly reduced the wound healing ability of OC3-IV2 cells. However, no significant effect of LGALS1 knockdown was observed on wound healing in OC3 cells. Similarly, LGALS1-silenced C9 and C9-IV2 cells also demonstrated more remaining wound areas than siCtrl-transfected C9 and C9-IV2 cells at 12 h [Figure 4(b)]. These data demonstrated that LGALS1 knockdown significantly attenuated the wound healing ability of C9 and C9-IV2 cells as well.
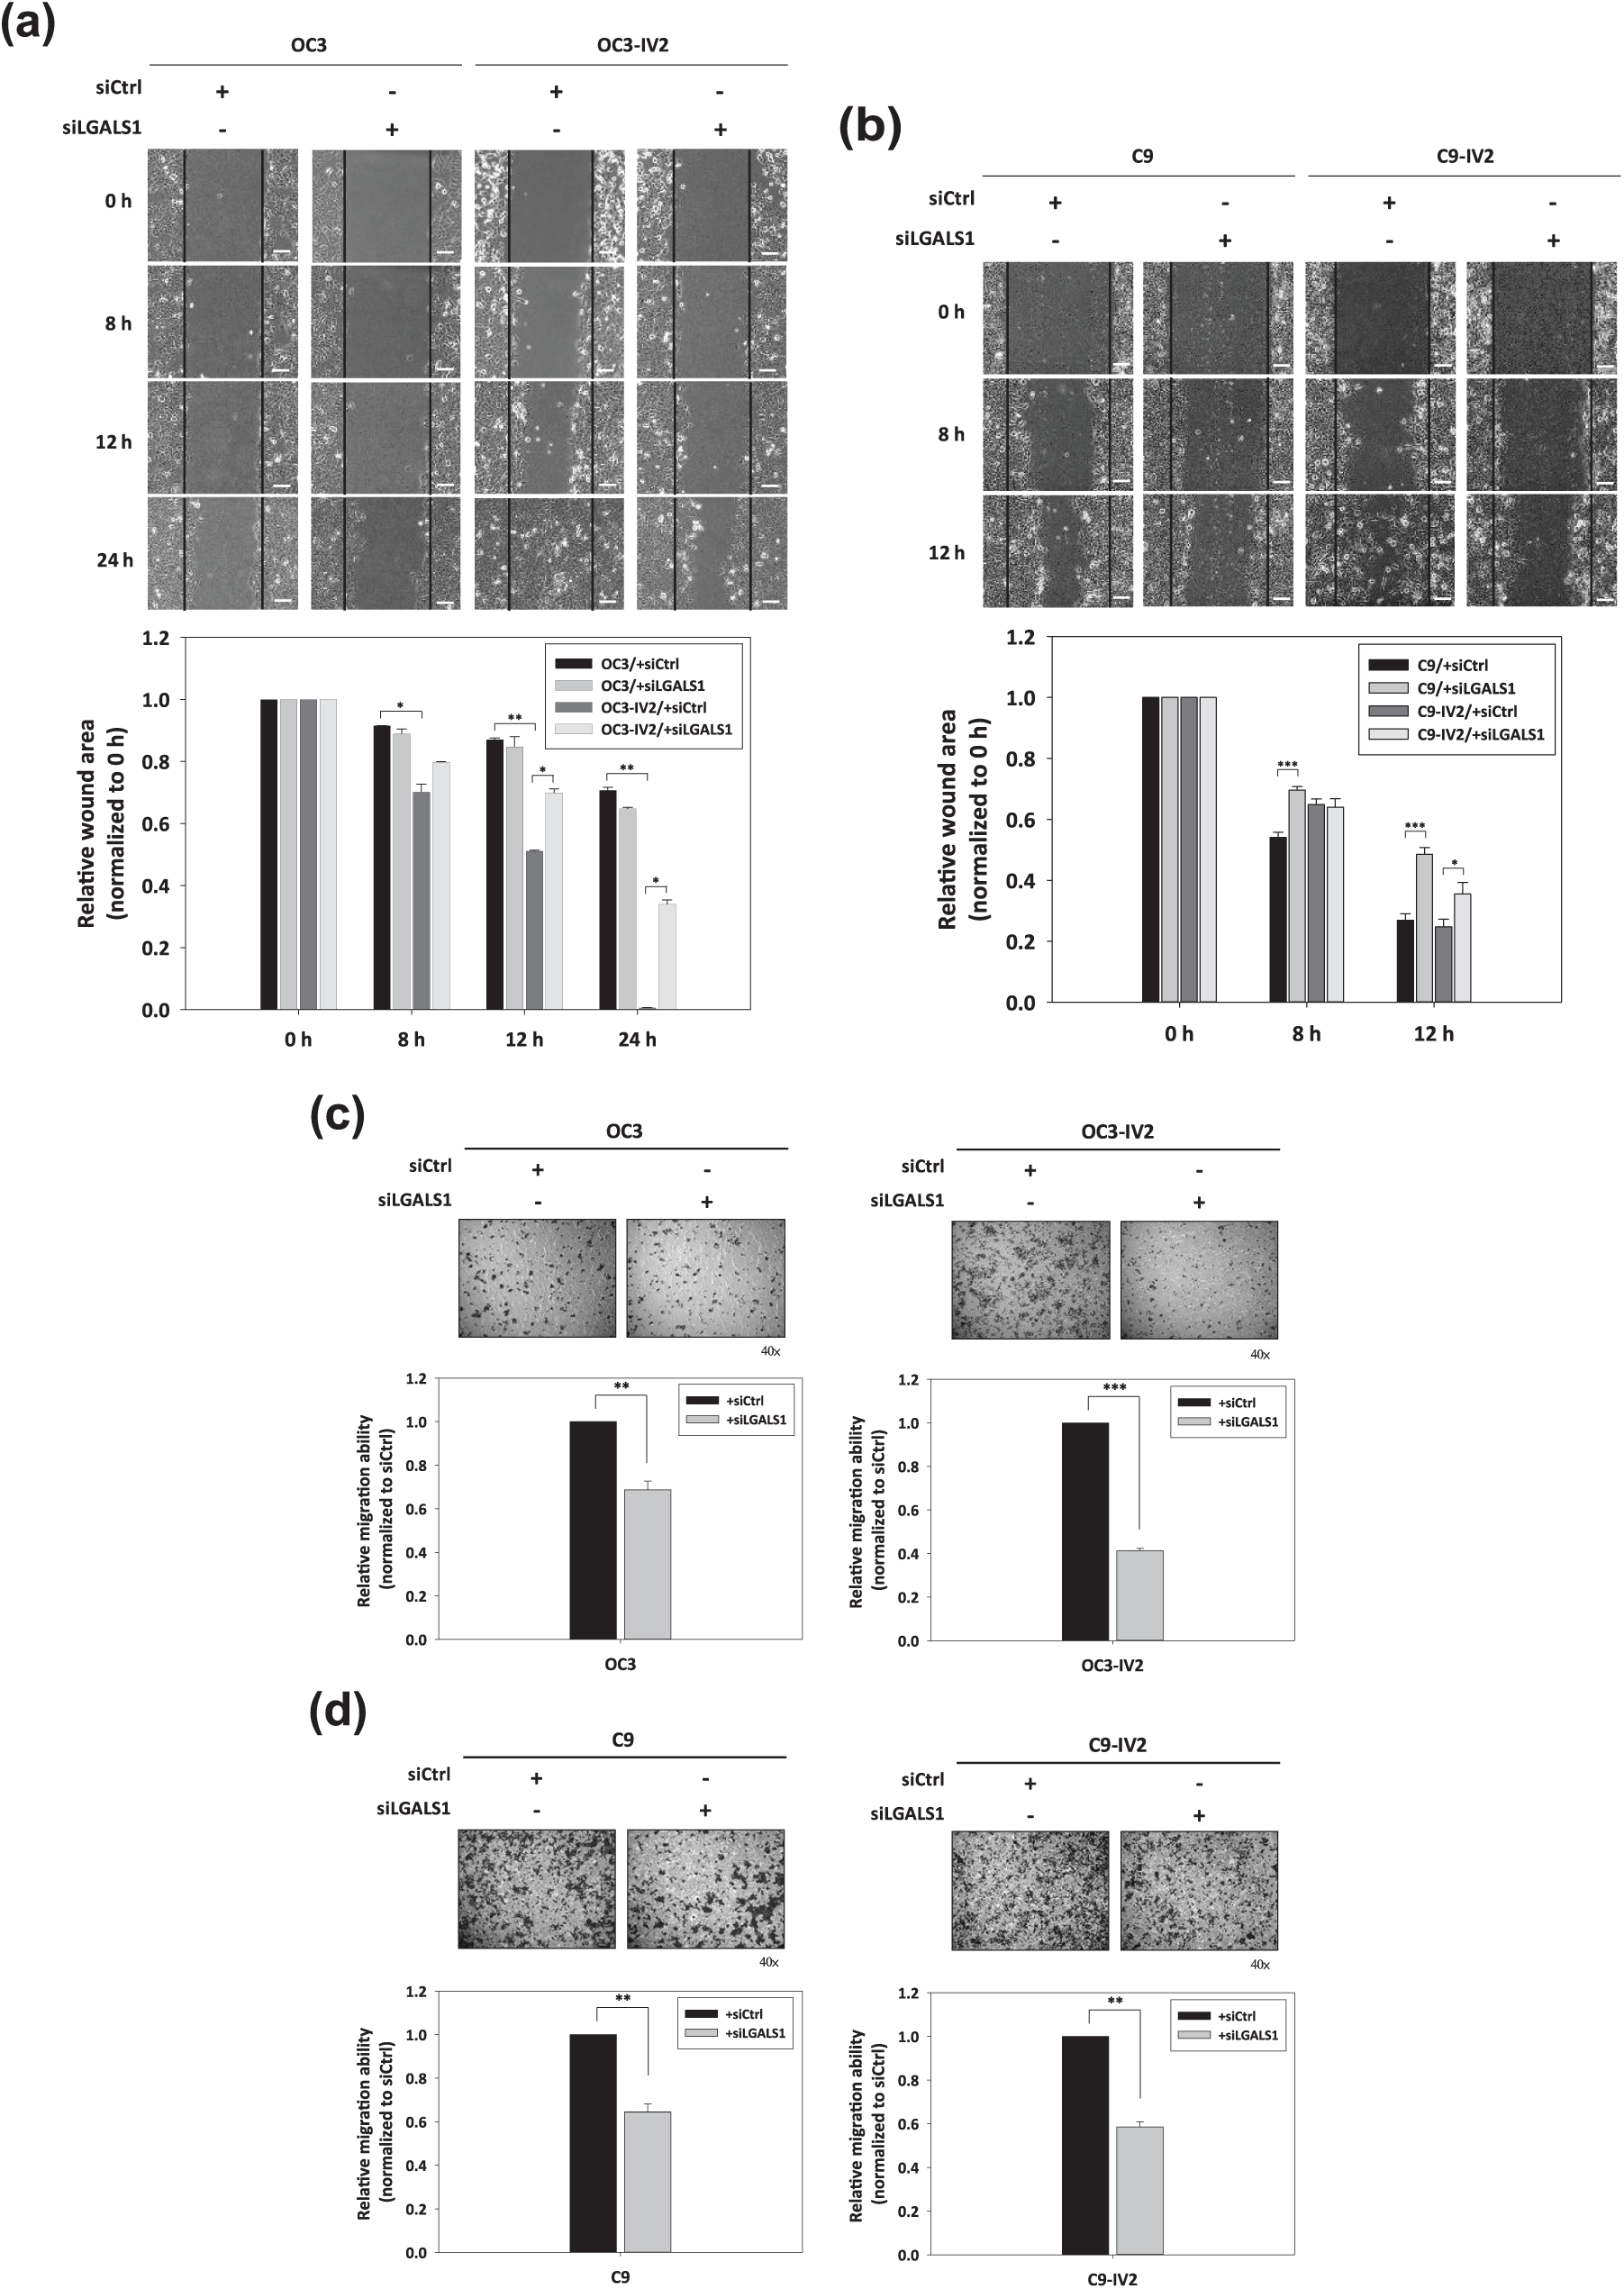
Effect of LGALS1 knockdown on wound healing ability and oral cancer cell migration. (a, b) The wound areas were generated by scratching with 10 μl pipette tips. The wound healing of oral cancer cells was observed and photographed at 0 h, 8 h, 12 h, and 24 h using an optical microscope (scale bar: 100 μm). Bottom: wound areas at the indicated times were calculated and quantified using AxioVision Rel. 4.8 software. The values for the relative wound area were normalized to the values at 0 h. Data are represented as mean ± SEM. *, p < 0.05; **, p < 0.01; and ***, p < 0.001 when compared to siCtrl-transfected oral cancer cells. (c, d) Transwell migration assay of oral cancer cells transfected with siCtrl or siLGALS1. Representative images are displayed at a 40 × magnification using an optical microscope. The migrated cells were stained with crystal violet and then quantified in solution using an ELISA reader. The values for the relative migration ability were normalized to the siCtrl of each oral cancer cell line. Data derived from three independent experiments are presented as mean ± SEM. **, p < 0.01 and ***, p < 0.001 when compared to siCtrl-transfected cells.
The representative images show that the number of OC3-IV2 and C9-IV2 migratory cells are apparently greater than the number of OC3 and C9 cells [Figure 4(c, d)]. However, LGALS1-silenced OC3 and OC3-IV2 cells also demonstrated a significant number of impaired migratory cells when compared to OC3 and OC3-IV2 cells transfected with siCtrl [Figure 4(c)]. Additionally, the suppression of LGALS1 exhibited the same effect of reduced migration ability in C9 and C9-IV2 cells [Figure 4(d)]. Collectively, these findings suggested that a decline in LGALS1 expression may not only affect the wound healing process, but also dramatically inhibit the migration of oral cancer cells.
Downregulation of LGALS1 in oral cancer cells impeded invasion in vitro and metastatic potential in vivo
To examine the effect of LGALS1 knockdown on oral cancer cell invasion, we performed the matrigel invasion assay. The invasion abilities of OC3-IV2 and C9-IV2 cells were obviously higher than OC3 and C9 cells according to the representative images [Figure 5(a, b)]. Based on the matrigel invasion assay, siLGALS1-transfected OC3 and OC3-IV2 cells showed significantly reduced cell invasion ability when compared to OC3 and OC3-IV2 cells transfected with siCtrl [Figure 5(a)]. Similarly, the invasion abilities of LGALS1-silenced C9 and C9-IV2 cells were significantly decreased when compared to siCtrl-transfected C9 and C9-IV2 cells [Figure 5(b)].
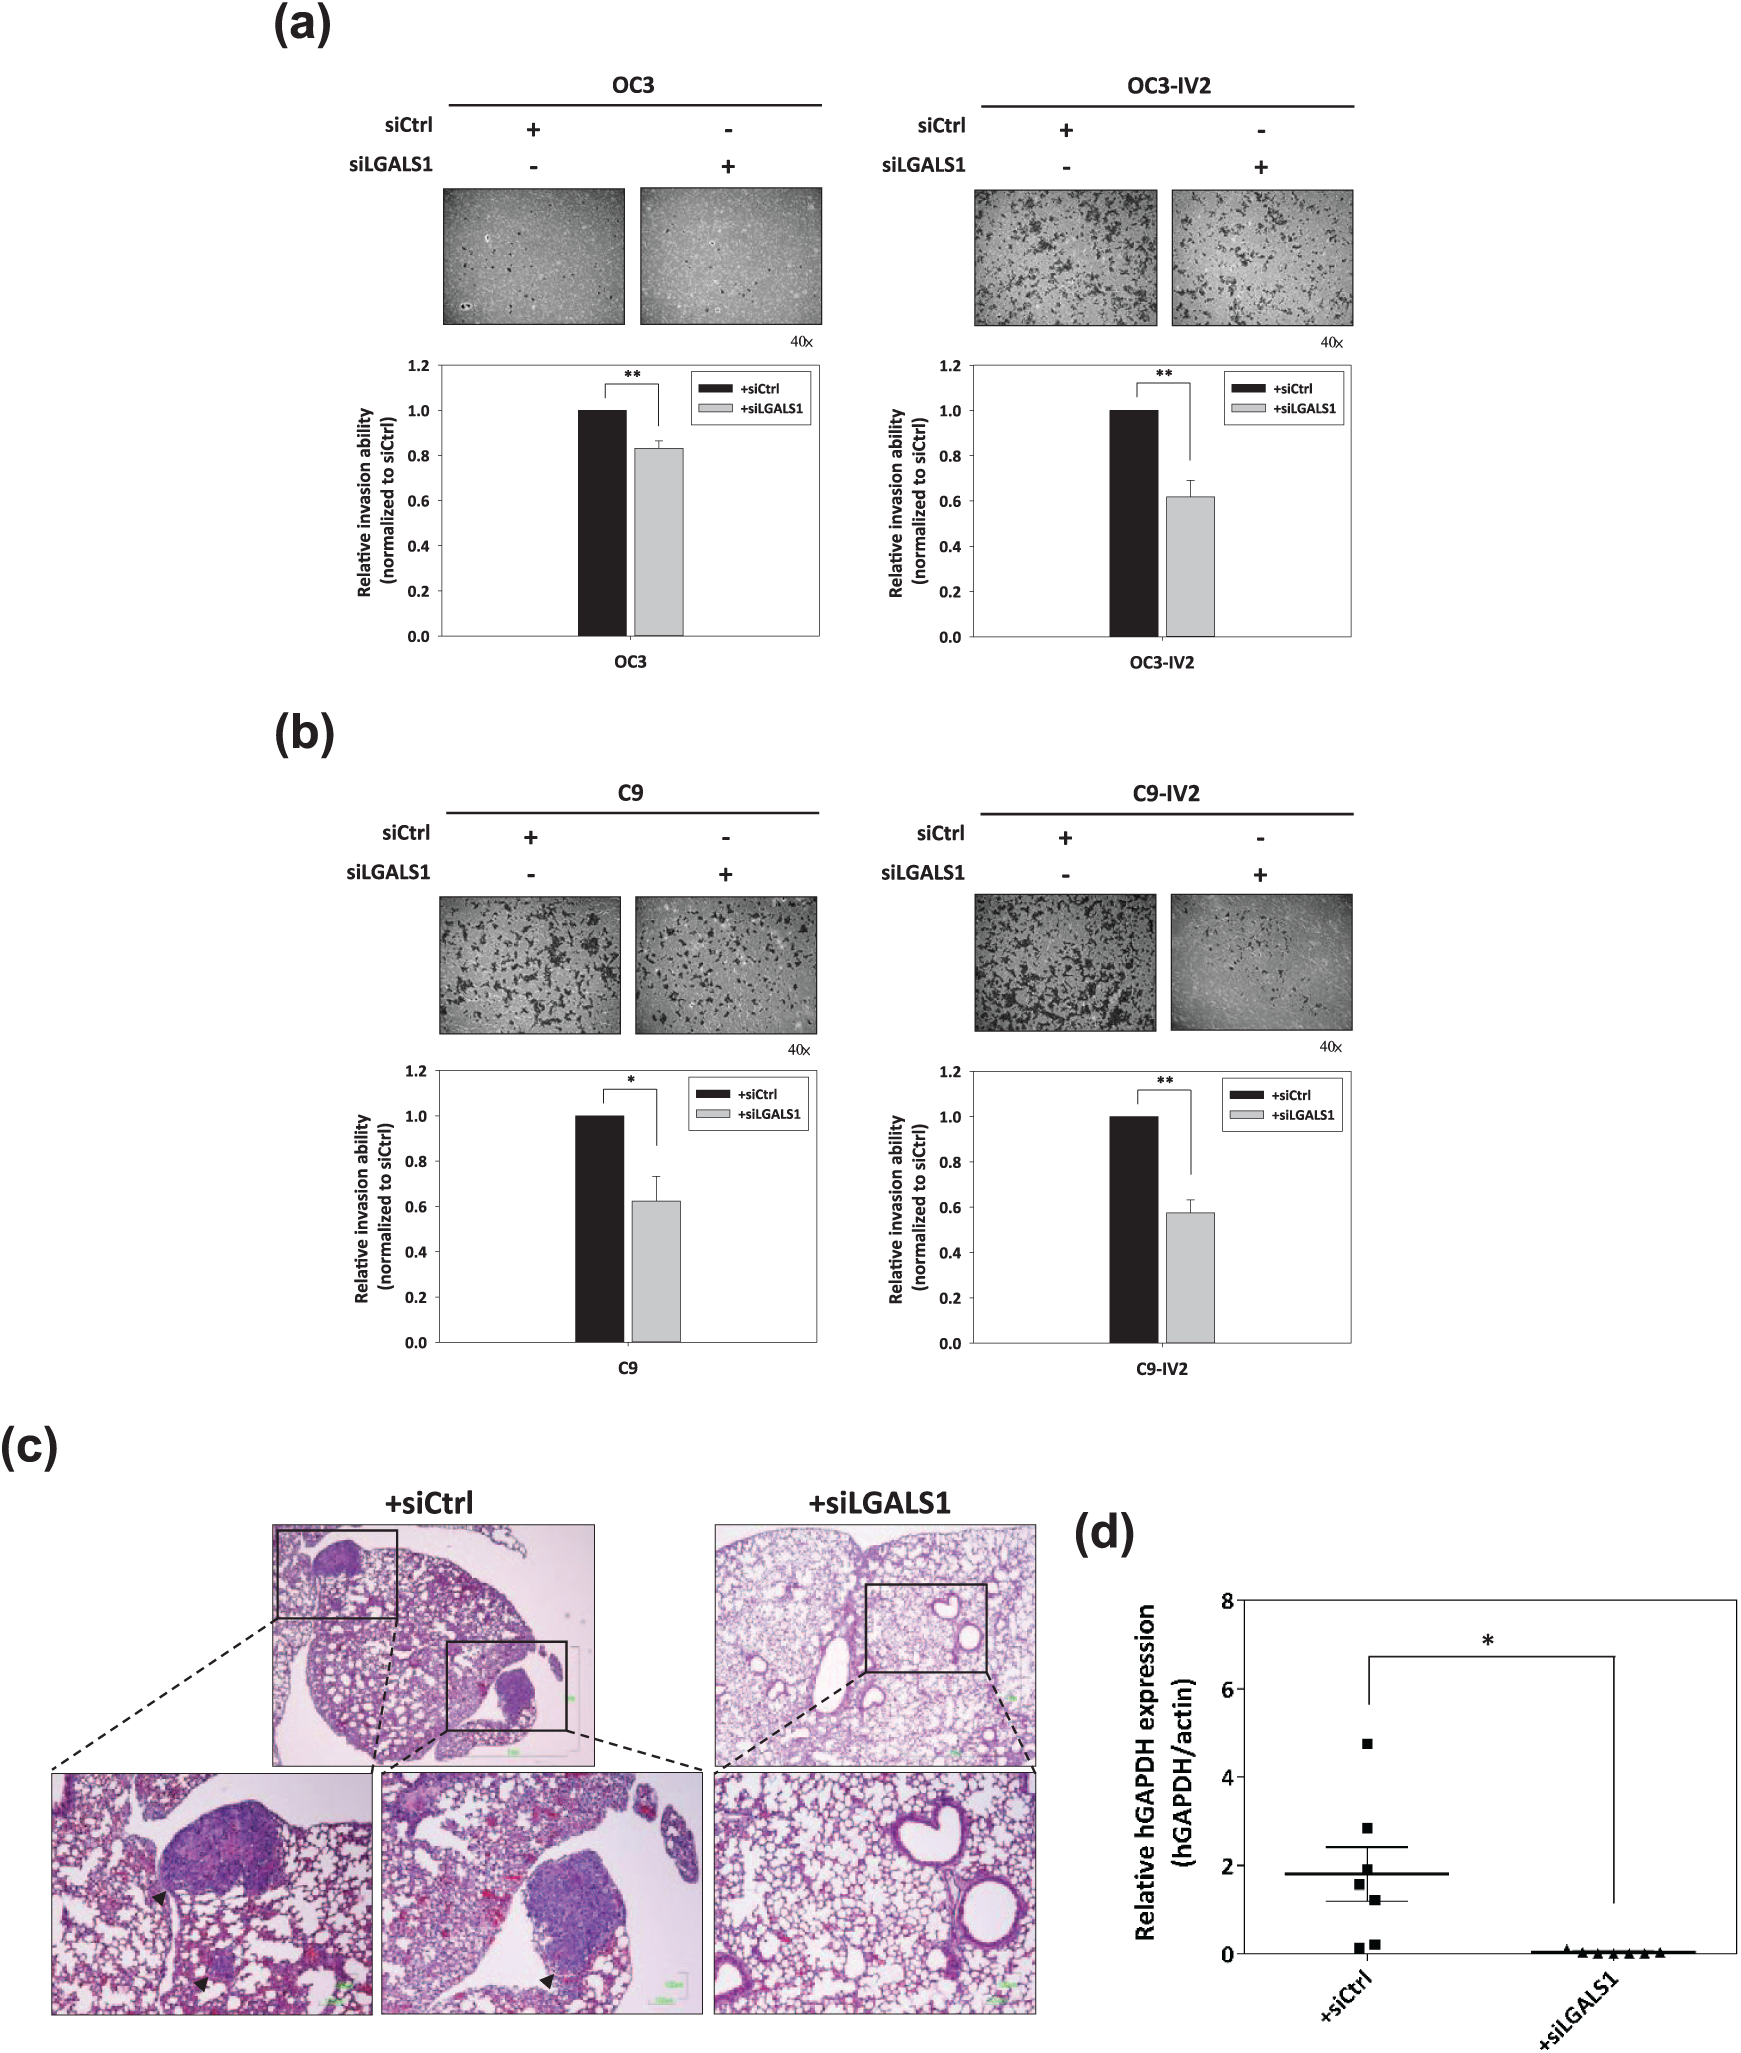
Effect of LGALS1 knockdown on oral cancer cell invasion and in vivo metastasis ability. (a, b) Control or LGALS1 siRNA-transfected oral cancer cells were subjected to the matrigel invasion assay. The quantified values of the relative invasion ability were normalized to the siCtrl of the cell lines. Data derived from three independent experiments are presented as mean ± SEM. *, p < 0.05 and **, p < 0.01 when compared to siCtrl-transfected cells. (c) In vivo lung metastasis of siCtrl- or siLGALS1-transfected C9-IV2 cells via the tail vein injection. Lung tissues were examined by paraffin section and H&E staining. Top: H&E staining images (scale bar: 1 mm). Bottom: The zoomed images of the indicated areas (scale bar: 100 μm). Arrowhead: tumor sites of lung metastases. (d) Lung metastasis of the injected cells were determined by specific primers for hGAPDH using qPCR. Relative hGAPDH expression of the siCtrl group (n = 7 mice) and siLGALS1 group (n = 7 mice) were normalized to mouse actin mRNA. Data is represented as mean ± SEM. *, p < 0.05 when compared to the siCtrl group.
To assess the significance of LGALS1 on the metastatic potential of oral cancer in vivo, C9-IV2 cells transiently transfected with siCtrl or siLGALS1 were injected into CB17-SCID mice through the tail vein. Lung metastases of the injected cells in mice were evaluated and analyzed using H&E staining and q-PCR. As shown in Figure 5(c), metastatic tumor sites in lung tissue sections were observed in the siCtrl-transfected C9-IV2 group, whereas no tumor colonies were detected in the siLGALS1-transfected C9-IV2 group. Statistical analysis of hGAPDH expression revealed that lung metastasis was significantly restrained in the siLGALS1-transfected C9-IV2 group (n = 7) when compared to the siCtrl-transfected C9-IV2 group [n = 7; Figure 5(d)]. Overall, these results suggested that the knockdown of LGALS1 markedly decreased oral cancer cell invasion in vitro and profoundly suppressed in vivo lung metastases of metastatic oral cancer cells.
LGALS1 knockdown impaired the metastatic potential of oral cancer cells via inactivation of the p38 MAPK-mediated MMP-9 pathway and inhibition of epithelial-mesenchymal transition
To investigate the downstream signaling pathway of secreted LGALS1, which modulates metastasis in oral cancer, we performed immunoblotting analysis of LGALS1-silenced and control oral cancer cells. Most matrix metalloproteinases (MMPs) are in the secreted form and are reported to facilitate tumor cell invasion and metastasis by degrading the ECM.20,21 Thus, we initially focused on the protein expression of the secreted MMPs. Secreted protein samples were prepared and concentrated from the conditioned medium. The protein expression of both MMP-9 and MMP-3 was upregulated in OC3-IV2 and C9-IV2 cells when compared to OC3 and C9 cells [Figure 6(a, b)]. MMP-9 expression was downregulated in LGALS1-silenced OC3 and OC3-IV2 cells when compared to control OC3 and OC3-IV2 cells [Figure 6(a)]. C9 and C9-IV2 cells transfected with siLGALS1 also showed decreased MMP-9 expression when compared to siCtrl-transfected C9 and C9-IV2 cells [Figure 6(b)]. However, reduced MMP-3 expression was not readily observed in response to LGALS1 knockdown in oral cancer cells.
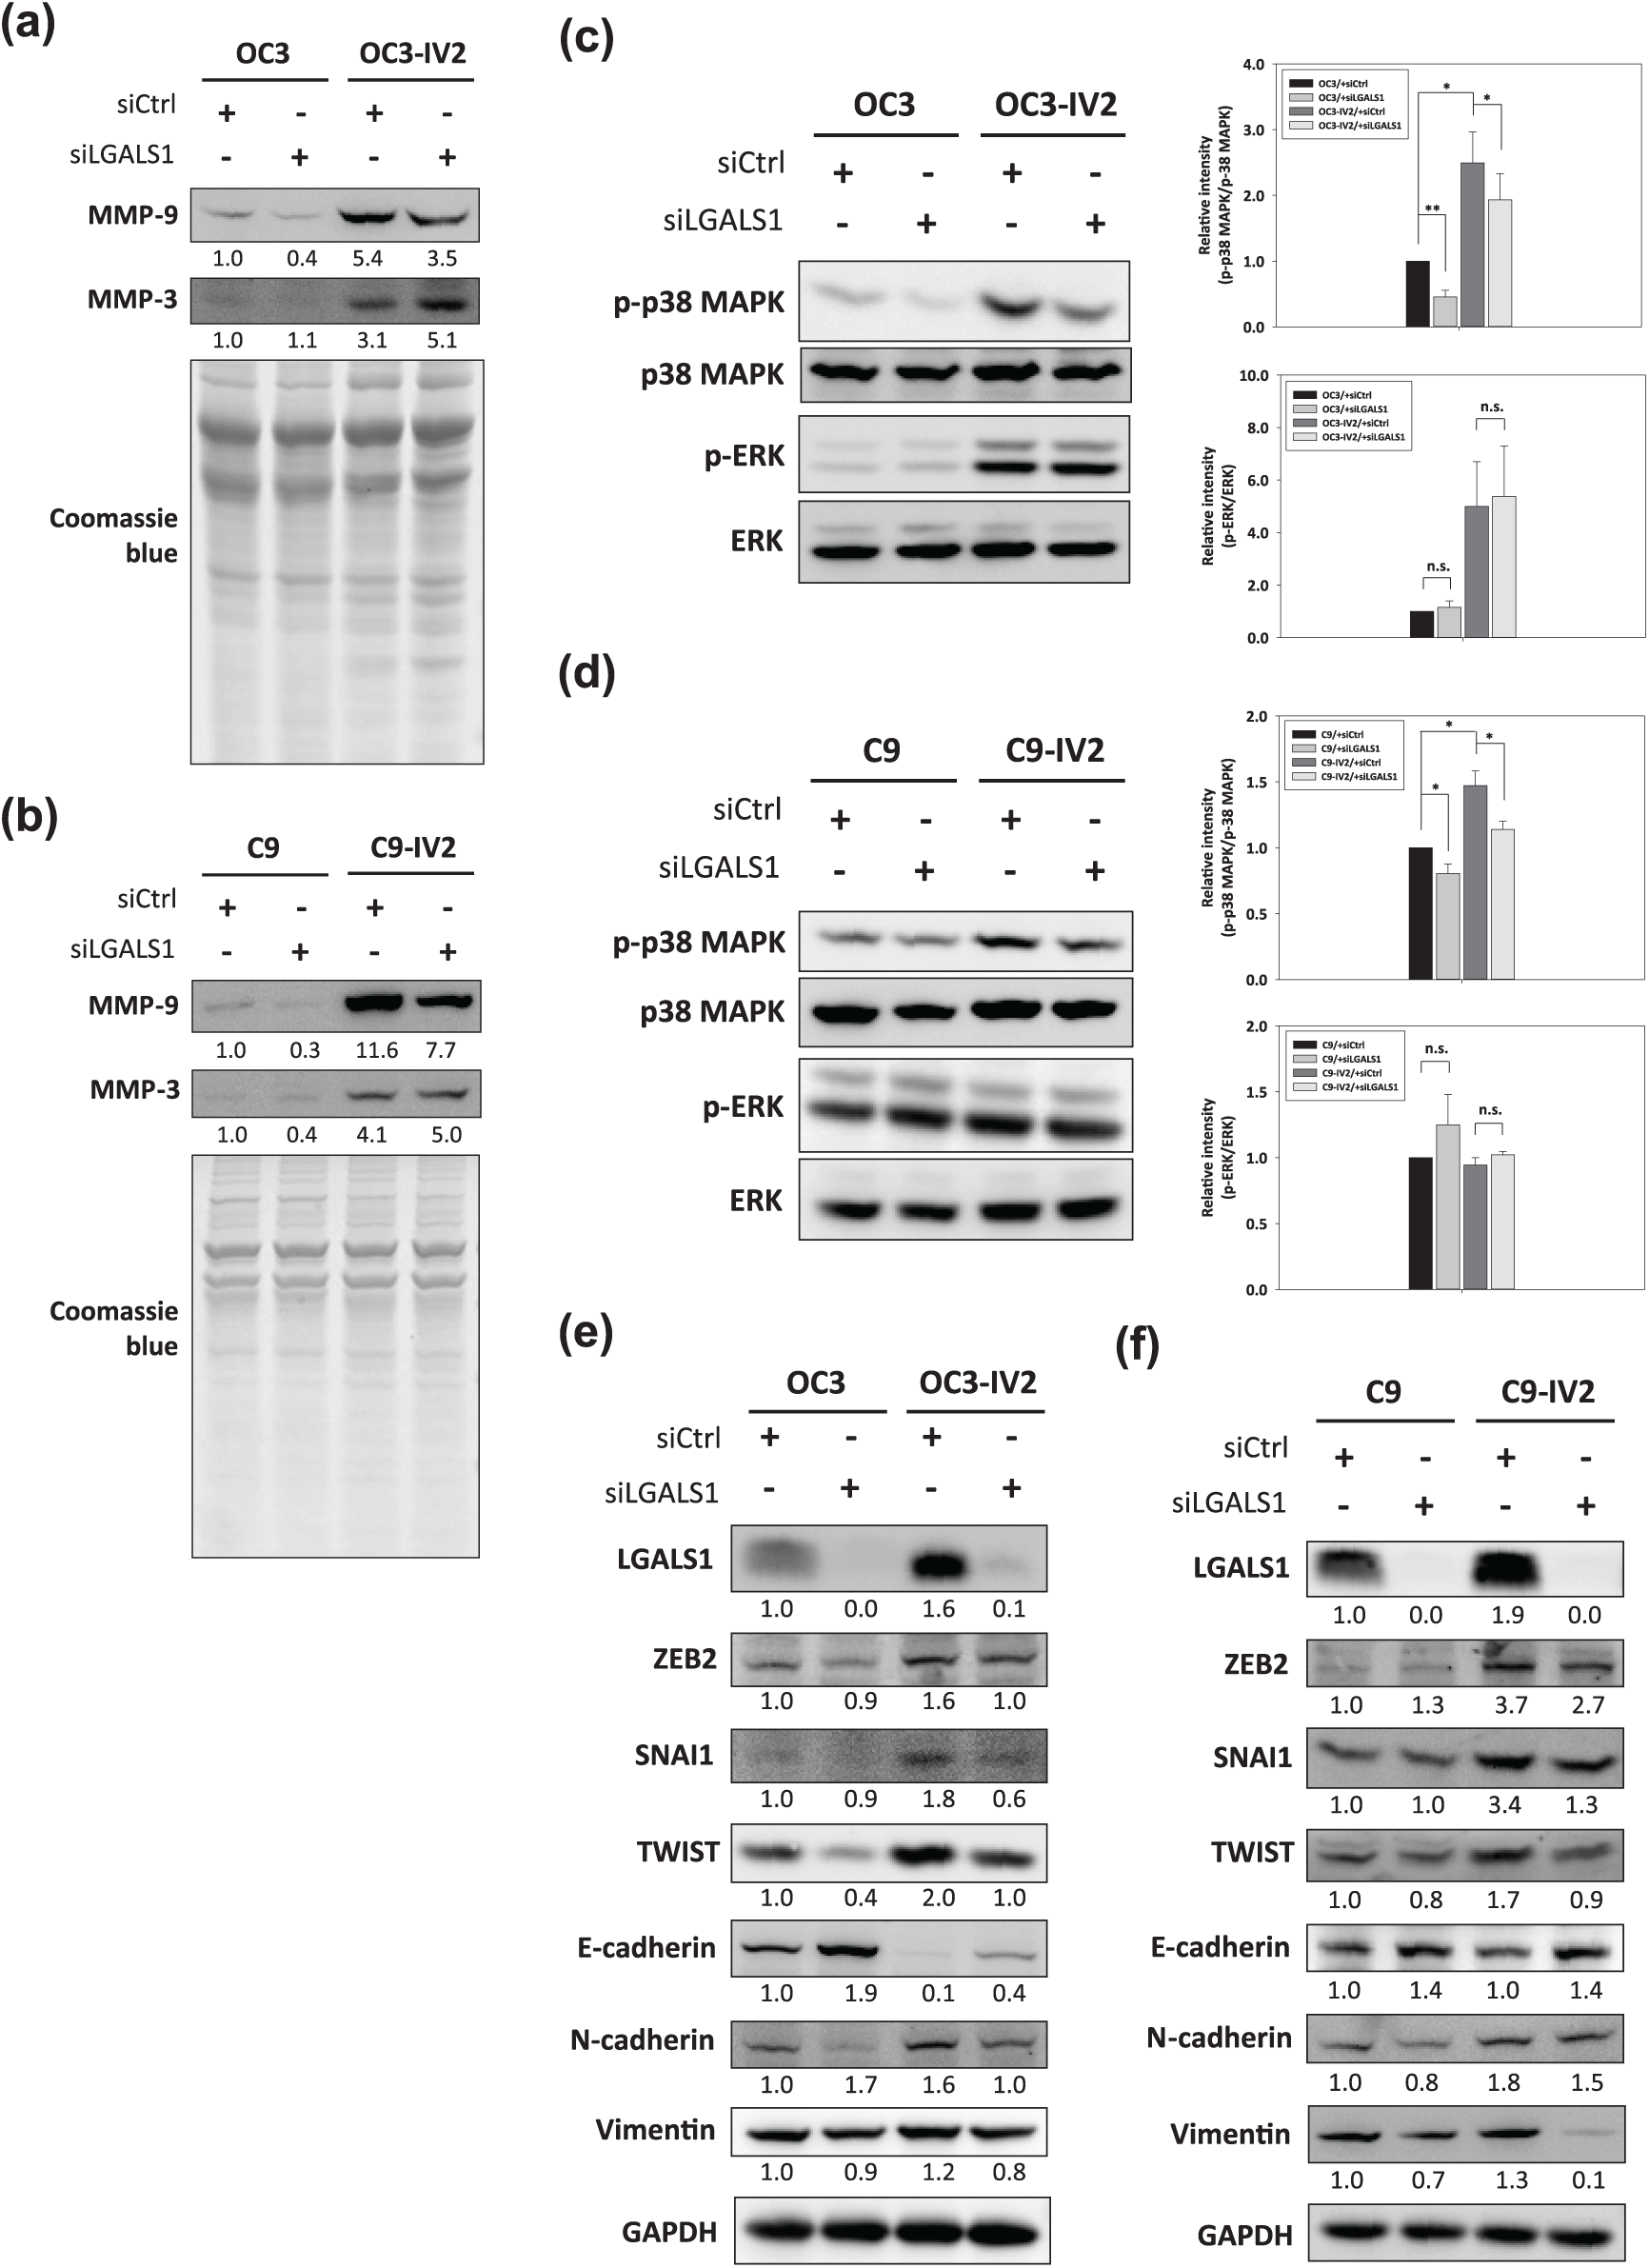
Role of LGALS1 on MMPs expression, MAPK signaling pathway, and EMT status in oral cancer cells. (a, b) Differential expression of the MMP-9 and MMP-3 proteins from the conditioned medium. The Coomassie blue staining images served as protein loading controls for normalization. The protein expression values were relative to siCtrl-transfected OC3 or C9 cells. (c, d) Immunoblotting analysis of phosphorylated p38 MAPK (p-p38 MAPK) and ERK (p-ERK) normalized to whole proteins (p38 MAPK or ERK). The quantified values were relative to OC3 or C9 cells transfected with control siRNA and statistically analyzed on the right histogram. Data derived from three independent experiments are presented as mean ± SEM. *, p < 0.05 and **, p < 0.01 when compared to siCtrl-transfected cells. (e, f) Representative images of the EMT-regulating transcription factors (ZEB2, SNAI1, TWIST) and EMT markers (E-cadherin, N-cadherin, and vimentin) normalized to GAPDH in siCtrl- or siLGALS1-transfected oral cancer cells. The protein expression values were quantified in relation to the siCtrl-transfected OC3 or C9 cells.
Next, we attempted to determine the impact of LGALS1 on MMP-9 expression in oral cancer cells. p38 mitogen-activated protein kinase (MAPK) and extracellular signal-regulated kinase (ERK) pathways are reportedly involved in MMP-9 expression. 22 Therefore, immunoblotting analysis was performed to reveal the correlation between MMP-9 expression and the MAPK pathway in oral cancer metastasis. The phosphorylation of p38 MAPK and ERK was significantly increased in OC3-IV2 cells when compared to OC3 cells [Figure 6(c)]. Furthermore, the phosphorylation of p38 MAPK, but not ERK, was dramatically decreased in siLGALS1-transfected OC3 and OC3-IV2 cells when compared to siCtrl-transfected OC3 and OC3-IV2 cells [Figure 6(c)]. The phosphorylation of p38 MAPK was also significantly enhanced in C9-IV2 cells when compared to C9 cells, and increased ERK phosphorylation was not observed in C9-IV2 cells when compared to C9 cells [Figure 6(d)]. Similarly, C9 and C9-IV2 cells transfected with siLGALS1 displayed markedly reduced p38 MAPK phosphorylation when compared to cells transfected with siCtrl. Moreover, the phosphorylation of ERK in C9 and C9-IV2 cells was comparable with the underlying LGALS1 knockdown [Figure 6(d)].
A previous study indicated that the activation of the MAPK pathway promoted epithelial-mesenchymal transition (EMT) and cancer metastasis via the stabilization of the transcription factor TWIST1. 23 EMT is believed to be a critical step toward cancer metastasis. 24 Zinc-finger E‑box‑binding (ZEB), SNAIL, and TWIST are major transcription factors that contribute to EMT by regulating the epithelial and mesenchymal phenotypes. 25 We therefore evaluated the effect of LGALS1 knockdown on the correlation between the p38 MAPK pathway and EMT status in oral cancer cells via immunoblotting analysis. ZEB2, SNAI1, and TWIST were upregulated in OC3-IV2 and C9-IV2 cells when compared to OC3 and C9 cells [Figure 6(e, f)]. A decrease in the expression of the epithelial marker, E-cadherin, was observed in OC3-IV2 cells; meanwhile, increased expression of mesenchymal markers, N-cadherin and vimentin, were observed in OC3-IV2 and C9-IV2 cells [Figure 6(e, f)]. Knockdown of LGALS1 in OC3 and OC3-IV2 cells diminished the expression of ZEB2, SNAI1, and TWIST when compared to OC3 and OC3-IV2 control cells [Figure 6(e)]. Elevated E-cadherin as well as reduced N-cadherin and vimentin levels were observed in LGALS1-silenced OC3 and OC3-IV2 cells [Figure 6(e)]. We also found reduced expression of ZEB2, SNAI1, and TWIST in siLGALS1-transfected C9-IV2 cells when compared to siCtrl-transfected C9-IV2 cells [Figure 6(f)]. Additionally, upregulated E-cadherin as well as downregulated N-cadherin and vimentin levels were observed in C9 and C9-IV2 cells transfected with siLGALS1 [Figure 6(f)]. Collectively, these results suggested that silencing LGALS1 resulted in the restriction of oral cancer metastasis by inactivating p38 MAPK-mediated MMP-9 expression and suppressing the transcription factors involved in EMT.
Secreted LGALS1 modulated oral cancer metastasis via p38 MAPK signaling pathway
We demonstrated that the p38 MAPK signaling pathway was critical in oral cancer metastasis LGALS1-mediated. Moreover, we analyzed the effect of secreted LGALS1 using rhLGALS1 to determine whether LGALS1 could influence activation of the p38 MAPK pathway in oral cancer cells. The phosphorylation of p38 MAPK was markedly enhanced in both parental OC3 and C9 cells treated with rhLGALS1 when compared to that in untreated oral cancer cells [Figure 7(a)]. rhLGALS1-treated OC3 and C9 cells both showed a significant number of increased migratory cells when compared to untreated OC3 and C9 cells [Figure 7(b)].

Effect of elevated LGALS1 and p38 MAPK knockdown on oral cancer cell migration. (a) Expression of p-p38 MAPK following treatment with rhLGALS1 (200 ng/ml) was examined by immunoblotting. The expression of p-p38 MAPK was normalized to that of whole p38 MAPK. The quantified values were relative to those in untreated parental OC3 or C9 cells. (b) Untreated or rhLGALS1 (500 ng/ml)-treated oral cancer cells were subjected to the transwell migration assay. The quantified values of the relative migration ability were normalized to the untreated parental cells. Data derived from three independent experiments are presented as mean ± SEM. **, p < 0.01 and ***, p < 0.001 when compared to untreated OC3 or C9 cells. (c) OC3-IV2 and C9-IV2 cells were transfected with 40 nM of siCtrl or sip38 MAPK, and the knockdown efficiency of p38 MAPK was monitored via immunoblotting analysis. (d) Transwell migration assay of highly invasive oral cancer cells transfected with siCtrl or sip38 MAPK. Data derived from three independent experiments are presented as mean ± SEM. ***, p < 0.001 when compared to siCtrl-transfected cells. (e) Immunoblotting analysis of the MMP-9 proteins from the conditioned medium. The Coomassie blue staining images served as protein loading controls for normalization. The protein expression values were relative to siCtrl-transfected OC3-IV2 or C9-IV2 cells. (f) A hypothetical model detailing the role of elevated LGALS1 in metastatic oral cancer cells. Overexpressed LGALS1 in highly invasive oral cancer cells interacts with integrins in the extracellular space and subsequently induces the phosphorylation of p38 MAPK. The activation of the p38 MAPK pathway accelerates MMP-9 expression, which facilitates the secretion and upregulation of ZEB2, SNAI1, and TWIST in order to induce EMT. Thus, increased LGALS1 activates p38 MAPK and augments the expression of secreted MMP-9 as well as the EMT-regulating transcription factors to facilitate migration and invasion in oral cancer cells.
To further examine the significance of p38 MAPK on the metastatic potential of oral cancer, OC3-IV2 and C9-IV2 cells transiently transfected with siCtrl or p38 MAPK siRNA (sip38 MAPK). Transfection of sip38 MAPK resulted in over 70% reduction of p38 MAPK expression in OC3-IV2 and C9-IV2 cells when compared to siCtrl-transfected OC3-IV2 and C9-IV2 cells [Figure 7(c)]. As shown in Figure 7(d), sip38 MAPK-transfected OC3-IV2 and C9-IV2 cells significantly reduced the cell migration when compared to OC3-IV2 and C9-IV2 cells transfected with siCtrl. We also observed that MMP-9 expression was apparently decreased in response to p38 MAPK knockdown in both OC3-IV2 and C9-IV2 cells [Figure 7(e)]. These results suggested that secreted LGALS1 mediated metastasis in oral cancer cells through activation of the p38 MAPK pathway.
Discussion
Cervical lymph node metastasis or distant organ metastasis, while being a potential prognostic indicator, is responsible for the poor survival rates in patients suffering from oral cancer.26,27 To investigate the detailed mechanism regulating the metastasis of oral cancer, we isolated the highly invasive sub-populations, OC3-IV2 and C9-IV2, from parental OC3 and C9 cells via in vivo selection. 18 Isogenic OC3-IV2 and C9-IV2 cells acquired metastatic potentials and provided a powerful model in understanding the pathogenesis of oral cancer metastasis.
In this study, we demonstrated that secreted LGALS1 was upregulated in highly invasive oral cancer cells using secretomic analysis. Additionally, we indicated that LGALS1 expression in tissue specimens was associated with oral cancer progression and lymph node metastasis, implying that LGALS1 probably played a crucial role in regulating tumor progression and metastasis in oral cancer. Overexpressed LGALS1 was observed in almost all malignant tumors and correlated with cancer progression and invasiveness in thyroid cancer, 28 breast cancer, 29 cervical cancer, 30 colorectal cancer, 31 gastric cancer, 32 and pancreatic ductal adenocarcinoma. 33 However, the functional roles of secreted LGALS1 in tumor progression and metastasis of oral cancer are yet to be elucidated.
We found that decreased LGALS1 expression significantly diminished cell proliferation in parental oral cancer cells and highly invasive oral cancer cells. A previous study reported that LGALS1 knockdown by siRNA significantly inhibited in vitro cell proliferation in epithelial ovarian cancer. 34 SQ20B and A2780-1A9 cells treated with the LGALS1 inhibitor, OTX008, demonstrated the suppression of the ERK1/2 and AKT-dependent survival pathways to induce antiproliferative effects. 35 These results were consistent with the effect of LGALS1 on oral cancer cell growth. Furthermore, we revealed that by silencing LGALS1, S phase arrest was induced accompanied by the downregulation of cyclin D2 and cdk4 as well as the upregulation of cyclin E, cyclin A2, and cdk2. Desacetyluvaricin induced the S phase cell cycle arrest in colorectal cancer by reducing cyclin D and cdk4 as well as increasing cyclin E, which probably forced the cells to pass through the G1/S boundary. 36 Cyclin A and cdk2 complexes are thought to be critical controllers that facilitate the progression through the S phase. 37 However, several studies revealed the expression of cyclin A and cdk2 to be downregulated when the cell cycle was arrested at the S phase.36,38,39 These phenomena were incompatible with the data we observed. Based on the representative flow cytometry images, the percentage of cells in the G2/M phase slightly increased in LGALS1-silenced oral cancer cells. It appears that the cell cycle not only exhibited S phase arrest, but also conceivably arrested at the S/G2 phase. We speculated that augmented cyclin A2 and cdk2 were actually required to progress through the S phase and passage into the S/G2 transition. 37 Thus, we demonstrated that the downregulation of LGALS1 abrogated cell growth and resulted in S phase arrest via the influence of pivotal regulators in the cell cycle. These findings implicated LGALS1 in tumor progression and as a potential independent prognostic factor for oral cancer.
LGALS1 cannot be secreted via the standard ER/Golgi pathway because the protein lacks recognizable secretion signal sequences. 40 Instead, a plasma membrane-derived transporter is thought to process LGALS1 secretion via unconventional secretory routes. 41 While secreted LGALS1 is found in extracellular spaces, the interaction between LGALS1 and its binding partners concern intracellular signaling events. GM1 ganglioside, H-Ras, ECM components, and integrins are considered to be the binding partners of secreted LGALS1. 13 Previous reports indicated that integrin α5β3,42,43 integrin α11β1, 44 and integrin α2β1 45 played crucial roles in promoting cancer metastasis. Additionally, LGALS1 promoted cancer progression and drug resistance to doxorubicin by interacting with integrin β1 in breast cancer. 46 In lung cancer, LGALS1 interacted with integrin α6β4 to facilitate cancer metastasis. 47 Collectively, we suggest that elevated LGALS1 probably potentiates integrins and activates intracellular signaling pathways to promote metastasis in oral cancer. Further studies are imperative to evaluate which subunits of integrins are involved in the binding of secreted LGALS1, contributing to oral cancer metastasis.
The p38 MAPK pathway participates in the regulation of various biological functions that lead to physiological processes such as migration/invasion of cells, inflammation, neurodegenerative disorders, myogenesis, and other differentiation processes. 48 Deregulation of the p38 MAPK pathway may be associated with the occurrence of many pathological circumstances. Recent studies reported that the activation of the p38 MAPK pathway was critical for cell migration and invasion in lung adenocarcinoma and colorectal cancer.49,50 Our data demonstrated that LGALS1 knockdown in oral cancer cells markedly impaired cell migration based on wound healing and transwell migration assays. Decreased phosphorylation of p38 MAPK in oral cancer cell was also observed in response to silencing LGALS1. Therefore, LGALS1 appeared to regulate oral cancer cell migration through the p38 MAPK pathway.
We also found that inhibiting LGALS1 obviously diminished cell invasion in vitro and the metastatic potential of oral cancer in vivo. Furthermore, MMP-9 expression was shown to decline in oral cancer cells transfected with LGALS1 siRNA. In human breast epithelial cells, transforming growth factor (TGF)-β resulted in the upregulation of MMP-9 expression via p38 MAPK signaling, and not the ERK pathway. 51 MMP-9 expression appeared to correlate with the p38 MAPK pathway. Enhanced ovarian cancer cell invasion and promotion of osteosarcoma cell metastasis also occurred due to MMP-9 expression via the p38 MAPK pathway.52,53 These studies corroborated our findings which showed that secreted LGALS1-induced MMP-9 expression depended on the p38 MAPK pathway to modulate the invasion and metastasis of oral cancer. Tumor cells that acquired invasive abilities and subsequently metastasized to distant tissues usually underwent EMT for epithelial cell plasticity. 54 Some evidences imply that p38 MAPK phosphorylation activates TWIST1 on serine 68 and correlates with SNAI1 expression to trigger EMT.55,56 In concordance with the hypothesis, we found that EMT-regulating transcription factors of oral cancer cells were affected by the downregulated LGALS1-induced inactivation of the p38 MAPK pathway. Moreover, the expression of the EMT markers revealed that the knockdown of LGALS1 induced the inhibition of EMT. Accordingly, we speculate that elevated LGALS1 triggers EMT via p38 MAPK activation.
The current findings demonstrate the role of secreted LGALS1 on cell growth, migration, and invasion in several oral cancer cell lines. The upregulation of secreted LGALS1 was determined in two highly invasive oral cancer cell lines and compared with their parental oral cancer cell lines. Activation of the p38 MAPK pathway, increased MMP-9 expression, and augmented expression of EMT-regulating transcription factors were all detected in the two highly invasive oral cancer cell lines. Silencing LGALS1 with siRNA provided comprehensive evidence to investigate the negative effects of secreted LGALS1 on oral cancer metastasis. Moreover, activation of the p38 MAPK pathway and increased cell migration were observed in parental oral cancer cells in response to rhLGALS1 treatment. Inactivation of the p38 MAPK pathway suppressed cell migration and downregulated MMP-9 expression in highly invasive oral cancer cells. We propose that elevated LGALS1 probably interacted with integrins, thereby activating the p38 MAPK-mediated MMP-9 pathway and p38 MAPK-conducted EMT to promote cell migration and invasion in highly invasive oral cancer cells [Figure 7(f)].
There are some limitations in our study. Firstly, although LGALS1 was overexpressed in tissue specimens of LNMs, the sample size of LNMs in oral cancer is limited. Therefore, to provide strong correlation between LGALS1 and lymph node metastasis in oral cancer, we should obtain more samples from LNMs of oral cancer. Secondly, there were no sufficient evidences to determine the effect of elevated LGALS1 on oral cancer metastasis. Overexpression experiments in parental oral cancer cells cannot be performed in our study. Finally, we demonstrated that the p38 MAPK pathway participates in LGALS1-mediated oral cancer metastasis. The correlation between p38 MAPK pathway and EMT should be assessed by further experiments. Additionally, future studies will evaluate the role of p38 MAPK pathway in oral cancer metastasis by functional assays and in vivo animal models.
In conclusion, we established a model for elevated LGALS1-induced metastasis of oral cancer. In-depth studies correlate LGALS1 with oral cancer progression and lymph node metastasis, implying its potential as a prognostic marker for oral cancer. Furthermore, LGALS1 may also be an effective therapeutic target in treating and restricting oral cancer metastasis.
Supplemental Material
SUPPLEMENTAL_FIGURE_and_TABLES – Supplemental material for Upregulation of LGALS1 is associated with oral cancer metastasis
Supplemental material, SUPPLEMENTAL_FIGURE_and_TABLES for Upregulation of LGALS1 is associated with oral cancer metastasis by Ji-Min Li, Chien-Wei Tseng, Chi-Chen Lin, Ching-Hsuan Law, Yu-An Chien, Wen-Hung Kuo, Hsiu-Chuan Chou, Wen-Ching Wang and Hong-Lin Chan in Therapeutic Advances in Medical Oncology
Footnotes
Acknowledgements
The authors thank Prof. Lu-Hai Wang and Dr. Wei-Chieh Huang for kindly providing oral cancer cell lines. We also thank National Laboratory Animal Center (NLAC), NARLabs, Taiwan, for technical support and Pathology Core Laboratory of the National Health Research Institutes for H&E staining.
Funding
This work was supported by a grant (MOST 106-2311-B-007-002) from Ministry of Science and Technology (MOST), Taiwan.
Conflict of interest statement
The authors declare that there is no conflict of interest.
Supplemental Material
Supplemental material for this article is available online.
References
Supplementary Material
Please find the following supplemental material available below.
For Open Access articles published under a Creative Commons License, all supplemental material carries the same license as the article it is associated with.
For non-Open Access articles published, all supplemental material carries a non-exclusive license, and permission requests for re-use of supplemental material or any part of supplemental material shall be sent directly to the copyright owner as specified in the copyright notice associated with the article.