
Abstract
When considering treatment options for patients with metastatic colorectal cancer (mCRC), molecular profiling has become a pivotal component in guiding clinical decisions. FOLFOX and FOLFIRI (fluorouracuil, leucovorin plus oxaliplatin or ininotecan, respectively) are the standard base regimens used for the treatment of mCRC. Biologic agents, such as the epidermal growth factor receptor (EGFR) targeted therapies, cetuximab and panitumumab and the vascular endothelial growth factor monoclonal antibody, bevacizumab, are safe and effective in the first-line setting. The most efficacious use of these agents in terms of timing and selection of the right patient population continues to be debated. Here we review multiple investigations into the effectiveness of treatment options as a function of the mutations present in colon cancers. Early studies have reported that KRAS mutations at exon 2 predict resistance to EGFR targeted therapies. More recently the data have expanded to include KRAS mutations at exons 3 and 4 and NRAS mutations at exons 2, 3 and 4 as well as other biomarkers including BRAF and PIK3CA, leading to the evolution of the treatment of mCRC to a more precision-based approach. As our understanding of relevant biomarkers increases, and data from both molecular profiling and treatment response become more readily available, treatment options will become more precise and their outcomes more effective.
Introduction
Colorectal cancer remains a leading cause of cancer death with more than 50,000 people dying each year in the United States alone [Siegel et al. 2014]. The antimetabolite 5-fluorouracil (5FU) has been the backbone of treatments for metastatic colorectal cancer (mCRC) for many years with addition of leucovorin (LV) in the 1990s. The past two decades have seen improvements in median survival from 10–14 months with 5FU/LV to 16–23 months with addition of oxaliplatin or irinotecan (FOLFOX or FOLFIRI) [Advanced Colorectal Cancer Meta-Analysis Project, 1992; de Gramont et al. 2000; Douillard et al. 2000; Saltz et al. 2000; Fuchs et al. 2007]. Current standard of care first-line treatments for mCRC include FOLFOX and FOLFIRI (capecitabine may be substituted for infusional 5FU). Since 2004, targeted therapies alone or in combination with standard chemotherapies have provided more treatment options and better results. These include the human vascular endothelial growth factor (VEGF) monoclonal antibody, bevacizumab, and the epidermal growth-factor receptor (EGFR) monoclonal antibodies, cetuximab and panitumumab. Additional anti-angiogenic agents, including aflibercept and ramucirumab, have also been approved by the US Food and Drug Administration (FDA) for mCRC.
With the development of multiple pharmaceutical agents for mCRC come numerous questions regarding the most efficacious timing of agents and the patient populations most likely to benefit from these therapies. To investigate which biologic agent (bevacizumab versus cetuximab) should be given in the first-line metastatic setting with either FOLFOX or FOLFIRI, the phase III multicenter prospective Cancer and Leukemia Group B (CALGB)/SWOG 80405 clinical trial was performed [Venook et al. 2014]. This study was initiated in 2004 with recently completed data involving 1137 KRAS wildtype (at codons 12 and 13) patients receiving chemotherapy (FOLFOX or FOLFIRI) and randomized to either cetuximab or bevacizumab. Preliminary results indicated no difference in overall survival (OS) or serious toxicity whether patients received chemotherapy/cetuximab or chemotherapy/bevacizumab. This study demonstrates, through one of the longest median OS rates in mCRC to date at ~29 months, that our ability to treat patients with this disease is continuing to improve.
Recent data, reviewed below, indicate predictive and prognostic benefits to extended-spectrum RAS testing along with BRAF and potentially PIK3CA mutation profiling. Further analysis from CALGB/SWOG 80405 and other similar studies with extended mutation profiling have yielded further information pertaining to other biomarkers along the EGFR pathway, including KRAS, NRAS, BRAF and PIK3CA. Mutations along these pathways have been shown to alter anti-EGFR therapies. The full mechanisms and biology remain unclear and current research is now focused on biomarkers involved in this process. Here we present an updated summary of these biomarkers and discussion of treatment strategies in mCRC.
KRAS/NRAS
KRAS and NRAS belong to the same RAS family of oncogenes. The most common KRAS mutations are found in exon 2 (codon 12 or 13) (see Table 1). Numerous studies have confirmed the presence of KRAS mutations at exon 2 as a predictor of resistance to anti-EGFR therapies [Lievre et al. 2006, 2008; Benvenuti et al. 2007; Di Fiore et al. 2007; Van Cutsem et al. 2009; De Roock et al. 2010; Bokemeyer et al. 2011; Douillard et al. 2013]. It is currently standard of care to test tumor samples for KRAS exon 2 mutations, as this has been demonstrated to be a cost-effective means to predict resistance to these therapies.
Prevalence of KRAS/NRAS mutation.
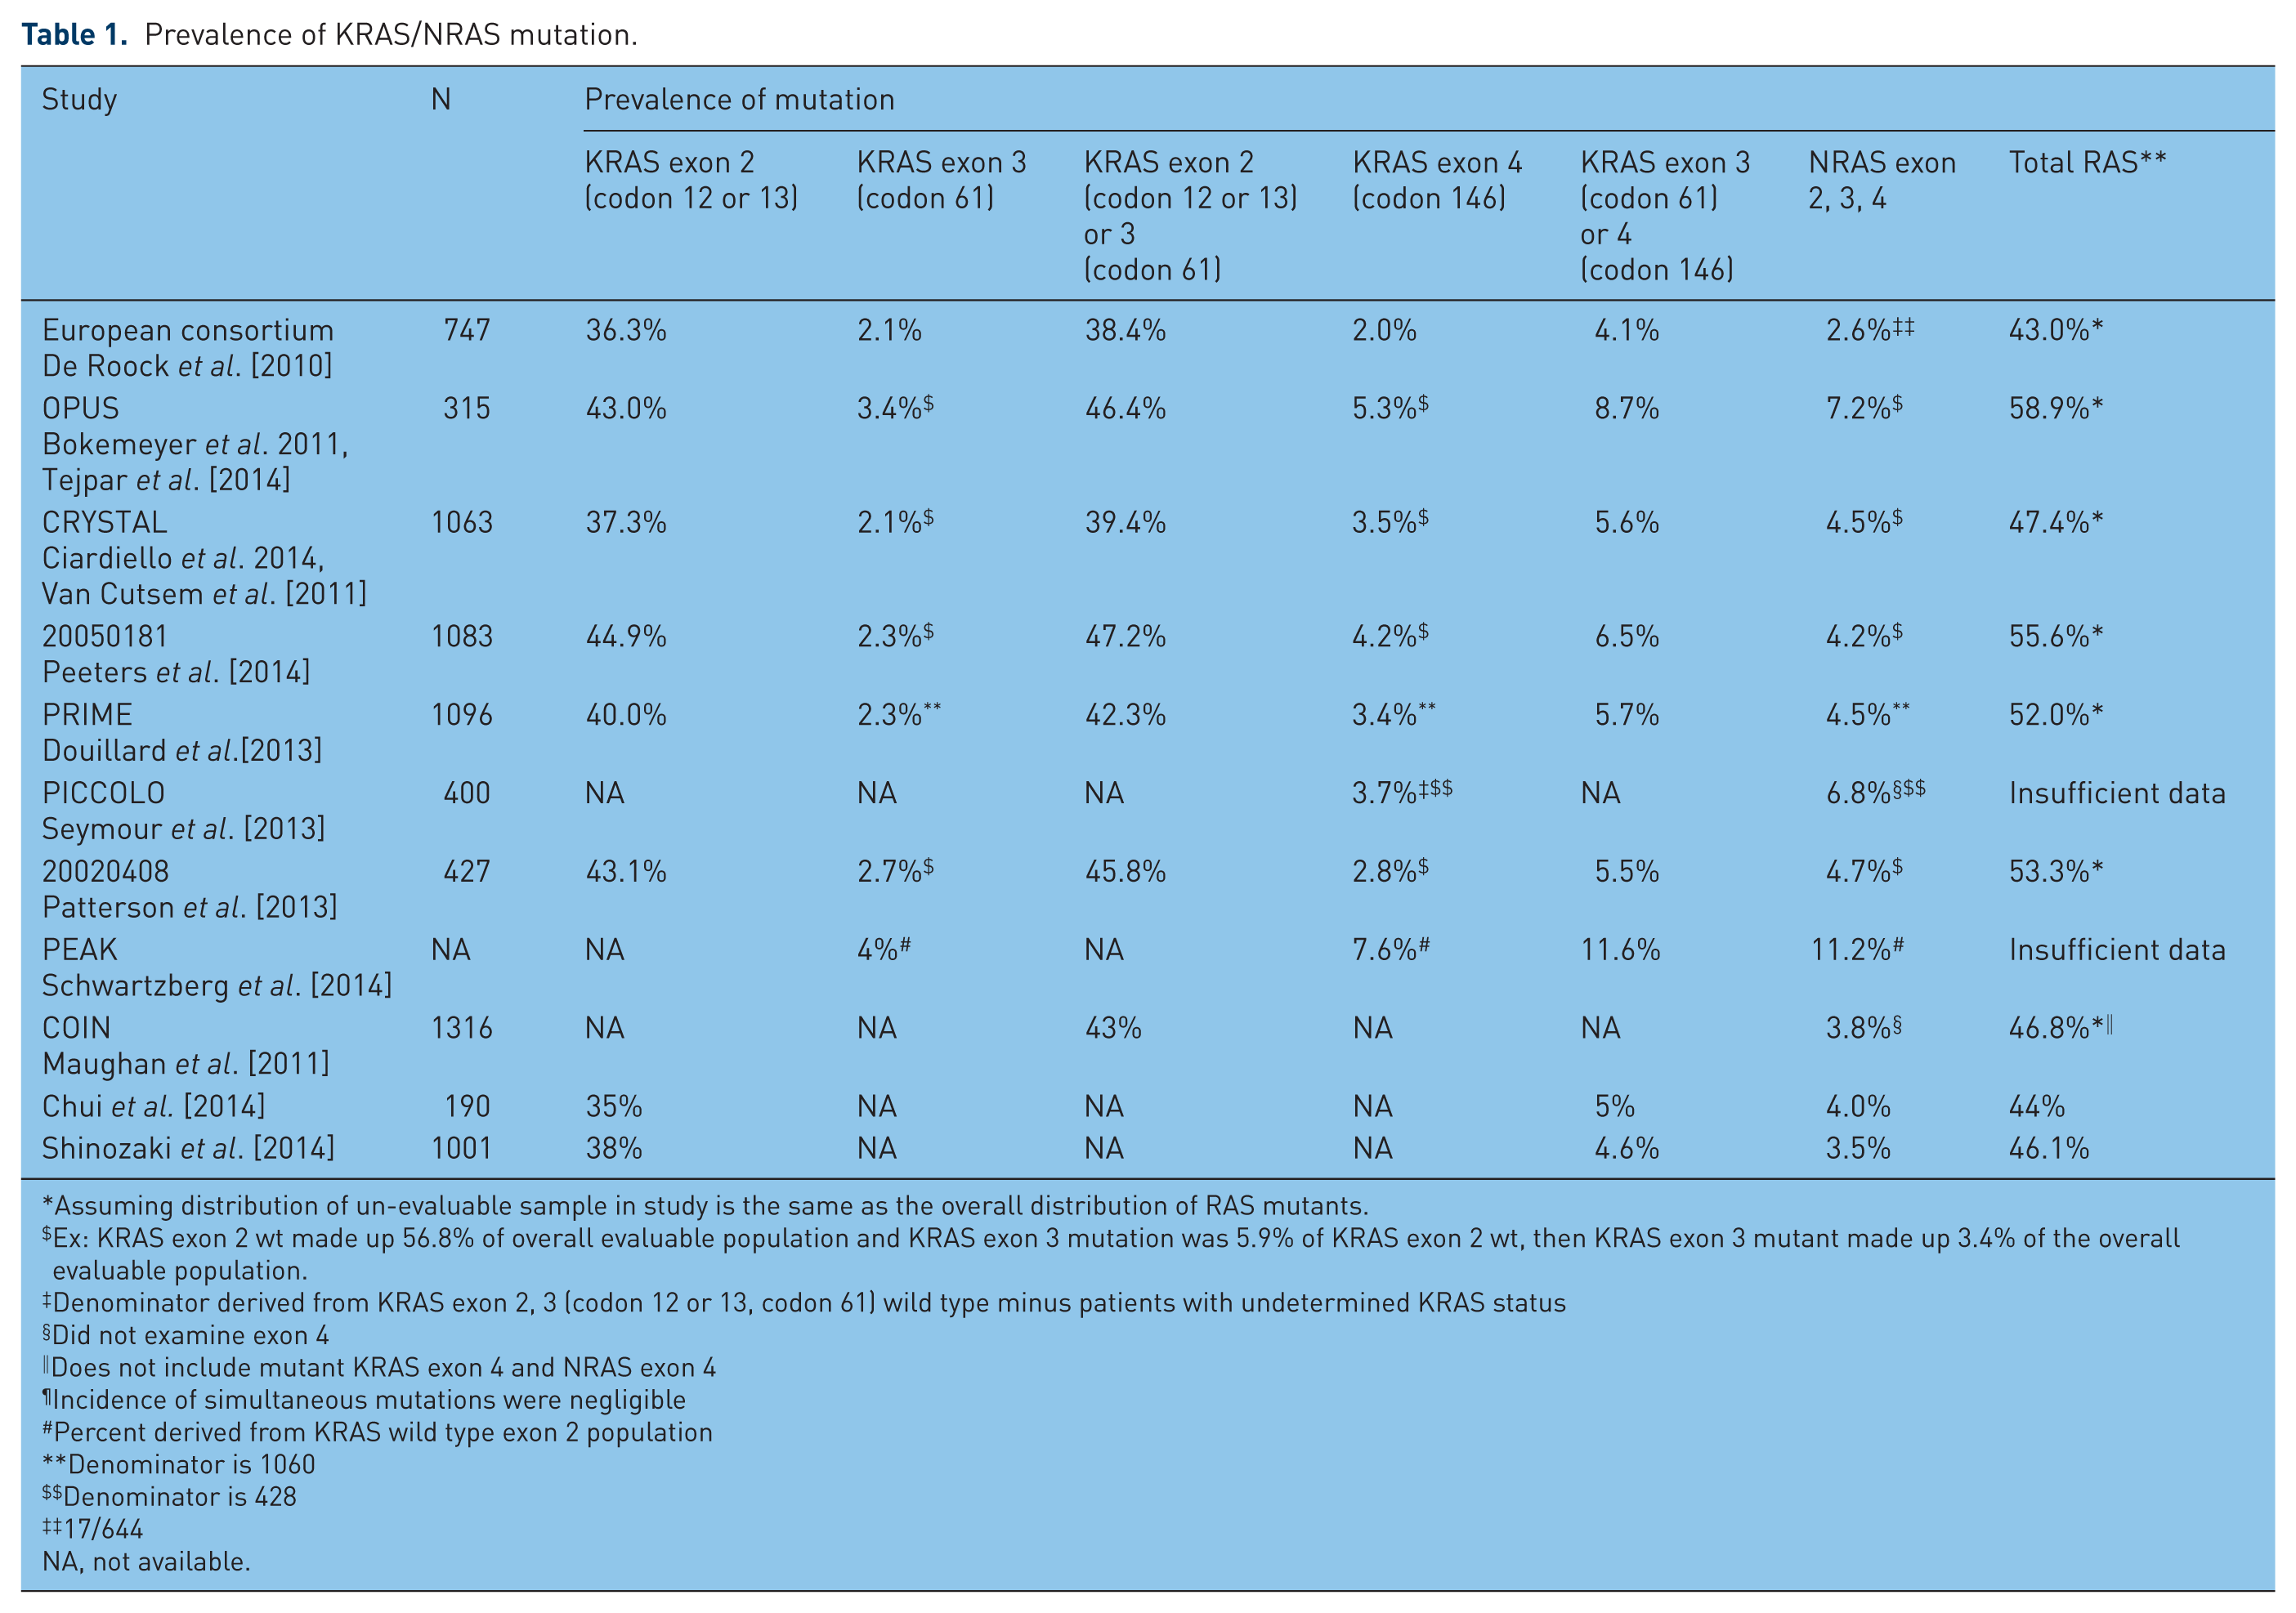
Assuming distribution of un-evaluable sample in study is the same as the overall distribution of RAS mutants.
Ex: KRAS exon 2 wt made up 56.8% of overall evaluable population and KRAS exon 3 mutation was 5.9% of KRAS exon 2 wt, then KRAS exon 3 mutant made up 3.4% of the overall evaluable population.
Denominator derived from KRAS exon 2, 3 (codon 12 or 13, codon 61) wild type minus patients with undetermined KRAS status
Did not examine exon 4
Does not include mutant KRAS exon 4 and NRAS exon 4
Incidence of simultaneous mutations were negligible
Percent derived from KRAS wild type exon 2 population
Denominator is 1060
Denominator is 428
17/644
NA, not available.
Among KRAS exon 2 wildtype patients, as many as 65% are resistant to EGFR monoclonal antibodies [Allegra et al. 2009], necessitating a further search for other biomarkers responsible for this resistance (see Table 2). In a retrospective European consortium analysis, De Roock and colleagues analyzed tumor samples from a large cohort of patients with chemotherapy-refractory mCRC treated with cetuximab and chemotherapy [De Roock et al. 2010]; 40% of evaluable samples harbored KRAS mutations, most commonly at codons 12 or 13 (exon 2) with 2.1% at codon 61 (exon 3) and 2% at codon 146 (exon 4). Among those treated with cetuximab plus chemotherapy, KRAS mutation in any of these codons was shown to portend a highly significant lower response rate (RR), and shorter median progression-free survival (PFS) and OS. NRAS mutations were found in 2.6% of evaluable samples, mostly in codon 61, and were mutually exclusive of KRAS mutations. NRAS mutant cancers had a significantly lower RR when treated with chemotherapy and cetuximab; lower PFS and OS were not statistically significant perhaps owing to the low sample size of NRAS mutants.
RAS mutational status as a predictor of response and survival with anti-EGFR therapy.

Compared to row immediately below. EGFR, epidermal growth factor receptor; mut, mutation; NA, not available; OS, overall survival; PFS, progression-free survival; RR, relative risk; wt, wildtype.
In the OPUS clinical study, efficacy of cetuximab in combination with FOLFOX4 as first-line treatment for mCRC was assessed according to biomarkers status [Bokemeyer et al. 2011]. KRAS mutations were assessed at exon 2 at codons 12 or 13 with 93% mutational status known (315/337). When treated with FOLFOX4/cetuximab versus FOLFOX alone, the KRAS exon 2 wildtype population had a better RR and median PFS. Among the KRAS exon 2 mutant population, outcomes were reversed; adding cetuximab to FOLFOX4 resulted in worse RR and shorter PFS. OS was not significantly affected in either population. Further analysis of patients with KRAS exon 2 wildtype cancers in the OPUS study demonstrated that other KRAS and NRAS mutations led to resistance to anti-EGFR therapies [Tejpar et al. 2014]. Among those with extended spectrum RAS mutations (KRAS mutations at exons 2, 3 and 4, and NRAS mutations at exons 2, 3 and 4), there was no benefit to the addition of cetuximab to FOLFOX4 in RR, PFS or OS compared with FOLFOX4 alone. Interestingly, median OS was shorter in those treated with cetuximab when a RAS mutation was present (though not statistically significant).
A revisit of the CRYSTAL study to assess for other RAS mutations found similar results [Van Cutsem et al. 2015]. New RAS mutations (KRAS exons 3 and 4, and NRAS exons 2, 3 and 4) were further assessed in previous KRAS exon 2 wildtype cancers treated with FOLFIRI/cetuximab versus FOLFIRI alone. The presence of new RAS mutants made no difference in RR, PFS or OS. Similar results were found when all RAS mutations were combined. In contrast, the RAS wildtype population demonstrated highly significant improvements in RR, PFS and OS when treated with FOLFIRI/cetuximab compared with FOLFIRI alone.
The results of the CALGB/SWOG 80405 extended spectrum RAS testing have now been presented [ESMO, 2014; Venook et al. 2014]. In the RAS wildtype population, the median OS was 31.2 months in the chemotherapy plus bevacizumab arm and 32.0 months in the chemotherapy plus cetuximab arm (no significant difference). No difference in PFS was observed. A significant improvement in the RR was seen in the cetuximab arm for the RAS wildtype population (Table 2).
Multiple additional studies have also confirmed similar benefits in different patient populations [Douillard et al. 2013; Abad et al. 2014, Peeters et al. 2014; Schwartzberg et al. 2014].
Peeters and colleagues recently provided an update on RAS and BRAF status from study 20050181 investigating the addition of panitumumab to FOLFIRI [Peeters et al. 2014]. Among all RAS wildtype (KRAS at exons 2, 3 and 4, and NRAS at exons 2, 3 and 4) patients, benefits were observed in PFS when treated with FOLFIRI /panitumumab versus FOLFIRI alone as second-line treatment. Similar to results in other studies, the addition of an anti-EGFR therapy to standard chemotherapy provided no benefit in the presence of an extended-spectrum RAS mutation. In another study performed by Douillard and colleagues of the PRIME data [Douillard et al. 2013], RAS mutations were assessed in patients treated with FOLFOX4 with and without panitumumab. Among those with a RAS mutation other than at KRAS exon 2 (KRAS at exons 3 and 4, and NRAS at exons 2, 3 and 4) treated with FOLFOX4/panitumumab versus FOLFOX4 alone, there was no difference in PFS or OS. Even more compelling, complete RAS mutation analysis (all KRAS at exons 2, 3 and 4, and NRAS mutations at exons 2, 3 and 4) showed those treated with chemotherapy and an anti-EGFR therapy had a significantly shorter median PFS and OS. Having no RAS mutations treated with FOLFOX4/panitumumab conferred a longer median PFS and OS compared with FOLFOX4 alone.
BRAF
BRAF is an oncogene in the RAF gene family that encodes a serine-threonine protein kinase found in the RAS-RAF-MAPK cascade. Approximately 10% of colorectal cancer harbors a BRAF mutation, though this number is highly variable depending on the study population [Davies et al. 2002; Samowitz et al. 2005; Di Nicolantonio et al. 2008]. The most significant and prevalent mutation occurs at the kinase domain from a single substitution V600E. Numerous clinical studies have suggested the presence of this mutation as a predictor of resistance to anti-EGFR therapies [Di Nicolantonio et al. 2008; Laurent-Puig et al. 2009; De Roock et al. 2010; Bokemeyer et al. 2012] and a significant marker of poor prognosis [Di Nicolantonio et al. 2008; Laurent-Puig et al. 2009; Richman et al. 2009; Bokemeyer et al. 2012; Tveit et al. 2012] (see Table 3). In one study [De Roock et al. 2010], BRAF mutant tumors had a significantly lower RR compared with wildtype cancers when treated with an anti-EGFR therapy as well as shorter PFS and OS. Similarly, in a retrospective analysis of RAS and BRAF mutation status of PRIME data [Douillard et al. 2013], patients with neither RAS nor BRAF mutations showed significantly better OS and PFS when treated with FOLFOX4/panitumumab compared with FOLFOX4 alone. The presence of BRAF mutations in RAS wildtype patients resulted in a worse outcome. Treatment with anti-EGFR therapy did not significantly improve median PFS or OS. Having a BRAF V600E mutation portends a poor prognosis regardless of treatment group. In previous pooled data from the OPUS and CRYSTAL studies [Bokemeyer et al. 2012], a BRAF mutation led to overall decreased PFS and OS compared with wildtype tumors irrespective of treatment groups. FOLFIRI/panitumumab versus FOLFIRI alone was examined in the second-line setting by Peeters and colleagues [Peeters et al. 2014]. The presence of a BRAF mutation resulted in no significant differences in PFS or OS whether patients were treated with FOLFIRI/panitumumab or FOLFIRI alone, indicating that BRAF mutations may confer EGFR therapy resistance, although this study was not powered to definitively for this purpose.
BRAF mutational status as a predictor of response and survival with anti-EGFR therapy.

All RAS wildtype. $Compared to row immediately below.
Chemo, chemotherapy; EGFR, epidermal growth factor receptor; NA, not available; NR, not reached; mut, mutation; OS, overall survival; PFS, progression-free survival; RR, relative risk; wt, wildtype.
PIK3CA
Phosphoinositide 3-kinase (PI3K) is a lipid kinase heterodimeric in nature consisting of regulatory and catalytic subunits. It is important for multiple cellular processes including cell growth, proliferation, survival and apoptosis. PI3K is downstream of EGFR signaling and activation of this pathway might lead to resistance to anti-EGFR therapies. The PIK3CA gene encodes the catalytic subunit, p110a, and when mutated results in a constitutively active PI3K. PIK3CA mutations in occur in 10–20% of colorectal cancers [Barault et al. 2008; Prenen et al. 2009; Sartore-Bianchi et al. 2009; De Roock et al. 2010]. Exons 9 and 20 are responsible for more than 80% of PIK3CA mutations in colorectal cancer [Samuels et al. 2004]. To date, the clinical data are still unclear regarding whether the presence of PIK3CA mutation is predictive of response to EGFR-directed therapies.
Sartore-Bianchi and colleagues examined 110 patients with mCRC treated with either panitumumab or cetuximab [Sartore-Bianchi et al. 2009]. Of patients carrying PIK3CA mutations (13.6%; 15/110), of which the majority (11/15) were located at exon 20, and 4 of 15 at exon 9, 0/15 patients with PIK3CA mutation responded to anti-EGFR therapies compared with wildtype (p = 0.038). Further, PFS was noted to be significantly lower (p = 0.0035). The authors concluded that PIK3CA mutations may be an independent predictor of resistance to anti-EGFR. Other studies have similar results [Perrone et al. 2009; Sood et al. 2012]. In contrast, Prenen and colleagues found no such association [Prenen et al. 2009].
PIK3CA and KRAS status were assessed in 200 chemotherapy-refractory mCRC patients subsequently treated with cetuximab as a monotherapy or in combination with irinotecan. A total of 23 (12%) of 200 carried PIK3CA mutations, of which the majority were found on exon 9. There were no differences in PIK3CA mutation status among responders and nonresponders (5/39 versus 18/160, p = 0.781). Furthermore, there were no differences in median PFS (24 versus 18 weeks; p = 0.760) and OS (45 versus 39 weeks; p = 0.698) when comparing mutant with wildtype tumors. In the European consortium, a similar prevalence of PIK3CA mutations, 14.5%, was found [De Roock et al. 2010]. PIK3CA mutations at exon 20 were associated with lack of response to cetuximab whereas mutations in exon 9 were not. This indicates the potential for varying clinical implications depending upon whether PIK3CA is mutated in the helical or kinase domain. This would be unexpected since mutations in either domain result in the constitutive activation of PI3K. In addition, most studies to date have looked at exons 9 and 20 alone, as they account for the majority of the mutations. Other mutations at different sites may play a role. Clearly, further investigations are needed to clarify the role of PIK3CA mutations as predictive biomarker for the treatment of mCRC patients with anti-EGFR therapies.
Discussion
The treatment paradigm for mCRC is rapidly shifting to a more personalized or precision-based approach. Molecular biomarkers now play an increasingly important role in making decisions about targeted therapies. Mutational analysis of genes encoding proteins downstream of EGFR have allowed for the development of biomarkers predicting resistance to anti-EGFR therapies. These same mutations have not been predictive of benefit from anti-VEGF therapies. KRAS exon 2 testing for patients with mCRC was recommended by the European Society of Pathology in 2008 and the American Society for Clinical Oncology (ASCO) in 2009 [van Krieken et al. 2008; Allegra et al. 2009]. Data on KRAS mutations at exon 2 prompted changes by the FDA in 2009 to the approval of anti-EGFR therapies, recommending that it be used only in patients with mCRC without mutations at codons 12 or 13.
The data presented here indicate that any mutation of KRAS at exons 2, 3 and 4 or NRAS at exons 2, 3 and 4 confers a poor response to anti-EFGR therapy [De Roock et al. 2010; Bokemeyer et al. 2011; Douillard et al. 2013; Peeters et al. 2014; Schwartzberg et al. 2014; Tejpar et al. 2014; Van Cutsem et al. 2015]. Conversely, tumors that are wildtype at all loci when treated with anti-EGFR therapies demonstrated significant benefit with extended OS [De Roock et al. 2010; Bokemeyer et al. 2011; Douillard et al. 2013; Abad et al. 2014; Peeters et al. 2014; Schwartzberg et al. 2014; Tejpar et al. 2014; Van Cutsem et al. 2015]. In addition, BRAF mutations are an indicator of poor prognosis and appear to also lead to cetuximab and panitumumab resistance [Di Nicolantonio et al. 2008; Laurent-Puig et al. 2009; Richman et al. 2009; De Roock et al. 2010; Bokemeyer et al. 2012; Tveit et al. 2012; Douillard et al. 2013; Peeters et al. 2014]. These data have led the National Comprehensive Cancer Network (NCCN) to alter its guidelines, which now state that all patients with mCRC should have their tumors tested for KRAS (exons 2–4), NRAS (exons 2–4) and BRAF mutations. Anti-EGFR therapies should not be utilized for patients with RAS or BRAF mutations due to the lack of benefit in all lines of therapy outside of a clinical trial. There is not currently evidence that these mutations significantly alter the response to the approved anti-angiogenic agents bevacizumab, aflibercept, ramucirumab and regorafenib.
There are insufficient data regarding PIK3CA mutations to make any clear conclusion about their effect on response to anti-EGFR therapies. However, due to the concern that activation of the PI3K signaling cascade can result in continued proliferative signaling independent of inhibition of EGFR, continued efforts should be made to better understand the role of PIK3CA mutations in mCRC and its influence on treatment response.
The timing of when to incorporate EGFR-directed therapies for patients with wildtype KRAS, NRAS and BRAF is still being debated. With the currently available data, first-line treatment with anti-EGFR agents in combination FOLFOX or FOLFIRI should be considered for all patients with KRAS, NRAS and BRAF wildtype mCRCs (Table 4). The toxicities of anti-EGFR therapies will also need to be considered for this setting, since some patients do find the acneiform rash, fatigue, nausea and diarrhea that occur with these agents can have a negative impact on their quality of life. Until further information is available, the use of cetuximab or panitumumab for the treatment of PIK3CA mutant mCRCs might be best used in the treatment-refractory.
Clinical use of CRC mutational profiling.

EGFR, epidermal growth factor receptor.
The advances in our understanding of how to utilize the mutation profile to tailor therapies for mCRC outlined in this review demonstrate the critical value molecular profiling plays in the interpretation of clinical trials. Concerted efforts are required to acquire molecular information in conjunction with treatment response data in publically accessible databases. High-quality large-volume data sets will continue to become more important as each molecular subtype of cancer becomes less common. Further investigations are needed not only to look for other markers of resistance, but to also identify biomarkers predictive of treatment sensitivity. This is an exciting time in the treatment of many cancers, as routine DNA sequencing of patient samples has allowed for rapid advances in the realization of precision medicine.
Footnotes
Acknowledgements
The authors thank H. Ian Robins for his review of the manuscript.
Correction (November 2023):
Article updated to correct the second author name to “Ludimila L Cavalcante”.
Funding
This work was supported by the National Institutes of Health (P30 CA014520, Core Grant, University of Wisconsin Carbone Cancer Center).
Conflict of interest statement
The authors declare no conflicts of interest in preparing this article.