
Abstract
Gene flow, the movement of genes between populations, profoundly influences genetic and phenotypic homogeneity among populations. This study investigates gene flow patterns in two migratory hummingbird species, Selasphorus platycercus and Calothorax lucifer, shedding light on the intricate interplay between migration, resource availability, and genetic diversity. Using previously published information on microsatellites, we examine the genetic makeup and the movement of genes within populations. Selasphorus platycercus displays distinct genetic groups which can be associated with its migratory behaviour. Gene flow analysis suggests a higher level of connectivity among populations sharing winter ranges. In contrast, Calothorax lucifer populations exhibit genetic divergence despite overlapping winter ranges, possibly due to environmental niche adaptation and limited reproductive opportunities for dispersing individuals. While geographical distance does not explain genetic differentiation in these species, environmental niche similarities appear to facilitate gene flow. This study underscores the significance of migratory routes, resource availability, and niche adaptation in shaping gene flow dynamics in hummingbirds. Understanding these dynamics is crucial for the conservation and management of these unique avian populations.
Introduction
Gene flow is a collective term that encompasses all the mechanisms by which there is a movement of genes between populations.1,2 Broadly speaking, gene flow impacts the genetic and phenotypic homogeneity of a set of populations, although it is not the only mechanism involved. 3 Indirect measurement of gene flow has shown that patterns of direction and magnitude are species-specific.2,4,5
These variations in magnitude and direction of gene flow can potentially be attributed to the dispersal and movement patterns of individuals, but they can also be influenced by a combination of ecological and behavioural factors, as well as processes such as mutation and selection, which play a role in shaping the magnitude and impact of gene flow. 2 Within these determining factors, geological processes have been linked to the present distribution of alleles in populations. 5 These processes can influence the proximity and ease of movement between populations, thereby imposing barriers that restrict gene flow.5–11 When populations are geographically isolated, the restricted gene flow can result in phenotypic differences between populations through selection or drift.6,12,13 Alternatively, ecological, or behavioral barriers also affect the direction and magnitude of genetic exchange between populations.2,11,14,15 Selection can drive phenotypic divergence between populations inhabiting different ecological environments, resulting in selection against dispersers moving between them. 16 Thus, populations can experience both isolation by distance (IBD) 6 and isolation by environment (IBE), 17 or both. 18
To unravel the intricate factors influencing gene flow, our study focused on two migratory hummingbird species, employing microsatellites extracted from prior studies by Malpica and Ornelas 19 and Licona-Vera et al. 20 Our investigation took a multi-pronged approach. First, it rigorously examined the isolation by distance (IBD) hypothesis, meticulously analysing both geographic and genetic distances between populations. Secondly, we explored the isolation by environment (IBE) hypothesis, aiming to uncover the complex relationships between environmental factors and genetic variation. As a third focal point, our research probed the potential relationships between morphology and genetic variation among populations, shedding light on the fascinating interdependencies within hummingbird populations. These comprehensive investigations collectively provide a profound understanding of the dynamic forces shaping genetic diversity and structure in these migratory hummingbird species.
Hummingbirds are studied here due to their movement and dispersal patterns being closely tied to the availability of nectar, as these organisms primarily rely on it as their main source of food.21,22 The presence of nectar can vary significantly across different habitats and time,23,24 which further influences the movement and distribution of hummingbirds. This level of dependence on a single type of food imposes intense pressure on the individual to locate food sources19,21 thus altering dispersal and migration patterns. 25 Likewise, dependence on nectar as an energy source may be producing a wide variety of feeding and movement strategies that may ultimately affect reproduction, dispersion and gene flow between populations.26,27 Furthermore, recent climate changes can disrupt the timing of bird migrations, leading to an increasing mismatch between the timing of bird arrivals and the peak availability of their food resources, such as nectar. 24 Similarly, climatic events can impact the availability of food, consequently affecting the food accessible to migratory birds. 28 These environmental alterations carry the potential to adversely impact migratory bird populations.24,29
By investigating how migration shapes genetic structure in hummingbirds, our research offers insights into the intricate interplay between movement patterns, food availability, and genetic diversity. This knowledge plays a pivotal role in comprehending the ecological and evolutionary dynamics of hummingbird populations and can contribute significantly to their conservation and management.
Methods
Species’ descriptions
Broad-tailed Hummingbirds (Selasphorus platycercus) have a range that extends from Guatemala to Mexico, encompassing the western United States and Western Canada during the summer. 19 While currently considered a monotypic species, two proposed subspecies exhibit subtle differences in size, plumage coloration, and disjointed geographical distribution. 19 The species can be divided into three main groups. The first comprises migratory populations that breed in the mountains of the western United States, the Rocky Mountains, and the northern portion of the Sierra Nevada. The second group consists of sedentary populations found in northeastern Mexico (Sierra Madre Oriental) and central Mexico along the Trans-Mexican Volcanic Belt, and a third group of sedentary populations restricted to higher elevation mountains in southern Mexico and Guatemala. 30
Lucifer Sheartail Hummingbirds (Calothorax lucifer) have a range that includes deserts and arid areas with agave plants. 20 It can be found in the southwestern United States and central and northern Mexico. 20 The populations of this species in the northernmost regions are migratory, while those in the highlands of eastern Mexico to the Valley of Mexico are sedentary. 20 In contrast, Beautiful Sheartail Hummingbirds (Calothorax pulcher) are a sedentary species that is endemic to arid montane scrub. Its range extends from eastern Guerrero and southern Puebla to central Oaxaca. 20 These two sheartail species are sister species and share morphological similarities. However, during the breeding season, they are largely allopatric, meaning their ranges do not significantly overlap. It is worth noting, however, that the wintering range of the Lucifer Sheartail Hummingbird appears to overlap with that of the Beautiful Sheartail Hummingbird, as observed in a previous study. 20
Molecular data
We conducted a reanalysis of the microsatellite data published by Malpica and Ornelas
19
and Licona-Vera et al.
20
These studies specifically examined the impact of glaciations on the distribution and ecology of hummingbirds belonging to the genera Calothorax and Selasphorus by using eight autosomal microsatellites (HumB1, HumB2, Humb3, Humb9, HumB10, HumB11, HumB12 and HumB15), which were developed for the Broad-tailed Hummingbird by Oyler-McCance et al.
31
Malpica and Ornelas
19
identified five populations for the Broad-tailed Hummingbird, distributed in the southern United States, one population east of the Sierra Madre, two populations west of the Sierra Madre and a fifth one south of the Isthmus of Tehuantepec (Figure 1). Meanwhile, Licona-Vera et al.
20
identified three distinct populations of Sheartail Hummingbirds distributed in specific geographic regions (Figure 1). The first population is located in the southernmost part of the United States, near the border with Mexico. The second population is situated north of the Trans-Mexican Volcanic Belt, while the third population is found south of the Trans-Mexican Volcanic Belt. For finer details of the sampling scheme please consult the original papers.19,20 We designated population names based on the genus they belong to (‘c’ for Calothorax and ‘s’ for Selasphorus), followed by their migratory status (‘MIG’ for migratory and ‘SED’ for sedentary populations), ending with a letter that determines the general geographic location (‘u’ for the United States, ‘m’ for Mexico, which can be subdivided into ‘n’ for north, ‘c’ for center, and ‘s’ for south). Geographic distribution of the Broad-tailed Hummingbird and the Lucifer Sheartail Hummingbird sampled localities and populations.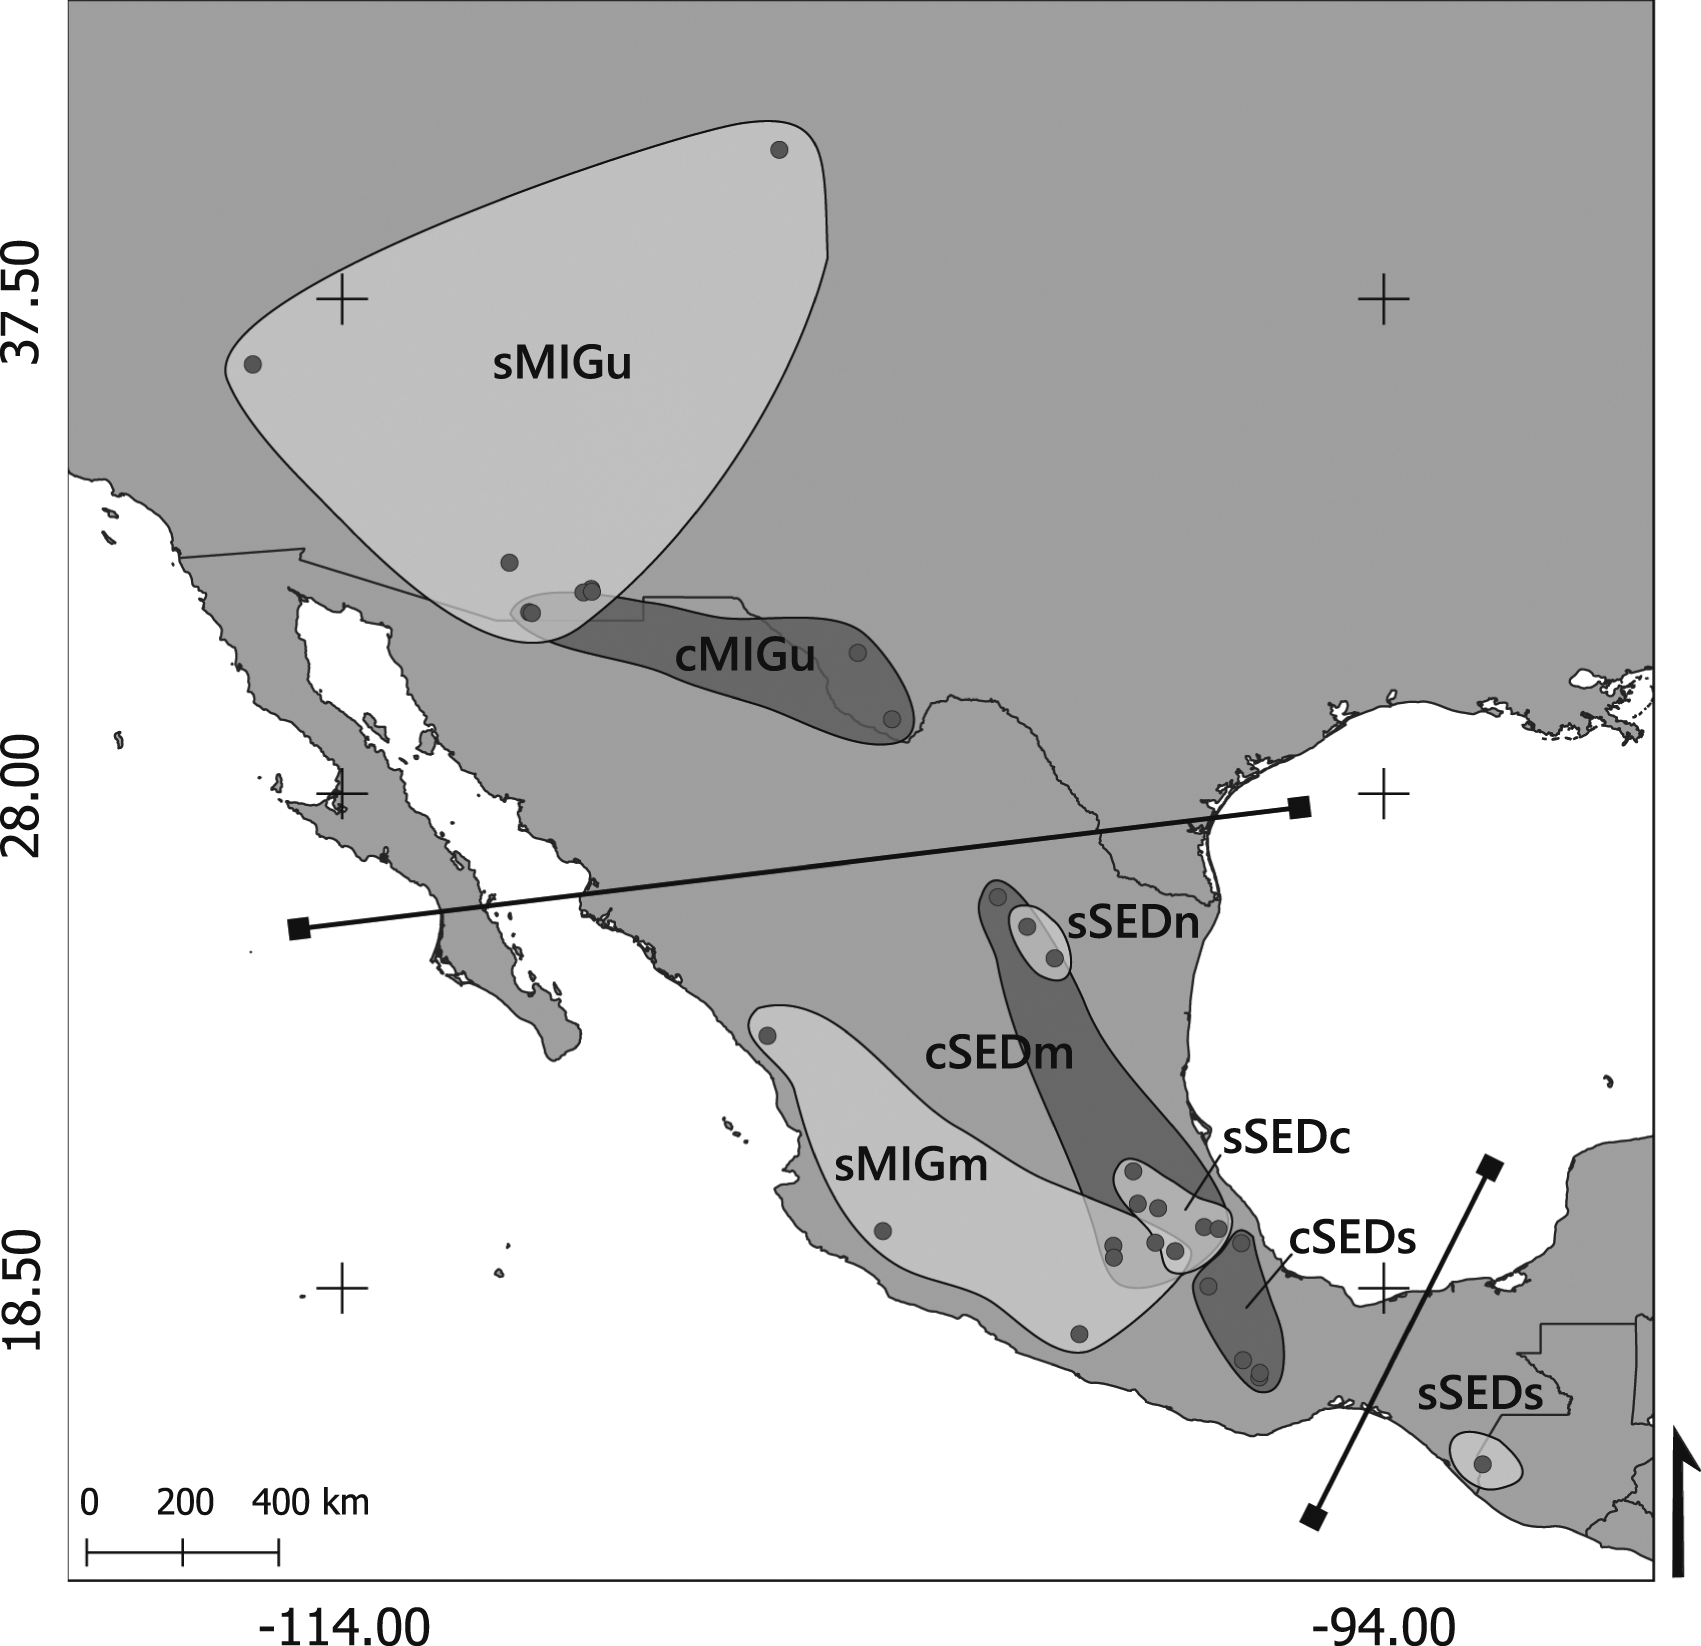
Genetic diversity and structure
Genetic diversity is the variety and variability of genetic characteristics within a population. 6 It encompasses the number of different alleles, genetic variations, and the frequency distribution of those alleles in each population. To define genetic diversity of the hummingbird populations we estimated microsatellite frequencies, expected and observed heterozygosities, and number of alleles per locus using the GENEPOP v. 4.7.5.32,33 These values were calculated for each locus at the population level, and finally they were averaged, obtaining values for each population.
The observed and expected heterozygosity values were used to assess the genetic differentiation between populations. Genetic differentiation quantifies the level of genetic variation among different populations or groups within a species, specifically measuring the differences in genetic traits and allele frequencies. In this study, we utilised two genetic differentiation statistics, G'ST 34 and D, 35 to assess the extent of genetic differentiation between populations. Genetic differentiation, measured by G'ST, quantifies the proportion of genetic variation among populations relative to the total genetic variation and is valuable for understanding the partitioning of genetic diversity between populations.34,36 In contrast, D is a genetic differentiation metric that takes into account the presence and abundance of genetic variants within populations.35,36 Unlike G'ST, Jost's D considers not only the proportion of genetic diversity among populations but also within populations.35,36 It has been shown that these statistics do not have biases related to the value of genetic diversity or the sample size, and allow a greater number of significant differences to be observed compared to other differentiation statistics.34,35 Genetic differentiation was calculated between pairs of populations and the significance associated with each value was calculated using the X2 of Workman and Niswander. 37 Finally, the resulting matrices were compared using the Mantel test with 9,999 permutations using the R package Vegan. 38
Additionally, the STRUCTURE v2.3.4 software 39 was used to identify and analyse the underlying population structure within and between the populations of both taxa. Both were evaluated together, and subsequently the analysis was repeated for each of the taxa. The analysis consisted of dividing the genetic data into K parts and evaluating which value of K best divides the data. For each K between 1 and 10, the analysis was repeated five times each with 1,500,000 steps in the Markov Monte Carlo chain (MCMC) and the first 500,000 steps were discarded, thus ensuring data convergence. The results of the analysis were observed using Structure Harvester 40 and Pophelper. 41 The best way to split the data (best K) was evaluated according to Pritchard et al. 39 and Evanno et al. 42
Gene flow analysis
Genetic differentiation statistics G'ST
34
and D
35
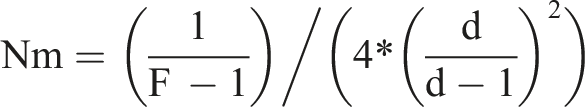
values were used to calculate the the values of gene flow (
Genetic isolation
To search for relationships that explain the values of genetic differences and gene flow in the evaluated populations, three hypotheses were explored. First, the isolation by distance (IBD) hypothesis 6 was explored using geographic and genetic distances between populations of both taxa. The coordinates of each population were calculated using the Qgis, mean coordinates tool, to then calculate the geographic distances between populations using the R package Marmap 47 using the least-cost path function. Secondly, the isolation by environment (IBE) hypothesis 16 was evaluated, where environmental distances were calculated from Bioclim data. 48 Bioclim data values were extracted for each locality reported by Malpica and Ornelas 19 and Licona-Vera et al. 20 and projected into the main components of the Principal Component Analysis (PCA). Within the PCA analysis, centroids were computed for each population, and from these points, Euclidean distances between pairs of populations were calculated, thereby constructing an environmental similarity matrix.
In addition, we investigated the potential relationship between morphology and genetic variation among populations. Morphometric data from Malpica and Ornelas 19 and Licona-Vera et al. 20 were utilised to analyse the first four principal components, as indicated by the Broken-Stick Model. 49 The broken stick method is used to determine whether the variance explained by each principal component is significant or if it can be attributed to random chance. 49 These components served as the basis for determining the centroids for each population and to construct the morphological similarity matrix.
The three hypotheses were examined using Mantel tests to assess the correlation between two matrices. The Mantel test was employed to measure the impact of geographic distance, climatic differentiation, and morphological similarity on genetic differentiation. Additionally, to account for the effects of covariates, six additional tests were conducted using Partial Mantel tests. For each hypothesis, two additional tests were executed to control for the effect of a specific covariate. For example, in the case of testing for IBD, the genetic distance served as the response variable, the geographic distance as the predictor variable, and the environmental distance as the condition factor. Another test was conducted, replacing the condition factor with the morphological similarity between populations. Statistical significance was determined using an alpha threshold of 0.05. To observe the form of these correlations we generated linear regression analysis performed on the R packages Vegan, 37 Corbi, 50 and Ecodist. 51 Together with the linear regression a two-dimensional Kernel density of the points was calculated to observe any possible subdivisions within the regression. In addition to linear regression, we employed polynomial regression models to investigate the influence of isolation hypotheses on genetic differentiation. To assess the model performance and facilitate model comparisons, we utilized the Akaike Information Criterion (AIC). 52 The AIC is a statistical tool used to evaluate the goodness of fit of different models which considers both the model's fit to the data and its complexity, striking a balance between model accuracy and simplicity. 52 In our study, we employed the AIC to assess and compare a range of regression models, including both linear and polynomial models. This approach enabled us to pinpoint the models that most effectively captured the associations between isolation hypotheses and genetic differentiation.
Results
Genetic diversity
Genetic diversity for populations evaluated of the Broad-tailed Hummingbird and the Lucifer Sheartail Hummingbird. n is the sample size for each population,

Genetic structure
The two statistics (G'ST and D) used were positively correlated (r = 0.99, p < 0.001). However, the numerical values varied drastically. At the taxon level, these statistics presented high average differentiation values, which showed a high average divergence between the two taxa (G'ST = 0.74 and D = 0.60). At the population level, the average genetic differentiation was G'ST = 0.12 and D = 0.06 (p < 0.0001 for both). Both statistics revealed the same trend in the genetic structure, but the G'ST statistic allowed us to observe the greatest amount of genetic differentiation between populations, so we present only the results of the G'ST statistic (Figure 2A). Genetic structure of the Broad-tailed Hummingbird and the Lucifer Sheartail Hummingbird. (A) Genetic differentiation of the G'ST calculated by pairs of populations where the asterisks (*) determine significant differences (p < 0.001). (B-D) Results of the genetic structure in STRUCTURE, where (B) is the global analysis (K = 5), (C) is the analysis for the Calothorax taxon (K = 4) and (D) the analysis for the Selasphorus (K = 2) taxon.
According to the G'ST statistic (Figure 2A) the three populations of the Calothorax taxon differed significantly from each other, being considered as three different genetic groups. Regarding the populations of the taxon Selasphorus, there was a significant difference between the migratory populations sMIGu and sMIGm (G'ST = 0.06, p < 0.0001). Likewise, the population of southern Mexico (sSEDs) differed genetically from all populations (Figure 2A).
The STRUCTURE analysis revealed a hierarchical genetic organization, indicating that the strongest differentiation signal supported the notion that both taxa indeed belong to two different genera (K = 2). This was followed by a genetic division (K = 5) corresponding to a geographical division, thereby separating the populations according to their geographical location, north, central, and south of the distribution area (Figure 2B). For the taxon Calothorax this division was also consistent with migratory status, dividing the migratory population cMIGu from the sedentary populations cSEDm and cSEDs. Analysis of STRUCTURE with data segmented at the genus level revealed a subdivision of the geographic structure. For the Calothorax taxon, the northern cMIGu population was divided in two in an east-west direction. The cSEDm and cSEDs populations from central Mexico were maintained, but individuals from the cSEDm population were observed to be more like the individuals from the cSEDs population (Figure 2C). At the population level, G'ST values alone could not discern subpopulation divisions. However, our results consistently indicated significant differentiation among all three populations. Additionally, STRUCTURE analysis suggested possible for gene flow among sedentary populations.
At the level of the taxon Selasphorus, the geographic subdivision of north-central-south was lost, and the observed pattern was related to the geographic isolation of the populations of southern Mexico sSEDs (Figure 2D). This agreed with the G'ST statistic values, as both analyses determined that the southern population differed significantly from the rest.
Gene flow
Selasphorus populations (Nm = 2.96) had on average a greater number of migrants per generation than Calothorax populations (Nm = 0.36) (Figure 3). Among certain Selasphorus populations (sMIGu and sSEDc, sMIGm and sSEDn and between sSEDn and sSEDc) gene flow tended to infinity which was an indication of no genetic structure between them. Gene flow values also indicated that the most geographically distant populations tended to have the lowest value of gene flow, such as between the pairs of cMIGu and cSEDs populations (Nm = 0.23) or the sSEDs population with respect to the other populations of the same genus (Nm = 0.32). Chord diagram of historical gene flow between pairs of evaluated populations of the Broad-tailed Hummingbird and the Lucifer Sheartail Hummingbird. The numerical scale represents the number of migrants per generation (Nm) calculated using the finite island model and the G'ST differentiation statistic. Black lines represent infinite gene flow among pairs of populations. The figure provides a clear visual depiction of gene flow patterns among populations by illustrating the relationships between nodes (populations) with arcs (gene flow magnitude).
Isolation
Analysis of genetic isolation hypotheses for the Broad-tailed Hummingbird and the Lucifer Sheartail Hummingbird. R2 quantifies explained data variance.

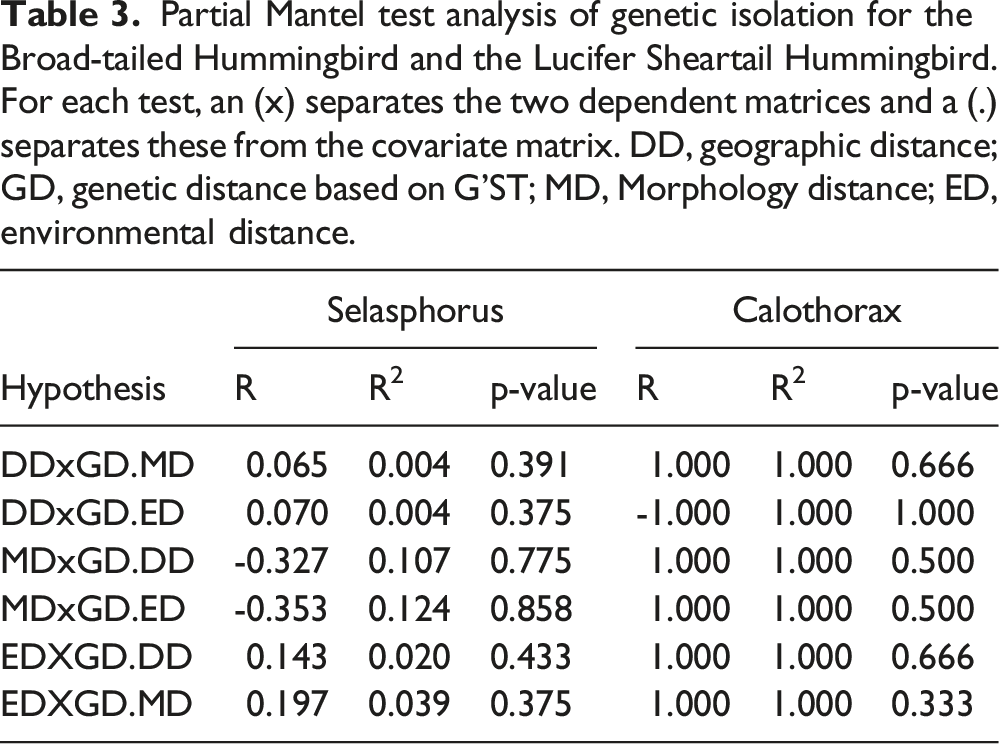
Partial Mantel test analysis of genetic isolation for the Broad-tailed Hummingbird and the Lucifer Sheartail Hummingbird. For each test, an (x) separates the two dependent matrices and a (.) separates these from the covariate matrix. DD, geographic distance; GD, genetic distance based on G’ST; MD, Morphology distance; ED, environmental distance.

Correlations between genetic differentiation and environmental distances among populations of the Broad-tailed Hummingbird and the Lucifer Sheartail Hummingbird. The solid line represents the result of the linear regression analysis considering all pairs of populations, while the dotted line represents the result after excluding pairs that include the most southern population (marked as squares).
Linear regressions faintly suggested a relationship between environmental differences and genetic structure. In the case of Selasphorus, the two-dimensional Kernel density revealed that there were two pairs of populations distinguishable from the rest of the points. If these two points are eliminated, a significant association (R2 = 0.73 ; p = 0.007) for a group of populations of the Selasphorus taxon and environmental distances was founded (Figure 4A, dotted line). The two deleted points correspond to the southernmost population sSEDs, specifically the pair of sMIGm-sSEDs and sSEDc-sSEDs populations. In addition, a polynomial fit of order two suggested a significant relationship among environment and genetic differences (R2 = 0.95; p = 0.0007). Nonetheless, according to the Aikaike Information Criterion (AIC) this model was penalized for overfitting data (AIC = 34.513) and thus we selected a linear relationship (AIC = 14.588). In the case of Calothorax, linear regression between environmental differences and genetic divergence explained the most variation among data (Figure 4B; R2 = 0.97) with the lowest p-value (p = 0.12) among the three evaluated hypotheses.
Discussion
Our primary objective was to investigate the complex factors influencing gene flow in two migratory hummingbird species. We sought to test the isolation by distance (IBD) hypothesis by examining both geographic and genetic distances between populations. Additionally, we explored the isolation by environment (IBE) hypothesis, aiming to uncover the intricate links between environmental factors and genetic differentiation. Lastly, we delved into potential relationships between morphology and genetic variation among populations.
The study's key findings reveal significant genetic differentiation between migratory and sedentary populations within the Broad-tailed Hummingbird and the Lucifer Sheartail Hummingbird. Genetic analysis exposed substantial genetic divergence which aligns with geographic regions and migratory behaviours. Significantly, the Sheartail Hummingbirds demonstrated a more prominent genetic structure compared to the Broad-tailed Hummingbirds, with the latter generally exhibiting higher levels of gene flow. Remarkably, the study offered limited support for the isolation hypotheses (distance, environment, and morphology) as significant drivers of genetic differentiation.
The patterns of gene flow observed between the two species under investigation align with previously reported findings. 53 However, it is important to note that there is a significant correlation between gene flow and dispersal, 54 as well as between dispersal and reproduction,54,55 as indicated by prior research. Therefore, any barrier to dispersal and reproduction between populations is in fact a barrier to gene flow. In the case of Selasphorus and Calothorax taxa, there are two types of gene flow pattern, which can be interpreted as if these two taxa are subject to different factors that affect gene flow. Nonetheless, we suggest that such patterns can be explained through several characteristics of their migratory behaviour.
In theory, migratory behaviour is expected to enhance gene flow between populations due to increased dispersal distances of individuals and enhanced connectivity between them. 56 It is anticipated that over the ranges where migratory populations move, there would be greater gene flow and, consequently, less genetic differentiation recorded.56,57 The results obtained in our study indicate a reduction in genetic differentiation, particularly among populations of the Broad-tailed Hummingbird. Genetic structure analysis and the assessment of gene flow suggest that populations of this species can be classified into two main groups characterised by significant genetic differentiation. The first is made up of highly connected populations stretching from the United States to central Mexico (sMIGu, sMIGm, sSEDn and sSEDc), and the second of only the southern population (sSEDs); it is not part of the winter range of migratory populations.19,58,59
Broad-tailed Hummingbird population structure can be associated with the winter ranges of each of the populations. Populations that share their ranges during winter have a greater possibility of interacting since individuals occupy similar spaces;56,57 on the other hand, populations that do not share winter ranges are excluded from interaction and thus genetic differences can arise. This is the case of the southern population, sSEDs, which is isolated from the rest of the populations during the winter19,58,59 and it is the population with the lowest average immigrants per generation as identified in this study.
The lack of correlation between G'ST and Nm values with geographical distances indicates that there is no IBD among populations. This could be explained by migration and its increased dispersion distances,57,60,61 but most importantly, it highlights the effect of migratory routes. Broad-tailed Hummingbird migratory populations (sMIGu and sMIGm) had low gene flow among them. We suggest that these two populations have scarce opportunities to interact based on the migratory routes of other hummingbirds of the genus Selasphorus, 62 as the northern migratory population (sMIGu) may move predominantly through the eastern Sierra Madre, while the Mexican migratory population (sMIGm) may move through the western and central Sierra Madre.62,64 However, these migratory routes have not been confirmed by tagging of individuals or any other means. These suggested migratory routes could also explain why sMIGu had a low genetic differentiation from the sedentary population sSEDc, and why sMIGm had low genetic differentiation from sSEDn. In short, migratory routes increase the possibility of interaction between populations by increasing the dispersal distances of individuals 56 and by directing gene flow to certain areas.54,64 Thus, geographical distance is not a factor.
Dispersion alone cannot increase gene flow because it requires breeding between individuals.55,65,66 Three possible mechanisms have been proposed that can facilitate reproduction between individuals with different migratory behaviour. In the first place, migratory individuals upon arrival in winter areas may copulate and reproduce with sedentary individuals, which is known as migratory double breeding.60,67 This penomenon has been observed in bird species with Neotropical–Nearctic migration system: the Yellow-billed Cuckoo (Coccyzus americanus), Cassin's Vireo (Vireo cassinii), Yellow-breasted Chat (Icteria virens), Hooded Oriole (Icterus cucullatus), Orchard Oriole (Icterus spurius), and the Phainopepla (Phainopepla nitens). These species migrate south, not primarily for moulting or phenology purposes, but rather to breed a second time after having already bred in the northern regions.67–69 In addition, dual breeding in nocturnal migrants has been inferred for the northward migration in species that winter in Africa and breed in Eurasia. 67
This explanation may be plausible since individuals of the Selasphorus genus are known to engage in promiscuous mating behaviour, 63 which allows multiple breeding attempts. Secondly, there could be migratory individuals that remain in the wintering ranges, breeding with sedentary individuals. This is feasible since the migration of some hummingbirds of the genus Selasphorus is structured by age, with adults being the first individuals to arrive and leave the winter ranges, while juveniles arrive later with a delay of between one or two weeks (64,65,69-74). This age-structured migration is an indication of low migratory connectivity, where populations would not be migrating together, which facilitates the dispersal and site fixation of young individuals to winter ranges, 56 especially as young individuals are more likely to disperse as competition for resources tends to displace them.73–75 Finally, it is possible that there are individuals in sedentary populations that disperse north along with migratory individuals, especially since Malpica and Ornelas 19 observed a demographic expansion north after the last glaciation. Genetic traits that regulate migratory behaviour can be explained by the threshold model of quantitative genetics, 76 so in certain sedentary populations, genetic variation related to migration can remain present without being expressed. In other words, within sedentary populations there are migratory individuals 75 and this mixing could allow individuals in sedentary populations to migrate by interacting with migratory individuals.
On the other hand, genetic structure and gene flow indicated that Sheartail hummingbirds populations are three distinct populations, with significant genetic differences and low gene flow. In Sheartail hummingbirds, the observed pattern was different, even though winter ranges overlap between migratory and sedentary populations20,77 and sex-structured migration is present, where males migrate approximately a month earlier than females.70–72 This pattern suggests that either dispersal is too low 78 or that dispersal to new sites is insufficient to reduce genetic differences between populations, 79 which ultimately leads us to conclude that reproduction is imperative for gene flow to occur.55,79
We propose that in the case of the Sheartail Hummingbirds, there exists a reproductive barrier attributed to the suitability of migratory individuals and their adaptation to their specific local niche. Licona-Vera et al. 20 identified that the three Sheartail Hummingbirds populations differed in their environmental niche. This can affect the survival of dispersers and migrants in new ranges due to their limited adaptation to new environmental conditions.54,80,81 It has been shown that not all individuals reproduce, especially those that are migrants or dispersers, since these are often of different age classes, body condition, social status, or genotype compared to non-disperser individuals.80,81 This is reflected in scarce opportunities to reproduce between individuals of different populations.20,82,83
This last point indicates that environmental niches could be better predictors of genetic differentiation and gene flow, especially in highly adapted organisms such as hummingbirds.19,21,26,27 As evidenced in our results, a subset of the Broad-tailed Hhummingbird populations exhibited a notable connection between the genetic differentiation of populations and environmental distances, highlighting the idea that ranges with similar environmental niches facilitate reproduction and gene flow, while discordant environmental conditions limit gene flow. We suggest that a similar phenomenon occurs in the case of the Sheartail Hummingbird. However, the statistical methods utilised in our study constrain our ability to ascertain the significance of these relationships among the variables. The lack of significance in these regression analyses can be attributed to the relatively small number of populations evaluated.
In short, the most important role of migratory behaviour in gene flow is to facilitate and direct dispersal to certain areas (winter ranges), enabling the interaction of individuals from migratory and sedentary populations. However, for there to be effective gene flow there must be successful breeding which may be limited by prezygotic barriers. These barriers include factors such as habitat differences, and temporal isolation, which can limit the opportunity for individuals to mate and exchange genetic material.
Footnotes
Declaration of conflicting interests
The author(s) declared no potential conflicts of interest with respect to the research, authorship, and/or publication of this article.
Funding
The author(s) received no financial support for the research, authorship, and/or publication of this article.