
Abstract
Aims:
Addressing fuel poverty is a critical public health issue given its recent rise in prevalence across Europe. Although previous research identifies national risk markers of fuel poverty, evidence is lacking on whether these are consistent across local geographies, and the equity of local interventions. In the UK’s current economic climate, it is more crucial than ever that services benefit households in greatest need. This study aimed to determine significant predictors of fuel poverty among households in Bradford, England, comparing them to national-level predictors, and evaluate if households possessing significant fuel poverty predictors were equitably referred to a local fuel poverty service (Warm Homes Healthy People, WHHP).
Methods:
A multivariate logistic regression model determined significant fuel poverty predictors in Bradford using household-level data from the Energy Saving Trust and the Low Income High Costs fuel poverty definition. Statistical testing highlighted significant differences in predictors of fuel poverty between households referred to WHHP and all Bradford households.
Results:
Significant (p < .05) predictors of fuel poverty included: living in an area with lower average household incomes and higher proportion of ethnic minority individuals, and living in a property with a lower energy efficiency rating. Households living in a detached or older property, and homeowners were more likely to be fuel poor. Differences in the direction of the relationship with fuel poverty were identified between some national and local predictors. Most predictors were significantly (p < .05) overrepresented among WHHP households, suggesting equitable service reach. Ethnic minorities, younger people, and multiperson households were underrepresented.
Conclusions:
Local fuel poverty predictors were similar to many national-level predictors, but identified differences in the direction of the relationship between some national and local predictors reaffirm the value of locally focused research. WHHP successfully targeted households possessing key predictors, but should ensure that ethnic minorities, younger people, and multiperson households are equitably referred.
Introduction
Fuel poverty, also known as energy poverty, 1 is defined as a household’s inability to afford to keep adequately warm to achieve a healthy standard of living at a reasonable cost. 2 Fuel poverty is a critical issue for public health, given its association with a multitude of health and socioeconomic consequences for households and wider society. In much of Europe, fuel poor households are at greater risk of damp, cold, and mouldy homes, leading to development or exacerbation of respiratory health issues (including asthma and infections such as influenza) and cardiovascular conditions (including strokes and heart attacks).3,4 Fuel poverty negatively impacts mental health 5 due to stress, anxiety, and worry about finances and living conditions. Groups more vulnerable to fuel poverty include those already living with these health conditions, older people, households with young children, and low-income households. 6 People living in fuel poverty are more likely to have days off work and school, which can impact household finances and educational attainment.7,8 There are also knock-on effects for healthcare. For example, in England, annual National Health Service treatment costs related to illnesses caused by cold homes are estimated to be around £1.3 billion. 9
Three main drivers of fuel poverty widely discussed in the literature are income, energy efficiency, and energy prices, 7 with recent research highlighting the complexity of interaction between these drivers and additional factors, including demographic and physical housing characteristics, and national and local policies that impact on energy prices and household expenditure.10,11
Existing literature highlights key risk markers of and vulnerabilities to fuel poverty.11–16 In England, most research on this topic is nationally focused, with significant characteristics influencing whether a household is living in fuel poverty grouped into three main categories: household income and employment,5,8,17 occupant demographics,10,18 and housing characteristics.5,18,19 Energy consumption habits are also important to consider 20 but it is notable that these will not impact whether a household is deemed fuel poor according to current UK government definitions. 21
Yet while research identifies national risk markers of fuel poverty, evidence is lacking on whether these are consistent across local geographies. This information is crucial to enable locally based intervention services to be aware of and equitably engage with populations most at risk of fuel poverty. Previous evaluations of fuel poverty initiatives in Europe highlight issues with targeting and reaching fuel poor homes.12,13,22 There is a significant research gap in evaluating the equity of local interventions. This is a particular concern in the UK given long-term cuts to local authority budgets and the ongoing cost-of-living crisis17,23: more than ever there is a need to ensure local funding and fuel poverty programmes benefit those who most need help.
This study aimed to address these gaps in the literature. First, through determining significant predictors of fuel poverty in one local geography and exploring if and/or how these differ to national findings; and, second, by evaluating if households with significant local predictors of fuel poverty have been equitably referred into a local fuel poverty service, and thus if they are benefitting households in most need.
Intervention Site
Bradford, a district in West Yorkshire, England, with over half a million residents 24 was selected as an appropriate intervention site to explore risk markers of fuel poverty at a smaller geographic level as it has a different demographic structure and housing stock to the national average: a younger, more deprived population; higher proportion of ethnic minority individuals; an older housing stock; and higher proportion of privately rented homes compared to the national average. Bradford has higher than average rates of fuel poverty, with 19.2% of households living in fuel poverty in 2021, compared to 13.1% nationally, as measured by using the UK government’s Low Income Low Energy Efficiency (LILEE) definition.25–28
Furthermore, Bradford has a fuel poverty service–Warm Homes Healthy People (WHHP)–that has been operating for over a decade, with data from which it was possible to evaluate the equity of referrals. Initially funded by the Department of Health, but now commissioned by Bradford Council, WHHP aims to address the impacts and underlying causes of fuel poverty by focusing on prevention and early intervention. Multiple WHHP service providers work in partnership across Bradford, including the lead provider Groundwork, Bradford AgeUK, Inn Churches, and the HALE Project. 29
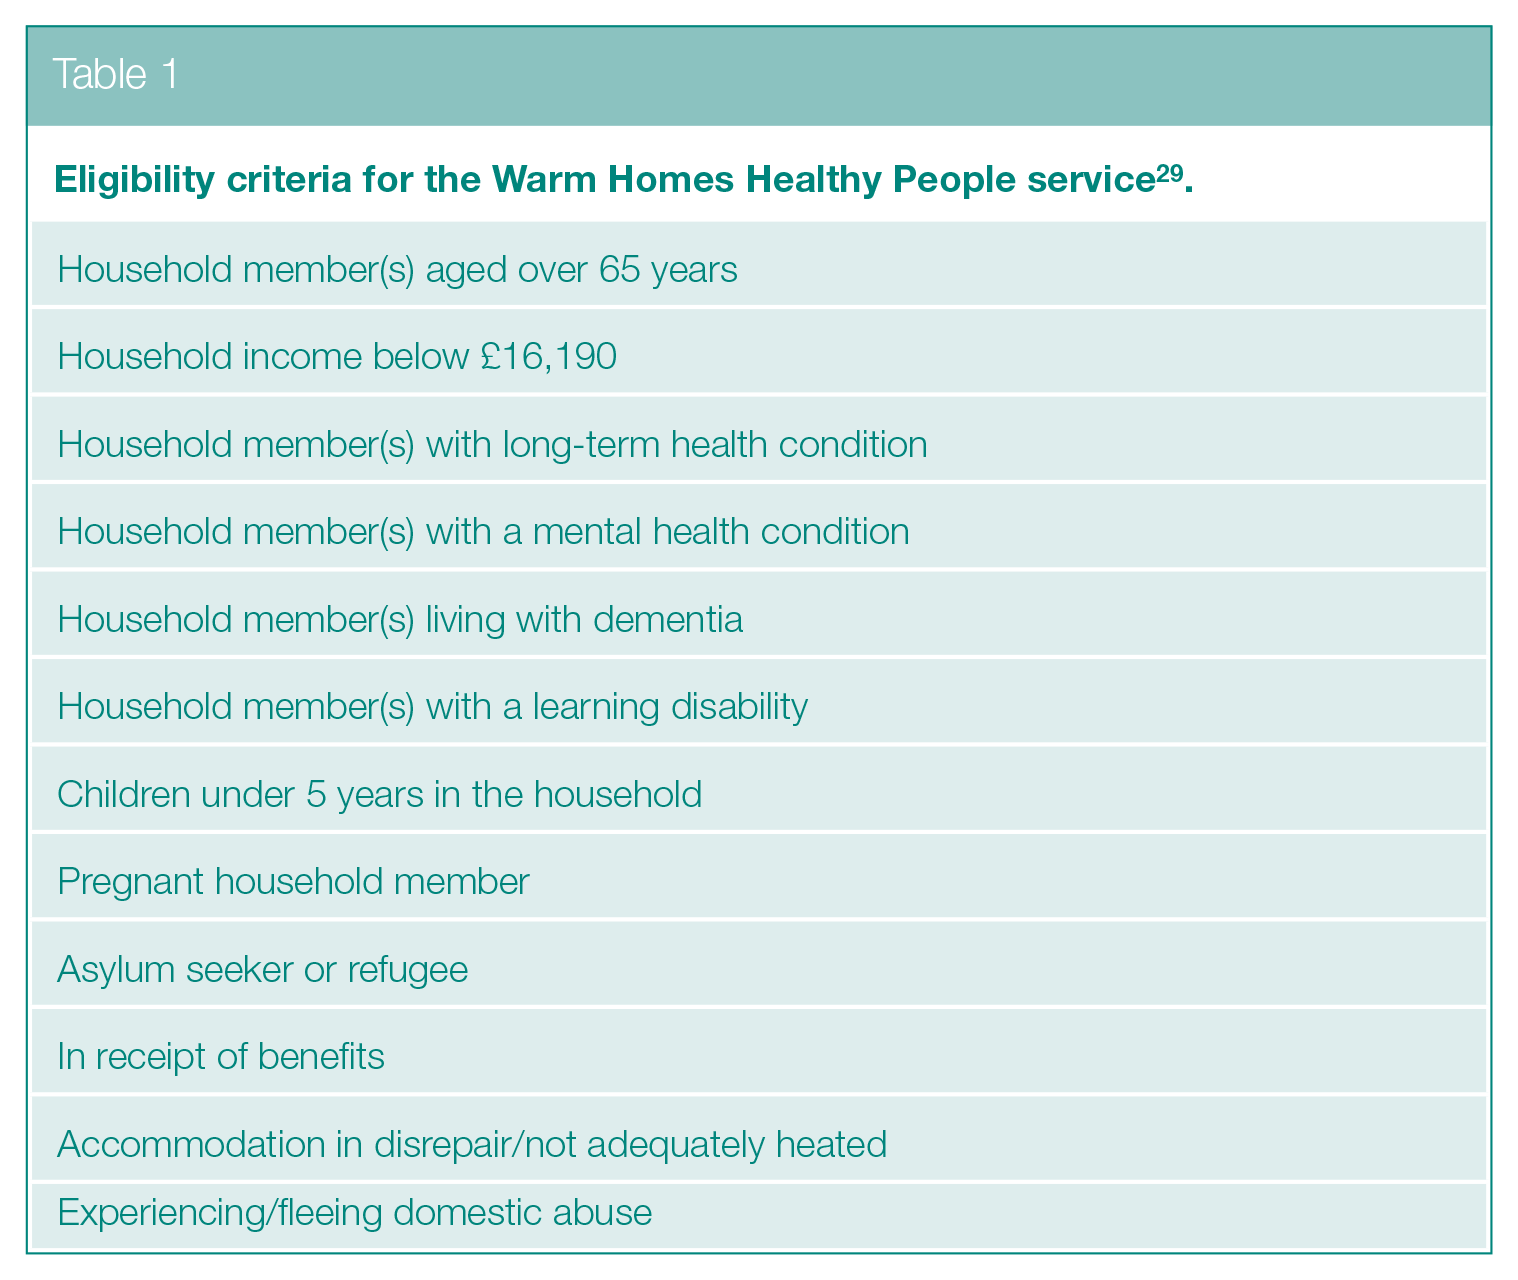
WHHP provides services including energy supplier switching advice, installation of simple energy efficiency measures, and support for energy bills, debt, and benefits checks. 29 To be referred into WHHP, households must fit into one or more eligibility criteria (Table 1) to capture those most vulnerable to fuel poverty, based on national evidence. 7 Referrals are via organisations including health and social care, voluntary sector, and educational establishments, or self-referral.
Eligibility criteria for the Warm Homes Healthy People service 29 .
Methods
A retrospective, observational, cross-sectional design using secondary analysis was used. Measuring fuel poverty is challenging because it is a multidimensional concept. 30 Since 2021 in England, fuel poverty has been measured using the ‘LILEE’ indicator. To be considered fuel poor using LILEE, a household’s disposable income (after housing costs and energy needs, equivalised to account for the number of occupants) must be below the relative poverty line (60% below the median national household income) and they must live in a property with a Standard Assessment Procedure (SAP) Band of D or below. LILEE superseded the ‘Low Income High Costs’ (LIHC) indicator, which deemed a household to be fuel poor if it exceeded both a national income threshold (determined using the same methodology as LILEE) and a fuel cost threshold (weighted median of fuel costs of all households to keep at an adequate standard of warmth, equivalised to account for the number of occupants). 31
For this study, the LIHC indicator was used because it includes households living in more energy efficient homes (i.e. SAP Band A–C properties), who cannot be classed as fuel poor using the LILEE indicator. 31 This was considered more appropriate as the WHHP service provides a range of interventions beyond energy efficiency improvements which could benefit any household living in fuel, regardless of SAP Band rating.
Ethical approval was not required as this secondary research study used anonymised datasets containing no identifiable information, in accordance with the University of York’s Ethics Committee policies. The datasets were used in accordance with a data sharing agreement agreed prior to the project. The raw datasets are compliant to General Data Protection Regulation.
All data cleaning and analysis were performed in R Studio version 4.2.1.
Aim 1: to determine significant local-level predictors of fuel poverty
The Home Analytics Database was used to determine significant predictors of fuel poverty among households in Bradford, provided to the West Yorkshire Combined Authority, including Bradford Council, by the Energy Saving Trust. 32 This dataset contains detailed information on every home across Bradford District as of November 2021, resulting in a raw sample size of 226,696 properties. It is a complete dataset with no missing values. The variables are a mixture of property-specific variables, and estimated variables based on small geographies in which the property is situated including Census Output Areas (COAs), Lower Level Super Output Areas (LSOAs), and Middle-Level Super Output Areas (MSOAs). If a variable likely to be a predictor of fuel poverty was not present in the Home Analytics Database, an estimated value for each household was sourced from publicly available datasets (e.g. 2021 Census data) to ensure a comprehensive set of fuel poverty predictors could be included in the analysis. There were 22 variables eligible for inclusion in the final logistic regression model (Table 2).
List of independent variables eligible to be included in the logistic regression model.
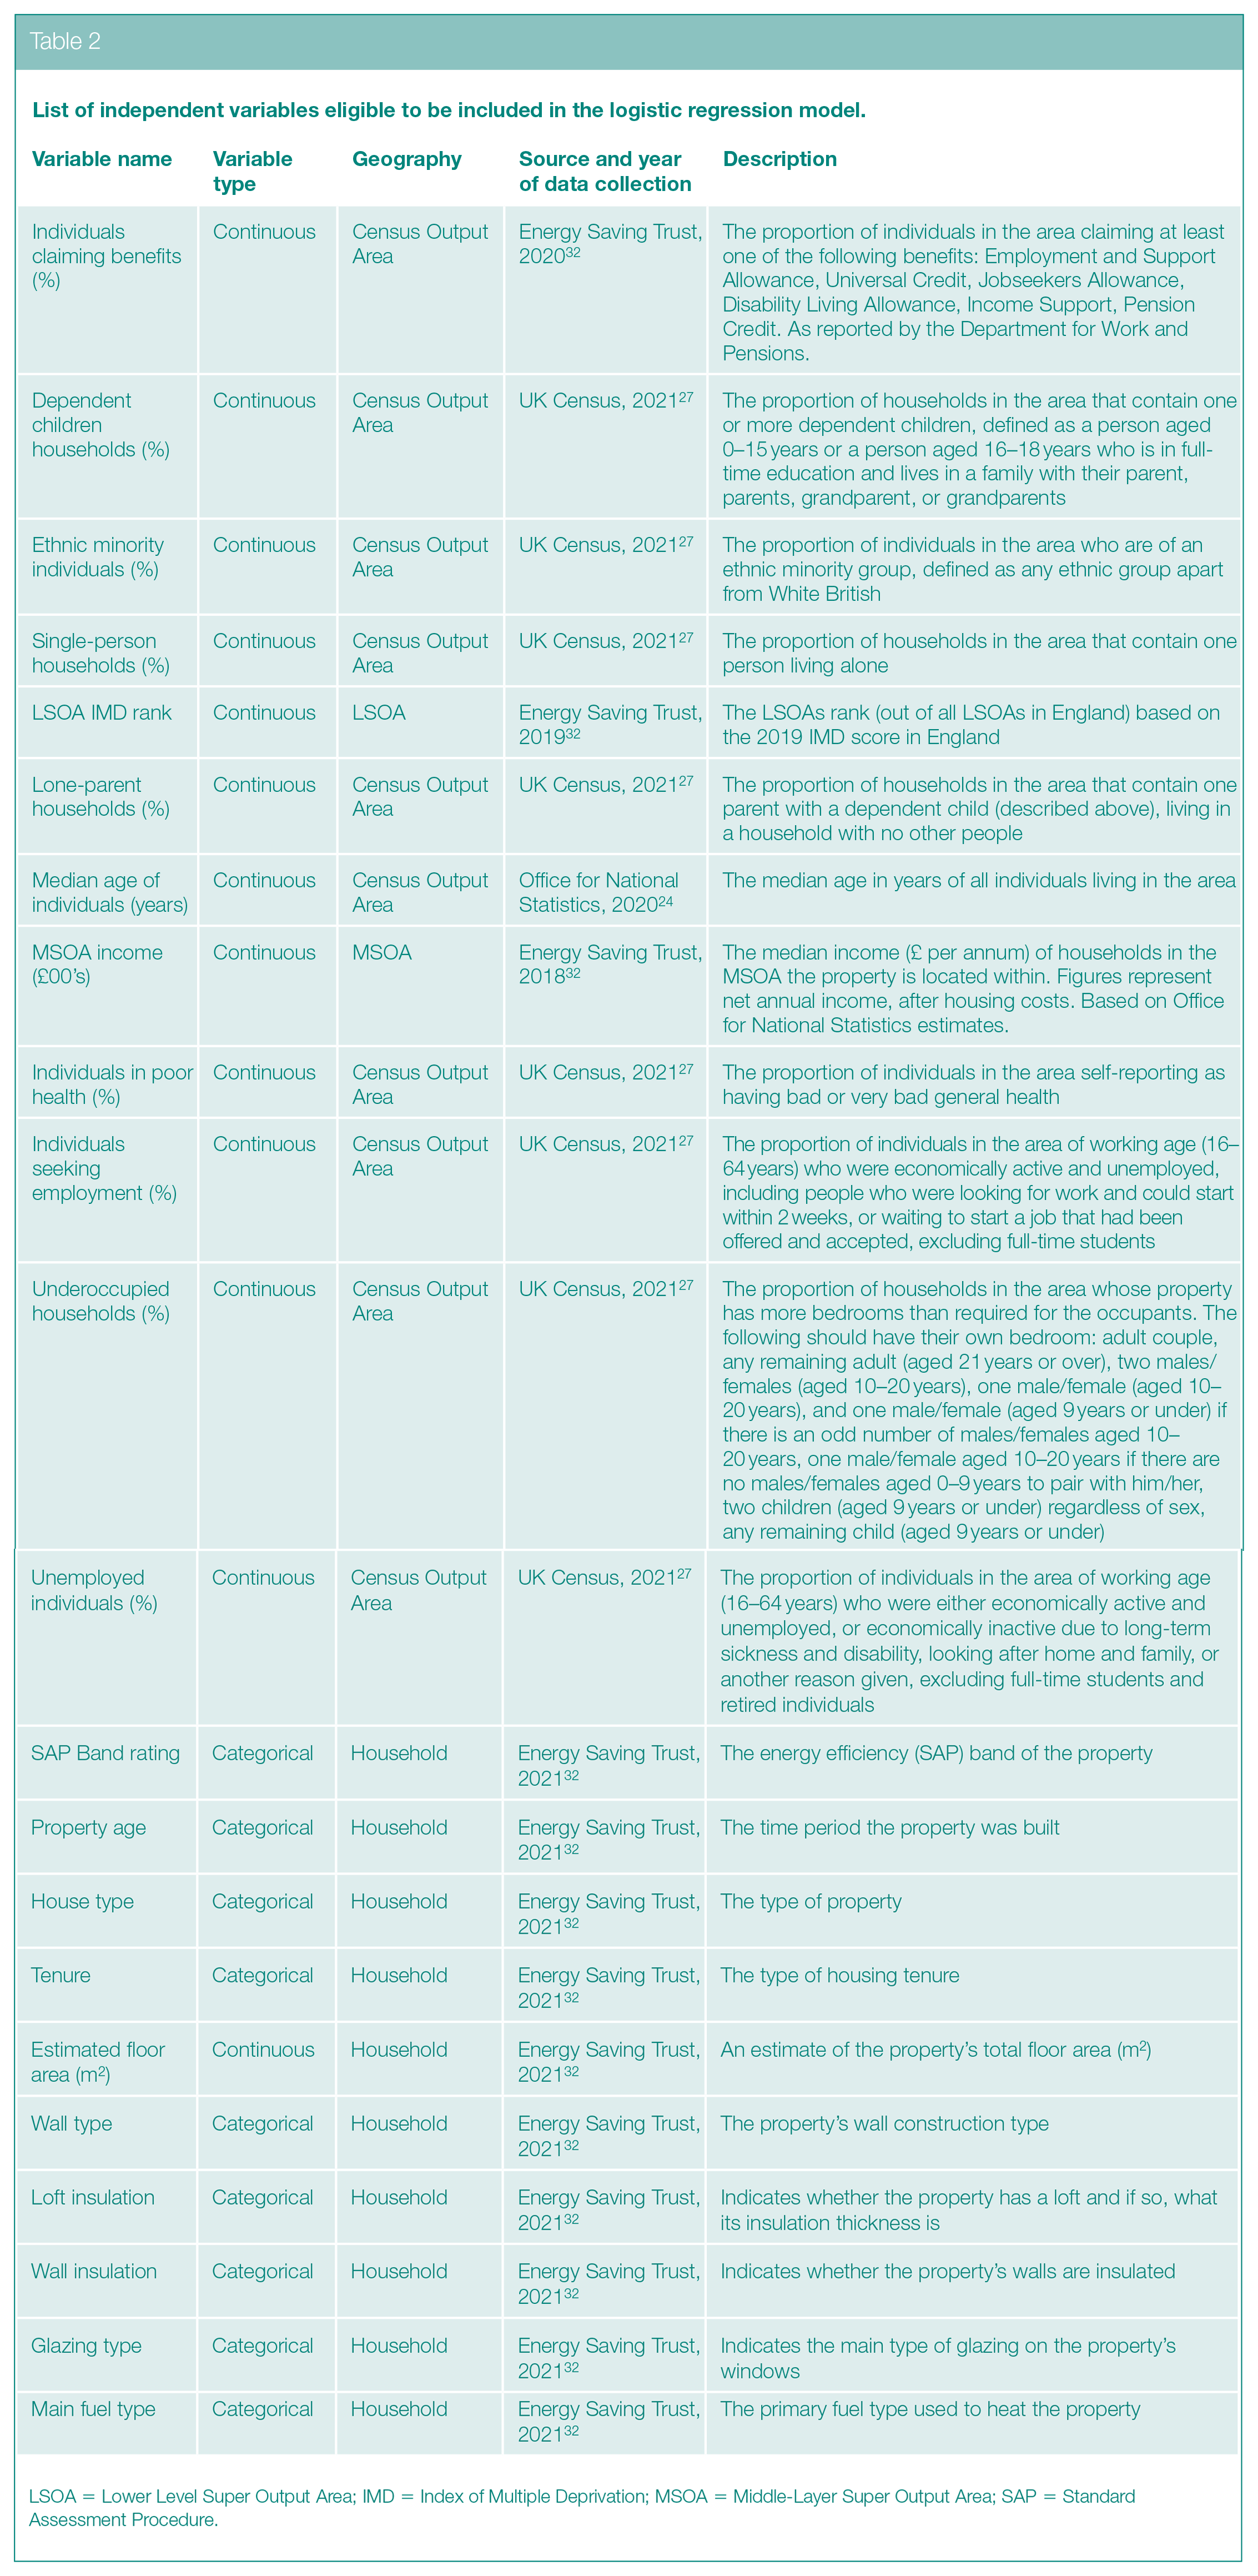
LSOA = Lower Level Super Output Area; IMD = Index of Multiple Deprivation; MSOA = Middle-Layer Super Output Area; SAP = Standard Assessment Procedure.
The dependent variable was estimated fuel poverty status (fuel poor or not fuel poor), calculated by ranking homes by their relative fuel poverty probability, estimated by the Energy Saving Trust using the LIHC definition, and determining the top 19.2% homes (Bradford’s estimated 2021 fuel poverty rate) 25 as those estimated to be living in fuel poverty.
Associations between each independent variable and fuel poverty status were examined using univariate logistic regression models. Variables showing a significant association with fuel poverty, determined if p < .05, were eligible to be included in a multivariate logistic regression model.
A multivariate logistic regression model was built to identify significant predictors of fuel poverty among Bradford households, using fuel poverty status as the dependent variable, and purposefully selected predictors of fuel poverty as independent variables. Model assumptions were tested and the model adjusted accordingly. All variables were entered into the final model simultaneously. Any independent variable in the final logistic regression model with p < .05 was considered a statistically significant predictor of fuel poverty when all other factors were held constant.
Aim 2: to evaluate if households possessing significant predictors of fuel poverty were equitably referred to a local fuel poverty service
Data were provided by the lead WHHP service provider, Groundwork. 29 Demographic and housing characteristic data of each household are collected by Groundwork employees when conducting home visits to referred households. Data used in the analysis were collected between January 2018 and April 2023 and consisted of 1588 entries that included a household postcode within Bradford District and were therefore eligible to be utilised in the analysis. Although this is a subset of all WHHP referrals in Bradford as Groundwork works in partnership with multiple organisations who also provide the WHHP service, the dataset is considered broadly representative of all households referred into the service as Groundwork is the lead service provider and responsible for the majority of referrals.
Variables representative of those found to be significant predictors of fuel poverty in Bradford, as determined by the final multivariate logistic regression model in Aim 1, were used in the WHHP analysis at household level (Table 3). All variables were contained in the dataset apart from SAP Band rating, individuals in poor health, and underoccupied households. As only the postcode of households referred to WHHP was included in the dataset, estimated SAP Band ratings were calculated by using the mean SAP Band rating for the household’s postcode, derived from household level SAP Band ratings as of 31 May 2023. 33 Data for individuals in poor health and underoccupied households could not be accurately sourced so were not included in the analysis.
Variables used in the analysis of the WHHP data and the percentage of households in the total dataset (n = 1588) with a completed entry for the variable (January 2018–April 2023).
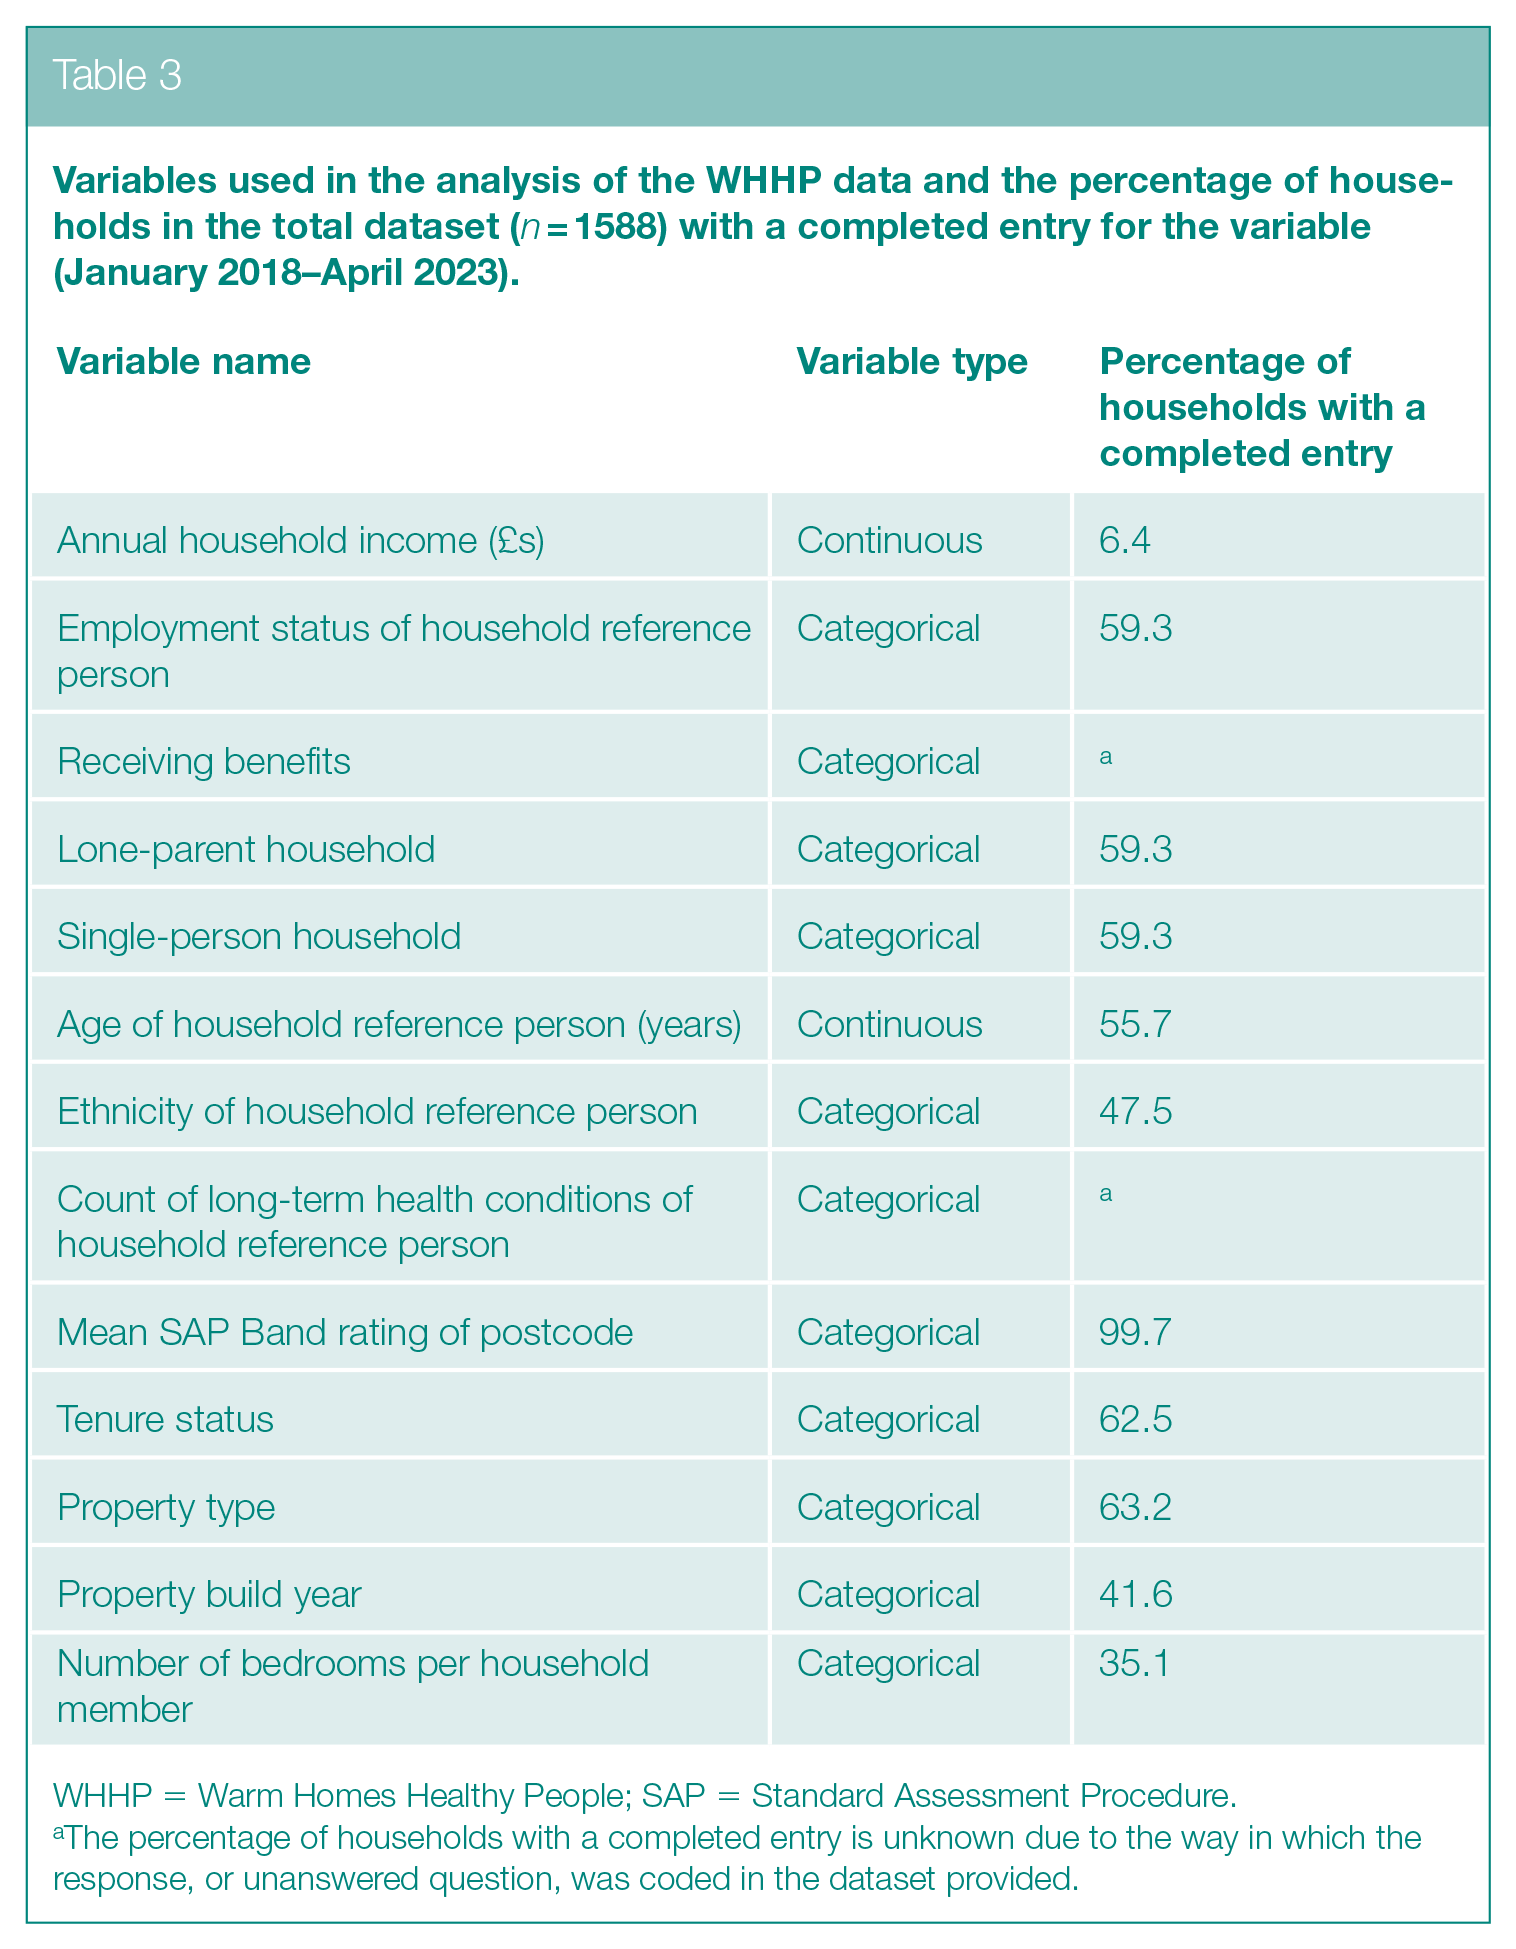
WHHP = Warm Homes Healthy People; SAP = Standard Assessment Procedure.
The percentage of households with a completed entry is unknown due to the way in which the response, or unanswered question, was coded in the dataset provided.
For each predictor of fuel poverty determined by the univariate and multivariate regression models, WHHP service reach was deemed equitable if there was a statistically significant difference in the predictor values of the WHHP households compared to all Bradford households in the same direction as the relationship of the predictor with fuel poverty, that is the predictor characteristic was overrepresented among WHHP households compared to the Bradford average. If the direction of the relationship between fuel poverty and the predictor characteristic was opposite in the univariate and multivariate logistic regression models, the direction of the relationship in the univariate model would be used to determine equity as the statistical tests used (described below) did not adjust for confounders, consistent with the univariate model.
Bradford data were gained from the Home Analytics dataset used in Aim 1 (n = 226,696 properties). For continuous variables, Mann–Whitney U tests were performed as all variables did not follow a normal distribution, with the null hypothesis being that there is no difference between the medians or mean ranks. 34 For categorical variables, a chi-square test of homogeneity was performed as all variables met the assumption that at least 80% of the expected frequencies were 5 or greater and all the expected frequencies have a value of at least 1. The null hypothesis was that the WHHP households had the same proportions of fuel poverty characteristics as all Bradford households. Null hypotheses were rejected if p < .05.
Results
Aim 1: to determine significant local-level predictors of fuel poverty
The univariate logistic regression (Table 4) showed that all independent variables were statistically significantly associated with fuel poverty, so could be included in the multivariate logistic regression model.
Results of the univariate (unadjusted) and multivariate (adjusted) logistic regression model with fuel poverty as the dependent variable, presented to three decimal places for continuous variables (due to narrow confidence intervals) and two decimal places for categorical variables.
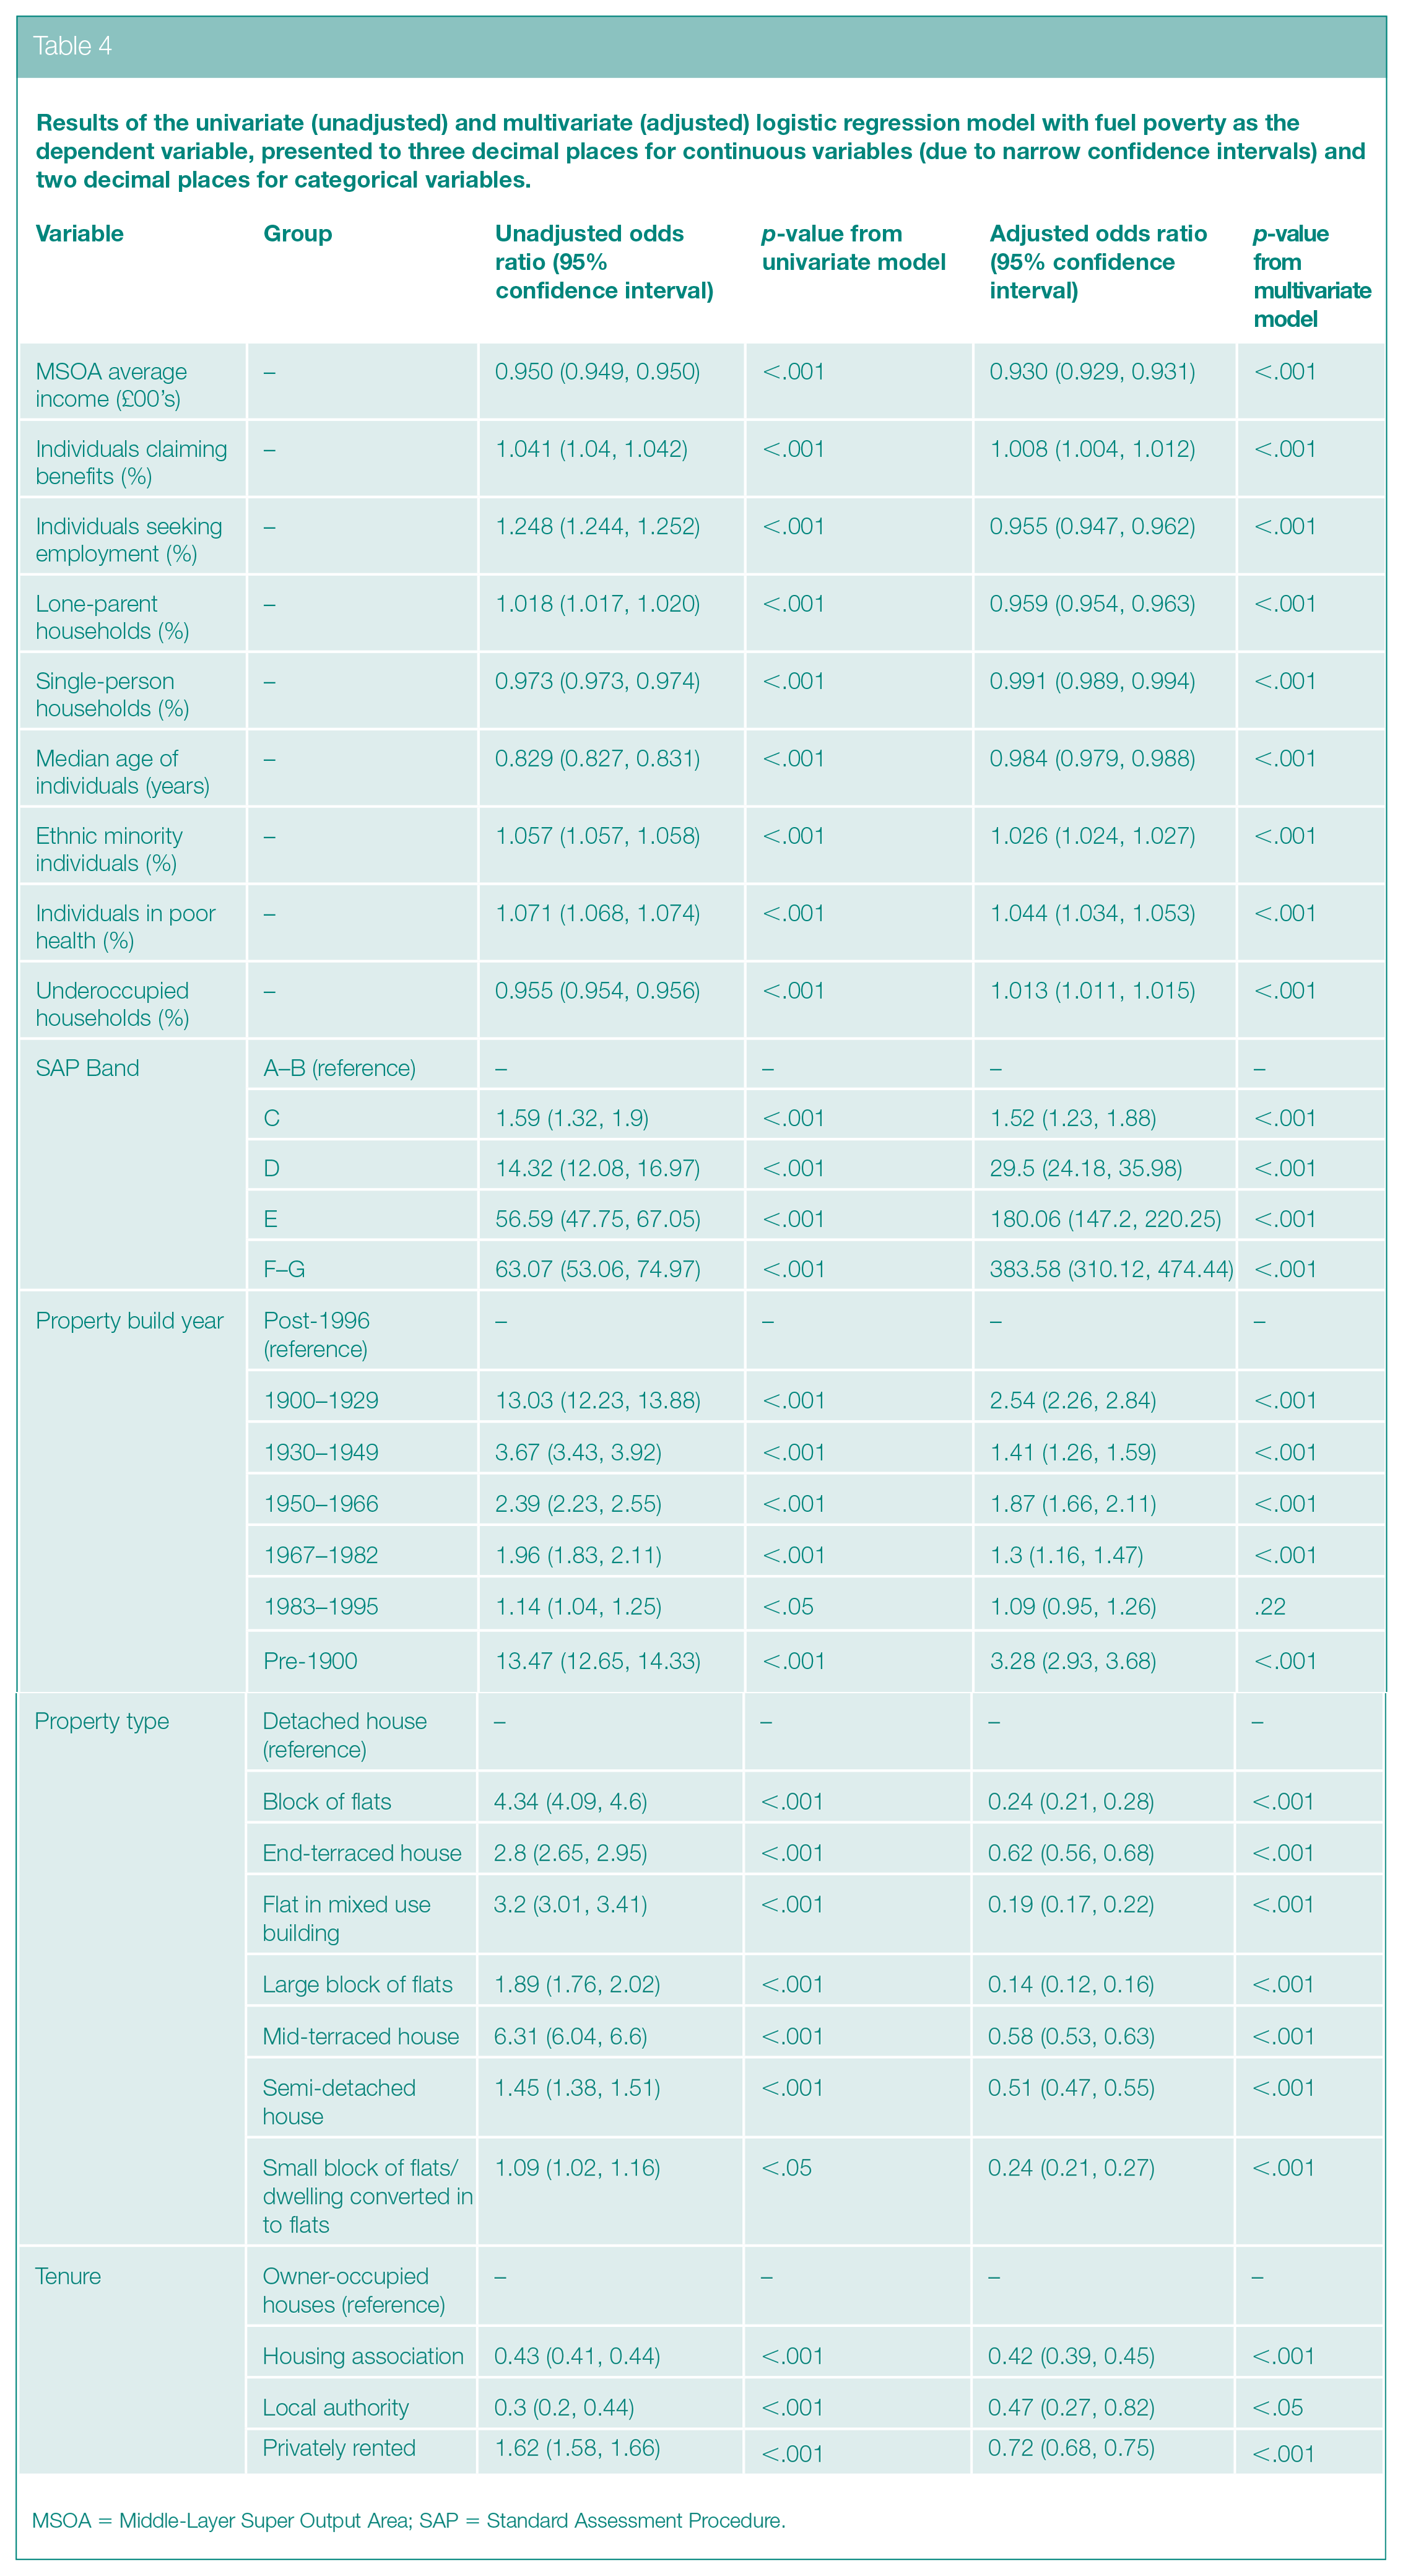
MSOA = Middle-Layer Super Output Area; SAP = Standard Assessment Procedure.
After rigorous assumption checking for the multivariate logistic regression model (see Supplemental material Section 1), the final model contained 226,489 data points and 13 variables. The following variables were removed from the final model due to high collinearity with other variables: estimated floor area, wall type, loft and wall insulation, glazing type, main fuel type, LSOA Index of Multiple Deprivation (IMD) rank, households with dependent children, and unemployed individuals. All independent variables in the final model had a squared scaled general variance inflation factor value <4. The final model had good predictive power as demonstrated by the McFadden’s R2 statistic being 0.69 and an area under the receiver operating characteristic curve value of 0.98 (see Supplemental material Section 2). The model (Table 4) showed that all predictor variables of fuel poverty remained significant after adjusting for the other independent variables in the model, apart from the 1983–1995 category in the property build year variable (p = .22).
Continuous independent variables which increased the likelihood of households in Bradford being fuel poor after controlling for other independent variables in the model (Table 4) included living in an MSOA with lower average household income (odds ratio (OR) = 0.930, 95% confidence interval (CI) = 0.929–0.931), living in a COA with a higher proportion of ethnic minority individuals (OR = 1.026, 95% CI = 1.024–1.027), individuals in poor health (OR = 1.044, 95% CI = 1.034–1.053), underoccupied households (OR = 1.013, 95% CI = 1.011–1.015), and a lower median age of individuals (OR = 0.984, 95% CI = 0.979–0.988). Households living in COAs with a smaller proportion of individuals seeking employment (OR = 0.955, 95% CI = 0.947–0.962) and lone-parent households (OR = 0.959, 95% CI = 0.954–0.963) were more likely to be fuel poor when all other variables were held constant. Households living in COAs with a lower proportion of single-person households (OR = 0.991, 95% CI = 0.989–0.994) or a higher proportion of benefits claimants (OR = 1.008, 95% CI = 1.004–1.012) were significantly more likely to be fuel poor; however, the 95% CIs of these variables were close to 1.
A lower SAP Band and older property age (except properties built ⩽13 years before the reference group, post-1996) significantly increased the likelihood of a household in Bradford being fuel poor (Table 4). The estimates of the SAP Bands were large, for example SAP Band F–G households were 383.58 times (95% CI = 310.12–474.44) more likely to be fuel poor than SAP Band A–B households. The magnitude of the estimate and width of the CIs may be influenced by the relatively small proportion of households in the reference group, SAP Band A–B (5% of all Bradford households), with only 0.3% of Bradford’s fuel poor households having a SAP Band of A–B (see Supplemental material Section 3), reducing stability of the estimates.
Detached homes (the reference group) were most likely to be fuel poor out of all property types, followed by end- and mid-terraced houses (OR = 0.62, 95% CI = 0.56–0.68 and OR = 0.58, 95% CI = 0.53–0.63, respectively). Owner-occupied houses (the reference group) were most likely to be fuel poor, followed by privately rented homes (OR = 0.72, 95% CI = 0.68–0.75).
Aim 2: to evaluate if households possessing significant predictors of fuel poverty were equitably referred to a local fuel poverty service
Tables 5 and 6 present comparisons, including significance testing, of demographics and household characteristics of the WHHP households compared to all Bradford households. An overview of the tables is provided below.
Results of Mann–Whitney U test for continuous variables deemed significant predictors of fuel poverty in Bradford, comparing households in the WHHP programme with all households in Bradford.
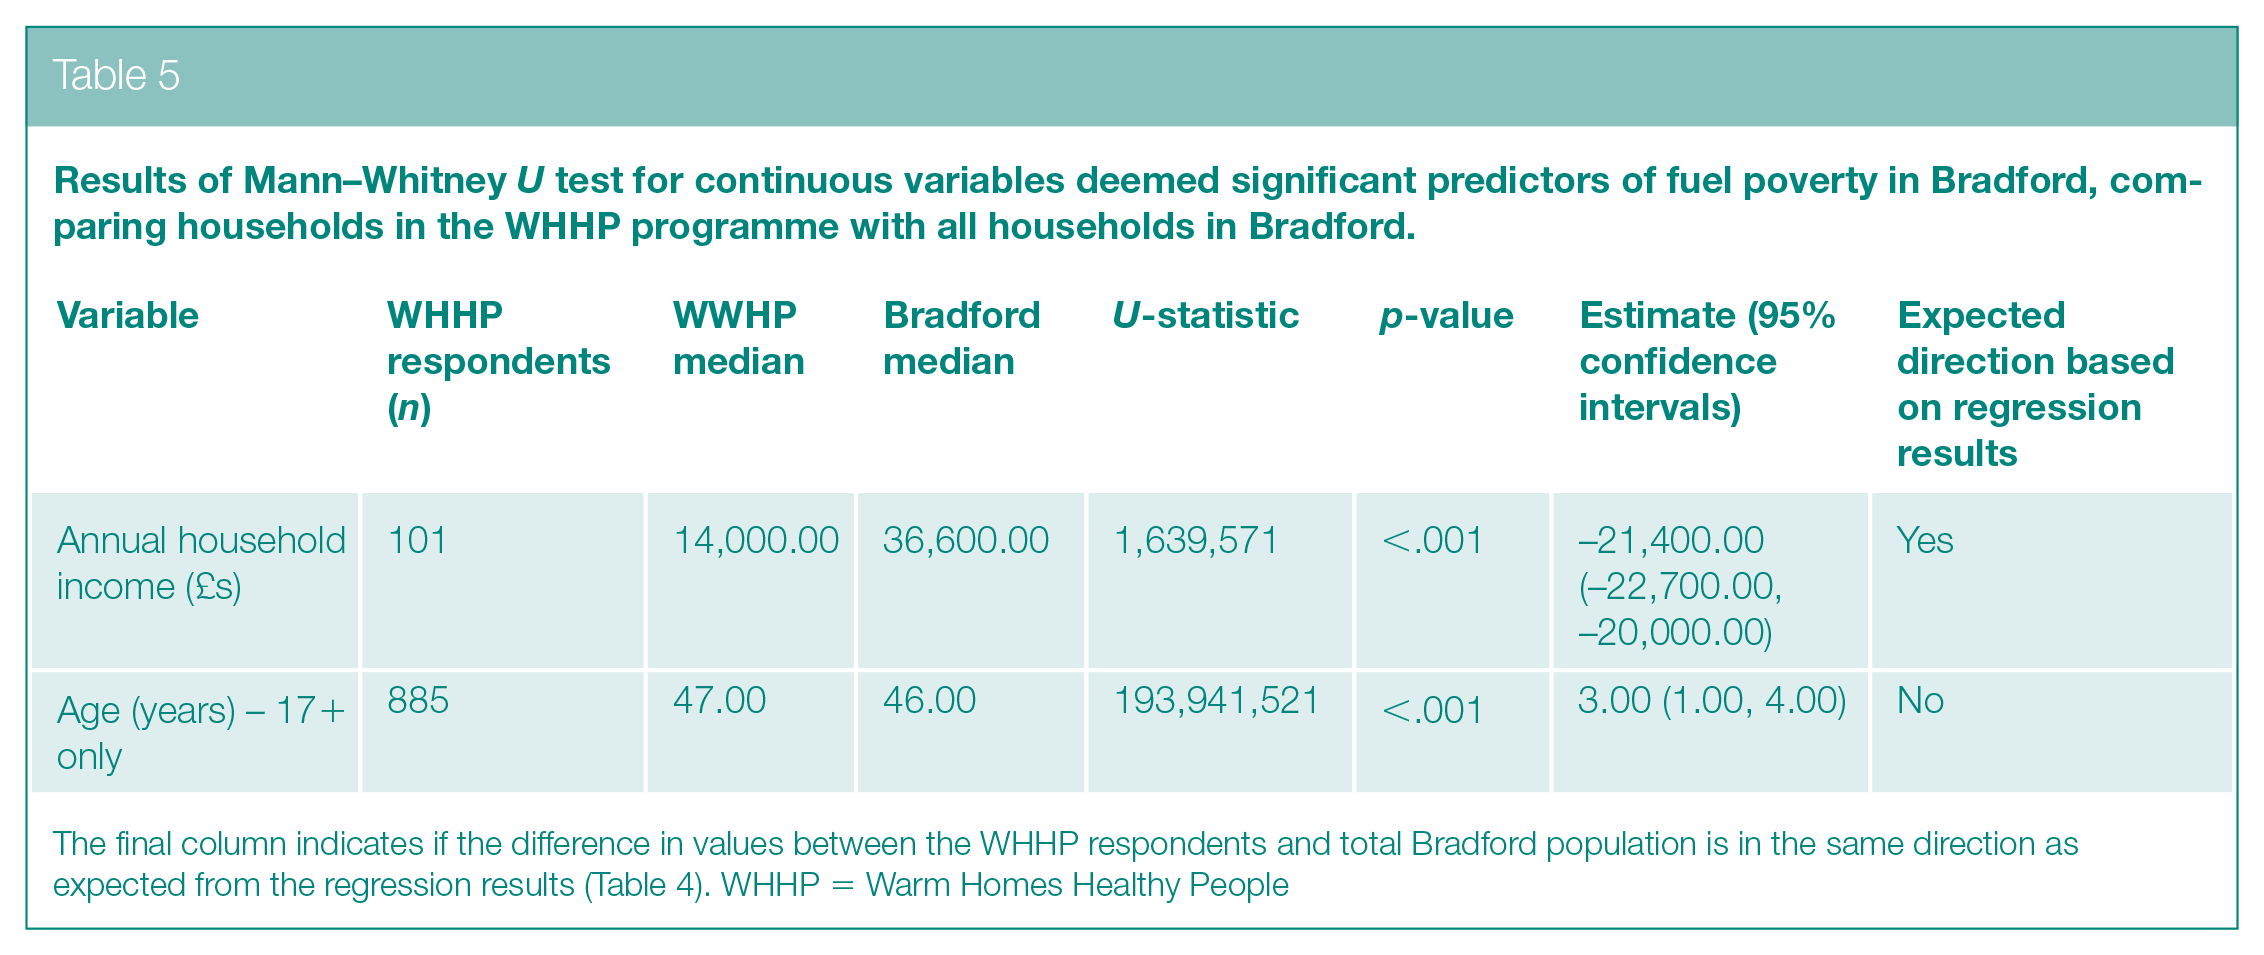
The final column indicates if the difference in values between the WHHP respondents and total Bradford population is in the same direction as expected from the regression results (Table 4). WHHP = Warm Homes Healthy People
Results of chi-square test of homogeneity for categorical variables deemed significant predictors of fuel poverty in Bradford, comparing households in the WHHP programme with all households in Bradford.
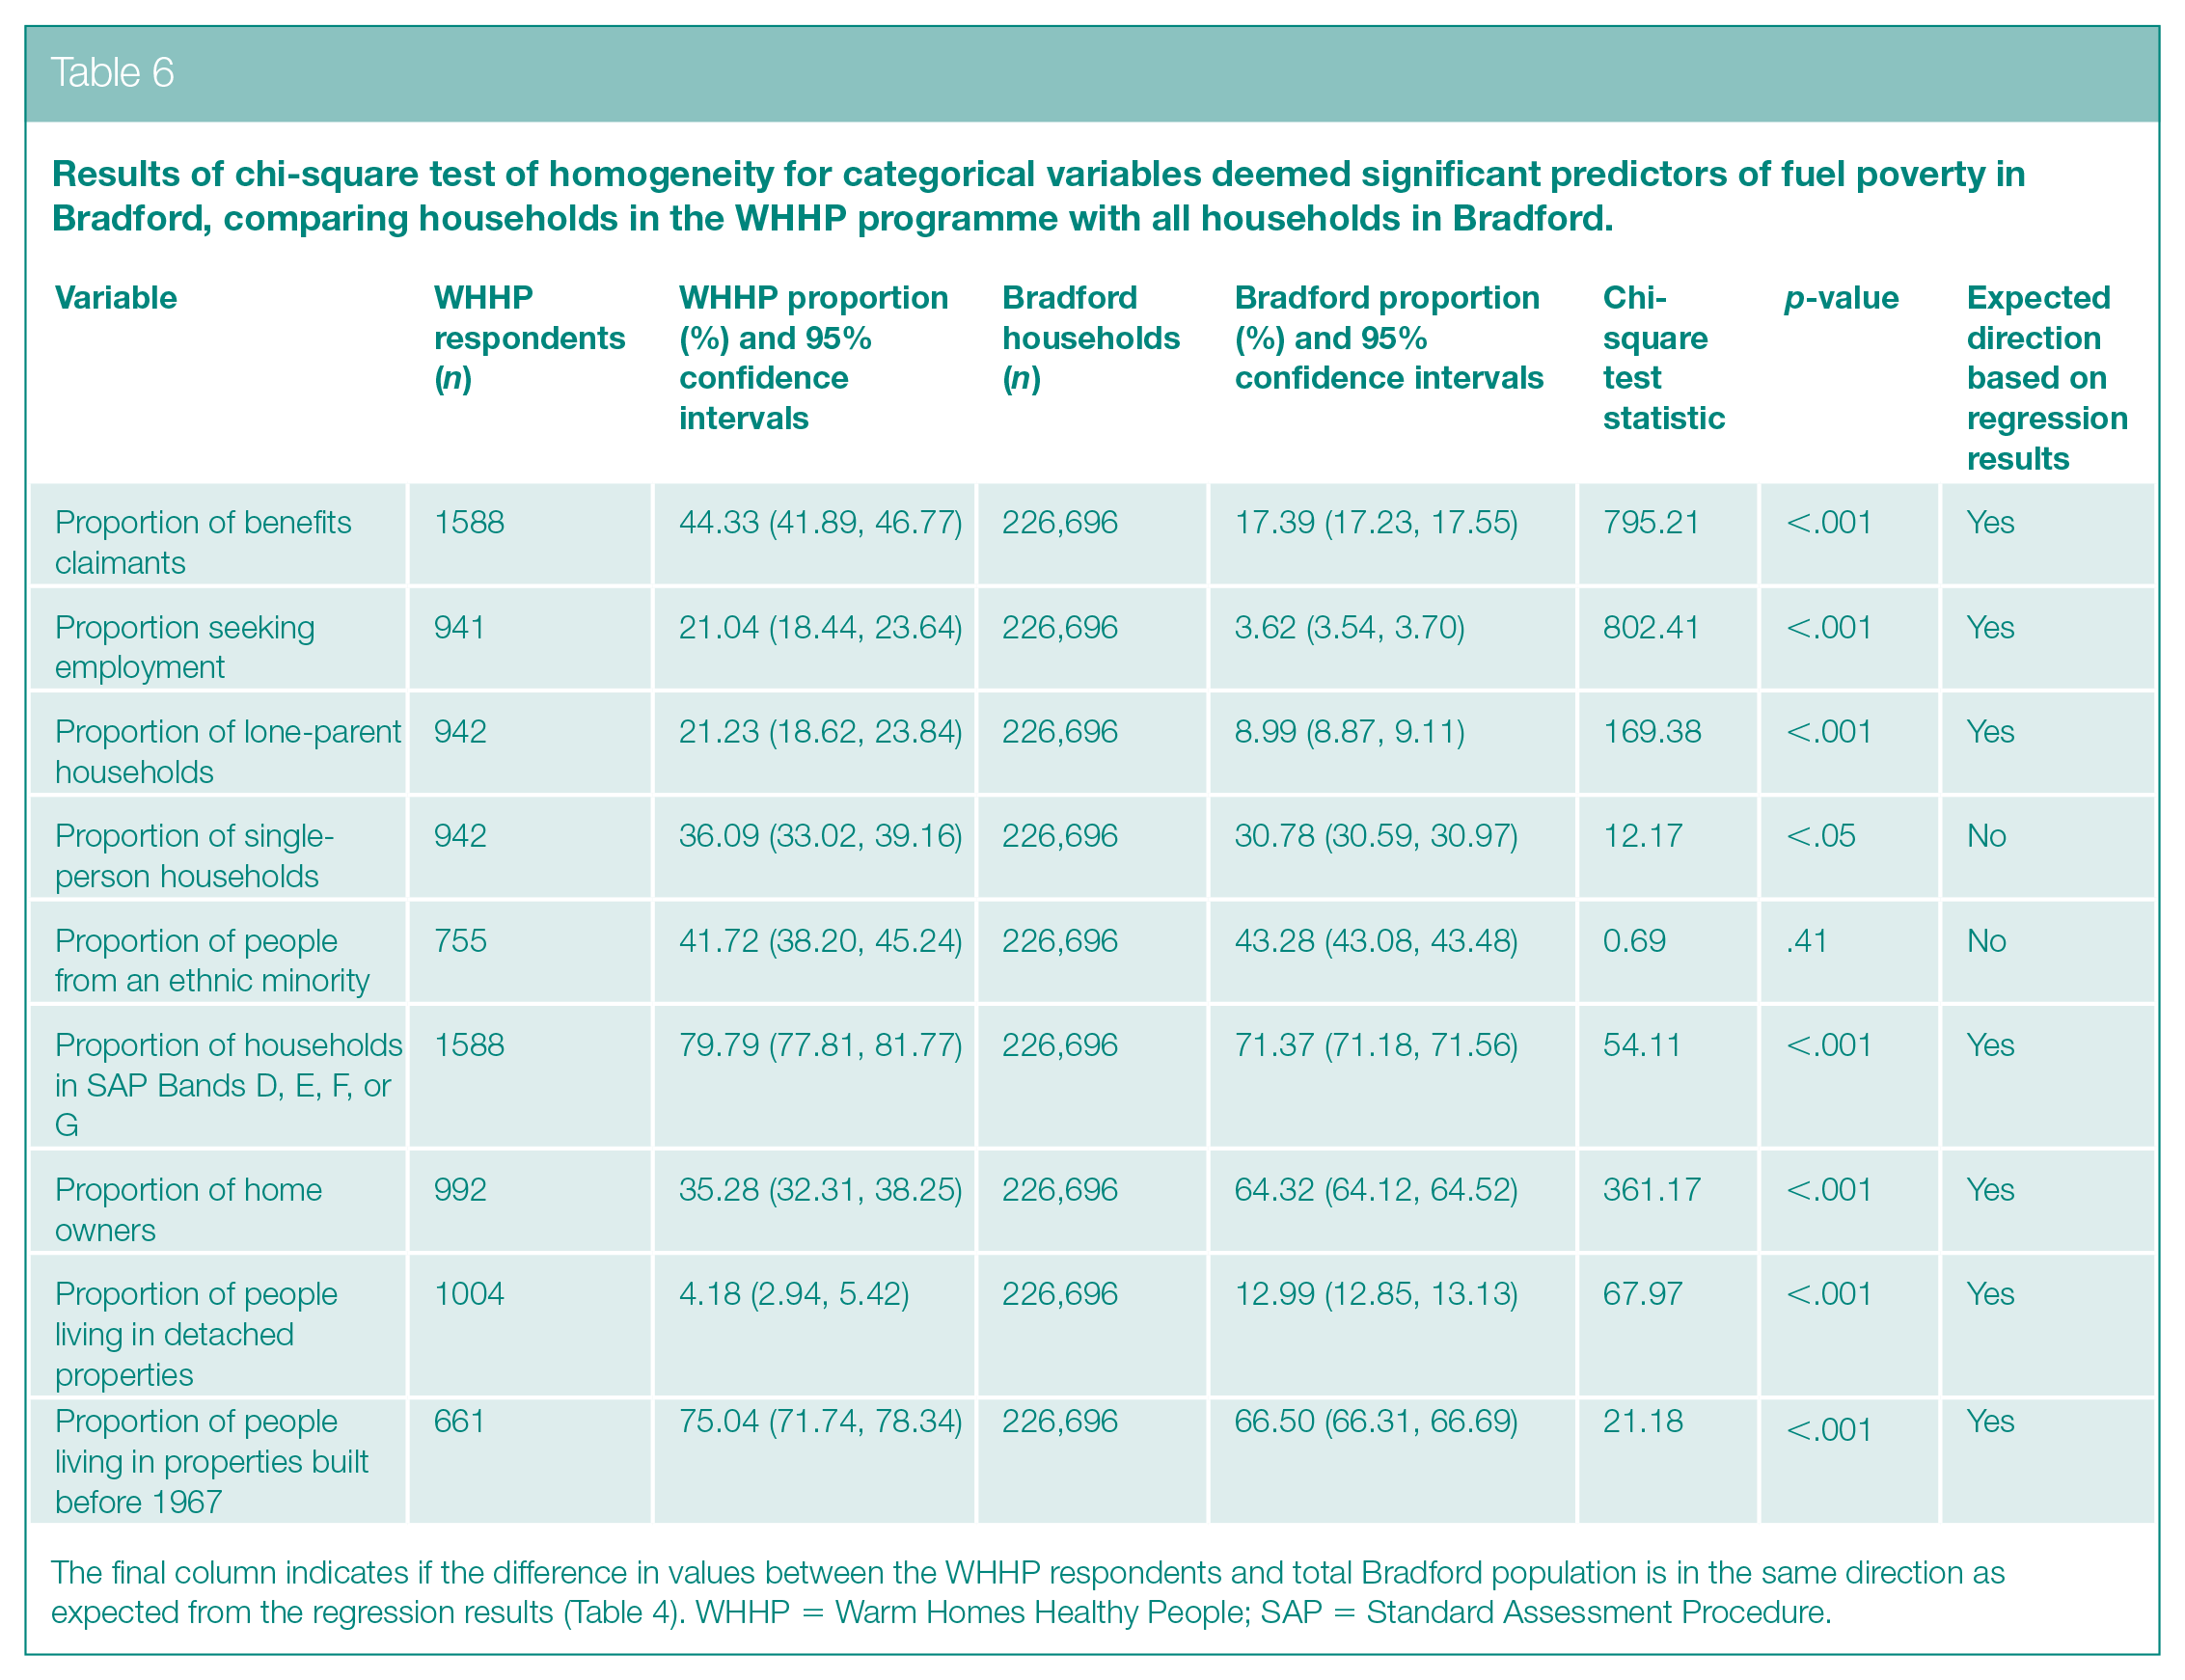
The final column indicates if the difference in values between the WHHP respondents and total Bradford population is in the same direction as expected from the regression results (Table 4). WHHP = Warm Homes Healthy People; SAP = Standard Assessment Procedure.
The pattern of referrals for income and employment variables was as expected, with WHHP households having significantly lower median household income, and a significantly higher proportion of household reference persons (HRPs) seeking employment and receiving benefits compared to the Bradford average.
For occupant demographic variables, a significantly higher proportion of WHHP households was lone-parent households than the Bradford average which was the expected direction according to the regression results. However, for single-person households and median age of HRPs the pattern of referrals was in the opposite direction to expected, with a significantly higher proportion of single-person households and older HRPs among the WHHP households compared to the Bradford average. There was no significant difference between the proportion of ethnic minority households among WHHP households and the Bradford average, in contrast to the regression results which showed that ethnic minority households are significantly more likely to be fuel poor.
The pattern of referrals for housing characteristic variables was as expected, with a significantly higher proportion of WHHP households living in a postcode with lower energy efficiency properties (mean SAP Band of D or below), a significantly higher proportion living in older properties (built before 1967), and a significantly lower proportion of WHHP households being homeowners and living in detached properties compared to the Bradford average.
Discussion
The results of the multivariate logistic regression model showed that after holding all other variables constant, households in Bradford were significantly more likely to be fuel poor if they lived in an area with lower average household income, a lower average age of individuals, and a higher proportion of ethnic minority individuals, individuals in poor health, and benefits claimants. A higher proportion of individuals seeking employment, lone-parent households, and single-person households in the area significantly reduced the likelihood of being fuel poor. In terms of housing characteristics, older properties, detached homes, owner-occupied homes, and underoccupied households were most likely to be living in fuel poverty. Households living in properties with a lower SAP Band rating were also significantly more likely to be fuel poor, with large ORs, indicating SAP Band could be a strong predictor and efficient criterion for identifying fuel poor households, but the estimates for this variable may be unstable due to relatively low frequencies of fuel poor households in the reference category (SAP Band A–B). Although significantly associated with fuel poverty as shown by the respective univariate regression models, LSOA IMD rank, proportion of households with dependent children, and additional property characteristics related to energy efficiency (household floor area, fuel type, glazing type, loft insulation, wall type, and wall insulation) were removed from the final multivariate regression model due to high collinearity with other variables. This local information enables local fuel poverty interventions to target those most at risk of fuel poverty in Bradford, rather than relying on national estimates which has been the focus of most previous research in the UK.8,10,15,18,19,35
These findings largely agree with previous research on national risk markers of fuel poverty,15,18,19 with predictors in Bradford covering all three main categories of household income and employment, occupant demographics, and housing characteristics; however, the direction of the relationship of some variables with fuel poverty in the final multivariate model (namely lone-parent households, property type, and tenure) was found to be inverse to that of some national research, 18 discussed below.
Households in areas with a higher proportion of lone-parent households were less likely to be fuel poor in Bradford after controlling for other predictors, whereas national research suggests that they are more likely to be fuel poor than other household compositions,18,35 consistent with the univariate regression findings. Households living in detached homes were most likely to be fuel poor in Bradford after controlling for other predictors, whereas national research indicates they are least likely to be fuel poor, 18 consistent with the univariate regression findings. Homeowners were most likely to be fuel poor in Bradford after controlling for other predictors, whereas national research suggests privately rented households are most likely to be fuel poor,5,18,35 consistent with the univariate regression findings. Possible explanations for these differences include using different definitions of fuel poverty, or adjusting for confounders in the final multivariate regression model in the study which had not been adjusted for in previous national research. These differences reaffirm the complexity of the relationship between fuel poverty and household characteristics, and the challenge of measuring fuel poverty.
Previous evaluations of schemes similar to WHHP were largely process evaluations which did not consider equity or provide in-depth service-user demographics, 36 highlighting the value of this study to fill a research gap. Most predictors of fuel poverty in Bradford were significantly overrepresented among WHHP households compared to the Bradford average, suggesting the targeting and reach of the WHHP service were equitable for the majority of predictors of fuel poverty. This is a positive finding and contrasts with other evaluations of fuel poverty schemes that highlight poor targeting of fuel poor households.12,13,22 This novel insight shows the potential benefit of local interventions such as WHHP who possess in-depth knowledge about the local demographic and housing context of areas and have developed meaningful partnerships with well-established local organisations, increasing the likelihood of successfully targeting and engaging with households most vulnerable to fuel poverty. This is particularly important to mitigate the impacts of the ongoing cost-of-living crisis17,23 and documented failures in the UK’s wider social security system. 37
However, some variables showed no significant overrepresentation or were underrepresented in WHHP households, namely ethnicity, multiperson households, and younger HRPs, even though they have been identified as national predictors of fuel poverty8,19 and were important local predictors in this study. This indicates that service reach may not be completely equitable, and there is a need for these disparities to be explored further.
Limitations and further research
As a number of variables were estimated using small-area geography averages due to lack of household-level data, particularly demographic characteristics, future research studies should collect appropriate household-level data for all fuel poverty-related variables to improve internal validity of the study findings and remove possibility of ecological fallacy. The majority of variables in the regression model to determine predictors of fuel poverty utilised 2021 data, whereas the data from WHHP households were collected over 5 years (2018–2023), a likely period of change in some household characteristics such as income and employment status due to impacts of the COVID-19 pandemic and cost-of-living crisis. Future studies should aim to collect household data over a shorter time period to ensure all variables represent a specific time point.
Some WHHP variables had over 50% of entries missing (Table 3), reducing the power of the study. There was also an issue with determining data completeness for two variables (long-term conditions and benefits) due to the question format, meaning it was unknown whether a blank response meant the respondent did not answer the question or did not have any long-term conditions/receive any benefits. This resulted in the total proportion of long-term conditions and benefits claimants in the WHHP population likely being underreported.
Due to risks of non-response bias, selection bias, and poor questionnaire validity in the current dataset which must be reviewed and minimised, further research should explore the inequities highlighted in more detail and determine possible explanations via interviews and focus groups with representative populations, in addition to obtaining and analysing data from the other providers in the WHHP partnership beyond the lead provider, Groundwork. This will allow future interventions to be developed to ensure that the WHHP service successfully engages with all households most likely to be living in fuel poverty.
Conclusions
Significant predictors of fuel poverty for households in one local area in England (Bradford) were similar to previously researched national predictors of fuel poverty, covering all three main categories of household income and employment, occupant demographics, and housing characteristics. However, identified differences between the direction of the relationship of some national and local predictors of fuel poverty reaffirm the complex relationship between fuel poverty and multiple household characteristics, and highlight the usefulness and need for research on local predictors of fuel poverty.
The WHHP service equitably reaches fuel poor households in Bradford across the majority of predictors of fuel poverty. However, ethnic minority groups, younger people, and households containing more than one individual are seemingly underrepresented in the service. This knowledge is vital to appropriately target resources during the ongoing cost-of-living crisis and cuts to local budgets, and has filled a research gap around assessing the equity of a local fuel poverty intervention.
This approach should be reproduced among other local authorities across England to ensure fuel poverty services effectively target local households most at risk of fuel poverty rather than relying on national averages.
Supplemental Material
sj-docx-1-rsh-10.1177_17579139241245346 – Supplemental material for Predictors of fuel poverty and the equity of local fuel poverty support: secondary analysis of data from Bradford, England
Supplemental material, sj-docx-1-rsh-10.1177_17579139241245346 for Predictors of fuel poverty and the equity of local fuel poverty support: secondary analysis of data from Bradford, England by E Little, A Barnes and M Power in Perspectives in Public Health
Footnotes
Conflict of Interest
The author(s) declared the following potential conflicts of interest with respect to the research, authorship, and/or publication of this article: This research was carried out as part of Public Health Registrar Training, supported by Health Education England and while on placement with Bradford Council, supervised by University of York academics. Barnes works with the Bradford Council NIHR Health Determinants Research Collaboration and Anti-Poverty Coordination Group.
Funding
The author(s) disclosed receipt of the following financial support for the research, authorship, and/or publication of this article: This research received no specific grant from any funding agency in the public, commercial, or not-for-profit sectors. Barnes’ post is funded by the NIHR Yorkshire and Humber Applied Research Collaborations (grant no. NIHR200166); and UK Prevention Research Partnership Collaboration (MRC) – ActEarly (grant no. MR/S037527/1). Power’s post is funded by a Wellcome Trust Research Fellowship in Humanities and Social Sciences (grant no. 221021/Z/20/Z).
Ethical Approval
Ethical approval was not required as this secondary research study used anonymised datasets containing no identifiable information, in accordance with the University of York’s Ethics Committee policies. The datasets were used in accordance with a data sharing agreement agreed prior to the project. The raw datasets are compliant to General Data Protection Regulation.
Supplemental material
Supplemental material for this article is available online.
References
Supplementary Material
Please find the following supplemental material available below.
For Open Access articles published under a Creative Commons License, all supplemental material carries the same license as the article it is associated with.
For non-Open Access articles published, all supplemental material carries a non-exclusive license, and permission requests for re-use of supplemental material or any part of supplemental material shall be sent directly to the copyright owner as specified in the copyright notice associated with the article.