
Abstract
Aims:
The purpose of this study was first, to investigate the harmful effects of food insufficiency on health outcomes – self-rated health (SRH) and self-assessed depressive symptoms – during the COVID-19 pandemic and, second, to test whether these effects fluctuated across the US in terms of state-level social capital.
Methods:
Data were drawn from the Census Household Pulse Survey (fielded between April 2020 and February 2021) consisting of community-dwelling American adults (N = 1.5M+). Social capital measures were taken from the ‘Social Capital Project’ sponsored by the US Congress. We estimated three-level mixed effects models to analyze multiple waves of repeated cross-sectional surveys.
Results:
Post-COVID-19 food insufficiency was significantly negatively associated with SRH and positively associated depression, adjusting for controls including food insufficiency prior to the onset of the pandemic. These relationships were also more pronounced in areas with higher aggregate social capital.
Conclusions:
The health burdens of the new coronavirus disease have fallen disproportionately on the economically marginalized, as measured by food insufficiency. Contrary to the conventional literature, living in a state with a greater stock of social capital worsened its health effects.
Introduction
The novel coronavirus (SARS-CoV-2) and the related COVID-19 pandemic have spread to every continent of the world, including the Antarctica, since its initial outbreak in December 2019, with far-reaching consequences for global public health. In addition, the pandemic has had a profoundly negative impact on the economic lives of many individuals – especially concerning limited access to food. 1 According to a United Nations Policy Brief, COVID-19 posed a serious threat to food security for millions of people around the world, a disruption of ‘a severity and scale unseen for more than half a century’. 2 A statement jointly issued by the WHO (World Health Organization) and other international bodies in 2020 corroborated this alarming concern: it was projected that the number of undernourished people globally (estimated at 690 million) could rise by more than 130 million by the year’s end. 3 The problem of food shortages, however, is not limited to less developed parts of the world. In the US, the situation is dire among underprivileged populations. 4
An article by the Brookings Institution stated that one of the most consistent findings from national surveys was, in fact, the worsening food shortage and hardship experienced by American households. 5 With more than 50 million American workers losing their jobs since the onset of COVID-19, food insecurity has been a natural byproduct. 6 Research further suggested that the pandemic dramatically worsened mental health symptoms such as anxiety, loneliness, and depression in the US. 7 The negative health effects of food insecurity during ordinary times are well documented. 8 A growing number of studies show that in extraordinary times, such as the one facing contemporary humanity, the relationships between food insecurity and health outcomes are more pronounced. 9 Given that we are witnessing ‘a never-before-seen food insecurity crisis’ in the US 10 and that the poor have borne the brunt of its costs, 11 additional research is needed in the ongoing context to examine how insufficient food access has undermined health conditions of the economically marginalized.
In this study, we provide new evidence by analyzing a large US probability sample. In doing so, we explicitly consider the moderating, or buffering, role of social capital, consistent with prior research on the social determinants of health.12,13 Communities with higher levels of social capital (e.g. interpersonal trust and networks, norms of reciprocity, civic engagement) were expected to enjoy better overall outcomes for their members 14 and fare better in terms of crisis management. 15 Closer to this study’s main objective, a voluminous literature has emerged highlighting the significant health benefits of living in a place endowed with a greater stock of social capital.16–19 Despite the wealth of evidence on the health-promoting consequences of social capital in general, however, there is very little research on the specific role of place-based social capital during the COVID-19 pandemic.
How, if at all, does contextual social capital moderate the deleterious effects of food insecurity on the physical health and mental wellbeing of American adults? By merging two independent datasets – one conducted by the US Census Bureau and another compiled by the US Congress – we addressed this critical question. A key implication of the so-called ‘Roseto Effect’ 20 in an American setting is that cohesive communities are protective. And there is a well-established connection between poor health and food insecurity in the US 21 In recognition of these facts, we probed whether residency in a geographic unit (i.e. state) with more aggregate social capital served as a buffer against the health risks of limited food access. To the authors’ knowledge, the present study is the first to systematically investigate this issue using comparative longitudinal data (respondents nested in contextual units sampled over time) 22 representative of the US population.
Methods
Data and participants
At the micro (respondent) level, our data came from the Census Household Pulse Survey (CHPS) consisting of 20-min online surveys on how the COVID-19 pandemic has affected the lives of ordinary Americans. To recruit participants, a limited number of addresses from across the country were scientifically selected to represent the entire population using the Census Bureau’s Master Address File as the primary sampling frame. Selected individuals were then sent an email with access to the survey link. The HPS produces estimates at three different geographical levels: metropolitan statistical areas (MSAs), state-level estimates for each of the 50 states plus the District of Columbia, and national-level estimates. After listwise deletion of cases with missing values, the analytic sample contains 1,552,860 observations across 50 states plus the District of Columbia over the duration of 11 months (from April 2020 to March 2021). Qualtrics, an online platform, was used as the main data collection tool. The study protocol for CHPS was evaluated by the Center for Behavioral Science Methods as well as the Demographic Directorate and experts from the five partner federal agencies.
The CHPS was designed to collect and disseminate data in near-real time on the experience of American household during the coronavirus pandemic, specifically its social, economic, and health impacts on individual members. At the time of this writing, three phases of data had been completed. Data collection for Phase 1 (Weeks 1–12) began on 23 April and ended on 21 July 2020. Phase 2 (Week 13–17) lasted from 19 August to 26 October 2020. The last phase of collection initially took place between 28 October and 21 December and, after a 2-week break, resumed on 6 January and continued until the end of March 2021. For this study, 21 weeks of microdata files were retrieved from the CHHPS repository and merged into a single dataset. Details on survey design and sampling procedures are provided on the Census Bureau website. 23 Since our study involved a secondary analysis of deidentified data, it was exempt from the human subjects’ regulations as defined by the National Institutes of Health. 24
To measure contextual social capital, data were drawn from a second source: ‘The Geography of Social Capital in America’ Project, commissioned by the US Congress (Joint Economic Committee). Based on multiple administrative and nationally representative survey data, as well as by benchmarking previous measures including the Putnam index 25 and the Penn State Index, 26 this multi-year government-funded research compiled an extensive set of new indices for ‘community social capital’ across US states and counties. Data have been made available online since 2018. A raw data file was downloaded from the webpage maintained by the Joint Economic Committee. 27 We used the Social Capital Index as the main predictor and two of its subcomponents as a robustness check: Social Support and Community Health. Technical information on the variable construction is provided in the Appendix of the Social Capital Project Report. 28
Measures
There are two outcome variables: SRH (self-rated health), a subjective assessment of physical wellbeing (e.g. 1 = ‘poor’ and 5 = ‘excellent’), and Depressive symptoms. The latter was operationalized using questions adapted from the 7-item Generalized Disorder scale (GAD-7) and the 9-item Patient Health Questionnaire (PHQ-9)—measures used to screen for generalized anxiety disorder and major depressive disorder, respectively. 9 Survey participants answered questions about experiencing symptoms of anxiety, worry, lack of interest, and depression during the past week (e.g. 4 = ‘nearly every day’ and 1 = ‘not at all’). Original responses were summed up to create an index (Cronbach’s alpha = .91), measuring the presence of ‘common mental disorder symptoms’. At the individual unit of analysis, our main predictor is Food insecurity operationalized using items concerning inadequate access to having enough food in the past 7 days (since the outbreak of COVID-19). The content of these survey items is consistent with those found in the ‘US Household Food Security Survey Module’. 29 Rates of food insecurity from CHHPS ranged from 22% to 29% during the first week of data collection, which nearly doubled across subsequent waves. 4
In the contextual unit of analysis, the main variable of interest is social capital. By drawing on data from the Joint Economic Committee repository, we used the Social Capital Index (SCI) to gauge the level of state social capital, the most comprehensive and latest of its kind currently available. SCI is made up of 7 subindices – including the two most representative measures, social support and community health – which in turn consist of 25 indicators based on data from multiple sources collected between 2006 and 2016 and primarily from 2013 forward (e.g. American Community Survey, Current Population Survey, Election Administration and Voting Survey). Scores for the subindices were standardized to put them on a common scale, and then weights were created for each by running principal component analysis. Each state’s social capital index score was computed by taking the weighted sum of the seven scores and then standardizing them, ranging from −2.2 to 2.1. A score of 1 means the state is one standard deviation above the mean index score across all states. 28
In addition to using the composite index to check the robustness of our findings, we performed sensitivity analyses with two subcomponents, social support and community health, as alternative proxies for contextual social capital. The former is based on the percentage of emotional/social support received, the average number of close friends, the percentage of neighbors who do favors for each other (at least once a month), and the percentage of people who trust others (all/most of the time). The latter taps more ‘formal’ aspects of associational life such as organizational membership (per 1000), non-profits plus religious congregations (per 1000), and the percentage of those who volunteered for a group. Our statistical models adjusted for a list of socioeconomic, demographic, and other controls at the individual level, including prior insecurity that gauged the level of insufficient food access before the onset of the coronavirus pandemic. At the contextual unit, we further adjusted for state-level confounders such as macroeconomic indicators and regional dummies. Also included is the official number of coronavirus-related deaths as a time-varying covariate across states. Definitions and coding criteria for the (dependent, independent, and control) variables, along with their descriptive statistics, are summarized in Online Supplement 1.
Analytic approach
The CHHP data structure is hierarchically nested, that is, individuals are clustered in state-level regions. Since the study was conducted at weekly intervals, it had an additional layer of time waves embedded across regions. As such, our pooled cross-sectional dataset with a pseudo-comparative longitudinal design had three analytic levels: individual units at level 1, region-time units at level 2, and state units at level 3. This complex structure posed a problem of data clustering at the two higher levels. 30 Failure to address this could result in a downward bias in the standard error estimation, thereby increasing the risk of committing Type I error. As a remedy, it is necessary to specify random effects (REs) at all units of analysis. 22 In recognition of this methodological issue, we thus ran three-level mixed effects models using the specialist statistical software HLM. 31 We also incorporated randomly varying slopes for the lower-level terms (food insecurity and insufficient food) for interaction models, a critical requirement to generate unbiased point estimates and reliable t-ratios. 32
Results
In our data comprising more than 1.5 million community-dwelling American adults across 51 regional units (50 states plus the District of Columbia), the average age was around 52, a little less than half were male (41%), a little more than half were married (59%), about one in three (35.3%) did not have a college degree, and the average household income was around $62,500. In terms of food insecurity, about 5% of the sample experienced not having enough food prior to the COVID-19 pandemic. That figure rose to 6% after the pandemic. As a descriptive analysis, we plotted the aggregate relationships between the Social Capital Index (SCI) and the two outcome measures (SRH and depressive symptoms) averaged across states. As shown in Online Supplement 2 (Panel A), the correlations were relatively high: states with higher stocks of social capital (values shown as z-scores) corresponded to higher average subjective health and lower average common mental disorder symptoms. To examine the degree to which food insecurity has exacerbated these two health outcomes, we now turn to our main results from multilevel analysis summarized in Tables 1 and 2.
Mixed effects models predicting the impact of food insecurity on health outcomes (census household pulse survey 2020–2021)
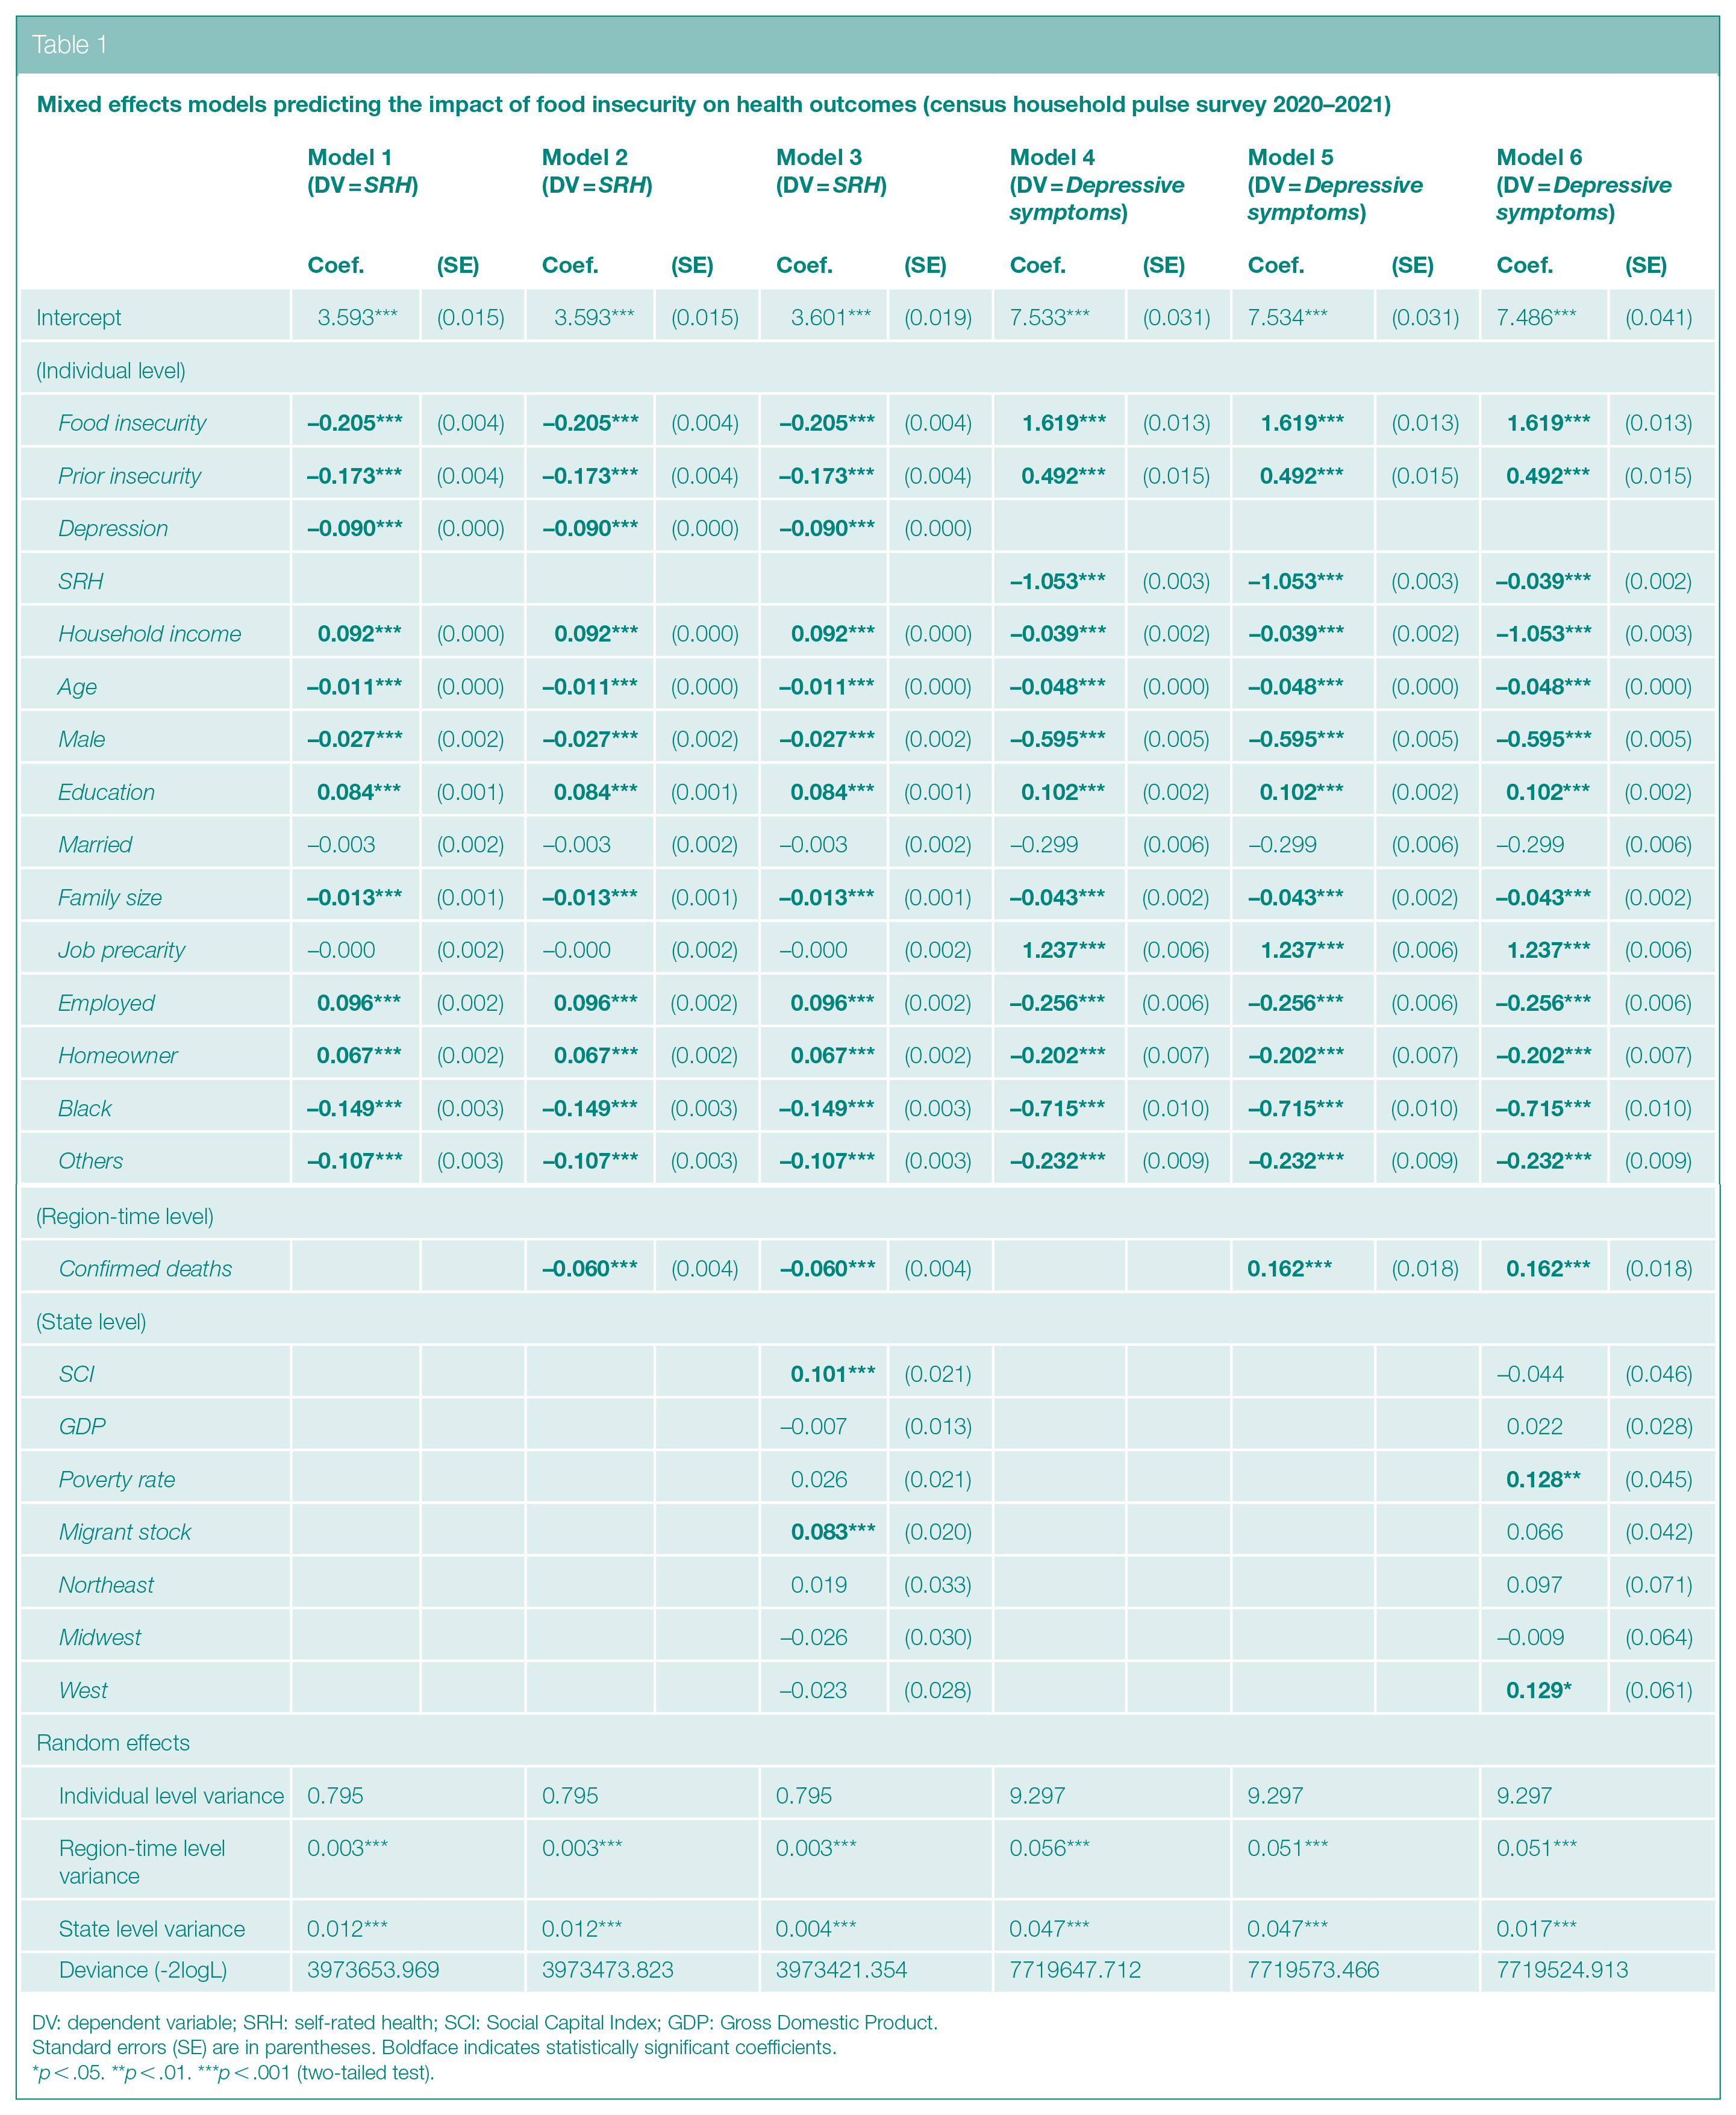
DV: dependent variable; SRH: self-rated health; SCI: Social Capital Index; GDP: Gross Domestic Product.
Standard errors (SE) are in parentheses. Boldface indicates statistically significant coefficients.
p < .05. **p < .01. ***p < .001 (two-tailed test).
Conditional health effects of food insecurity across social capital indices (Census Household Pulse Survey 2020–2021)
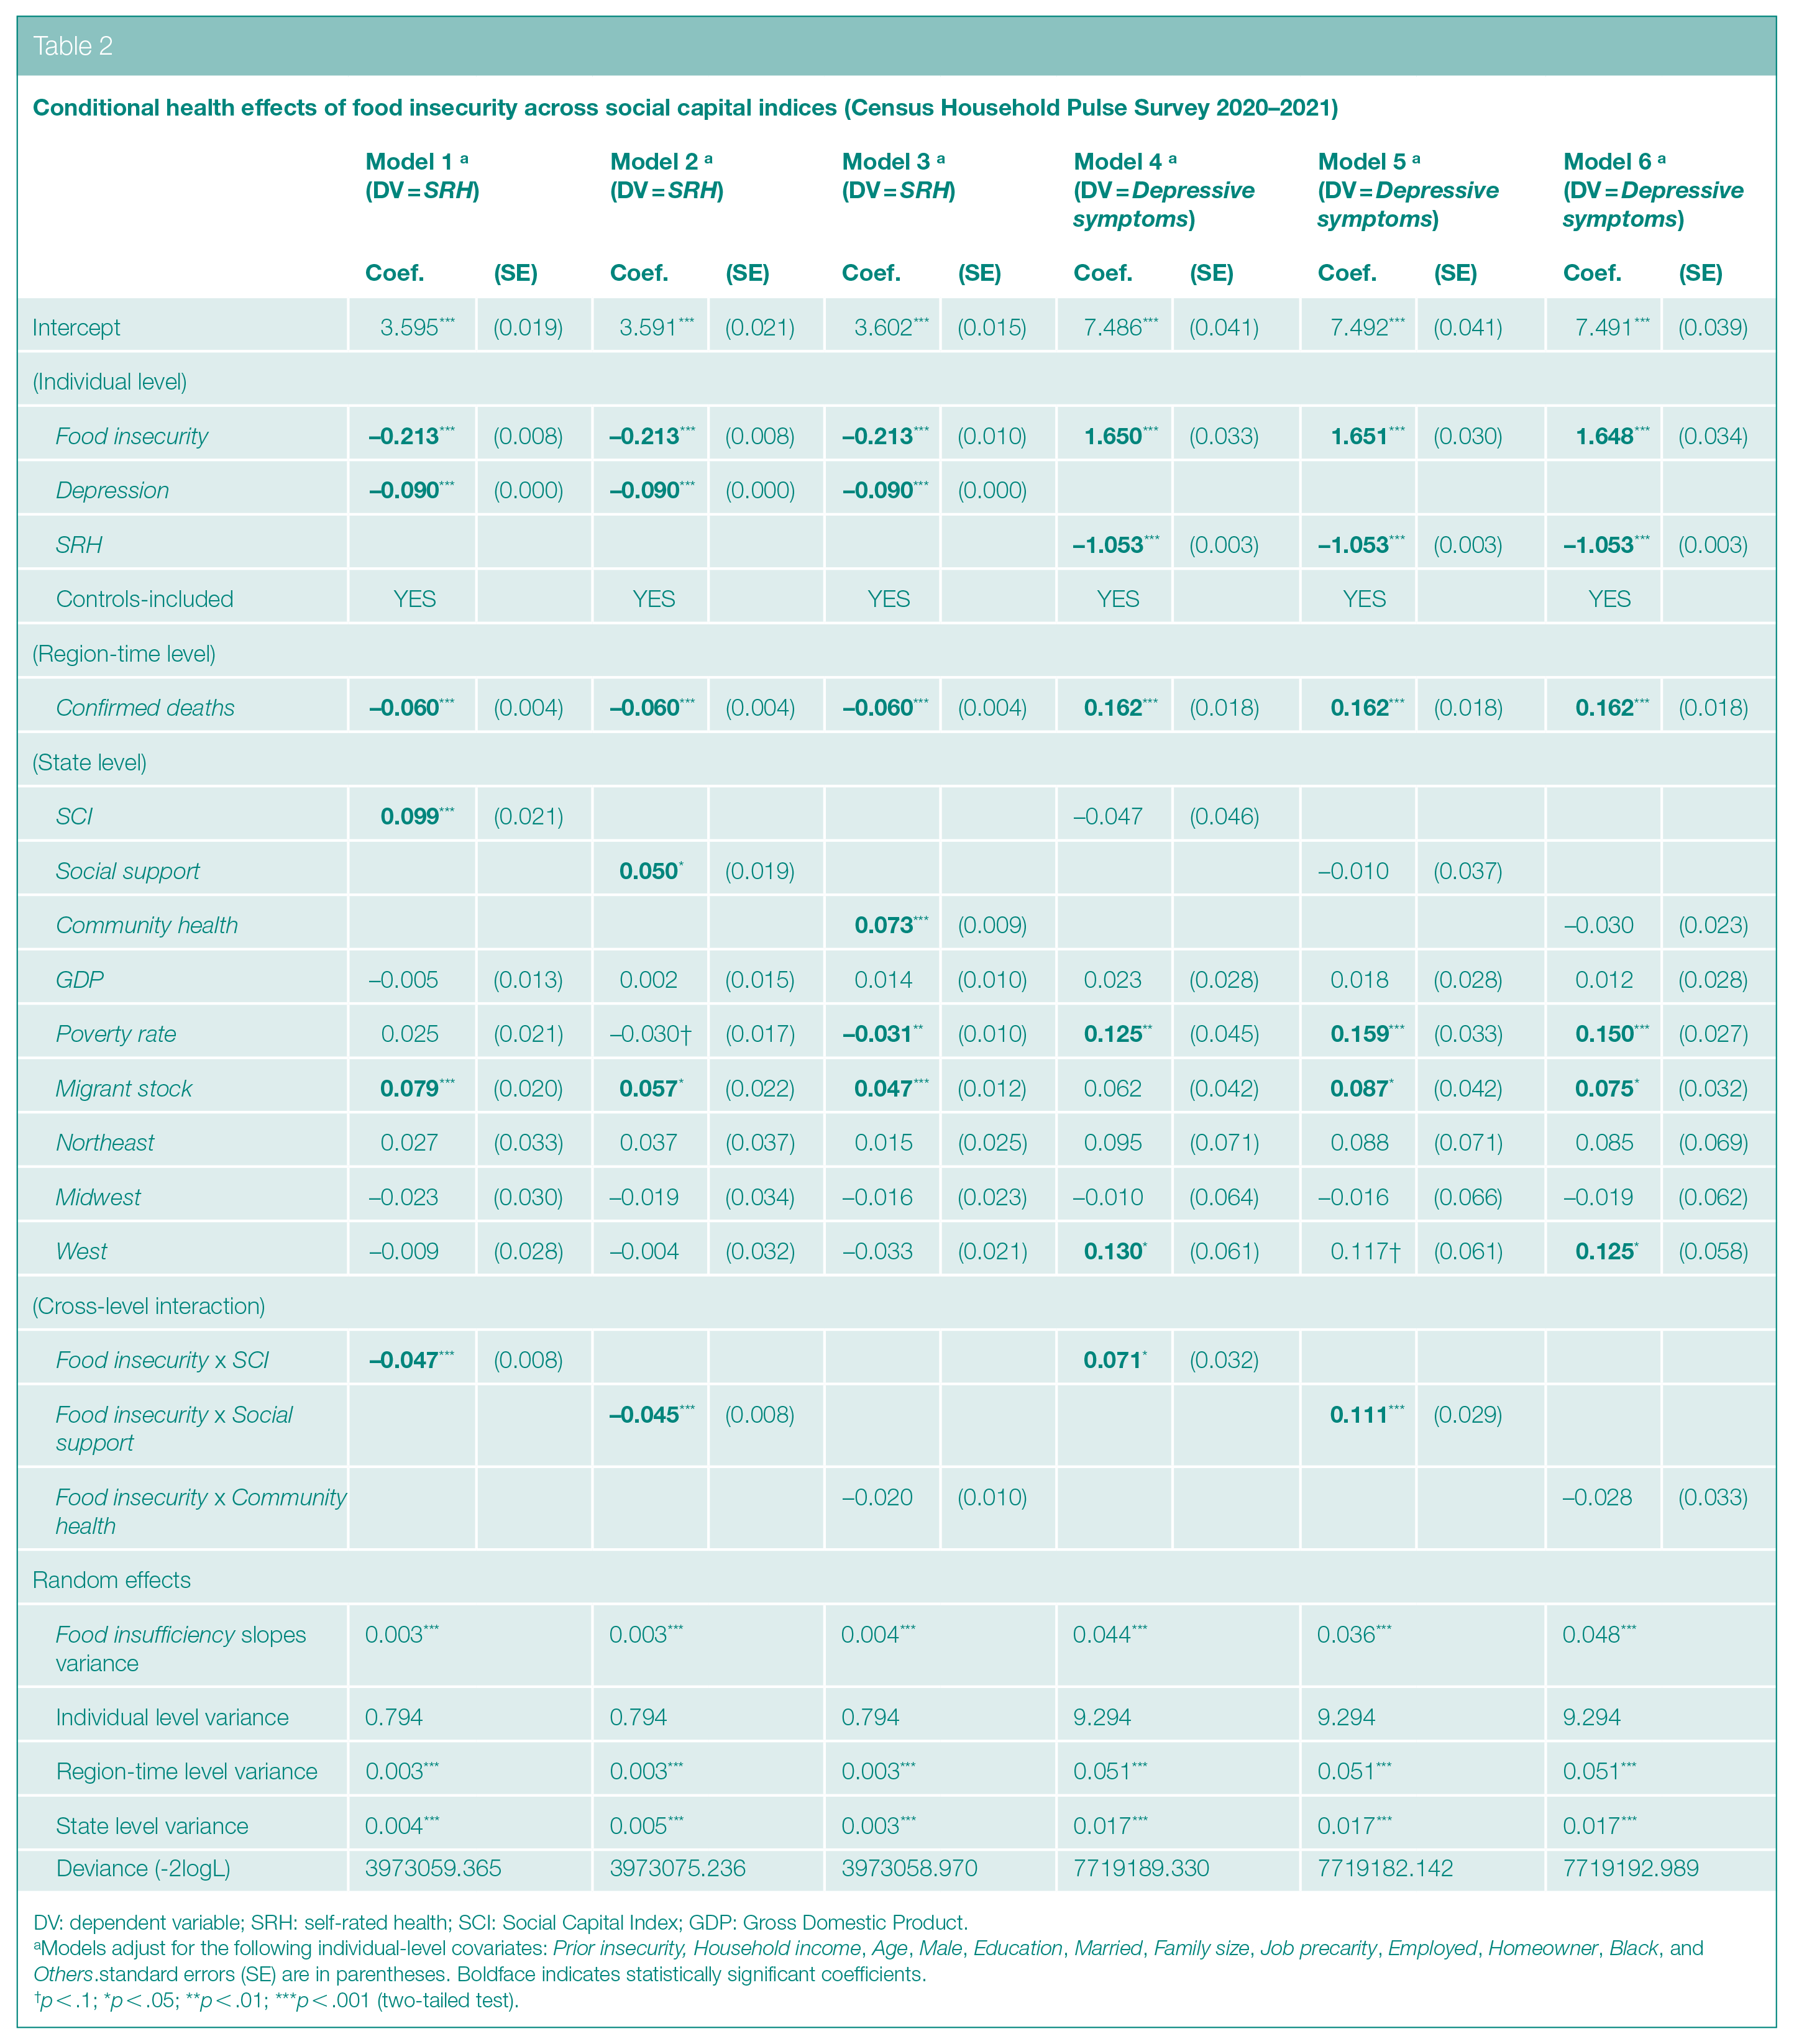
DV: dependent variable; SRH: self-rated health; SCI: Social Capital Index; GDP: Gross Domestic Product.
Models adjust for the following individual-level covariates: Prior insecurity, Household income, Age, Male, Education, Married, Family size, Job precarity, Employed, Homeowner, Black, and Others.standard errors (SE) are in parentheses. Boldface indicates statistically significant coefficients.
p < .1; *p < .05; **p < .01; ***p < .001 (two-tailed test).
To minimize the possibility of a spurious relationship between the outcome and main explanatory measures, we adjusted for a host of individual-level confounders that were available in the CHPS, including household income, employment status, job insecurity, and homeownership. In addition to these factors that tap into financial/economic status, we included the following sociodemographic controls: education, race, age, gender, family size, and marital status. For an even more conservative test at the state level, we also added gross domestic product, poverty rate, migrant stock (proportion of immigrants), and regional dummies. Inclusion of such macroeconomic, geographic, and ethnic-compositional indicators allowed for a conservative estimation of the focal relationships net of potential confounding effects at both individual and contextual units of analysis. Finally, in our models, the total number of coronavirus infected cases was controlled for as a time-varying covariate across subnational regions. Such stringent measures were taken to avoid possible model misspecification that could bias parameter estimation.
In Table 1, Models 1–3 refer to findings from predicting SRH and Models 4–6 refer to those from predicting Depressive symptoms. According to Model 1, except for marital status and job precarity, the rest were significantly related to self-rated health. Household income, Education, Employed, and Homeowner predict better health. In contrast, Depressive symptoms, Age, Male, Family size, Black, and Others were negatively related. With respect to depressive, that is, common mental disorder, symptoms (as shown in Model 4), the background controls were similarly related. In addition, Job precarity emerged as another positive predictor of poor mental well-being. And as expected, for both outcomes, Prior insecurity was a highly significant factor. Adjusting for these confounders, post-pandemic experience of limited food access (Food insecurity) significantly lowered physical health (ß = −.205, p < .001 in Model 1) and raised depressive symptoms (ß = 1.619, p < .001 in Model 4).
In Models 2 and 5 for SRH and Depressive symptoms, respectively, we added Confirmed deaths, which was shown to significantly impact both outcomes. That is, living in a state with more deaths due to COVID-19 infection was associated over time with worse physical health (ß = -.06, p < .001) and greater mental disorder symptoms (ß = .162, p < .001). To examine state-level variables, we further estimated Models 3 and 6. Even after including covariates at the region-time and state levels, our central finding with respect to Food insecurity remained robust in the two fully specified models (Models 3 and 6). As the primary focus of this study, we proceed with Table 2 containing results from running cross-level models.
In Model 1, net of controls at all three units of analysis, the interaction term (Food insecurity x SCI) emerged negatively significant (ß = -.047, p < .001), that is the negative effect of food insecurity on SRH was stronger in states with higher scores on the social capital index. Hence, contrary to conventional view and our expectation, contextual social capital did not buffer but magnify the harmful stressor under investigation. Contents of Model 4 corroborated this interpretation with respect to Depressive symptoms, as indicated by the same interaction term but with the opposite sign (ß = .071, p < .05). As a robustness check, we reanalyzed the data using Social support instead of SCI. Findings were consistent, as shown in Model 2 for SRH (ß = -.045, p < .001) and in Model 5 for Depressive symptoms (ß = .111, p < .001). They were not replicated, however, using Community health as shown in Models 3 and 6.
In Model 3, we performed a further sensitivity analysis with a new predictor, Insufficient food, by taking the difference between Food insecurity and Prior insecurity. A higher number, thus, indicated a worsening experience of food shortages in the household. Results from using this alternative measure are presented in Table 3. For SRH, parameter estimates for the two interaction terms (in Models 1 and 2) were similarly significant as those reported in Table 2. For Depressive symptoms, the coefficient for Insufficient food x SCI in Model 4 fell slightly below the conventional level of significance (p < .1), while that for Insufficient food x Social support remained consistently robust (p < .05). Overall, these findings converged with those previously reported using Food insecurity (controlling for Prior insecurity), confirming that contextual social capital (SCI and Social support but not Community health) magnified the harmful health impact of insufficient access to food.
Robustness checks using insufficient fooda as the main predictor (Census Household Pulse Survey 2020–2021)
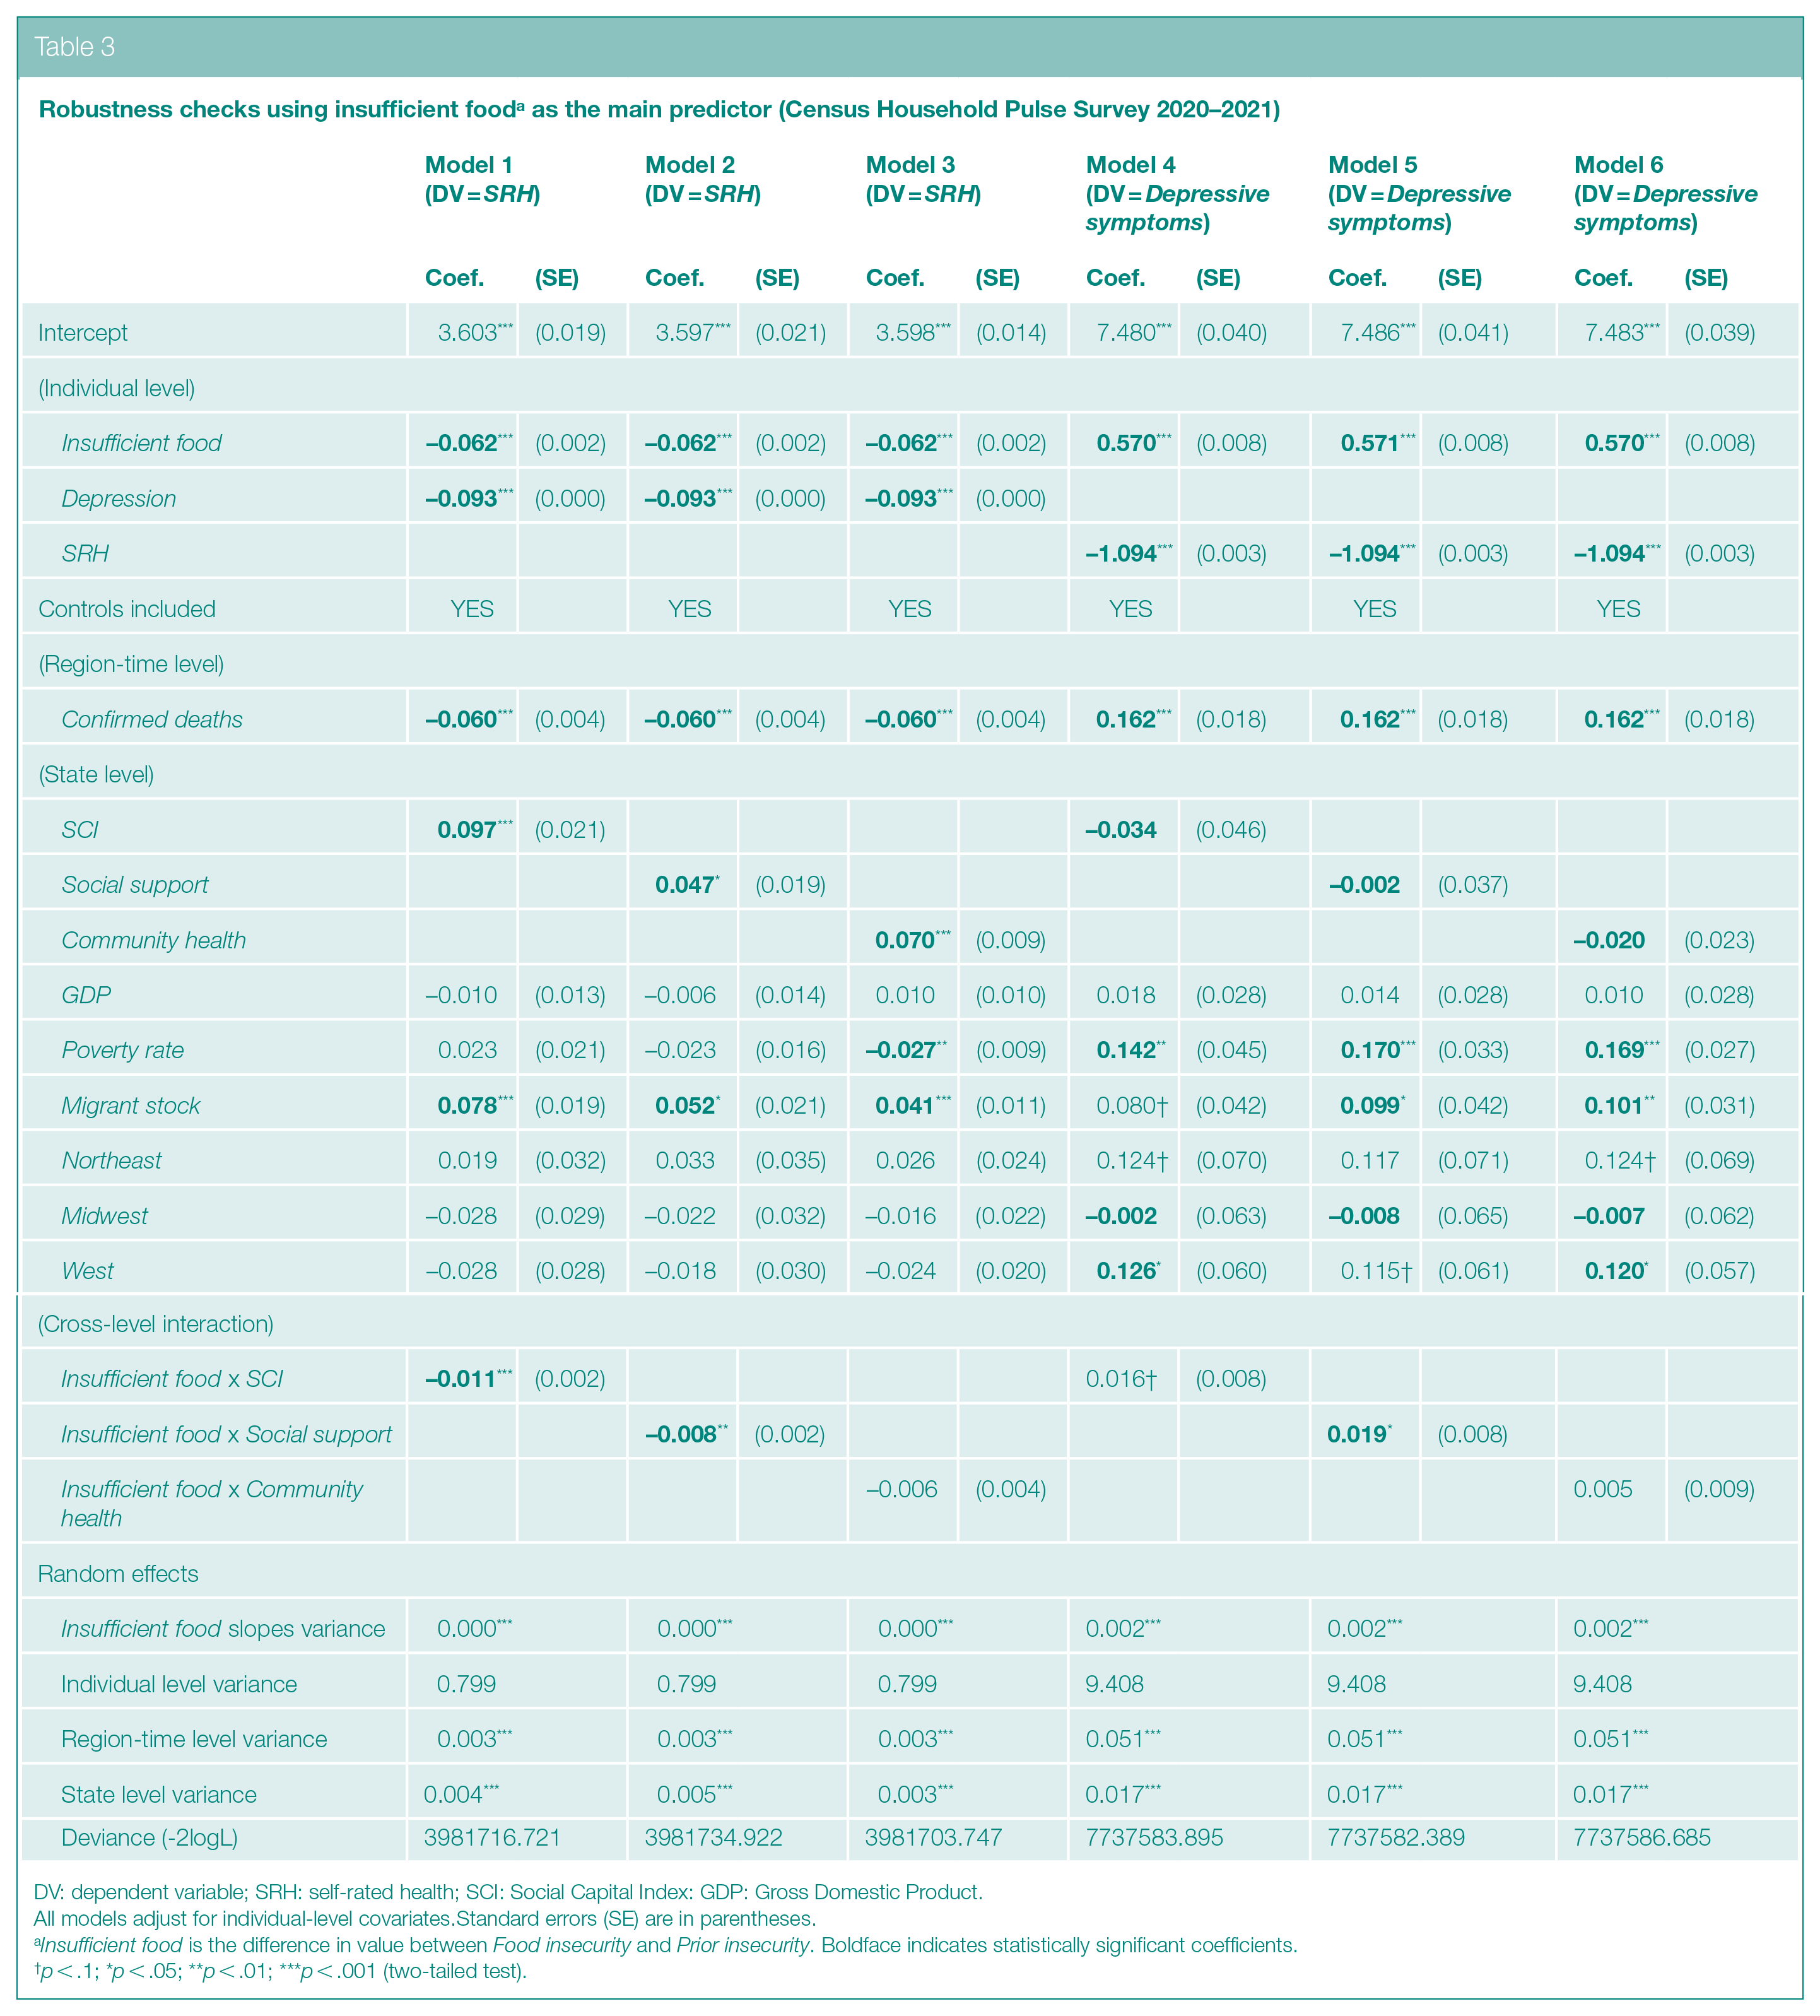
DV: dependent variable; SRH: self-rated health; SCI: Social Capital Index: GDP: Gross Domestic Product.
All models adjust for individual-level covariates.Standard errors (SE) are in parentheses.
Insufficient food is the difference in value between Food insecurity and Prior insecurity. Boldface indicates statistically significant coefficients.
p < .1; *p < .05; **p < .01; ***p < .001 (two-tailed test).
In multilevel modeling, influential cases at the higher-level unit (e.g. state) can drive the estimated results.
33
To assess potential outliers, we conducted a final robustness test by calculating DFBETAS along with the threshold value (2/sqrt(N), N = number of observations, i.e. 51), results of which are shown in Online Supplement 3 (Panel A for SRH and Panel B for
Robustness checks adjusting for influential cases
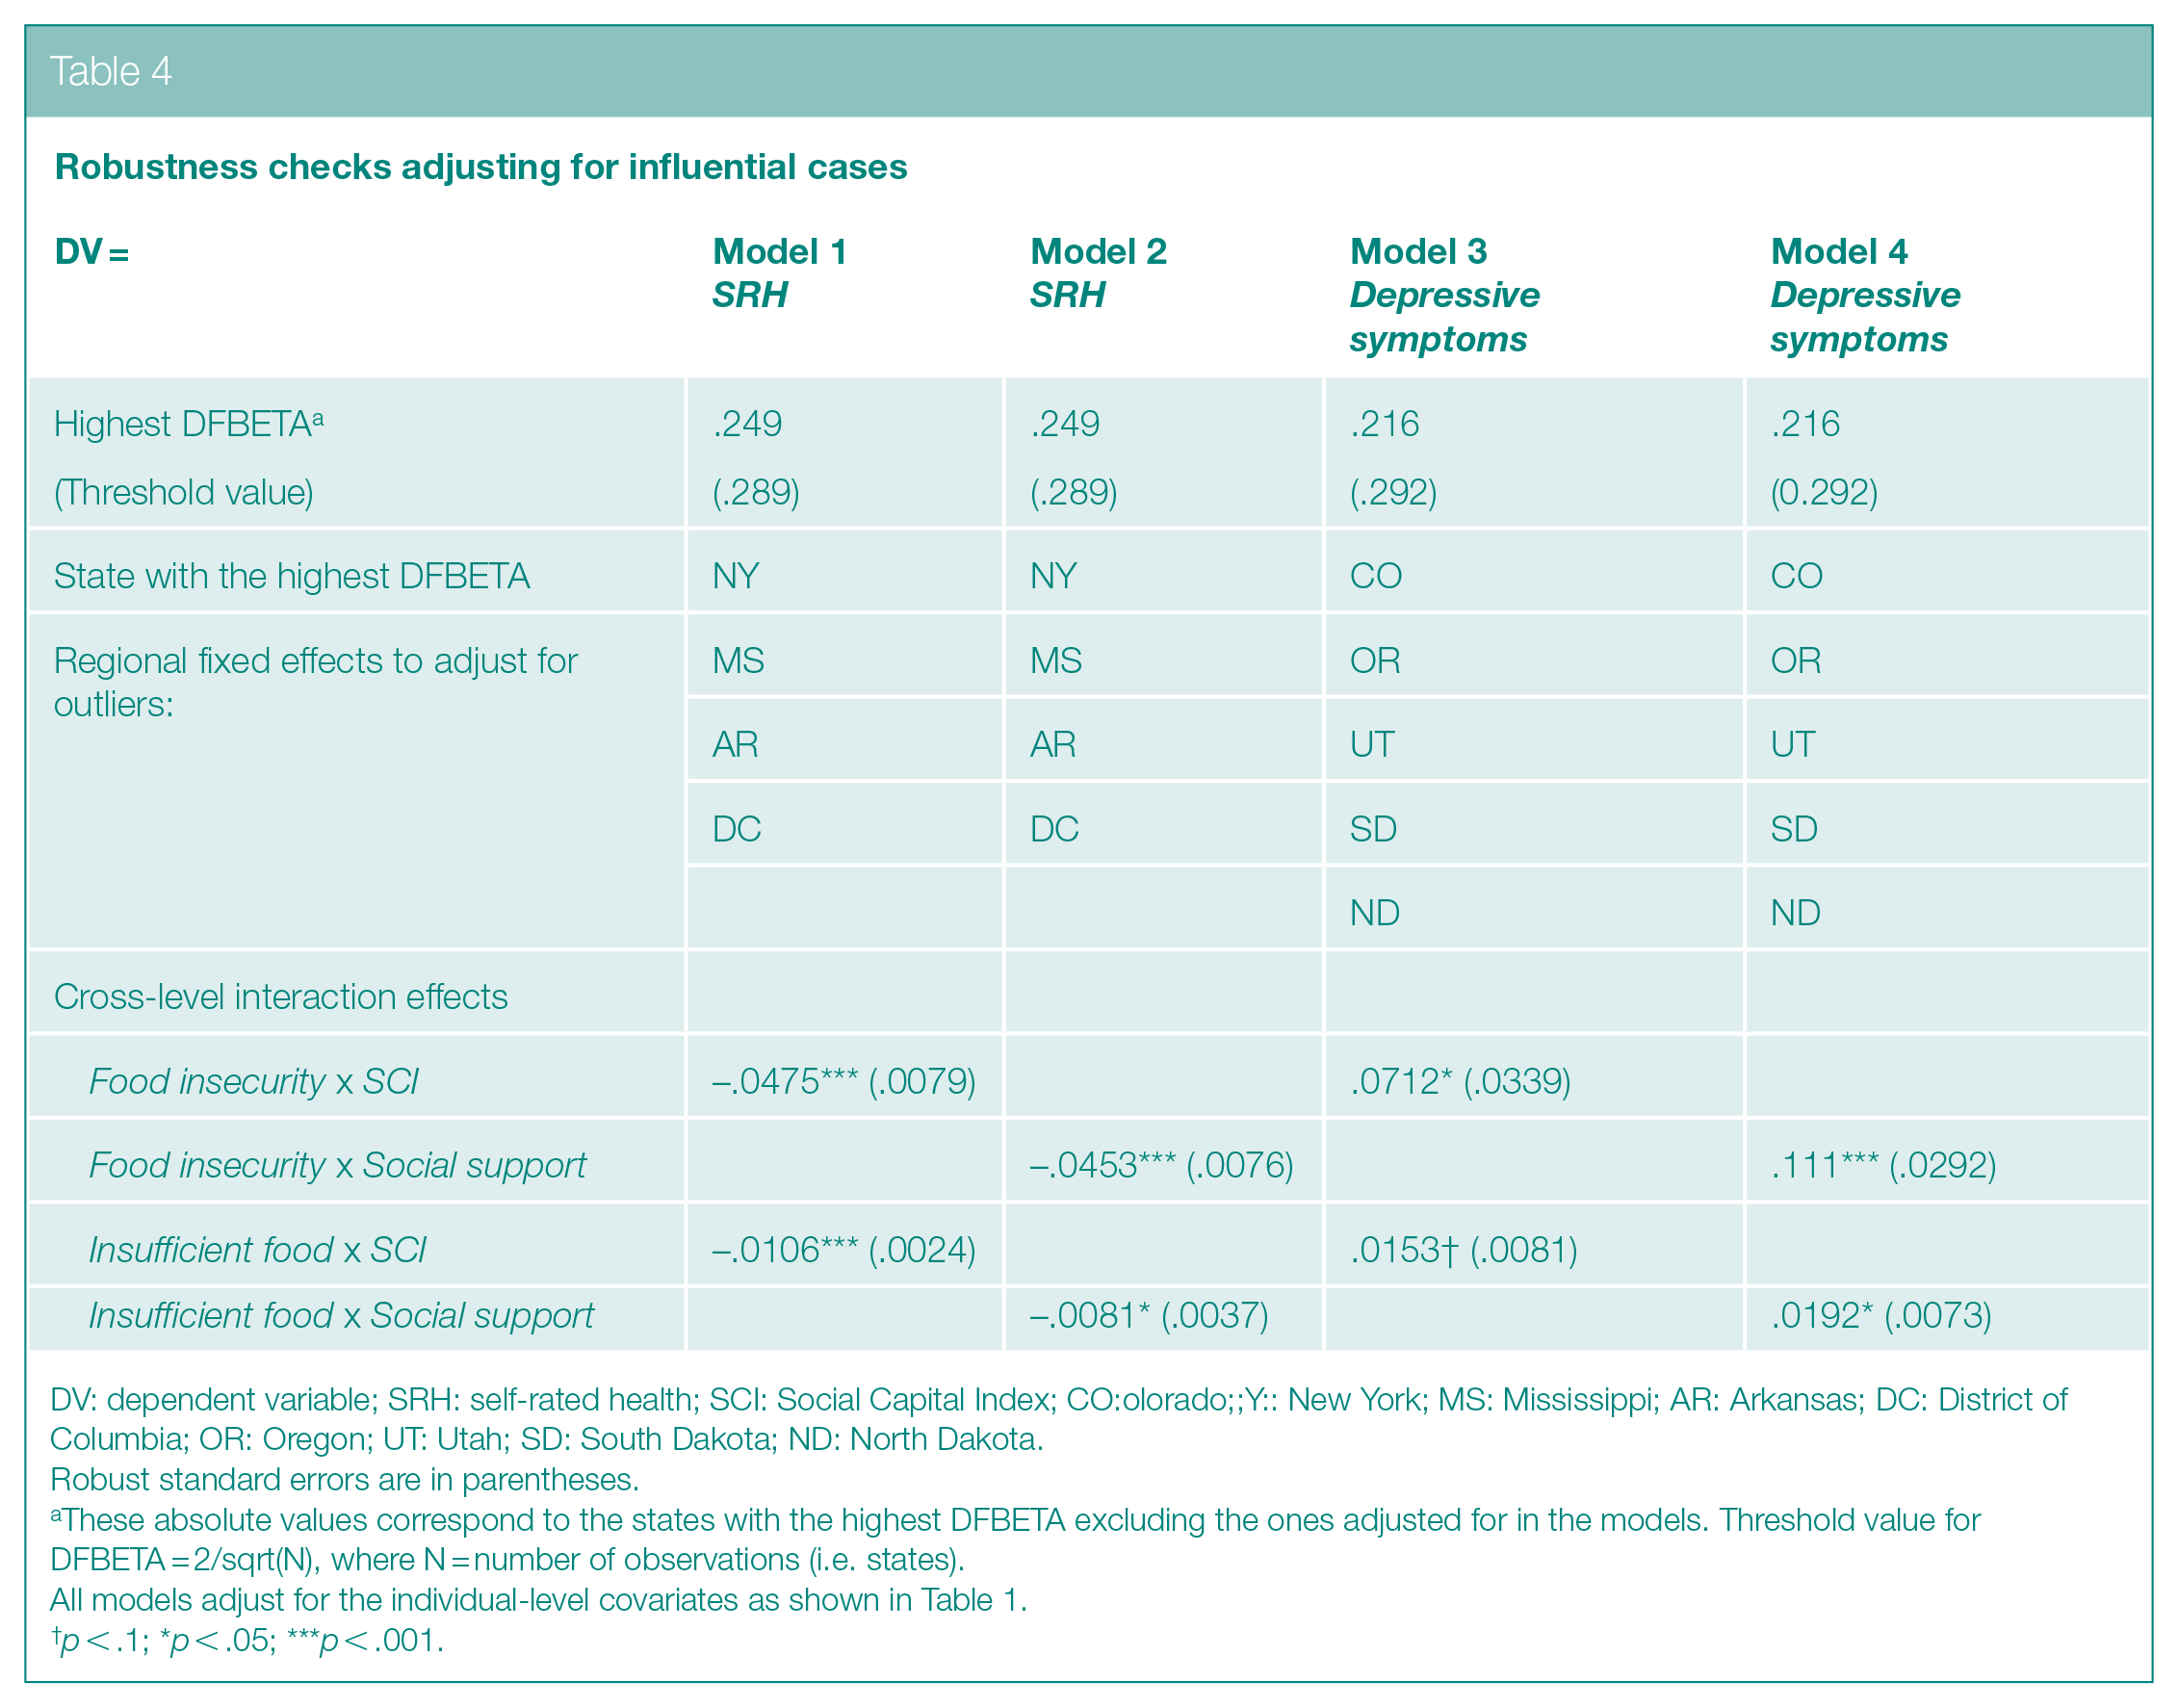
DV: dependent variable; SRH: self-rated health; SCI: Social Capital Index; CO:olorado;;Y:: New York; MS: Mississippi; AR: Arkansas; DC: District of Columbia; OR: Oregon; UT: Utah; SD: South Dakota; ND: North Dakota.
Robust standard errors are in parentheses.
These absolute values correspond to the states with the highest DFBETA excluding the ones adjusted for in the models. Threshold value for DFBETA = 2/sqrt(N), where N = number of observations (i.e. states).
All models adjust for the individual-level covariates as shown in Table 1.
p < .1; *p < .05; ***p < .001.
Discussion
Vibrant associational life is a central ingredient in protecting and maintaining good health, both physically and mentally. In fact, there is a voluminous literature demonstrating the salubrious role of community social capital. 12 By using population-based data on American adults, our study produced substantial evidence that deviates from the prevailing notion in the scholarship: living in a state with a higher stock of social capital amplified, not reduced, the harmful effects of food insecurity. The present study also made clear that measurement matters, that is different operationalizations led to different results. While Social support moderated the relationships between Food insecurity/Insufficient food and health outcomes, it was not the case with Community health. Given the mutually exclusive indicators used for construction, the two subindices may not capture the same essential construct. In fact, Social support mainly taps into collective potential for the reciprocal exchange of favors, while Community health largely gauges collective commitment to civic responsibilities and duties. A major implication of these divergent findings is that how social capital was conceptualized and measured had profound consequences in terms of statistical results and substantive interpretations.
Related to this study’s main objective, we are confronted with an empirical puzzle: social capital was shown not to buffer the health-damaging impact of food insecurity and related hardship on the physical health and mental wellbeing of Americans. To unpack this, we plotted the focal contingent associations (with Social support) while controlling for all other multilevel covariates at their means, which are graphically displayed in Panel B of Online Supplement 2. On the left side of the panel (based on Model 2 in Table 2), there are two lines referring to distinct levels of food insecurity ( ‘low’ versus ‘high’) in relation to SRH. For people experiencing low food insecurity (below the 25th percentile), represented by the dotted line, the association between Social Support and the outcome measure was positive. That is, contextual social capital showed signs of health benefits. However, the opposite was true for individuals experiencing high food insecurity (above the 75th percentile), represented by the solid line with its downward slope. On the right side of the panel (based on Model 5 in Table 2), we can see similar patterns with respect to Depressive (i.e. common mental disorder) symptoms.
The basic conclusion is as follows: only those US residents experiencing relatively high degrees of food shortages suffered more in terms of worse physical and mental health in states endowed with greater amounts of social capital. In addressing the question of why, we proposed that in low-social capital states, where people are in general less connected/trustful/cooperative, negative health effects of food insecurity may be ‘diffused’. By contrast, in high-social capital states, they may be ‘heightened’. This is because victims of food insecurity most likely face a greater sense of relative deprivation in places where people are better relationally integrated and, as a result, are more likely to evaluate their own financial positions and conditions vis-à-vis those of others. In short, in such subnational regions with a greater stock of social capital (connectedness), social comparison would matter more for personal physical and mental wellbeing. Thus, for the economically marginalized, this meant experiencing greater feelings of inferiority, frustration, despair, and so on, in comparison with those who are economically better off. In contrast, this tendency would be reduced in low-social capital states where residents are disconnected and, as such, not only less prone to engage in social comparison but less likely to feel relatively deprived (i.e. unhealthy) because of it.
Another possible explanation may be that individuals in dire economic situations characterized by extreme food shortages had very limited social networks to begin with, a situation that most likely worsened due to the pandemic and related social distancing mandates. Social interactions are largely driven by ‘status homophily’, 34 that is, people of similar status (e.g. education, income, race) tend to interact with one another. Therefore, those who are positioned toward the bottom of the socioeconomic ladder are excluded from the resources and benefits available to their counterparts on the higher status rung. While some enjoyed living in a state where members frequently interacted with and generously supported one another, those undergoing a severe food shortage were more likely on the fringes of a community that denied them such benefits when they were most needed. To make matters worse, the extremely poor were also doubly-disadvantaged: first, in terms of higher susceptibility to viral transmission and, second, in terms of lacking resources to combat the negative impact of physical distancing (isolation). As they were cut off from others, their predicament only worsened, resulting in feeling less healthy and more depressed.
Limitations
Operationalizing our mental health outcomes (common mental disorder symptoms) was limited by the fact that CHPS did not use a comprehensive index such as the Center for Epidemiologic Studies Depression Scale (CES-D). As a result, we could not measure it using a standardized and validated tool at an accepted threshold. Another issue is the measurement of contextual social capital using an index. This methodological approach inherently relied on averaged data based on answers provided by survey respondents, which ignored the fact that different individuals could possess different levels of social capital. Due to a lack of data, it was not possible for us to establish a direct link between state-level stocks of social capital and individual-level prosocial behavior during the pandemic. At the aggregate level, however, there was a negative correlation between the social capital index and macroeconomic indicators such as poverty and the unemployment rate. That is, on average, a state endowed with more social capital was economically better off. Given that charitable giving and financial resources were strongly associated, all things equal, we reasoned that helping victims of food insecurity, for example, could be more prevalent in high-social capital states. Our study was based on observational, not experimental, data. As such, though we adjusted for confounding effects by adding observable covariates, the thorny issue of unobserved heterogeneity remains in our models. Finally, a critical issue not systematically examined is the reciprocal relationship between social capital and the pandemic: how and to what extent did social distancing mandates reduce the amount of preexisting social support and what are the resulting implications for health and wellbeing? Future studies using dynamic measures based on longitudinal data can advance the literature by shedding light on this critical, yet unanswered, question.
Conclusion
Prior findings in social epidemiology have largely emphasized the benefits of social capital – that is, how it can modify the relationship between socioeconomic inequality and health outcomes as a buffer. 12 The present study suggests that social capital is not always functional but, at times, can produce negative, albeit unintended, consequences for people’s health and wellbeing. According to a systematic review, there is a growing, yet limited, number of studies on the potential ‘dark side of social capital’, indicating its potentially deleterious role across myriad empirical contexts. 35 Based on population-based US data, our research adds to this emergent scholarship by illustrating that during the COVID-19 pandemic, ironically, community social capital served as a physical- and mental-health stressor for the most economically vulnerable Americans – that is those suffering from severe food shortages.
Supplemental Material
sj-docx-1-rsh-10.1177_17579139221106339 – Supplemental material for Social capital, food insecurity, and health outcomes in the US during the COVID-19 pandemic
Supplemental material, sj-docx-1-rsh-10.1177_17579139221106339 for Social capital, food insecurity, and health outcomes in the US during the COVID-19 pandemic by Y Choi and HH Kim in Perspectives in Public Health
Footnotes
Acknowledgements
We thank the US Census Bureau for releasing the Household Pulse Survey and the US Joint Economic Committee for making public the data on Social Capital Index.
Conflict Of Interest
The author(s) declared no potential conflicts of interest with respect to the research, authorship, and/or publication of this article.
Funding
The author(s) received no financial support for the research, authorship, and/or publication of this article.
Statement On Ethical Approval
This study was based on a secondary analysis of deidentified data and is exempt from the human subjects’ regulations as defined by the National Institutes of Health (Exemption 4).
Supplemental material
Supplemental material for this article is available online.
References
Supplementary Material
Please find the following supplemental material available below.
For Open Access articles published under a Creative Commons License, all supplemental material carries the same license as the article it is associated with.
For non-Open Access articles published, all supplemental material carries a non-exclusive license, and permission requests for re-use of supplemental material or any part of supplemental material shall be sent directly to the copyright owner as specified in the copyright notice associated with the article.