
Abstract
Teacher expectation mediates the interaction between teacher and students, and teachers tend to differentiate their interaction with their students based on their expectation. In this study, I explore the mediator role of teacher expectation to the participation of ongoing mathematical discussion. Academic interaction between an 8th grade mathematics teacher, and her students (n = 20) academic interactions were recorded (n = 20) and analyzed by using EQUIP during two grading periods. Results of this study reveal that the majority of academic interaction happens between a teacher and a small subset (high expected) of students. High expected students had much more opportunities than all the other students to participate to the ongoing mathematical discussion.
Introduction
There is an explicit link between participation and learning. Some researchers argue that it impacts learning (Shah et al., 2021); whereas others argue learning is a process of “legitimate peripheral participation” of an existing community of practice (Lave and Wenger, 1991). Regardless of the nature of the relationship, students who participate more will have more opportunities to learn and who participate less will have less opportunities to learn. Gutiérrez (2002) defines equity as “the goal of being unable to predict student patterns (e.g., achievement, participation, the ability to critically analyze data or society) based solely on characteristics such as race, class, ethnicity, sex, beliefs, and creeds, and proficiency in the dominant language.” (Gutierrez, 2002, p., 153). Regardless of the characteristics of students, all students should have the fair, not necessarily the same opportunities to participate and learn. Opportunities to learn mathematics are supposed to be accessible to all students rather than a privileged few, and the distribution of opportunities to participate is an issue of equity. Participatory equity concerns fair distribution of opportunities to participate in the ongoing mathematical discussion (Ernest et al., 2019).
Participatory equity and implicit bias
Recently, participatory equity studies investigate the distribution of learning opportunities among students from different communities and backgrounds -- who participates and how are two important research questions that researchers want to understand and answer. Researchers usually compare participation and contributions of students with different identity markers such as race/ethnicity, class, and gender For instance, students from high income families participate more than students from ethnic minorities, low income and migrant families at all level. (Reinholz et al., 2020; Reinholz and Shah, 2018; Shah et al., 2021). Despite the value of the scholarship on the issue these studies do not tell us in what ways inequalites occurs in homogenous classes with respect to the race & ethinicity, color, gender, income and etc. It is a well-known fact that, even in an highly homogeonous communites status orders might emerged very quickly and participation of group members do not necessarily distributed fairly (Cohen and Lotan, 2014).
Participation is often structured by the teacher. Yet, teachers, like all people, are not free of biases. Many studies report that pre-service and in-service teachers have implicit biases toward students from ethnic minorities and migrant families (Glock et al., 2013; Glock and Klapproth, 2017). More importantly, teachers’ evaluation of student potential is not necessarily accurate; indeed, it is biased toward the white boys in the USA (Copur-Gencturk et al., 2020). Teachers’ implicit biases are one possible explanation for the occurrence of inequalities in our classroom; and yet implicit bias studies are usually focuses on the identification the influence on the outcome remains unexplored territory (Thacker et al., 2022). In other words, participatory equity and the teacher biases are usually studied seperately, and no explicit connections is being made between these two research fields. However, some empirical evidence suggests that implicit biases impact students’ academic achievement via Teacher Expectation (TE) (Van den Bergh et al., 2010).
Mediating role of teacher expectancy
Teacher expectation refers to “inferences that teachers make about the present and future academic achievement and general classroom behavior of their students” (Good and Brophy 1997, p, 79). TE is a teacher level variable, and its impact on the students’ academic achievement is well reported (De Boer et al., 2018; McKown and Weinstein, 2008). It mediates the interaction between students and teacher. The idea that teachers interact more favorable and frequent with students whom they believe have the potential to succeed, and contrarily, less favorable and frequent interactions with the students whom they believe have less potential for success is well supported in TE literature (Inan-Kaya and Rubie-Davies, 2021; Wang et al., 2018). Teachers are more likely to give more opportunities to high expected students than low expected students (Good and Brophy, 1997; 1980,). Overestimated students will have more opportunities to participate and then learn more. On the other hand, underestimated students will have less opportunities to participate and will learn less. The idea of differential interaction is well supported in teacher expectancy literature (Wang et al., 2018). That is when a teacher forms expectations for their students it mediates the interaction between students and teachers. Therefore, students have different experiences based on what is expected from them. If we want to understand the inequalities within our classroom, we should take into account TE and the dyadic interactions between students and teacher.
This study
Based on the afore mentioned literature, it is assumed that in an highly homogenous classroom where students are coming from relatively similar background in terms of race, color, and income, teacher expectation (TE) plays a significant role in the distribution of oppurtunites to participate in an ongoing mathematical discussion. Therefore, students will have opportunities to participate according to what is expected from them. The research question of this study is the following:
How are the student contributions to the ongoing mathematical discussion distributed across individual students based on teacher expectation?
Methodology
Framework
Dimensions of classroom discourse.
Data and analysis
Participants
Students.
Turkish settings and importance of high school
Turkiye has a highly centralized puplic education, and goverment provides free education to all students at all levels, inlcuding higher education. Private schools and universities are also available options. The schooling rate which refers to the percent of eligible school age children that attend to formal education is at elementary level 91.54%, at middle school level 94.47%, high school level 83.58%, and the higher education 45.64% (Kondakci and Beycioglu, 2020). The first and foremost issue of education in Turkiye is not the access; but the quality of education that individuals receive (Kondakci and Beycioglu, 2020). Individuals may have the same level of education, but the quality of their educational experiences is a different story. This claim is well supported with empirical data from various sources(Alacacı and Erbaş, 2010; Bölükbaş and Gür, 2020; Özdemir, 2016).
The type of high school is the variable that explains a big portion of the variation in achievement data. There are a number of high school types; from vocational to highly selective and competitive high schools. The high school types are posited to create the achievement gap in Turkiye. This is a well-known fact in Turkish settings (Özdemir, 2016). The success of middle schools and teachers are usually measured by the number of their students who register in highly competitive science schools. Since the high school entrance exam is highly competitive, families from high SES have more opportunities to support their children’s academic growth and prepare them for the upcoming exam. Thus, SES is reflected in the students in the various high school types. In addition, the high school type that students attend has a big impact on students’ future careers (Cansiz et al., 2019). The only way to register respected and very competetive high schools is to obtain a very high score from national level high school entrance exam. Teachers are expected provide necessery guidence to students to prepare them incoming exam, in particular students from low SES families.
Expectation
In this study, the terms TE refers to the “inferences that teachers make about the present and future academic achievement and general classroom behavior of their students” (Good and Brophy, 1997, p. 79). Teacher expectation is operationalized by the different high school type that each student might attend. There are five levels of teacher expectation related to high schools: (1) Non-elective Vocational High Schools, (2) Elective-Vocational High schools, (3) Non-elective Academic High Schools, (4) Elective High Schools, (5) Science High Schools. The teacher herself reported which high school type each and every student might attend in a big excel file at the beginning of the school year 2022-2023. In this excel file, she thinks that some of her students might go to elective high schools, but none has the potential to attend respected Science High Schools. This group was named as high expected students. Then, for some students, the teacher believes that they might attend non-elective academic high schools this group was named as neutral expected students. For the remaining students the teacher predicts they might either stop having formal education or go to non-elective vocational high school at the end of the 8th grade. They were named as low expected student.
Recordings
The second source of the data of this study is the classroom recordings (n = 16) from November 2022 to January 2023. Each recording is 40 minutes, and a total of 640 minutes of classroom interaction is coded and analyzed. Two cameras placed (one in front, and one in back) to capture every interaction turn between teacher and students. The teacher recorded her teaching and shared her teaching with the researchers which means that researcher was absent during the recordings. The data was coded and analyzed by the author (for details see next section).
Equity analytics
In this study, the unit of analysis is a student contribution which is defined as an observed interaction between a student and the teacher. It starts when a new student speaks or is called to speak, and it ends when another student starts speaking or the teacher starts speaking (Reinholz et al., 2020; Reinholz and Shah, 2018). Every student talk is not considered as a contribution. Teacher reaction transforms student’s talk to a contribution. Equity Quantified in Participation (EQUIP) was used to analyze the distribution of students’ contributions across individual students. EQUIP relies on equity analytics which assumes that all students do not have equal access to participate in ongoing mathematical discussions. Some empirical evidence suggests that students from migrant and minority families have less opportunities to participate in terms of both quantity and quality (Shah et al., 2021). Equity analytics calculates the equity ratio which compares expected and observed students’ contributions. If there is some significant difference between these two, then there is a reason to suspect that students’ contributions are not equally distributed.
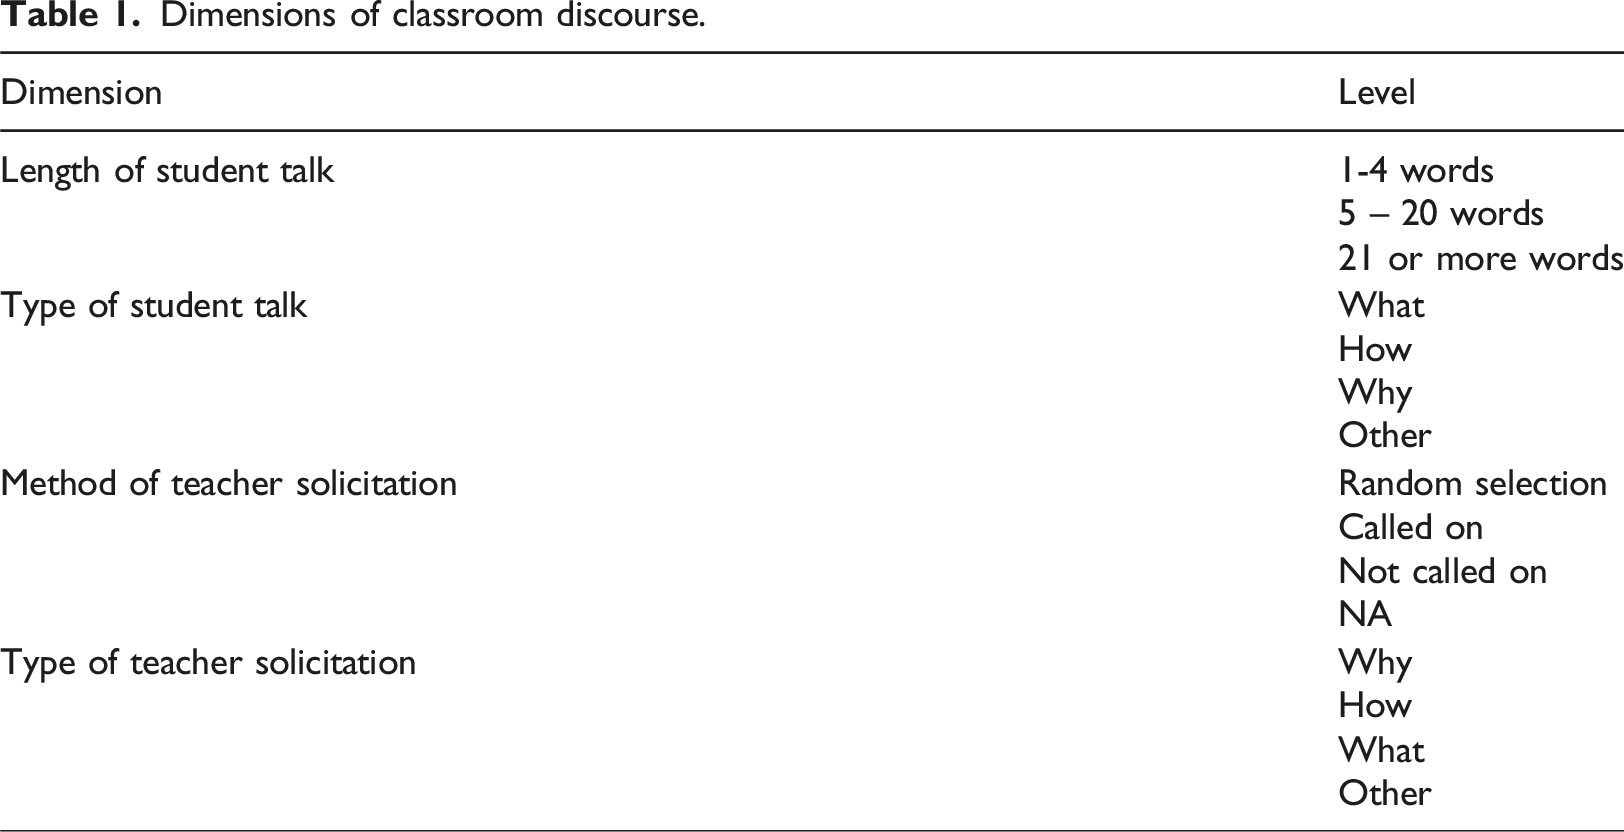
EQUIP initially captures the seven dimensions of classroom discourse. However, some dimensions were not applicable to this particular class. Therefore, some of the dimensions are eliminated, and adjusted to meet the needs of these data sets. The table below shows the dimensions of classroom discourse that are being recorded and analyzed.
By default, EQUIP captures three levels of the length of student talk: (1) 1-4 words which is a strong indicator of traditional Initiation-Response-Evaluation (IRE; Mehan, 1979) where the teacher usually seeks known information, (2) 5-20 words where student talk is roughly a sentence, and (3) student talk whose speech exceeds 21 words which is a strong indication of student mathematical thinking, and the exchange is more than just known information. However, in this study student mathematical talk more than 21 words was not observed. There were some instance that student non-mathematical talk exceed 21 words such as telling a joke. I believe that the lack of long student talk is due to the structure of the Turkish language. Turkish language uses suffixes frequently. A word can have multiple suffixes, the extensive use of the suffixes allows really long words, very easily. So, in this study, the highest-level, 3, participation opportunity is operationalized as an opportunity to solve a problem at the board. If a student is selected to work on the board, I chose to categorize that as level 3. It is possible that student might speak more than 21 words during the problem solving to justify and operationalize her thinking; however, this is only happening during the problem solving.
Statistical analysis
In this study, sample size is small, and it does not necessarily follow the normal distribution. The data is tested for normality. The result of the Shapiro – Wilk test suggests that the data is not normally distributed (w = .8375, p-value = .004275 < 0.05). Thus, Kruskal-Wallis test is used for comparing ordinal or non-normal data sets for two or more categories to test whether there is a significant difference between the median of groups (Keppel and Wickens, 2004). Since three levels of the TE are observed in this study Kruskal-Wallis is an appropriate test to determine the distribution of learning opportunities with respect to TE. A Dunn test with Bonferroni correction is used for pairwise comparison. The significance level is chosen to be
Results
Demographic data
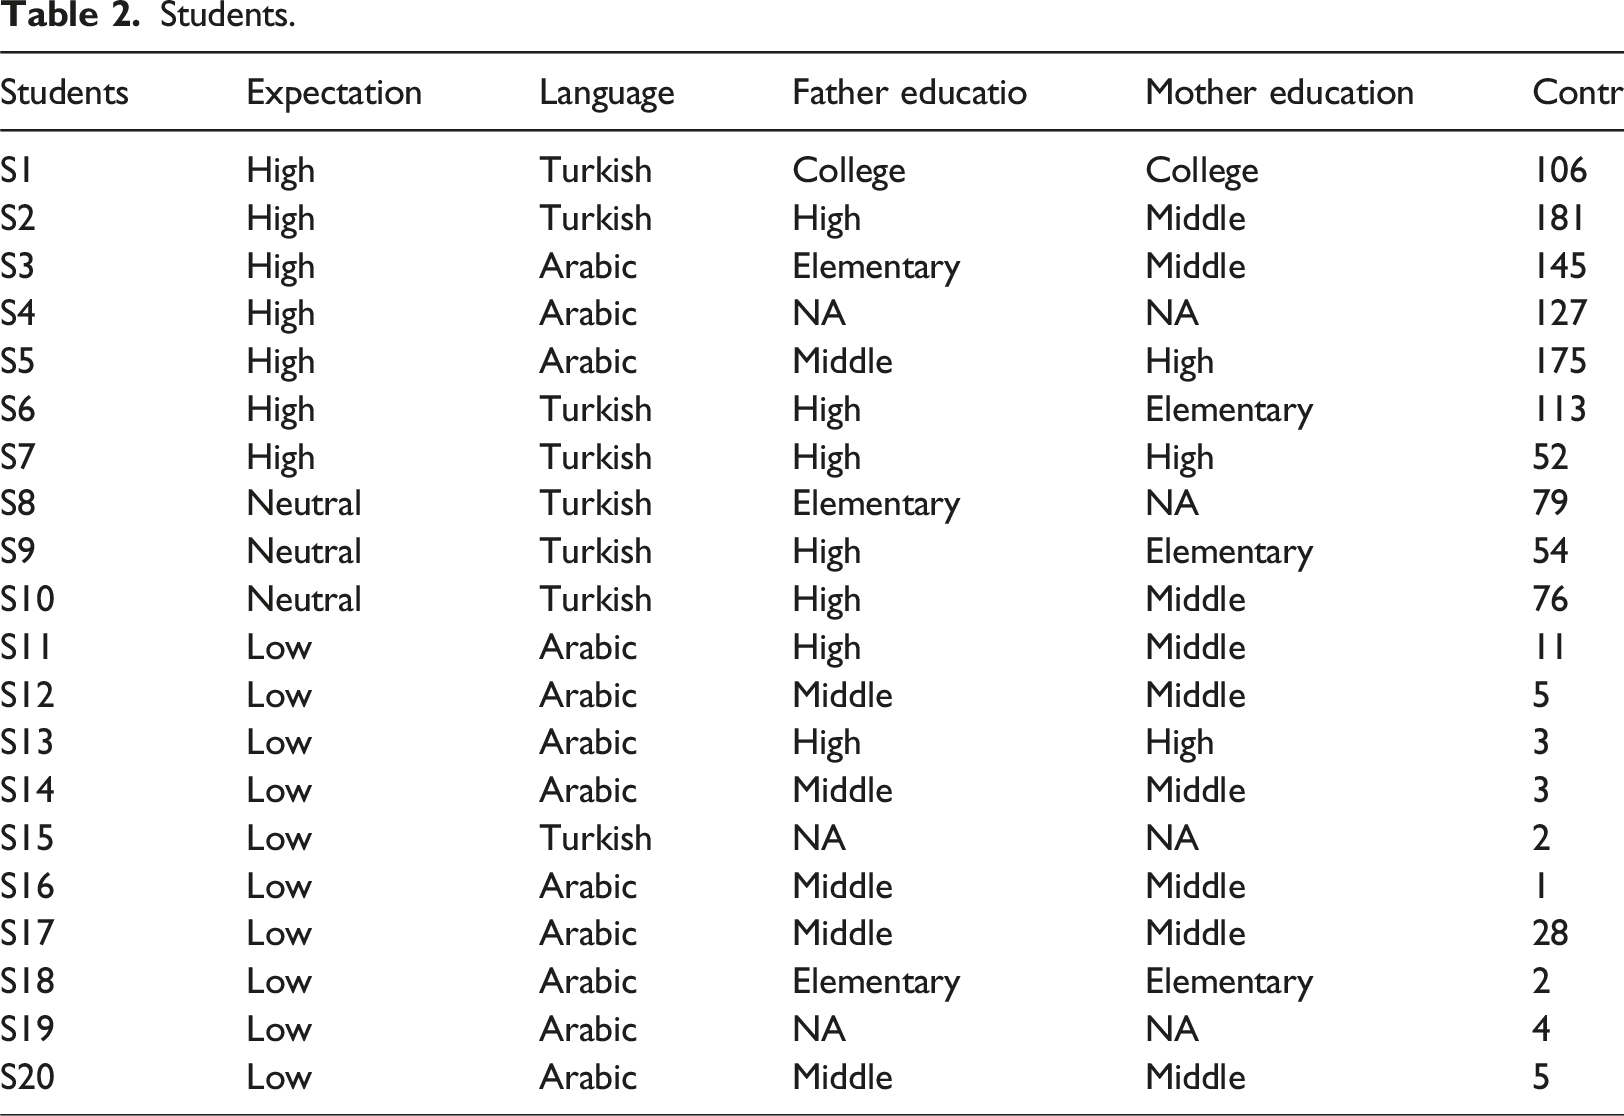
The teacher had high expectations from 7 of her students, neutral expectations from 3 students, and the rest of the classroom, 10 students, were low expected students. Majority of students were migrant students from Syria (n = 12), and the remaining of class (n = 8) were Turkish students. Of the seven high expected students four of them were Turkish students, remaining four students from Syria. All the neutral expected students (n = 3) were Turkish. On the other hand, majority of the low expected students were Syrian except one Turkish students. All students came from low socio-economic background, and only one students’ parents have college degree. All fathers have a blue-collar job, and all mothers were housewives. In this data set, language and migration was giving the same information. Thus, only the language used in analysis. Table 2 summarizes demographic data.
Distribution of total number of student talk
TE and Total number of participations.
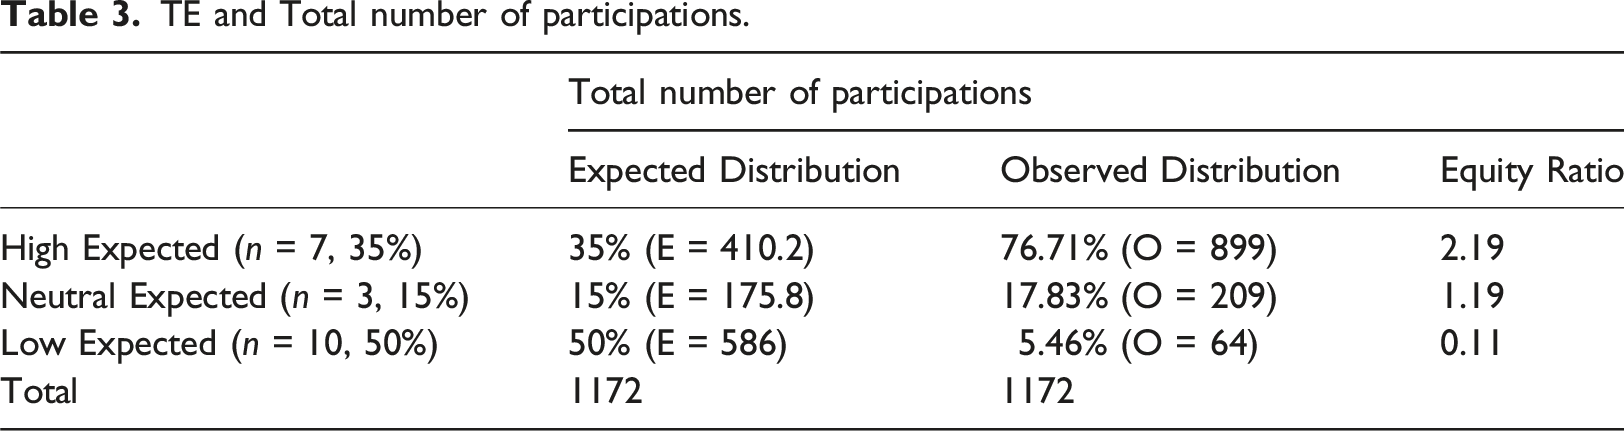
According to the results of the Kruskal-Wallis test a significant difference is observed (X2 = 14.384, df = 2, p-value = 0.0007527 < .05). The result of pairwise comparison reveals that there is a significant difference between the total number of participations only between low and high expected students (p-adj = 0.0004310177 < .05). In other word the high expected students contributed significanly more than the low expected students to the ongoing mathematical discussion.
Distribution of length of the talk
In the previous session we saw that distribution of total number of contribution is skewed toward the high expected students. Here, we explore the distribution of learning oppurtunites with respect to the length of the student talk. In this study a big portion of the student talk was less than five words (N = 976, nearly 82.76%), which is considered a very strong indicator of the IRE pattern. For instance, questions such as “what is the square root of 49?” or, similarly, “what is the square of 6?” resulted in simple word responses from students. EQUIP also captures student talk between 5-20 words. This category (5-20 words) is considered beyond IRE format; however, it is not considered high level participation (Reinholz and Shah, 2018). Approximately 6.65% (O = 78) of the student talk was between 5-20 words. And the rest of student talk, nearly 10.06%, (O = 118) is classified as high-level participation which re-defined description of opportunity to solve a problem at the board individually. The table below summarizes the distribution of student talk with respect to the TE.
The distribution of length of student talk with respect to TE.
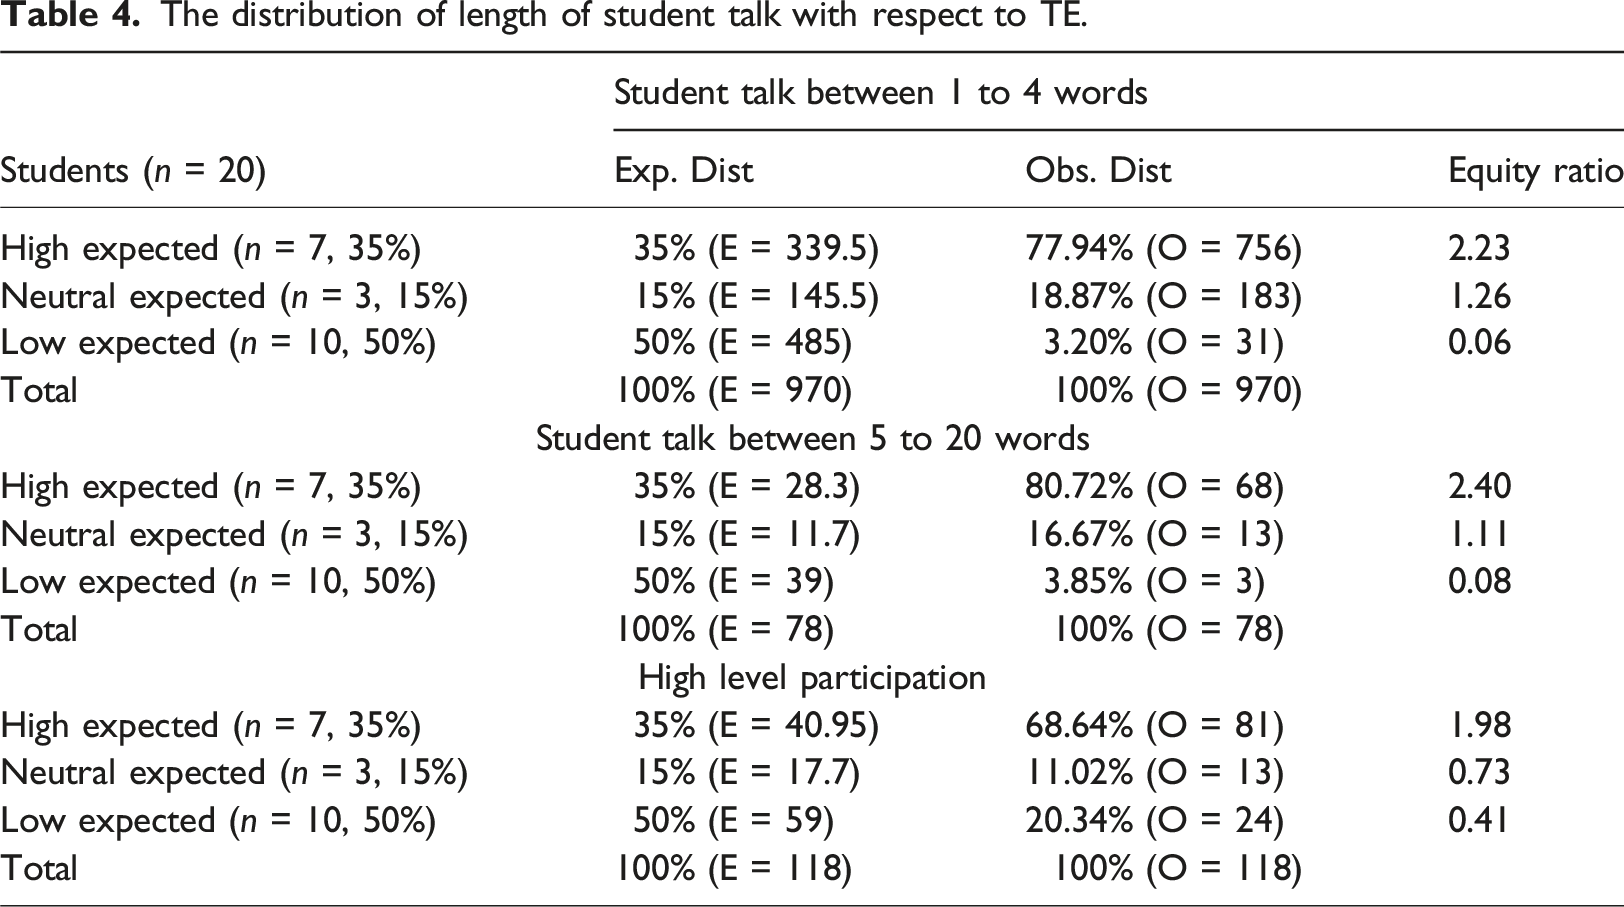
The distribution of high level participation (problem solving oppurtunites) follows a slightly different pattern. High expected students (n = 7) still have more oppurtunites to participate than the low expected students. However, low expected students contributed much more to problem solving than student talk between 1 to 4 words and 5 to 20 words (X2 = 11.95402, df = 2, p-value = .002536398 < .05).
Distribution of teacher solicitation method
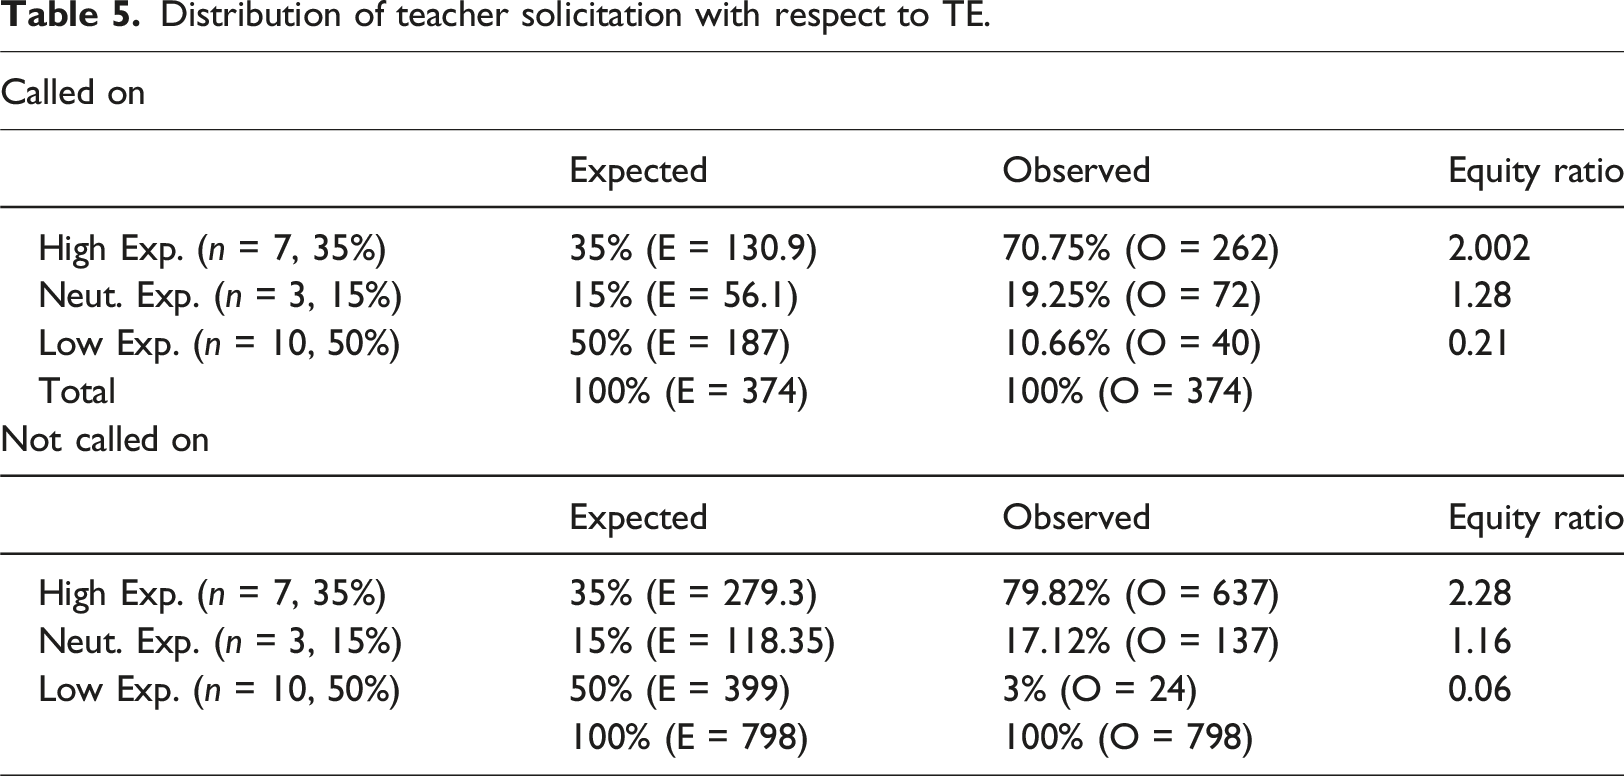
Distribution of teacher solicitation with respect to TE.
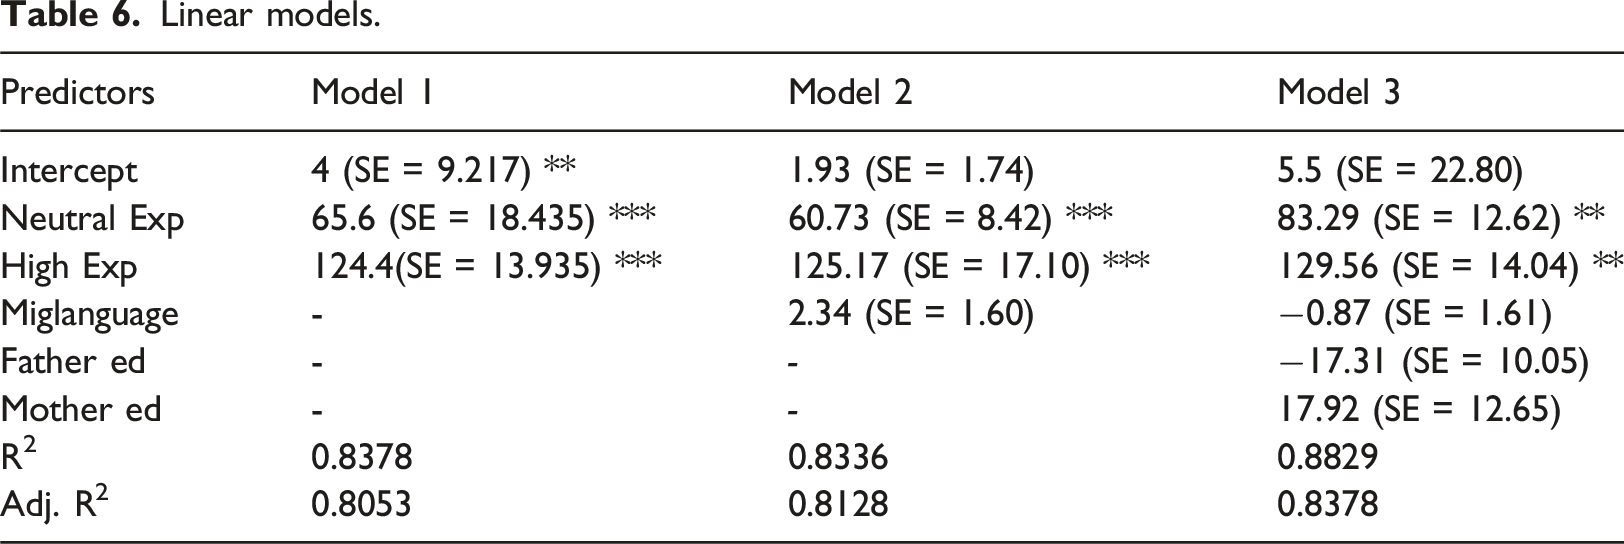
Linear models.
A Kruskal-Wallis’s test is conducted to test whether the distribution of called on is significantly different with respect to TE. According to the results of the Kruskal-Wallis’s test result (X2 = 15.10782, df = 2, p-value = .0005240579 < .05). A pairwise post-hoc Dunn test with Bonferroni adjustment showed that there is a significant difference between only low expected and high expected groups which favors the high expected students (p-adj = 0.3804165504 < .05). Similar results obtained in the distribution of not called on with respect to the TE (X2 = 15.29248, df = 2, p-value = .0004778373 < .05). According to the post-hoc test there is a significant difference between low expected and high expected students which favors the latter group (p-adj = 0.0003878679 < .05). The statistical analysis supports the idea that high expected students were not only given more opportunities to participate; they also want more opportunities to participate.
Association between TE and classroom participation
In order to establish the relationship between student contribution, expectation and other predictor variables such as language, father and mother education initially three linear models were created. The sample size of this study is small (n = 20), and it might not be normally distributed. The data was tested for normality. The results of Shapiro – Wilk test suggest that data does not follow normal distribution (w = .8375, p-value = .004275 < 0.05). However, within each level of TE data seems to follow normal distribution; thus, no transformation was applied (see Appendix). One of the other assumptions of linear regression is the equal varience (homoscedasticity). The results of levene test reveals that the equal variance assumption was vialoated (df = 16, p-value = .005503693 < .05). Linear regression with the Heteroskedasticity-Consistent Standard Errors (HCSE) is applied to the data sets. HCSE uses the least squares or weighted least squares to fit a linear model to the data sets; but an alternative way of estimating the standard error is applied which does not assume the presences of homoscedasticity. HCSE is not a well-known approach outside of economics and statistics. A good way to think about the HCSE is to think about it as a sign that the model is misspecified; however, we did our best to predict (approximately) to the outcome variable (Colonescu, 2017; Hayes and Cai, 2007). Dummy variables are used to establish the relationship between response and TE and the response variable is being a low expected student. The following table summarizes the linear models.
ANOVA was used to compare linear models. The result of ANOVA reveals that there was no significant difference between Model 3 and Model 2 which is nested in Model 3 (F = 1.823, p = .1927 > .05). Father and mother education does not add much to the model. Thus, Model 2 is preferable to Model 3. Then, Model 2 is compared to Model 1; and there was no significant difference between Model 1 and Model 2 (F = 0.3889, p = .5423 > .05). Therefore, Model 1 was chosen to associate the relationship between TE and students’ participation in ongoing mathematical discussions. According to Model-1, reference category which is being a low expected student predicted to have only four opportunities to contribute to 16 class sessions. Whereas a neutral expected, and a high expected student predicted to have additional 65, and 124 opportunities to participate ongoing mathematical discussions, respectively.
Interaction diagram
The results of this study show that high expected students have much more opportunities to contribute than neutral and low expected students. An interaction diagram is created to illustrate relationship between TE and participation. In the diagram, each node represents a student, except for the golden node which represents the teacher, different color represents TE from each student (red is low, gray is neutral, and green is high). The width of the edge represents the average number of teacher’s explicit calling to participate in a class time. Figure 1 The interaction diagram.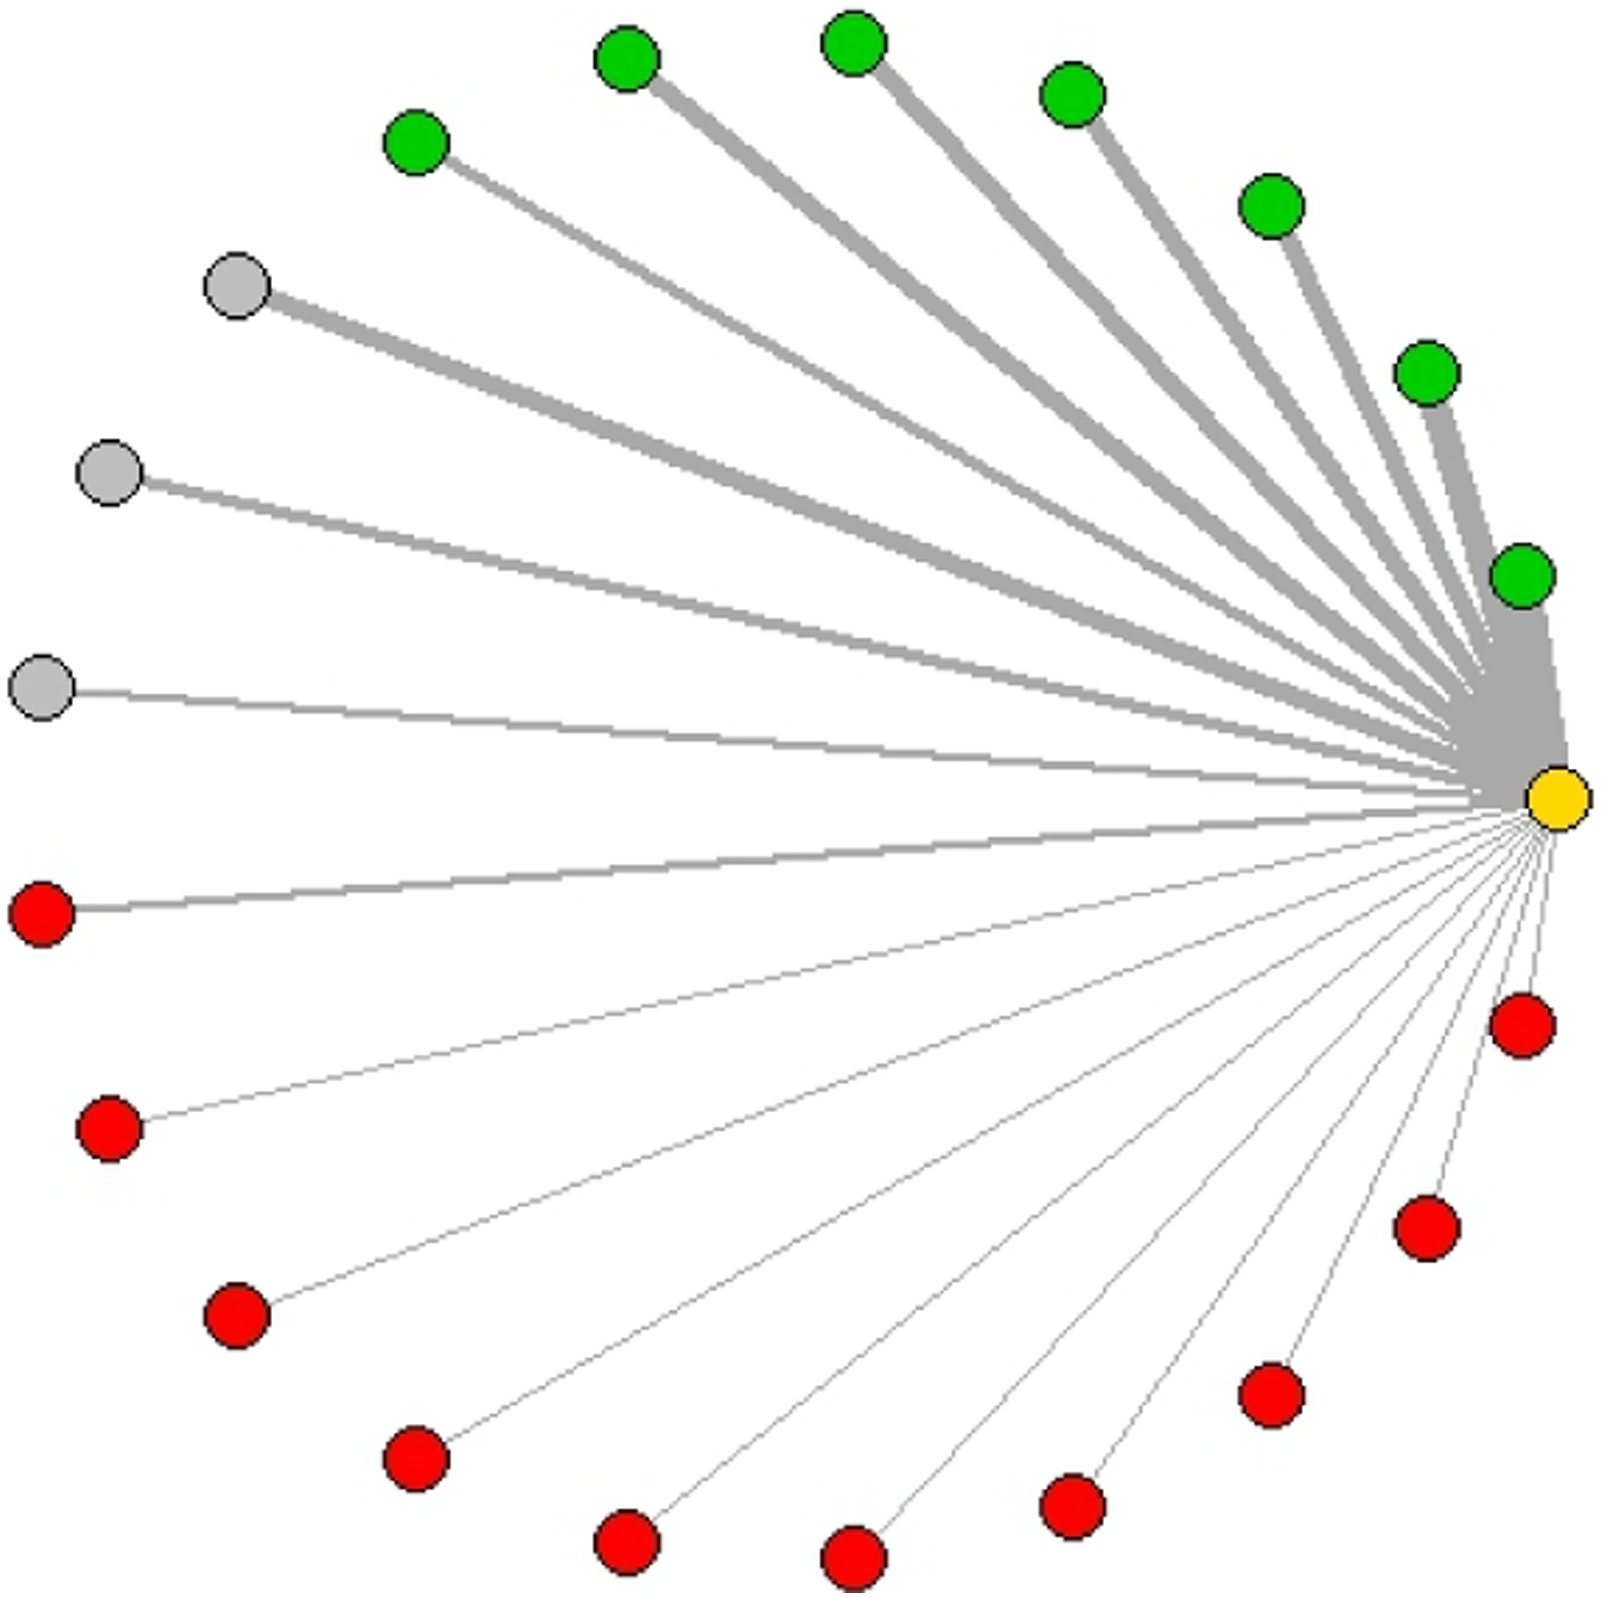
In the interaction diagram, if you go from red nodes to the green nodes the width of the edges (teacher explicit calling to participate) increases. According to the diagram, the teacher gives more opportunities to the high expected students to participate ongoing mathematical discussion than neutral and low expected students.
Discussion
The missing link between participatory inequalities, and implicit biases
There is a research trend where researchers explore and report implicit biases that teachers have such as gender, and income bias. However, teachers’ implicit bias is, usually, studied in the context of the identification of the biases in different settings, and the impact of the biases on outcomes remain unxeplored (Thacker et al., 2022). On the other hand, researchers investigate the nature of the inequalities within our schooling. In order to understand the in which ways inequalities occur, and to give everyone a fair opportunity to Equity and conceptualization of the Equity have become one of the major research revenues in mathematics education (Gutierrez, 2012). A subline of equity research investigates participatory equity where researchers explore the inequalities in students’ participation in ongoing mathematical discussion. The assumption is that students who participate more will learn more, and the students from high-income and racial majorities tend to have more opportunities to participate and learn. Whereas students from ethnic minorities tend to have less opportunities to participate in ongoing mathematical discussions (Shah et al., 2021). Even though the implicit biases are thought to be the root cause of the inequalities within our schools (Staat, 2016), and yet no explicit connections are being made between biases that a teacher have and the influence of biases to the classroom participation was unknown (Warikoo et al., 2016). This study provides some empirical evidence of potential influence of a teacher’s biased expectation toward more able students (as she reports) on participation, and reintroduces of TE is a link between implicit biases and inequalities.
Implications to practioners and educators
According to the researchers everybody have some sort of implicit biases toward some group of people (Staats, 2016). By the very nature of the implicit biases people are not aware of the biases that they have. On the other hand, teacher expectation is observable by teacher as well as students. Teachers and reasearcher instead of trying to identify the kind of the biases that they have; they should focus on the their expectations toward each and individual students which is easily notifiable by students as well as others (Wang et al., 2018). This study provides some empirical evidence of the influence of biased expectation on whole class participation. In this study, more able students had way more oppurtunites to participate than low expected students. Teachers as the leader of the class have a responsibility to ensure everybody has an fair oppurtunites to participate and learn. The results of this study recommends teachers noticing for equity.
Teachers cannot attend everything happens in a classroom. They pay attention something while they inteninonally ignore other things to keep things under control. The filtering mechahinism is called the teacher noticing and it is related to being an expert in any profession (Van Es and Sherin, 2008). Some researchers consider teacher noticing as one of the core practices of being a teacher (Jacobs and Spangler, 2017). Teacher noticing is extensively studied from the perspective of student mathematical thinking (Jacobs et al., 2010). Some researchers report that teachers observe the flow of the lessons and attend to the contributions that are relevant to the overall goal of the lecture (Van Es and Sherin, 2008).
However, according to the MODE model (Fazio, 1990; Fazio and Olson, 2003) when teachers only notice the students’ mathematical contribution which happens simultaneously, there is a danger. Teachers might notice only the contributions of high expected students whereas the contributions of low expected students might be ignored or filtered out to keep things under the control. This might create a pattern in the interaction diagram (as it happens in this class) where high expected students dominate the ongoing mathematical discussion. Perhaps the answer is teachers should notice for the fair distribution of oppurtunites. Teachers should notice for equity and this requires new studies.
Implicitizations to Turkish setting
The result of this study is particularly important for Turkish educators because it provides a novel way of looking at the inequalities in Turkish settings. Inequalities in Turkish settings is usually studied from two broad perspective: (i) the outcome perspective such as standardized testing, high school or college placement (ii) qualitative perspective. In the outcome-oriented perspective, researchers use the publicly available data sets such as PISA and TIMMS to find pattern and correlation among variables (Celen et al., 2011; Dolu, 2018; Erturk and Akan, 2018; Özdemir 2016). The qualitive line of research gives detailed description of students’ experience in Turkish settins (Celik, 2022; Celik and Icduygu, 2019). However, neither quantitaive nor qualitative researcher say much about in what ways ineqaulity occurs in a school level in particular class level. As if all the students in a classroom have an equal acces to participate and learn. However, results of this study suggest that high expected students have significanly higher oppurtunites than their peers, and it is an significant variable to predict students future success and career choices. Students, even from a very similar background, have a very different experience depending on a what is expected from them. The mediator role of TE is a well-known fact (Wang et al., 2018), and once a teacher develops her expecteation, then, the dyadic interaction with that students will change. However, TE is never collected by neither Turkish goverment agencies and researchers. Thus, the nature and the patterns of within class inequalities remain unknown and unexplored territory.
Similar to an English saying, “diamond in the rough” or a gem is a very common metaphor to describe a good or high expected student by Turkish teachers. Expectedly, it is part of the teacher’s responsibility to find diamonds that are hidden which means that teachers are looking for students who have potential but lack opportunity (Kirmizi and Tarim, 2018). When a teacher finds a diamond, it becomes a moral responsibility to support the growth of that student (Arar et al., 2017). For many Turkish pupils, education is the basic tool of social mobility. The central assumption of Turkish setting is “absolute” equality of distribution of educational opportunities. In other words, the only way to register at a respected high school or college is to have a high score or a rank from the mandatory exams. Meritocracy has a long history in Turkish society, and it is a primary tool to distribute the education opportunities (Kondakci and Beycioglu, 2020). Teachers might not be aware of the meritocratic nature of the Turkish society, but they are well-aware of how the educational opportunities are distributed around the country, and TE makes a big difference in a student future success and career choice.
Footnotes
Declaration of conflicting interests
The author(s) declared no potential conflicts of interest with respect to the research, authorship, and/or publication of this article.
Funding
The author(s) received no financial support for the research, authorship, and/or publication of this article.
Data availabilty statement
Datasets generated during and/or analyzed during the current study are available from the corresponding author on reasonable request.