
Abstract
This study explored college student perceptions of racial and ethnic stereotype-based humor in Hawai’i where humor is salient to the local culture. It has been suggested elsewhere that perceptions may be understood through eliciting a cultural domain or mental category including a set of items that are perceived to belong in the same category. For the present study, 72 students participated in interviews or focus groups to explore characterizations of racial and ethnic stereotype-based humor among university students in Hawai’i. The interviews consisted of generating free lists, rank orders and pile sorts, and were analyzed using ANTHROPAC software to convert textual data into matrices and cluster analyses to interpret the cultural domain. The findings indicated that students’ understanding of local stereotypes and humor aligned with the conceptualization of a social stratification in Hawai’i, because they acknowledged more derogatory stereotypes for certain racial and ethnic populations. As colleges continue to work towards diverse learning environments, humor is likely to be one of the more complex areas to address. Future research may involve a content analysis that examines campus fliers, events and media to understand better the role of the institution in developing and perpetuating existing stereotypes.
Introduction
The United States continues to undergo a rapid demographic shift, in which racial and ethnic minorities emerge as the new majority (Zumeta et al., 2012). Higher education institutions are generally enrolling a more diverse student body and attempting to foster climates that support racial and ethnic minorities, as well as prepare individuals for an increasingly diverse society. Hawai'i, the fiftieth state, has been a longtime cross-cultural laboratory and model for how a multiracial society is developed into a thriving multicultural society (McDermott and Andrade, 2014). Hawai'i is the most multiracial state in the United States with 24% of the population identifying with more than one race in comparison to 3% within the nation (Student Equity, Excellence, and Diversity, 2013). However, the Student Equity, Excellence, and Diversity report (2013) included that Native Hawaiians, Filipinos, African Americans, Samoans, and Hispanics remain underrepresented in the University of Hawai'i (UH) system – the state’s largest post-secondary entity – compared to their representation in Hawai'i’s public schools. At the University of Hawai'i at Mānoa (UHM), the flagship campus, although the average 6-year graduation rate is 55%, Native Hawaiians (49%) and Filipinos (54%), in contrast with Japanese and Chinese students, fall slightly behind. Native Hawaiian and Pacific Islander students, in general, have lower continuation and graduation rates. Moreover, White persons account for the largest proportion of faculty in the UH system, with the largest disparities among Executive and Managerial positions. While 59% of upper-end positions are comprised of White persons, only 9% is comprised of both Filipinos and Native Hawaiians combined. Hawai'i's multiracial composition is not proportionate to educational equality and opportunity.
Although the construction and perpetuation of inequality is supported by many factors, we believe that stereotypes rooted in race and ethnic identity play a significant role in shaping Hawai'i's current educational landscape. A movement of scholars critically contesting the “Hawai'i Multicultural Model” within the past two decades informs this perspective (Okamura, 1998; Okamura, 1990; Okamura, 2008; Okada, 2007; Labrador, 2004). The Hawai'i Multicultural Model endorses the image of a thriving society of mixed races and ethnicities (Grant & Ogawa, 1993; Haas, 1998; Lind, 1969; Okamura, 1998; Yim, 1992; Takaki, 1998), positioning Hawai'i as having “a tradition of tolerance and peaceful coexistence; harmonious racial and ethnic relations; equality in opportunity and status; and a shared local culture of identity” (Okamura, 1998; p. 11). The model is supported by Hawai'i's no-majority numeric representation of ethnic groups, in which no single group accounts for a quarter of the demographic make-up (Hawai'i State Department of Health Survey, 2010), and has led to a general perception that racial and ethnic groups are equal, with no single group being “politically or economically dominant” (Labrador, 2004). However, scholars have asserted that beneath the egalitarian perception is a “hidden” existing nature of interracial conflict between and within ethnic groups (Okamura, 1998; Okamura, 1990; Okamura, 2008; Okada, 2007; Labrador, 2004). This conflict and tension has been shaped by the historical consequences of American colonialism, the overthrow of the Native Hawaiian monarchy and displacement of Native Hawaiians, and the exploitation of cheap labor from Asian immigrant workers (Labrador, 2004).
There is a documented social hierarchy that stratifies racial and ethnic populations on a continuum, positioning Whites, Japanese, and Chinese as elites and the rest – Native Hawaiians, Filipinos, Samoans and other Pacific Islanders – as subordinate (McDermott and Andrade, 2014; Labrador, 2004). Stratification appears to be associated with immigration patterns such as order of arrival to Hawai'i, length of residency, cultural traditions, skin tone, and degree of negative stereotyping (Labrador, 2004). Moreover, contributing to the construction of the social hierarchy and its persistence is Hawai'i's general acceptance, tolerance, and frequent usage of local racial and ethnic humor (Labrador, 2004; Okada, 2007; Oshima, 2000). Labrador's (2004) study examined the impact of local stereotypes and humor used to mock Filipinos in Hawai'i. The findings suggest that not only are stereotypes commonly embedded within ethnic jokes, but also tend to reveal patterns that victimize and target certain racial and ethnic groups through harsh forms of humor. Humor may operate as a latent vehicle for sharing and perpetuating stereotypes, consequently supporting and reiterating the social hierarchy. That is, within post-secondary institutions, stereotype-based humor has the potential to distribute and govern power through the construction of racial and ethnic identities and may ultimately materialize into educational inequalities.
The purpose of our study is to examine the use of racial and ethnic stereotype-based humor among college students in Hawai'i. Higher education institutions provide an ideal context to explore the phenomena of stereotyped-based behavior as campuses house public spaces for free speech and peer conversations. According to Kang (2005), peer conversations, or vicarious conversations, are most influential in the development of stereotypes. Furthermore, as described earlier, educational equality does not appear to be shared among racial and ethnic groups in Hawai'i. It seems that those who experience educational inequalities are among the racial and ethnic groups on the lower end of the social hierarchy or stratification. If Hawai'i is to become living proof (Grant and Ogawa, 1993) of a harmonious society for the United States, it is important to understand how institutions mediate racial and ethnic tensions and its implications for perpetuating social and educational inequalities.
We examine how humor functions as a cultural domain, which is framed by literature around the broad areas of racial and ethnic humor, stereotypes, and the racial and ethnic history of Hawai'i. Using qualitative methods, we found that students align their understandings of local racial and ethnic stereotype-based humor to the proposed conceptualization of a social hierarchy in Hawai'i. We conclude with implications for supporting students associated with the racial and ethnic groups ranked low on the emergent hierarchy and a call towards greater awareness to the prejudices and inequalities beneath seemingly harmless humor.
A context for stereotype-based humor
The sword and shield paradox is a popular metaphor of stereotype-based humor that considers multiple perspectives of humor reception (Rappoport, 2005). Most individuals perceive stereotype-based humor as offensive when the purpose of the joke is to ridicule a differing racial or ethnic group from their own. This is the ‘sword’ perspective of humor – when jokes become weapons that victimize and ridicule minority groups. In contrast, stereotype-based humor can also be understood as a defense mechanism or ‘shield’ when aimed at a group one identifies with or protects. Similar to other forms of humor (e.g., gender-based), there will be different meanings for different audiences at different times, depending on the context of the joke, which can be verbal or non-verbal. Ambiguity in humor reception raises challenges when studying stereotype-based humor. In a discussion with five famous comedians about their use of racial and ethnic humor, Rappoport (2005) noted that ‘There was no consensus about the nature of racial or ethnic humor except for the implication that “you will know it when you see it” ’ (Rappaport, 2005: 5).
For the purposes of this study, we adopted Cundall’s (2012) terminology of ‘blason populaire’, which describes racial and ethnic humor as including ‘…the names, phrases, rhymes, songs and jokes which one group uses to categorize specific people and places’ (Dundes, 1965: 43). This definition provides for a broad approach to humor-oriented and stereotype-based research so that various forms of humor are considered (not just verbal jokes.) Moreover, we applied a holistic perspective of racial and ethnic humor as being associated with ‘life style, physical and cultural characteristics, historical background, religious belief, social and economic conditions, as well as the purported characteristics of the ethnic group concerned’ (Oshima, 2000: 41–42). This approach recognizes that underlying humor is the intersection between individual's various identities and socially constructed conditions.
The nature of stereotypes and racism
Despite the ambiguity and variation of perspectives in understanding humor, there is a consistently reported conclusion in the literature: a vast number of racial and ethnic humor and jokes operate on stereotypes (Nilsen and Nilsen, 2000; Okada, 2007). Stereotypes develop from the cognitive process of racial schema formation or the ways in which we racially categorize people based on our meanings (Kang, 2005). Despite the implications of creating harmful stereotypes, schemas are useful to humans because they help classify objects into mental categories that allow us to make sense of the objects. Schematic thinking may occur consciously or subconsciously, vary in complexity (Rousseau, 2001), is often instantaneous and automatic, and is considered necessary for human beings (Kang, 2005).
Kang (2005) argued that the idea of race being socially constructed is evident in the process of racial schema formation. The process begins with racial categories that are perceived and acknowledged by society. Through schematic thinking, individuals are classified or racially mapped into a racial category. Once individuals are assigned into a category, socially learned implicit and explicit racial meanings (or stereotypes) are associated with the category. When stereotypes are negative and ridicule the targeted individuals they become discriminatory and thus may transform into racism (Okada, 2007). In addition, racial stereotypes possess direction and move both horizontally to spread across existing populations and vertically throughout generations (Delgado, 1982). This notion of stereotypes being perpetuated throughout generations highlights the challenge for groups to break free from negative stigmas.
If racial schemas develop stereotypes that (1) are embedded in the majority of racial and ethnic humor and (2) may potentially promote racism and discrimination, racial and ethnic humor is likely to be a viable channel for sustaining racism and hierarchical social structures. The effects of racial stereotypes include psycho-social challenges in identity development and formation (Gonzales and Wiseman, 2005; Labrador, 2004), concerns with health disparities and personal well-being (Gee et al., 2006), and the influence in perceptions of campus climate and culture (Constantine et al., 2005), including the perceptions of institutional figures on campus (Gonzalez, 2003).
A widely accepted theory alluding to the dangers of stereotypes is Steele’s (1997) notion of stereotype threat that arises when an individual is placed in a situation in which a negative stereotype about a group they associate with (e.g., ethnic group) is applied. Experiencing stereotype threat can invoke social-psychological anxieties and may cause an individual to feel threatened of being judged or stereotyped negatively. It may also result in the individual conforming to the negative stereotype. When stereotype threat occurs in the context of academic performance (e.g., taking an exam) it may directly interfere with achievement (Spencer et al., 1997; Steele and Aronson, 1995). This can be very problematic for local students, for example Native Hawaiian students, who are associated with the common stereotype (and frequent punch line) of being ‘stupid’ (Revilla, 1996).
Steele and his colleagues (Spencer et al., 1997; Steele and Aronson, 1995) also demonstrated that when a stereotype threat is experienced over a considerable amount of time it leads to the process of de-identification or not caring about the group in which the negative stereotype applies. Similarly, research has supported that local-born and raised Filipinos in Hawai’i, in contrast to Filipinos who immigrated to Hawai’i, undergo a process of de-identifying with their Filipino heritage because of the disproportionate amount of negative stereotypes placed onto Filipinos (Revilla, 1996; Okamura and Labrador, 1996; Quemuel, 1996). Their Filipino linguistic characteristics and cuisine are topics of ethnic jokes in Hawai’i favored by comedians and local residents (Labrador, 2004: 299). Indeed, continual exposure to negative stereotypes may impact social, emotional, and psychological well-being.
Racial and ethnic humor in Hawai’i – the emergence and perpetuation of stereotypes
The emergence of racial and ethnic humor in Hawai’i can be traced back to the beginning of the sugar plantation era during the mid-nineteenth century (Oshima, 2000). Prior to this, Hawai’i underwent drastic change when the Native Hawaiian monarchy was overthrown and, as a result, the production of sugar became a commodity: some 400,000 immigrants were sought to work the sugar fields both for labor and to fragment the workforce by using race in organizing the sugar making process (Liu, 1984). Laborers came from China, Korea, Japan, Portugal, Puerto Rico and the Philippines (Takaki, 2003). They were housed in ethnically-segregated camps, which encouraged racial tension between the groups and triggered the development of the social stratification or social hierarchy that continues to persist in Hawai’i.
Essentially, those lower on the hierarchy experience racial and ethnic stereotypes more intensely than those who are higher on the hierarchy (Labrador, 2004). Caucasian, Japanese and Chinese populations, or those with lighter skin, are placed higher on the social hierarchy and experience jokes that are less negative and demeaning. In contrast, those of lower status include populations with darker skin tones, such as Filipinos, Hawaiians, Samoans, African-Americans and Tongans. Stereotypes aimed at these racial and ethnic groups typically involve meanings of criminal, violent, sexually aggressive and stupid (Revilla, 1996). In a study by Gee et al. (2006), Filipinos in Hawai’i reported increased health ailments when experiencing higher levels of both everyday discrimination (e.g., ‘routine experiences of unfair treatment’) and discriminatory events (e.g., ‘endorsements to being “treated unfairly or badly” … because of the respondent’s race or ethnicity, speaking a different language, or speaking with an accent’) (Gee at al., 2006: 4.). Another marker of the emergence of ethnic humor was the embrace in the 1950s of public ethnic-oriented comedic performances (Labrador, 2004). Altogether, the processes by which populations are stratified by race and the unfair burden that Filipinos, in particular, experience warrants the attention of local and national scholars whose focus on multiculturalism remains significant on the US national agenda.
Despite all of the negative implications of the Hawai’i Multicultural Model mentioned earlier, proponents of the model describe racial and ethnic humor as allowing individuals to bond on the basis that everyone exists equally. In this perspective, individuals acknowledge a general acceptance to laugh at oneself, as well as others (Grant and Ogawa, 1993; Ogawa, 1978; Oshima, 2000). The assumption is that when participating or sharing racial and ethnic jokes, individuals are not being racist or intentionally aiming to put others down; rather, that racial and ethnic humor is acceptable because everyone participates.
Methods
We approach our work with a social constructionist lens (Berger & Luckmann, 1966). The idea that reality is socially constructed includes the idea that legitimation includes nihilation, or the denied reality to any phenomena that do not fit within the legitimated universe. Stereotype-based racial and ethnic humor on college campuses is a means of identifying deviations from the norm and ascribing negative ontological status. It is relevant that this occurs on a college campus because postsecondary education is increasingly analyzed for campus climate for diversity and as an intellectual space that engages students at a critical time of cognitive development (Hale 2004). A further understanding of racially motivated humor on the college campus is, in essence, an exploration of the power of ascribing negative attributes to racial identities. The social construction of race through humor is a prime example of power recreation in postsecondary education.
The purpose of this study was to examine student perceptions of racial and ethnic humor at a multicultural and diverse campus in Hawai’i. Student perceptions were understood through eliciting a cultural domain; that is, a mental category and a ‘set of items or things that are all of the same type or category’ (Borgatti, 1998: 115). People have a habit of classifying the world around them, which affects how they interact with their surroundings; but not everyone categorizes things in the same way. As a result, examining the internal structure of a cultural domain provides insight into the relationships that exist among the items in the domain. The guiding question for this study was: ‘What characterizes racial/ethnic stereotype-based humor as a cultural domain among university students in Hawai’i?’
This study is an initial step in an ongoing process to develop the new conceptualization and will form the foundation for further analyses. As such, we used methods that provide an estimate of how racial and ethnic stereotypes used in humor indicate the architecture of the cultural domain. Furthermore, we were able to ascertain varying levels of cultural competence in the participants.
Identifying the boundaries of a cultural domain is a process of exploring the implicit and loosely stated conceptions of individuals and analyzing them as a group in order to make the boundaries of a domain more explicit. The exploration of the domain does not, in turn, describe the boundaries as individuals perceive it, but explores the underlying rationale of the relational terminology. Wallace and Atkins described this approach as a major theoretical commitment that seeks to develop ‘formal theories and methods which will describe the relationship between cultural forms and processes and their social-structural correlates, whose locus is a society, and psychological (cognitive) forms and processes, whose locus is the individual’ (Wallace and Atkins, 1960: 72). The social structural-reality correlates may not be visible to the individual, but are an essential unit of analysis for social science and the description of culture.
Techniques for cultural domain analysis include eliciting the items in the domain (Phase 1), the attributes and relations that structure the domain, and measuring the position of the items in the domain structure (Phase 2) (Borgatti and Halgin, 2013). In addition to these techniques, focus groups were later conducted to explore further the results from the cultural domain analysis.
Case selection
The study was conducted at the University of Hawai’i at Mānoa (UHM). UHM is the largest University on Hawai’i hosting nine colleges and nine schools. With a student population of approximately 20,400 (14,400 undergraduates, 6,000 graduate and professional students, and 1,000 unclassified students), UHM’s students have shared similar geographic space (71% of students are in-state: see ‘University of Hawai’i at Mānoa’, 2010). In choosing the site for this study, the intention was to purposefully select an institution that embraced a diverse student body. UHM’s undergraduate student population comprises approximately 41% Asian, 21% Caucasian, 17% Native Hawaiian or Pacific Islander, 14% Bi- or Multi-Racial, 3% ‘Nonresident Aliens’, 2% Hispanic/Latino, 1% African-American, and 0.4% American Indian or Alaska Native. As noted, the case location provided a sense of shared geographic location or culture, a general prerequisite for elicitation of cultural domains (Borgatti and Halgin, 2013). In addition, the case allows for contextual framing and interpretation of the findings and analysis. A total of 72 students participated in the study (35 students participated in Phase 1, 25 students participated in Phase 2, and 12 students participated in five focus groups). Participants were randomly recruited through spontaneous contact on campus and through chain referrals, and interviewed by email and face-to-face.
Phase 1: Freelist
Although largely absent from higher education research, freelisting is an elicitation technique in the social sciences (Borgatti 1998; Romney et al., 1986). Researchers can use freelists to identify items in a cultural domain and then to calculate each item’s relative psychological or cultural salience (i.e., prominence, importance, familiarity, or representativeness). In Phase 1 we began identifying items in the cultural domain by asking 35 students in a brief interview to ‘list all the stereotypes you know that are used in racial and ethnic humor’. Their responses, or items, were recorded and are included in the findings. Next, we performed a univariate analysis of the items (i.e., stereotypes) elicited by calculating the items’ frequency of occurrence. After lumping together similar items, the original list of 474 items was reduced to 174 items (see Appendix A). Items that occurred more often were considered to be more salient in the domain. To eliminate idiosyncratic items and focus salience for the second phase of the study, we generated a list of the top 20 most frequently occurring items from the reduced list of 174 items.
Phase 2: Rank order and pilesort
An additional 25 students participated in interviews using the 20 domain items generated from Phase 1. Each item was listed on a separate index card and given to the students who were asked to ‘rank the items in a meaningful order to you’ and offer an explanation of the ordering. Following the rank order, students were asked to organize each of the 20 items into piles that they perceived to be logical or meaningful. The responses were recorded and analyzed by calculating the weighting of each item’s rank position (derived from the rank order) and spatial relationship using cluster analyses or the calculated distance from one item to another (derived from the pile sort).
Focus groups
Twelve students participated in five focus group discussions aimed at sharing their perceptions of racial and ethnic stereotype-based humor. Nine questions formulated the basis of the focus groups and covered racial and ethnic stereotype-based humor observed both within and outside the higher education institution (e.g., ‘How is racial/ethnic stereotype-based humor important to Hawai‘i?’ and ‘Are forms of this humor visible on campus?’) The focus groups followed a ‘talk story’ format, a form of communication commonly used in Native Hawaiian and local Hawai’i culture. In talk story communication, individuals converse in a ‘joint performance’ where speakers cooperatively produce responses (Au and Kawakami, 1985). Often this entails sharing personal narratives as others interject and share their experiences, and also using humor to ‘poke fun’ at one and other. This method of conversation style was strategically selected to alleviate any potential tensions or feelings of discomfort for students, given the sensitive nature of discussions about racial and ethnic stereotypes and/or humor. More importantly, the talk story format acknowledged the native and local style of cultural communication for students, and helped validate their perceptions through their words.
Analyses
To convert the textual data into matrices, we first entered each list into a separate text file. In Phase 1, we used ANTHROPAC’s (Borgatti, 1992) free-list procedure to identify the unique items in each list and overall frequencies. For Phase 2, rank order data were analyzed using a simple calculation of weight. The goal of pile sort analysis is to elicit judgments as well as differences or similarities among the items (i.e., the structure) in the cultural domain (Borgatti, 1998). Pile sorts use a similarity metric and items are bundled based on perceived similar attributes. Using ANTHROPAC (Borgatti, 1992), we conducted cluster analyses that displayed a multidimensional scaling of the pile sort similarities. The cluster analysis provided a visual representation of stereotypes that shared similar attributes, revealing student’s perceptions and sense-making processes. Relationships between items or people are based solely on the similarity of the content and organization of participants’ lists. Investigators are typically left to generalize about the rules participants use to order or categorize listed items. However, we continued the process by asking participants to explain their rationale, which is also included in the appendices.
Findings
Phase 1
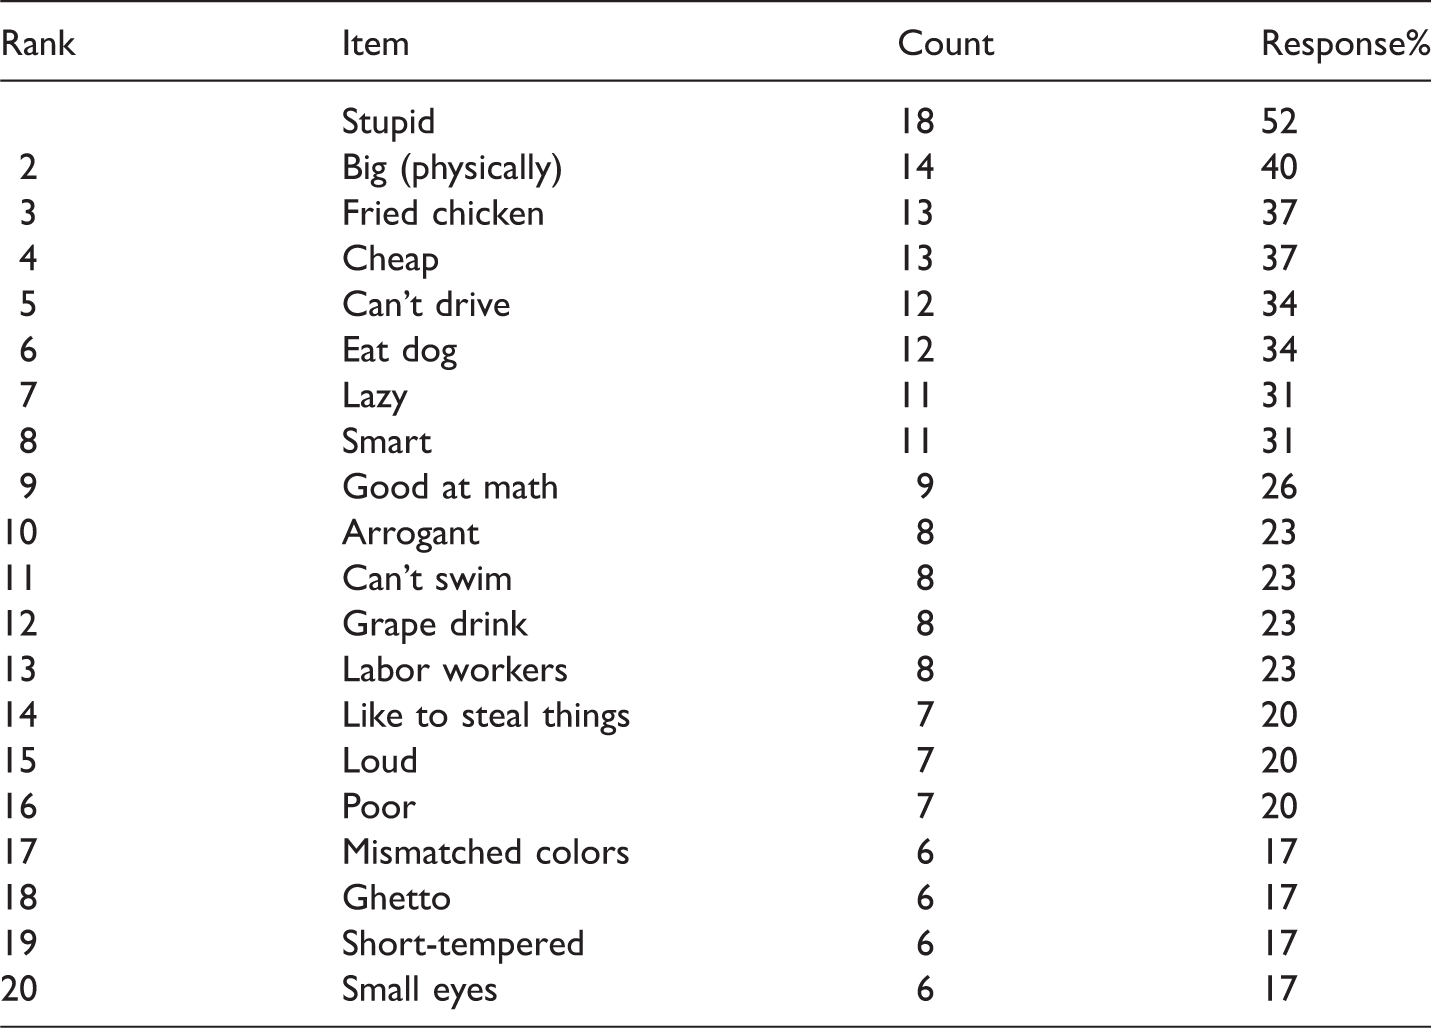
As noted above, the freelist data collection produced 474 different stereotypes, which was reduced into 174 various stereotypes after coding for synonyms (see Appendix A). On average, each student listed between 13–14 stereotypes. The top 20 frequently recalled stereotypes had a frequency of 6 or more and were chosen as the items to be ranked and sorted in Phase 2. We selected the top 20 items because more than five students recalled each item (i.e., the items were salient). In other cases, selecting the items that are most salient may be difficult to observe in the frequency table. A frequency graph (see Appendix B) can then be applied by examining the break or elbow in the data, indicating items listed by many respondents and items listed by few respondents.
Top twenty salient stereotypes in freelist.
Phase 2
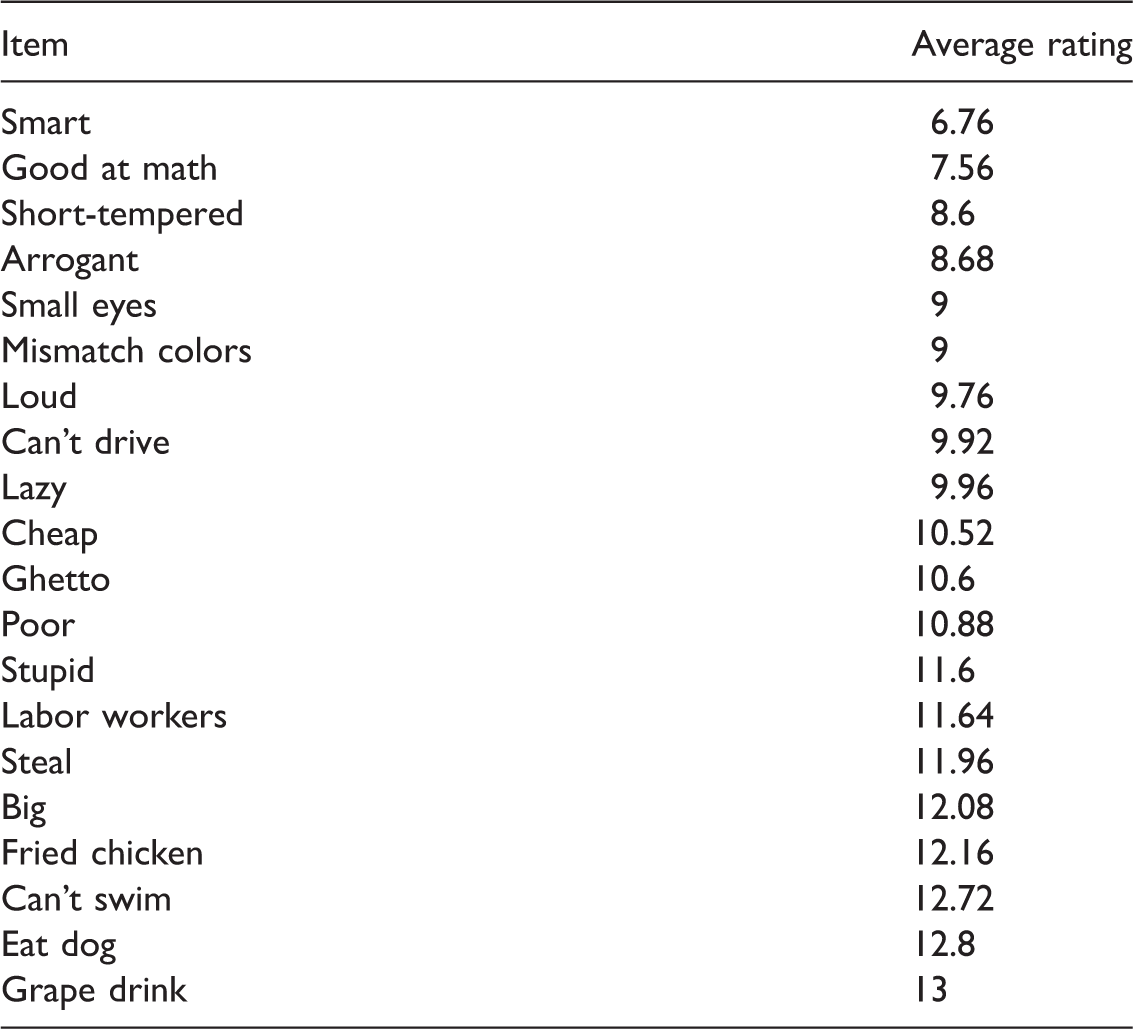
Rank order average ratings.
The rank order explanations allowed us to examine students’ ranking process and rationales of why they ranked the stereotypes in the ways they did (see Appendix C). Students justified their orders based on continuums they perceived as appropriate for the given stereotypes. Continuums provided a basis to describe opposing stereotypes at each end. For example, many students ranked stereotypes based on the criteria of ‘good/privileged/high SES’ to ‘bad/underprivileged/low SES’, ‘desirable/most valuable traits’ to ‘undesirable/least valuable traits’, and ‘least offensive’ to ‘most offensive’. A couple of students based their rank order on self-relevance or personal experience. For example, one student ranked the stereotypes according to what was most relevant to her or had been said about her, to what was least relevant to her or had not been said about her. Another student used the criteria of stereotypes that related to people he knew to stereotypes that did not relate to people he knew. Other students explicitly used race and ethnicity to order their stereotypes (e.g., Whites being the highest → Asian → Portuguese → Hawaiian → Filipino → Black being the lowest).
To illustrate candidly how students developed their rank ordering methods the ‘Item example of ranking order’ column was created alongside their explanations. For each student’s rank order method, six stereotypes are provided. They include the stereotypes ranked in the following positions: 1st, 2nd, 10th, 11th, 19th, and 20th (i.e., two items on one end of the continuum, two items in the middle, and two items on the opposite end of the continuum). In general, the middle stereotypes (items in the 10th and 11th positions) tended to vary between students. The stereotypes listed at opposite ends, however, were recurring and similar between students. Stereotypes listed in either the 1st or 2nd position included smart (11), good at math (11), arrogant (4), and small eyes (3). Stereotypes listed in either the 19th or 20th position include stupid (6), steal (5), eat dog (5), poor (5), fried chicken (3), and grape drink (3).
The similarity metric table (see Appendix D) provided proximity calculations (range = 0–1) of how close or far apart students grouped the stereotypes when sorting them into piles. Items placed further away from each other (i.e., separate piles) have a proximity calculation closer to 0. Items placed closer together (i.e., same pile) have a proximity calculation closer to 1. In the table, calculations shown with light shading, indicate items with proximities over 0.5 or 50%. For example, students perceived small eyes and smart as associated with each other (0.64 or 64%). Calculations shown in solid-line cells indicate items with proximities over 0.7 or 70%. These were stereotypes students perceived as having the strongest associations to each other and include small eyes and good at math (0.72 or 72%), small eyes and cannot drive (0.72 or 72%), grape drink and big (0.76 or 76%), good at math and smart (0.72 or 72%), good at math and cannot drive (0.8 or 80%), and stupid and big (0.8 or 80%).
The cluster analyses, which are visual representations of the similarity metric table, demonstrate the perceived similarities of stereotypes by 2 clusters, 3 clusters, and 4 clusters. The 2-cluster graph (see Appendix E) revealed the following stereotypes clustered together in the left cluster: big, grape drink, steal, ghetto, poor, lazy, stupid, fried chicken, and cheap. The right cluster included loud, short-tempered, arrogant, cannot swim, labor workers, mismatched colors (in reference to clothing style), eat dog, smart, small eyes, cannot drive, and good at math. A re-run of the analysis to sort similarities by 3 clusters (see Appendix F) kept the left and right clusters from the 2-cluster graph and formed a new third cluster at the bottom middle including labor workers, mismatched colors, and eat dog. The 4-cluster graph (see Appendix G) kept all clusters from the 3-cluster graph and formed a new fourth cluster on the far left including big and grape drink.
When asked how they sorted the stereotypes into piles, students’ explanations were based on either associations to racial and ethnic groups or associations to attributes (see Appendix H). For example, one student sorted smart, good at math and small eyes into a pile and ascribed the pile to Chinese people. Another student sorted the same stereotypes together but explained that these stereotypes described people who were active in school. The stereotypes are provided in the table in Appendix H based on their average rating to help display patterns in students’ sense-making processes. In general, stereotypes with higher average ratings were typically ascribed to either Asian ethnic groups or as having positive attributes (e.g., active in school, proactive lifestyle, privileged/good people, characteristics of people who get things done). Caucasian or White people were mentioned once in relation to the arrogant stereotype. Short-tempered showed variety in rationales, as did mismatched colors, loud, and cheap. Lazy, poor, labor workers, steal, big, fried chicken, can’t swim, eat dog, and grape drink were associated with African American, Hawaiian, Micronesian, Latino/a, and Filipino groups. Negative attributes ascribed to the same stereotypes included ‘people on food stamps’, ‘cheap people’, ‘lazy’, ‘definitely not Asian’, ‘underprivileged’, ‘poor’, and ‘characteristics of people who don’t get things done’.
In addition to the individual and group analyses of the cultural domain elicitation, we documented student responses and attitudes to participating in the general activity. Almost three-quarters of the students (72%) responded positively and were excited to participate. Common positive comments included ‘I’m racist’, ‘Can I list as many as I want’, ‘Can I help some more’, or ‘I’m already done? I want to continue’, and ‘This is awesome!’. Alternatively, the other 28% of students expressed a level of discomfort followed by hesitancy and sometimes a sense of shame for participating. Comments included ‘I feel so racist’, ‘I feel so racist, I feel so bad’, and ‘This is really bad, right?’.
Hierarchy acceptance
Conducting focus groups after the freelist, rank order and pile sort allowed us to explore further the contours of the cultural domain. Given the results from the freelist, we were curious about the prevalence of the use of stereo-typed based humor. As one student stated, … it’s everywhere in Hawai’i. It was acceptable back then because of the immigration when everyone lived together. There were no hard rules or laws so it was a comfortable way for everyone to tease each other. But it’s not like that anymore. It is a huge problem not to care.
These levels of acceptance and tolerance were captured in several comments from the participants. One student explained, Humor [in Hawai’i] is considered acceptable and not considered as racial slurs because we have historical relationships to one and other, in terms of the plantation days. So people don’t take it too personal. It’s a multicultural context so it’s a cultural norm that is accepted. The behavior is learned from [each] other and it becomes a bonding piece.
The latter notion of humor being acceptable because it is ‘learned’ was echoed in other students’ comments. Referring to Frank DeLima, a local comedian known for talking openly about racial and ethnic humor at public schools, one student noted, ‘… it’s okay to make fun of others because it’s taught in school’. Another student shared this sentiment: ‘Growing up, you see your own parents and friends laughing and joking. Of course I’m going to join along. I want to be an insider’. There were dissenting views among the focus group participants, but the dominant perspective was that stereotype-based humor was an acceptable fixture in the culture.
When asked during the focus groups to describe where racial and ethnic populations were socially ranked, students tended to share similar perceptions of the domain that were represented in the rank order and pile sort results: ‘At the bottom, it used to be Filipinos and now it’s the Micronesians and Samoans’; ‘Tongans, Micronesians, and Samoans are at the bottom for sure …’; ‘Japanese are somewhere high up because they live in wealthy communities and the Chinese, too, because they have high political power …’ When asked how populations were ranked, students corroborated with Labrador’s (2004) findings of social stratification being associated to immigration patterns: ‘Micronesians are the most recent ones to come in so they’re at the bottom’ and ‘Chinese and Japanese are at the top because they’re the rich immigrants – they already had more money than other groups’. Remarkably, students had varying perceptions of where Caucasians or ‘Haoles’, as they are referred to in Hawai’i, are placed on the ranking system and often elaborated to a more complex understanding in the construction of the term ‘Haole’. One student said, I don’t know where Haoles go’ cause there’s two types of Haoles I see. There’s the bad Haole, who illustrates ‘Whiteness’, has no respect, no humility, and is arrogant. Then there’s the good Haole who takes time to know people, who’s respectful with good intentions.
Another student hinted at other definitions of ‘Haole’, … for me, it’s descriptive and has many terms. Like, ‘non-Portugese Haole’ that refers more to how Haoles physically look. Then there’s ‘Hapa Haole’ and even ‘non-Haole’.
Indeed, Hawai’i’s historical overthrow of the Hawaiian Kingdom and subsequent immigration era continues to influence and facilitate the perceptions, meanings, and languages used to describe racial and ethnic groups in Hawai’i.
Although Phases 1 and 2 of the cultural domain elicitation techniques provided a way to understand some of the cruder aspects of the boundaries of the domain, the focus groups served to complicate some of the notions. In a multicultural society where hierarchy and privilege remain salient influences on daily life and, in this case, the educational experience, the compositional diversity does not equate to a healthy racial climate. The distance between the composition and climate is worthy of further study of social evolution, especially as populations continue to diversify.
Discussion
In studying the research question, ‘What characterizes racial/ethnic stereotype-based humor as a cultural domain among university students in Hawai’i?’ the results showed that students acknowledged more derogatory stereotypes for certain racial and ethnic populations. The hierarchy and dichotomy of their responses suggests that students align their understandings of local stereotypes, and ultimately local racial and ethnic humor, to the proposed conceptualization of the social stratification in Hawai’i.
The freelist data revealed several interesting findings. First, on average, each person recalled between 13–14 stereotypes. According to Gatewood (1984), the number of items recalled typically reflects an individuals’ familiarity with the domain. This suggests that students were quite familiar with stereotypes because they were able to list more than 10, corroborating the frequent local usage of racial and ethnic humor. Furthermore, most students were enthusiastic about participating in the study and completed the freelists within 1–2 minutes. Their enthusiasm and openness to participate, as well as the short amount of time students took to complete the interview, endorses further the cultural acceptance and tolerance of humor in Hawai’i.
Moreover, the variety of content within the stereotypes confirmed the holistic perspective of racial and ethnic humor and stereotypes as being associated with life style, physical and cultural characteristics, historical backgrounds, religious beliefs, social and economic conditions, places and purported attributes (Oshima, 2000). For example, students’ stereotypes described physical characteristics (e.g., big, small eyes, big noses, hairy), cultural characteristics (e.g., smart, lazy, obedient, quiet, dirty, talkative), social economic conditions (e.g., labor workers, poor, rich), food preferences (e.g., dog, grape drink, fried chicken, balut, horse), places (e.g., Waipahu, Pearl City), languages (e.g., speak pidgin, strong accents), and more. These are the implicit and explicit racial meanings humans ascribe to people in racial schematic thinking and thus, provide the content and foundation for which racial and ethnic humor and jokes develop.
The rank order data revealed an order corroborating the stratification of racial and ethnic groups in Hawai’i, especially in respect to the ‘skin tone’ measurement (Labrador, 2004). In the rank order analysis, lighter skin racial and ethnic groups (e.g., Caucasian and Asian groups, with the exception of Filipinos) who were further identified in the pile sort explanations, were associated with stereotypes having a higher average rating. Moreover, these ascribed stereotypes were represented in students’ rank order explanations on the ends of continuums containing the following: good qualities, desirable qualities, least offensive, most valuable, or Whites → Asian. Darker-skinned racial and ethnic groups (e.g., African Americans, Hawaiians, Micronesians, Latino/as, and Filipinos) were associated with stereotypes that had lower average ratings and were represented in the opposite end of students’ rank order explanations: bad qualities, undesirable qualities, most offensive, least valuable, African → Hawaiian, or Hawaiian → Filipino → Black.
The ‘skin tone’ classification was further evident in the pile sort analysis. The fact that students associated stereotypes according to one of two processes (i.e., racial and ethnic groups or attributes) implies that racial and ethnic groups are not only stratified and labeled by the given stereotype, but also are identified with other attributes that intend to describe their character. Although students who sorted the piles based on attributes did not openly express them being associated to any particular racial or ethnic group, when coupled with the results from students who sorted piles by racial and ethnic groups, the findings emphasize the racialized social hierarchy. Lighter skin populations were perceived as people associated with stereotypes such as smart, good at math, short-tempered, arrogant, and having small eyes, and ascribed attributes such as active in school, good people, privileged, having proactive lifestyles, and people who get things done. In contrast, the darker skin populations were perceived as people associated with stereotypes such as ghetto, stupid, poor, labor workers, people who steal, big, eat fried chicken and dog, and drink grape drinks, and ascribed attributes such as people on food stamps, cheap people, being negative, lazy, poor, underprivileged, ghetto, people who work on buildings and construction, and people who don’t do well. Evidently, Labrador’s (2004) notion of ‘negative stereotyping’ as a measure in the construction of the social hierarchy is supported in all the above. Indeed, when examining the degree of negativity within the stereotypes, those ascribed to darker skin racial and ethnic groups are categorized with much more derogatory stereotypes versus those ascribed to lighter skin groups (e.g., stupid vs. smart, lazy vs. good at math).
The similarity metric model and cluster analyses further sustain these perceptions of the dichotomization of ‘light skin’ and ‘dark skin’ populations. The 2-cluster graph represented stereotypes students associated to African Americans, Hawaiians, Micronesians, and Filipinos, such as big, grape drink, ghetto, steal, and poor in the left cluster. This cluster contrasts with the right cluster, in which smart, small eyes, cannot drive, and short-tempered were generally perceived as being associated to Asians. In the similarity metric model, some of the stereotypes within the left and right clusters had proximities over 70% (e.g., lazy and stupid, good at math and small eyes). The stereotypes centered within the middle intersection of both clusters were attributed to various racial and ethnic groups. When the third cluster analysis was calculated, the new cluster included stereotypes associated to Filipinos (i.e., labor workers, mismatched colors, and eat dog). The fourth cluster in the 4-cluster graph included stereotypes associated with African Americans (i.e., big and grape drink). This suggests that students share a common perception of African Americans and Filipinos that is defined by particular stereotypes and ascribed characteristics. Regarding the latter group, this may support the unfair burden Filipinos have with exposure to negative stereotyping (Revilla, 1996; Okamura and Labrador, 1996; Quemuel, 1996).
Lastly, the remarks and reactions of students imply that students are willing and eager to engage in discussions involving race, ethnicity, and stereotypes. In fact, students may even enjoy such conversations. This supports Kang’s (2005) noted importance of universities as public spaces for vicarious conversations in which racial and ethnic joking develops and occurs. Although a few students displayed or reported feelings of guilt or emotional conflict they did, however, express an interest in the project and hopefulness that the results may help to address social issues of race and stereotyping.
Conclusion
A pattern of stereotypes is not neutral. It is not merely a way of substituting order for the great blooming, buzzing confusion of reality. It is not merely a short cut. It is all these things and something more. It is the guarantee of our self-respect; it is the project upon the world of our own sense of our own value, our own position and our own rights. The stereotypes are therefore, highly charged with the in feelings that are attached to them. They are the fortress of our tradition, and behind its defenses we can continue to feel ourselves safe in the position we occupy. (Lippman, 1922: 96)
Overall, students’ perceptions of local stereotypes and humor were distinctively defined and classified on the basis of skin tone: ‘light skin’ racial and ethnic groups versus ‘dark skin’ racial and ethnic groups. Furthermore, derogatory and negative stereotypes were associated with dark skin populations. Light skin racial and ethnic groups include Caucasians, Chinese, Japanese and Koreans; dark skin racial and ethnic groups include African Americans, Filipinos, Hawaiians, Micronesians and Latino/as. Accordingly, given that racial hierarchy is evident within the stereotypes, which are embedded within humor, it is likely that humor is used as a means of promoting the hierarchy.
Two major implications can be derived from this study. First, there are potential consequences for those racial and ethnic groups located on the lower end of the hierarchy; or those, as the data reveal, with darker skin. From this study, African American, Hawaiian, Micronesian, Filipino and Latino/as students were characterized by derogatory attributes that, as noted earlier, could influence identity development and formation, health disparities and personal well-being, and perceptions of campus climate and culture, including the perceptions of institutional figures on campus. With regard to academic performance, stereotype threat is a tangible risk. It is important that universities provide programs for students who may be victimized by such stereotypes and offer on-going support that reduces negative stereotypes and emphasizes positive stereotypes. Those who work directly with students, such as faculty, academic advisors, or student affairs professionals, have the opportunities to make contact with students, to lend direct support and assistance. Student organizations can also become vehicles for fostering a sense of pride in one’s culture and heritage and, as a result, promoting development of a healthy identity and well-being.
The architecture of the cultural domain reveals that students were aware of the stereotypes and share common perceptions of the racial and ethnic populations to which they were ascribed. In this study, 35 students generated 474 stereotypes, suggesting a strong familiarity with stereotypes. Although we did not seek to understand how or where students learned stereotypes, college campuses – as Kang (2005) suggested – are a common location where racial schema formation (i.e., stereotypes) develop. As such, institutions should be aware that they have a responsibility in their role as providers of space in which students form stereotypes and share, discuss, and/or perpetuate them. Institutions should create, instill and nurture campus cultures and environments that work to reduce negative stereotypes. Institutions should afford safe spaces, such as courses, curricula, programs and campus events that invite students to discuss stereotypes and become aware of the messages such stereotypes send. Institutions should also be aware and sensitive to the messages sent through the campus environment and culture itself; for example, through the types of programs and events offered (or not offered), visual imagery on campus (e.g., articles or stories written in the school paper, images in fliers around campus, etc.), or faculty racial and ethnic representation.
It is important to note that because this study was conducted at a location that encompasses a unique cultural blend of races and ethnicities, and embraces racial and ethnic humor, the results of this study, were it to be replicated elsewhere, would probably yield different responses. For example, during Phase 2, one student commented, ‘It would Mexicans on the mainland, but here I heard it’s the Hawaiians’. This suggests that a similar hierarchy (light skin to dark skin populations) may exist but stratifies different racial and ethnic groups.
As colleges continue to work towards diverse learning environments, humor is probably one of the more complex areas to address, especially in a place such as Hawai’i. Humor and stereotypes continue to perpetuate a ranking even in an educational environment that is typically liberalizing and raises students’ consciousness. Future research, which might involve a content analysis that examines fliers, campus events and forms of media on campus (e.g., local radio station, newspaper), and identifies stereotypes and local humor, would contribute to understanding students’ perceptions and the role of the institution in developing stereotypes
Lippman noted, ‘a pattern of a stereotypes is not neutral’ (Lippman, 1922: 96). Stereotypes are filled with learned and formed assumptions, beliefs and values that humans project upon others and use to form defense mechanisms in order to generate a sense of security and safety. Similarly, humor, although a form of communication generally intended in good nature and resulting in Laugher, may function as a defense mechanism given the number of stereotypes embedded within jokes. However, by participating in the laughter, underlying forms of racism derived from negative stereotypes may be ignored and thereby perpetuated further. As one student in our study eloquently stated, … it’s a huge problem because racial and ethnic humor normalizes stereotypes. All of a sudden, you can’t look at other people for who they are because you can’t see past the stereotype. That’s a huge consequence I don’t think people are aware of.
Because institutions incubate the perpetuation of cultural domains such as stereotype-based humor, they are also responsible for generating a greater awareness of stereotypes and racism.