
Abstract
Bubbly flow in U-bend is widely encountered in two-phase flow systems because of its compactness and high heat transfer coefficient. The modeling of phase distributions, velocity fields, and interfacial area concentration in the U-bend is crucial for the analysis of mass, momentum, and energy transportation processes in the equipment. However, this subject has not received enough attention yet. In this paper, the combination of population balance model and two-fluid model was used in the simulation of air–water bubbly flow in a U-bend with 24 mm inner diameter and 96 mm curvature. The homogeneous multiple size group model was used to solve the population balance equation and reconstruct the bubble size distribution function. The phase distribution at 0°, 90°, and 180° was predicted and the results showed that the superficial velocities of gas and liquid phase were the control parameters. Under higher gas superficial velocity, the buoyant force is dominant and makes the bubbles concentrate on the outer side of the tube wall; while under lower gas superficial velocity, the centrifugal force is dominant and makes the bubbles concentrate on the inner side of the tube wall. These results met well with the experimental results of Usui.
Introduction
The vertical U-bend is widely used as the basic heat transfer elements of heat exchanger, boiler, steam generator, and evaporator, in the plant of chemical, energy, and nuclear industries, because of its compactness and high efficiency. Frequently, to achieve high heat transfer coefficient, the equipment are designed to work in subcooled boiling region and the flow behaves as a bubbly flow. Under such flow condition the behavior of bubbles influences the local heat and mass transfer processes significantly. It is necessary to conduct accurate predictions of the flow characteristics of bubbly flow in the vertical U-tube to improve the economic efficiency and safety of the plant.
The numerical studies of bubbly flow were mainly concentrated on vertical or horizontal straight tubes.1,2 In straight tubes the movement of bubbles was primarily influenced by the gravity force, which controls the gas–liquid relative velocity (for vertical tube) or phase distribution (for horizontal tube). Nevertheless, in the vertical U-bend the centrifugal force is exerted on the fluids in the direction perpendicular to the velocity and influences the phase distribution dramatically. Under the coaction of gravity and centrifugal force, the flow phenomenon becomes very complicated, which increases the difficulty in modeling bubbly flow in vertical U-bend in comparison with straight flow.
Several experimental studies were performed on the gas–liquid bubbly flow in the U-bend. Usui et al.3,4 investigated the transition of flow patterns in an invert U-bend with tube diameter of 16 and 24 mm and curvature of the bend of 90–180 mm. They also measured the phase distributions of different cross section in bubbly flow and annular flow region using an electrical conductivity probe. Based on the experimental results the authors discussed the influence of gravity and centrifugal force on the phase distribution. Hoang and Davis 5 measured the void fraction, local gas velocity, and bubble size along an inverted U-bend with tube diameter of 50.8 mm and bend curvature of 50.8 and 76.2 mm. Arlindo and Franca 6 performed both experimental and numerical analysis on the air–water bubbly flow in a U-bend with square cross section. The phenomena like the wall peaking, happening in vertical upward flows; the core peaking, taking place in downward flows; and the action of the centrifugal force, setting the phase distribution along the bend were measured. Meng et al. 7 visually observed the flow boiling and two-phase flow in U-bend of a vertical downward hairpin tube with inner diameter of 6 mm. The bubble dynamical behavior was divided into four zones based on flow pattern and bubble size. The phase distribution in the U-bend was not tested directly in the experiments.
Few numerical simulations were carried out for the bubbly flow inside a U-bend. Wu et al. 8 simulated refrigerant flow boiling in a serpentine round tube using Eulerian two-fluid model and a phase-change model for the mass transfer. In the simulation the orientation of the U-bend was horizontal and the phase distribution was not confirmed by the test. Arlindo and Franca 6 performed numerical simulation using two-fluid model and interphase momentum transfer correlations. The numerical results of phase distribution met well with the experiments but the bubble diameter was an input to the numerical model based on the test results instead of computational results.
In recent years, in order to predict the bubble size distribution (BSD) and avoid arbitrary mean bubble diameter input, the population balance method was introduced and applied to simulation of bubbly flow in various channels. In this approach the bubble’s characteristics, such as size, surface area, composition, and so forth, are treated as “internal” coordinate. The bubble numbers of each coordinate were controlled by the bubble birth or death mechanisms caused by bubble coalescence and breakage, and described by the population balance equation (PBE). By solving PBE the BSD can be traced automatically. Ekambara et al., 9 Li et al., 10 Yeoh et al., 1 and Yeoh and Tu 2 have adopted this approach to investigate the internal phase distribution of bubbly flow in vertical or horizontal straight tubes.
In this paper we focus on the prediction of the phase distribution and phase velocities in a vertical U-bend using the population method and two-fluid model. The homogeneous multiple size group (MUSIG) model, introduced by Lo and Zhang, 11 was used to solve the PBE and reconstruct the BSD function. The continuous BSD function was approximated by a set of discrete size fractions; the mass conservation of each size fraction is balanced by the interfraction mass transfer due to the mechanisms of bubble–bubble interactions due to coalescence and breakage processes. The phase distributions at different positions along the bend were calculated; the numerical results met well with the test results of Usui et al. 3 This means the population method can offer a powerful approach to describe the bubbly flow in a U-bend. Based on simulation results of phase distribution characteristics under different superficial velocities, the influences of centrifugal force and gravity force were discussed.
Numerical models
Two-fluid model
The two-fluid model considers gas phase and liquid phase separately and is expressed in terms of two sets of conservation equations governing the balance of mass, momentum, and energy in each phase. For isothermal two-phase flow, the energy equation should be eliminated, hence the control equations can be written as:
Continuity equation of liquid phase

Continuity equation of gas phase

Momentum equation of liquid phase
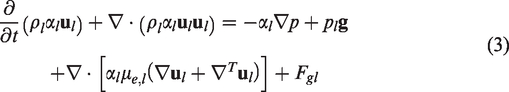
Momentum equation of gas phase

The drag force is induced by the relative movement between the phases and has the same direction with relative velocity, which can be obtained by Ishii and Zuber model

Lift force is relative to the vorticity field and directed perpendicular to the relative velocity of the phases. In this paper the lift force was calculated by Tomiyama model

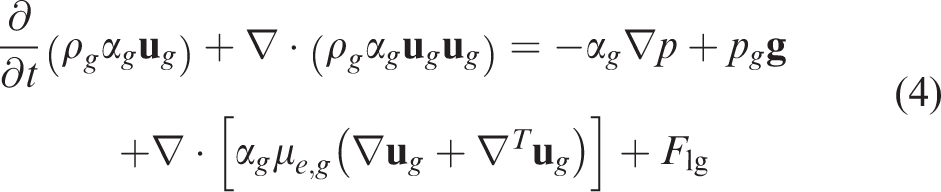
Wall lubrication force reflects the influence of surface tension of the tube wall, which exerts on the bubbles in the direction pointing to the tube axis. The correlation proposed by Frank was adopted in this paper

Turbulent dispersion force is induced by turbulent flow and has the effect to decrease the void fraction gradient. The correlation proposed by Lopez de Bertodano was adopted

Population balance method
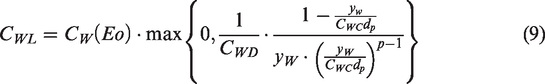
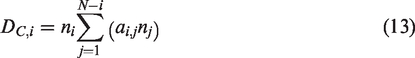
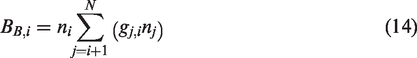
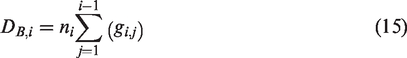
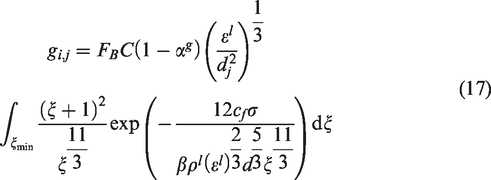
For bubbly flow, the mass, momentum, and energy transportations between the phases were heavily affected by the area concentrations or bubble size, as shown by equation (10). Therefore, it is crucial to predict the local BSD accurately for a successful modeling of bubbly flow. This goal can be accomplished by the population balance method through solving the control equation of particle size distribution (PSD) function. In this paper the MUSIG model was adopted. As one kind of population balance method, MUSIG model approximates the continuous PSD with a series number of discrete bubble size classes. For each class a scalar PSD equation is solved to obtain the population changes caused by bubble coalescence and breakage. For ith class the bubble’s PSD is described by


Numerical details
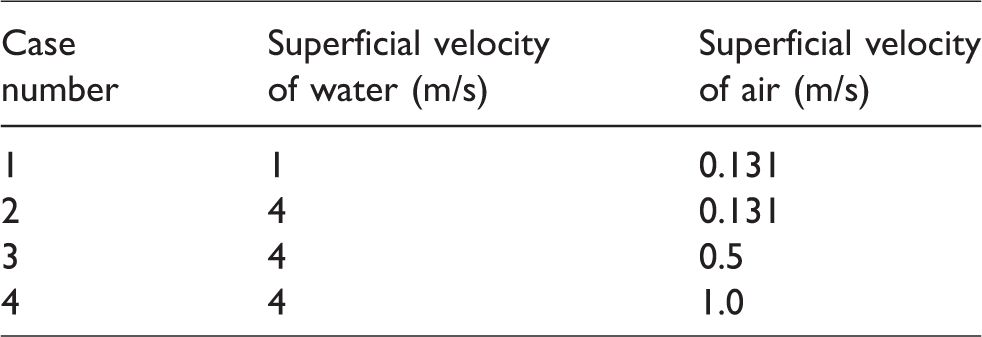
The parameters of the inverted U-bend analyzed in this paper are illustrated in Figure 1. The U-bend was invertedly placed and the mixture of air and water flows upward toward the bend, then, after passing the bend, flows downward toward the outlet. The inside diameter of the tube is 24 mm, while the radius of curvature is 96 mm. The lengths of the straight part at the inlet and outlet of the bend were set to be 1 and 0.3 m, respectively, to get fully developed flow status and prevent reverse flow. The working pressure and temperature of the fluids are 1 atm and 25°C, respectively. Fully dispersed bubbly flow only occurs under the conditions with large water superficial velocity and small air superficial velocity, according to the result of Usui et al.3 Therefore, the following cases were investigated in this paper (Table 1).
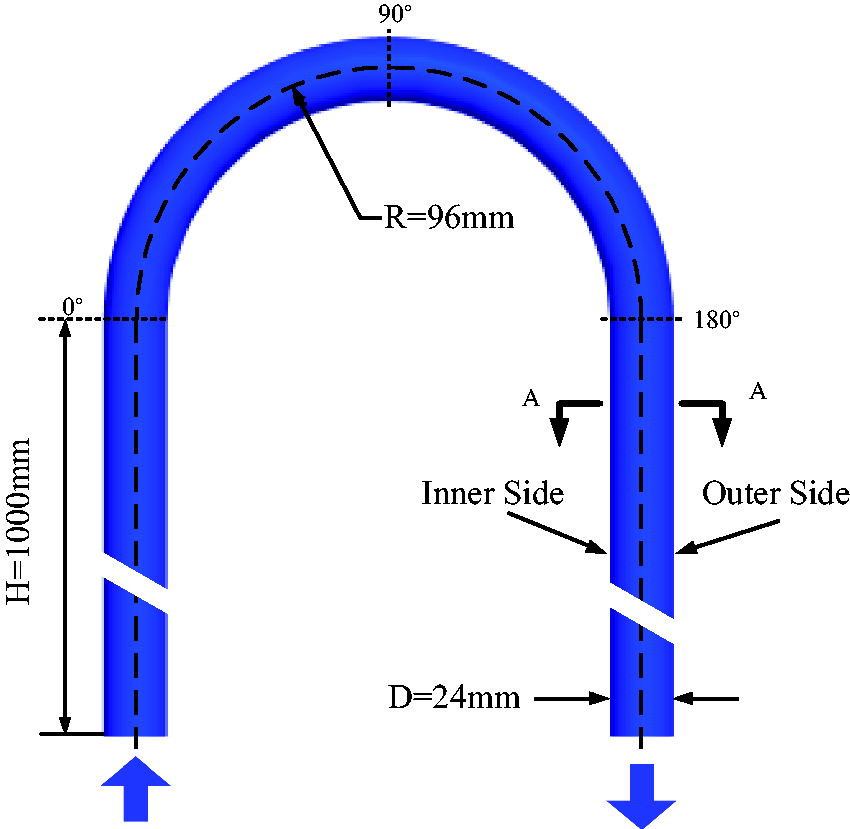
Structure of the inverted U-bend.
Parameters of test section.
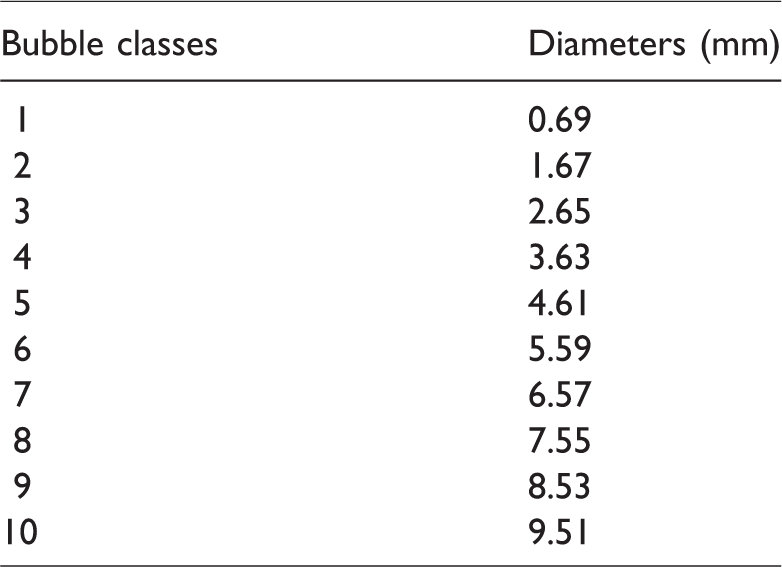
The mesh was generated by ICEM software, which has a total of 483,000 nodes, as shown in Figure 2. We have carried out mesh irrelevant study and found that a finer mesh cannot improve the calculation obviously and this mesh was used throughout the paper. Commercial CFD software CFX14 was used to perform numerical simulation. The k–e model and scalable wall function was adopted for the turbulence modeling. For two-phase flow simulation, the homogenous MUSIG model was adopted and treated the air phase as polydispersed fluid. The bubble size was dived into 10 classes, as shown in Table 2. The inlet boundary condition was selected as constant velocity condition for both water and air phase, while the outlet boundary was selected as constant pressure condition (zero relative pressure).
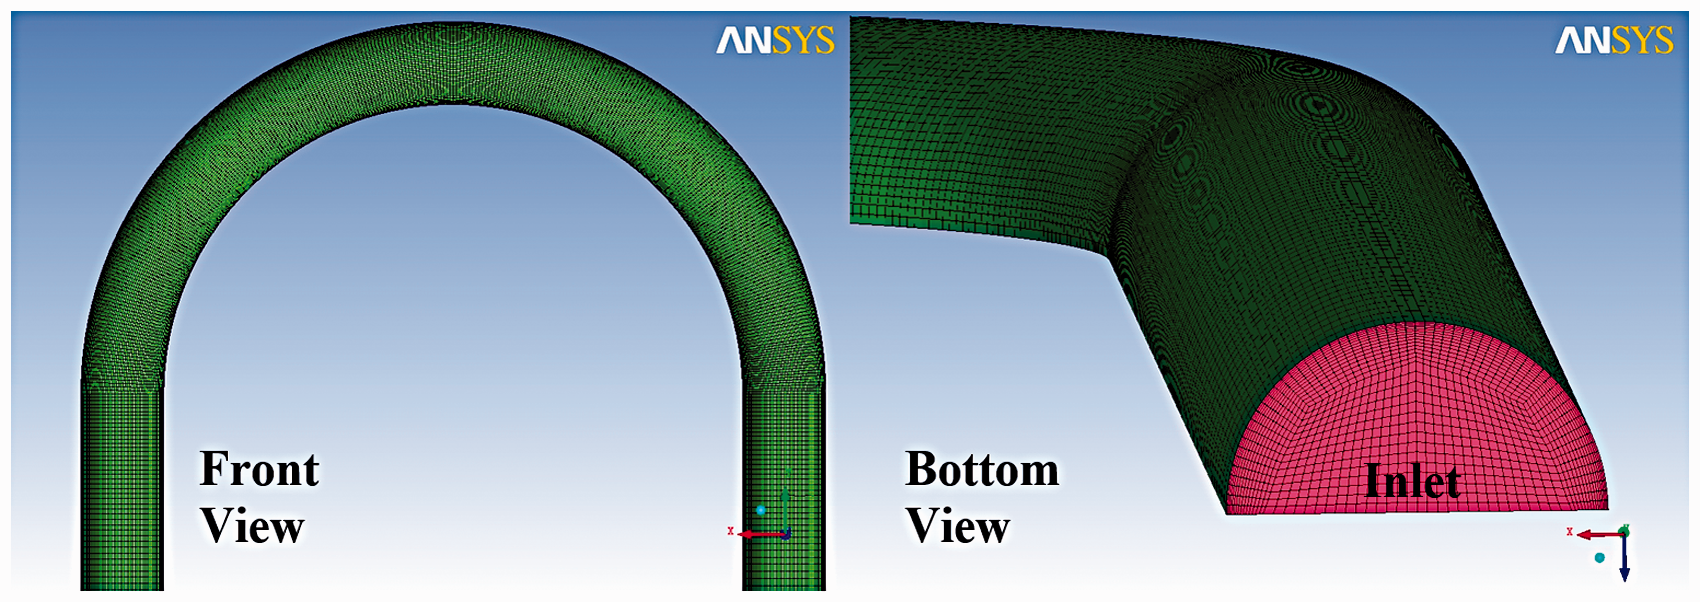
Mesh of the U-bend.
Bubble diameters of each bubble class.
Results and discussion
Sensitivity analysis of interphase momentum transfer model
As mentioned in “Numerical models” section, the prediction accuracy of the bubble behaviors and phase distribution characteristics was mainly affected by the model of interphase momentum transfer, including the model of drag force, lift force, wall lubrication force, turbulence dispersion force, etc. The Ishii Zuber drag force model was adopted for all the cases studied in this paper, for which has been proved to be the appropriate model for bubbly flow in round tubes by several authors. Wall lubrication force is the kind of force that tends to push the bubbles away from the wall, which is relevant to the mean diameter and surface tension between the two phases. In this paper three-wall lubrication force model was tested, that is the Antal model, Tomiyama model, and Frank model. To be convenient for the comparison, the void fractions, at sections of 0°, 90°, and 180° adopted these three models, respectively, are shown in Figure 3.
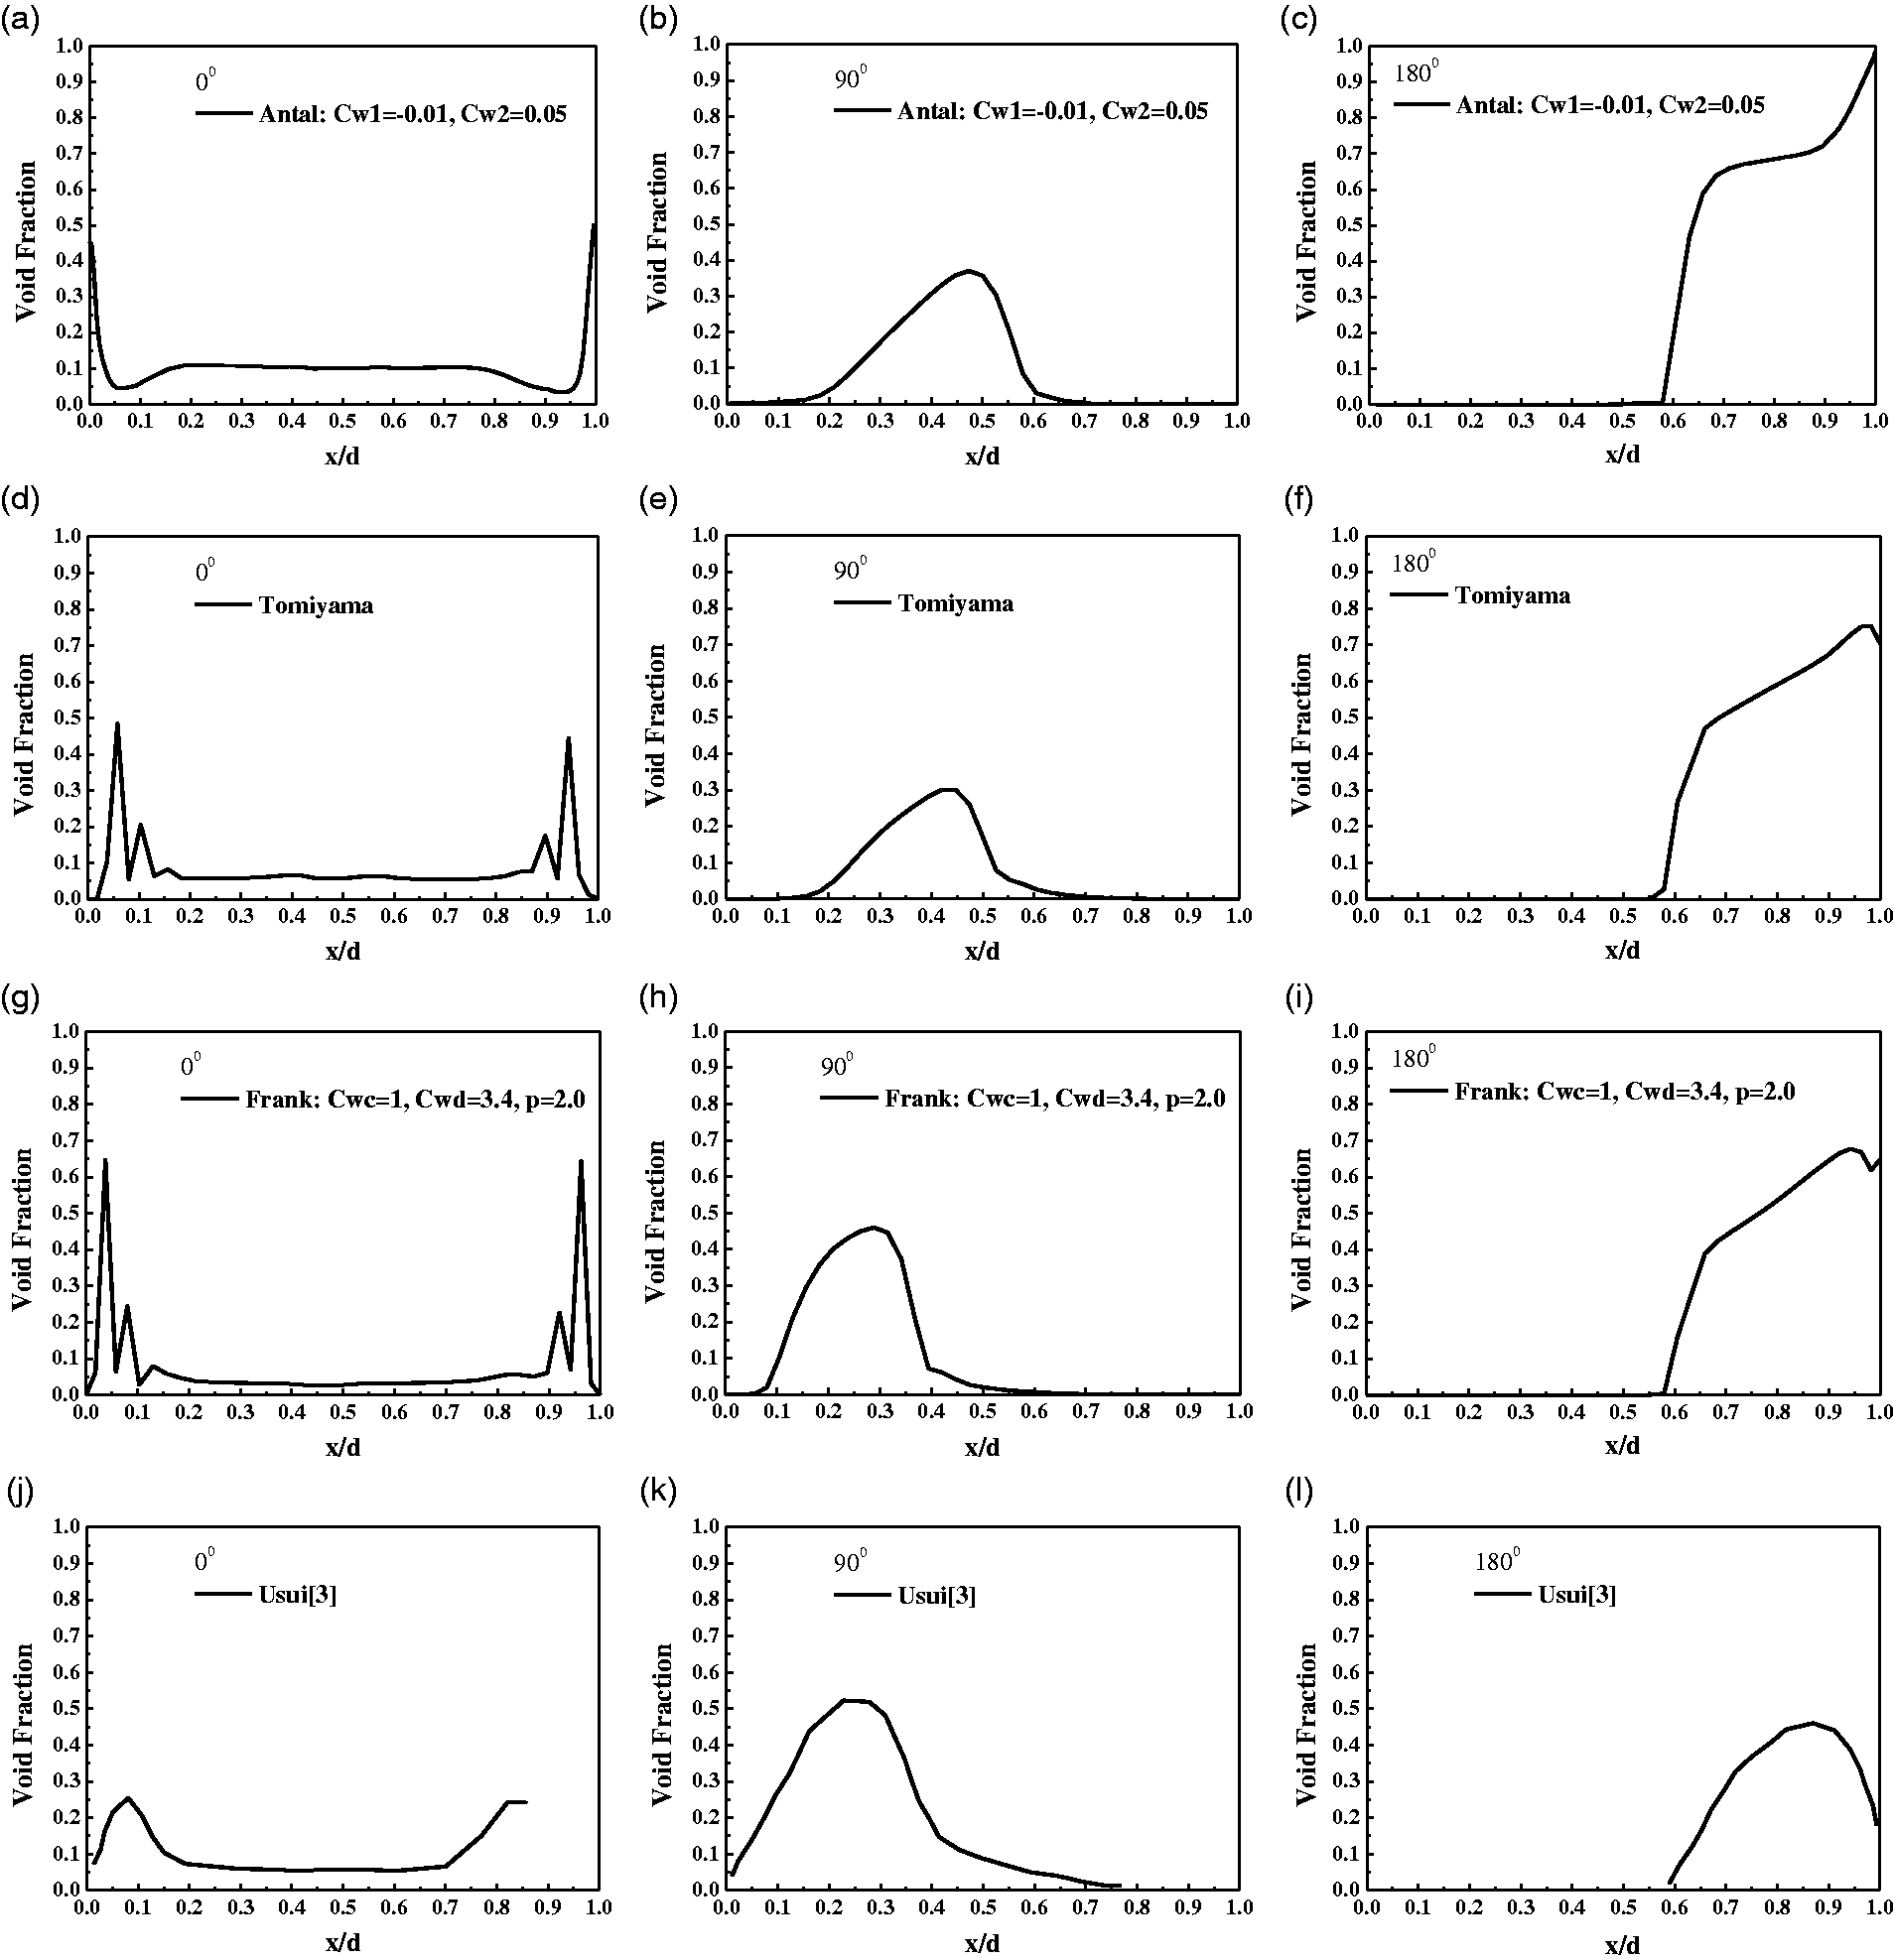
Comparison of different wall lubrication force model. (Vl=1 m/s, Vg=0.131 m/s). (a)-(c) Antal model; (d)-(f) Tomiyama model; (g)-(i) Frank model; (j)-(l) experiment data by Usui.
It can be seen that the Antal model predicts the void fraction profile of 0° section quite differently from the others because the peak of void fraction appears on the wall, while Tomiyama model and Frank model predict the peak being a distance away from the wall. This is the evidence that Antal model is not able to sufficiently counterbalance the Tomiyama lift force in the near-wall region. Meanwhile, the void fraction peak of 90° section predicted by Antal model and Tomiyama model was farther away from the inner wall of the bend than the experimental result and the simulation results by the other models, which means the distance of the wall lubrication force being active is overestimated. Also the height of void fraction peak of 90° section is underestimated by Antal model and Tomiyama model. These results show that the Frank model may be a better choice to predict the void fraction distribution in the entire region of the U-bend.
Void distribution characteristics under different flow conditions
The local void distribution profile in the cross sections of the U-bend changes continuously with the proceeding of the fluid, as shown in Figure 4. In the straight tube before the inlet, the bubbles concentrate in the narrow region near the wall but do not attach to the wall, which makes the profile to be symmetric about the axis of the tube and similar to that of upward bubbly flow in straight tubes. However, after entrance to the bend, the buoyancy force and centrifugal force began to be active. For the cases with higher liquid superficial velocity (Figure 4(a) to (c)) the centrifugal force makes the liquid flow along the outer side wall and drives the bubbles to move toward the inner wall. A single peak was formed finally in the 90° section, which is attached to the wall closely. This means that in these cases the centrifugal force is too large to be counterbalanced by the buoyancy force and wall lubrication force. After 90° section, the single peak began to leave the inner wall and separate into two peaks. However, the mechanism of this process is still not very clear and needs to be studied further. For the case with lower liquid superficial velocity, the buoyancy force will be dominant and keeps the bubbles flow away from the inner wall, as shown in Figure 4(d).
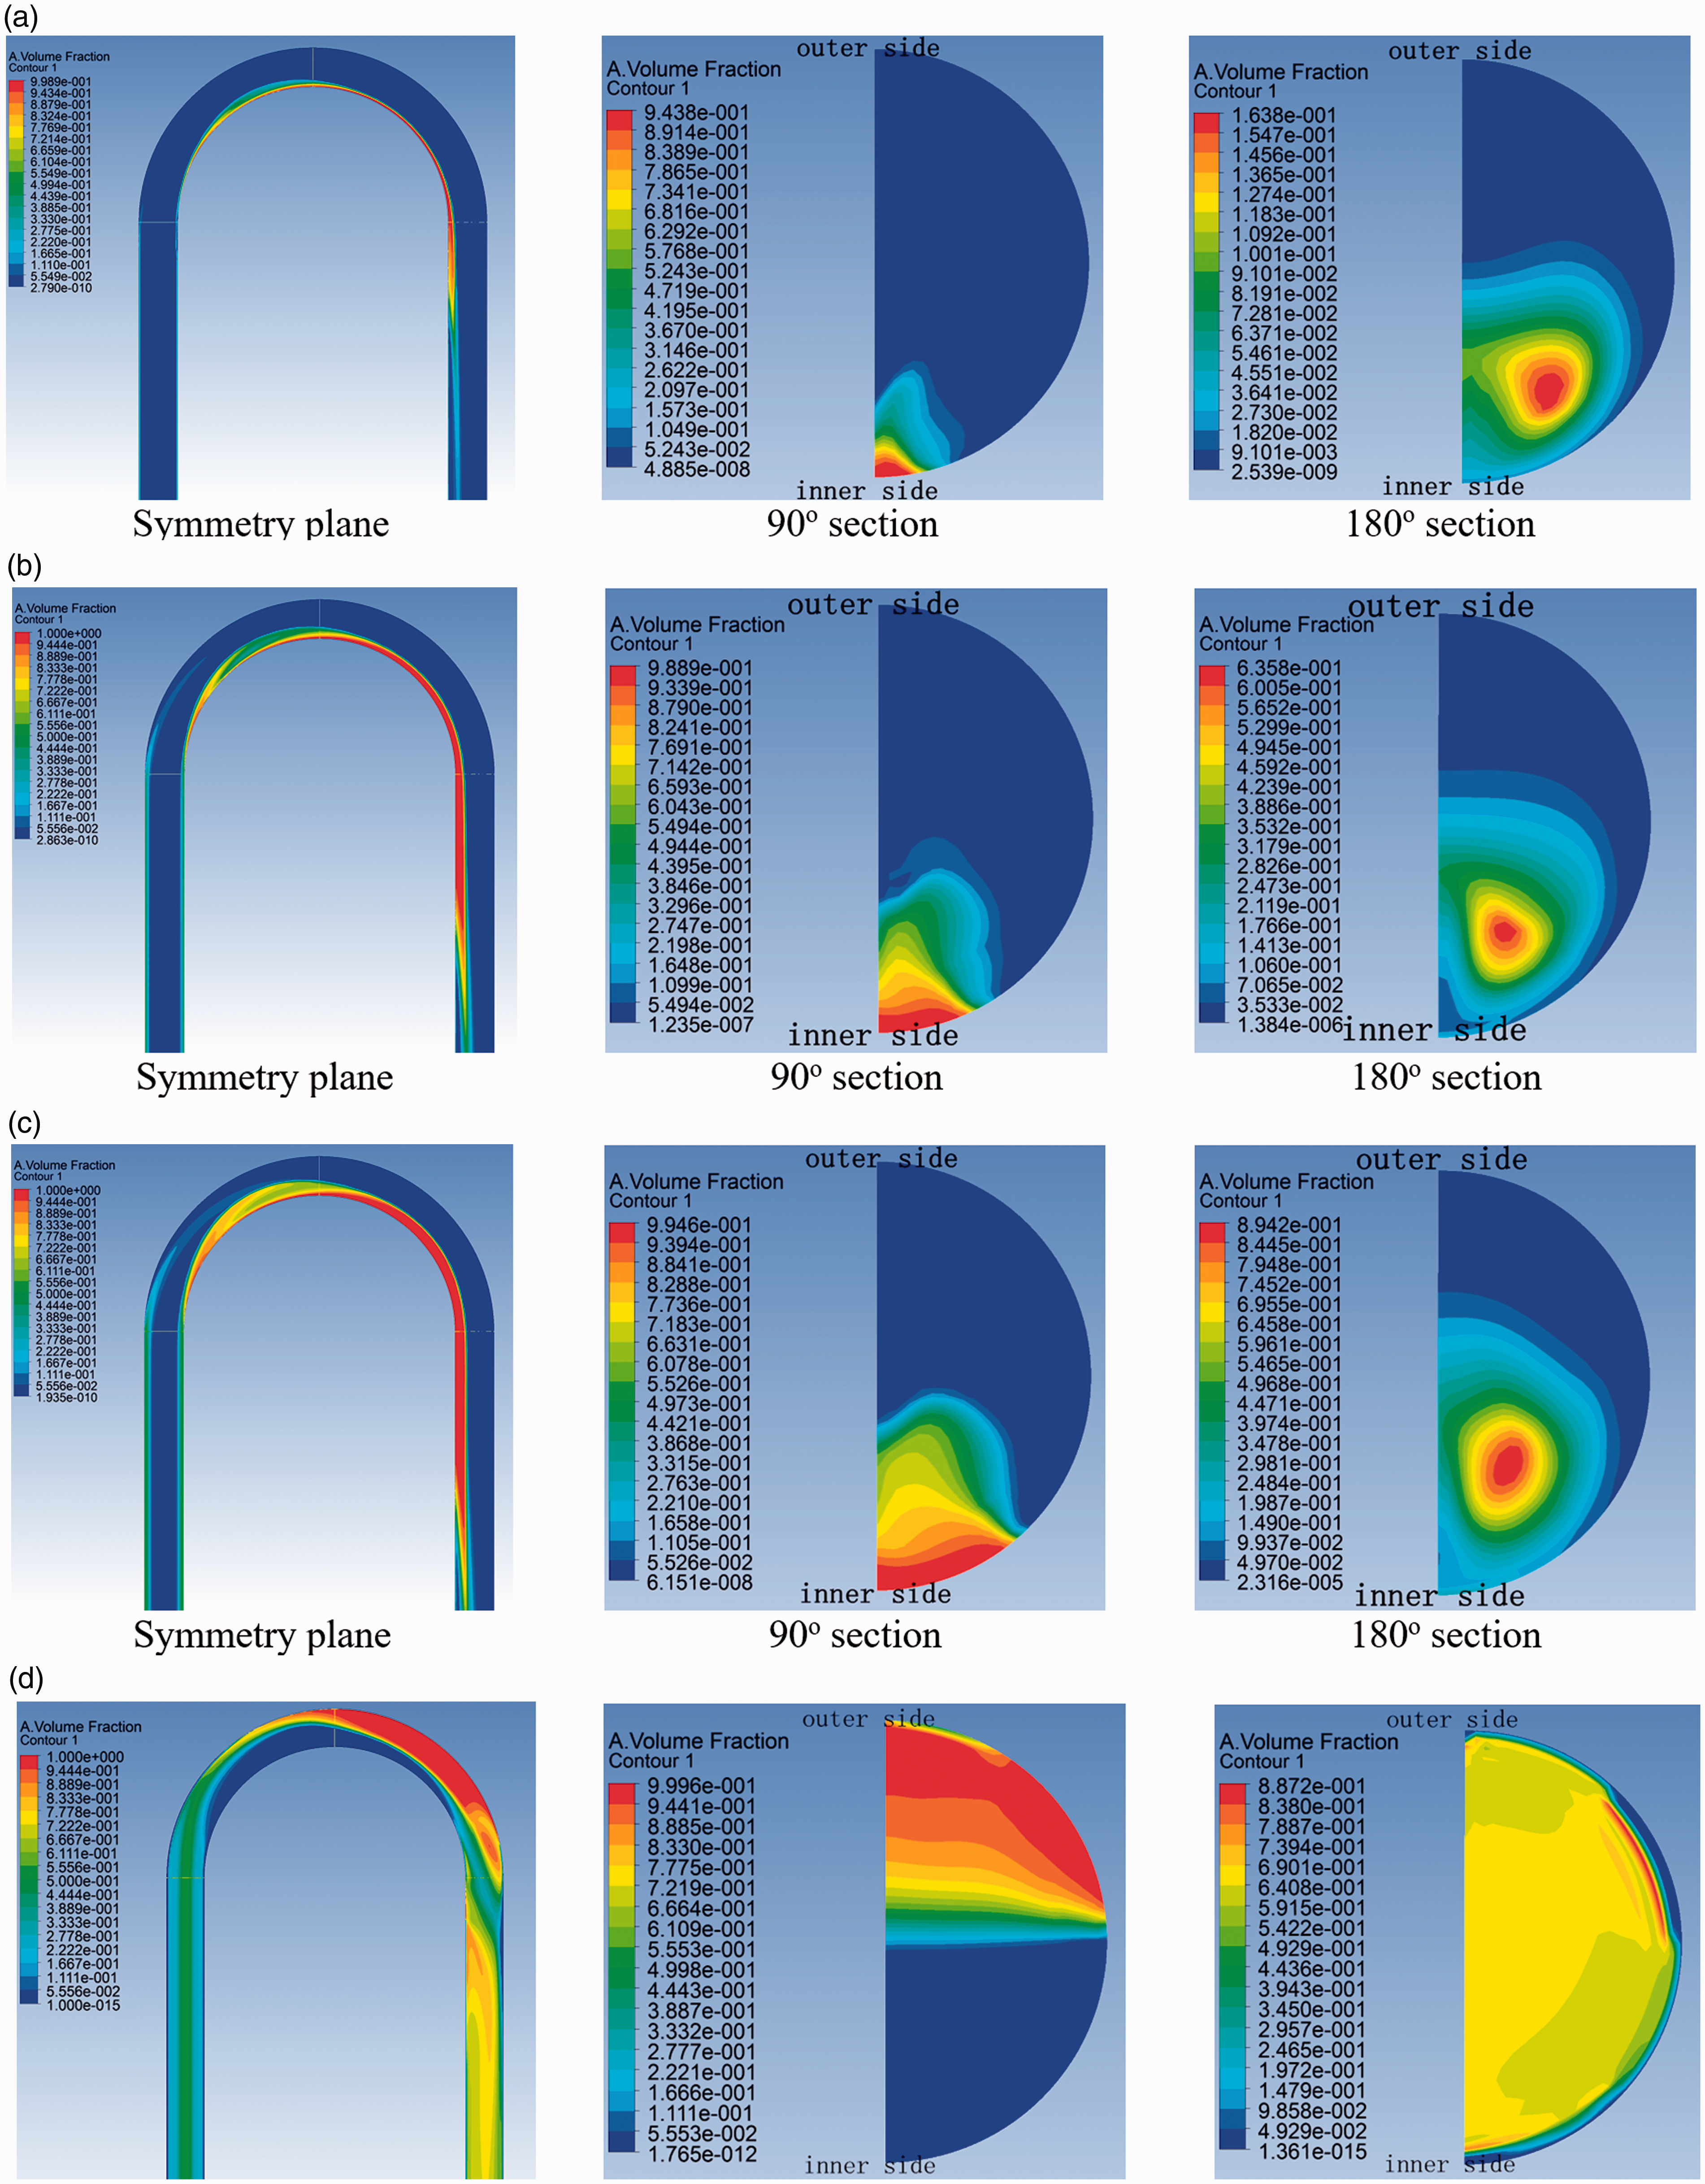
Void distributions in symmetry plane, 90° section, and 180° section under different flow conditions. ((a) Vl=4 m/s, Vg=0.131 m/s; (b) Vl=4 m/s, Vg=0.5 m/s; (c) Vl=4 m/s, Vg=0.5 m/s; and (d) Vl=4 m/s, Vg=1.0 m/s.)
The void fraction distribution moves away from the inner wall with the increase of water superficial velocity and the decrease of air superficial velocity, because of the increase of the centrifugal force. Also the traces of the bubbles leaving the outer side wall to the inner side wall at the inlet of U-bend, and that of the bubbles attaching the inner wall, were both enlarged with the increase of air superficial velocity.
Conclusions
In this paper the two-fluid model and population balance method were introduced into the simulation of adiabatic water/air bubbly two-phase flow. The interphase momentum transfer process is crucial to the bubble behavior and phase distribution. Through the comparison between simulation and experimental results, we found that Antal wall lubrication model is not able to counterbalance the Tomiyama lift force in the near-wall region. The Antal and Tomiyama model overestimated the active distance of wall lubrication force. However, the Frank model can get the results that meet the experimental results reasonably well if we choose the model parameters carefully. We also simulated the phased distributions under different flow conditions and find that under lower liquid superficial velocity, the buoyancy force is dominant which makes the bubbles concentrate on the outer side of the tube wall; while under higher liquid superficial velocity; the centrifugal force is dominant and makes the bubbles concentrate on the inner side of the tube wall.
Footnotes
Declaration of conflicting interests
The author(s) declared no potential conflicts of interest with respect to the research, authorship, and/or publication of this article.
Funding
The author(s) disclosed receipt of the following financial support for the research, authorship, and/or publication of this article: The authors gratefully acknowledge the supports from the National Natural Science Foundation of China (51306101), Tsinghua University Initiative Scientific Research Program (2012Z02145), Tsinghua University Laboratory Initiative Foundation (53101700116), and The Science Fund for Creative Research Groups of National Natural Science Foundation of China (51321002).