
Abstract
When airflow fly over trees, a shelter area will be generated at downstream area, and wind speed in the region will be reduced correspondingly. In order to analyze the windbreak performance of tree canopy, porous media method and additional source term are explored to simulate by computational fluid dynamics. Based on the given method, windbreak performance of trees with different canopy porosity, canopy shapes and distances between trees is investigated in detail, and characteristics of wind flow on the downstream of tree are shown. Results showed that small canopy porosity does not always mean good performance of windbreak, especially for the lower part. Canopy shapes only affect wind speed in the wake range. In these regions, windbreak performance of tree depends on the thickness of canopy. When distance is beyond 3H (H is the height of tree), wind speed becomes uniform at the downstream of tree and spacing can be equivalent to the porosity. But, for the region close to tree, trees with spacing cannot provide effective windshield. These simulations of tree canopy windbreak performance are conducted. All the results of the new model show better canopy flow characteristics through the field.
Introduction
Tree consists of trunk and canopy (generally referred to the part above the first main branch of the trees, including branches, leaves, and pores between the two above).When airflow is obstructed by trees in the flow process, a shelter area will be formed at its downstream, and wind speed of flow in the region will be reduced, then trees can play an effective role in wind resistance after reasonable arrangement and match. In recent years, environmental issues become increasingly prominent, and windbreak performance of the trees is drawing more and more attention and has been widely used in the field of wind resistance, 1 sand fixing, 2 local wind environment improvement, 3 and urban pollutants control. 4
When windbreak performance simulation of trees was carried by wind tunnel test, in addition to meeting the conditions of geometric similarity, some other indicators of the scale model such as the porosity, the equivalent hole hydraulic diameter, the local Reynolds, and so on also need to be controlled; Finding suitable materials for scaled tree model using in the wind tunnel tests has always been a difficulty of carrying out the study on windbreak performance of trees. In computational fluid dynamics (CFD), the obstruction of porous media to airflow can be simulated through correcting the momentum equation by introducing a specific momentum sink, and then the flow state after flowing through porous media can be obtained, this method is called additional source term method.5–8 Mochida learned from wind grid simulation method, 9 treated the tree canopy as porous media, followed the additional source term method, and used different momentum sink and turbulence model to simulate the canopy flow. Machida and Lun 10 also compared the flow field obtained by simulations carried out by the investigators above with the measured results, proved that the additional source term method can effectively simulate the windbreak performance of trees, and noted that the key of simulation is selecting the appropriate pressure loss term. As such ideas, Mochida et al. 11 simulated the effect of trees on the local wind environment of high-rise buildings with additional source term method. Buccolieri also established the trees model for analysis of urban pollutant dispersion using the additional source term method4,12 and treated a typical neighborhood in Bari as a case analysis. Endalew attempted to establish a more detailed model of trees, proposed establishing trunk and branches according to the real situation, only the leaves were modeled as porous regions, comparative analysis shows that this method is inefficient and gets a similar wake region wind field with the method described above. 13 The study showed that the additional source term method is an efficient way to simulate windbreak performance of trees.
This article makes canopy of tree equivalent to the porous media, uses the additional source term method to simulate windbreak performance of trees, analyzes the influence of parameters in detail, such as the porosity and the shape of canopy and the distance of trees.
Simulation method of windbreak performance of tree canopy
Introduction of turbulence simulation
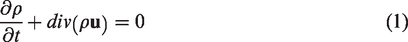
In the tree canopy CFD research, we usually ignore the changes in temperature and energy of airflow. Therefore, only continuity and momentum equations are considered. First, continuity equation is obtained by mass conservation conditions
Momentum equation was derived by Newton’s second law

Based on wind flow over tree canopy characteristics, mean velocity profile is the main concern quantity in this research. Therefore, Reynolds-averaged Navier–Stokes method is adopted here.
Steady time-averaged momentum equation can be written as

The last term
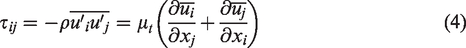
In order to make the governing equation close, the eddy viscosity assumption is introduced by Boussinesq
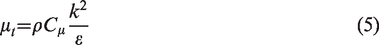
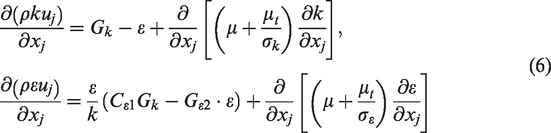
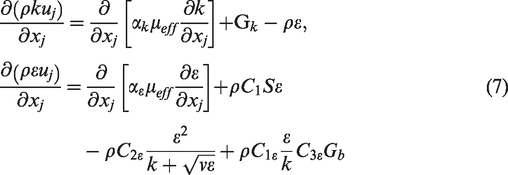
Some other turbulence models, such as renormalization group (RNG) and realizable models, are proposed to overcome the deficiencies of standard k–ε model. RNG model aims to describe the characteristics of multiscale turbulent motion. Realizable k–ε model makes the Cμ coefficient expression as a function of strain rate and rotation rate. Therefore, the new realizable model can consider the impact of the flow rate of deformation, and it is suitable for a wider airflow application, including spin uniform shear flow, jet and the mixed layer flow, a closed cavity flow and boundary layer flow, etc. In this paper, realizable k–ε model is adopted to simulate wind flow over tree canopy and the governing functions are expressed as
Based on the above introduction, the governing equations are listed as
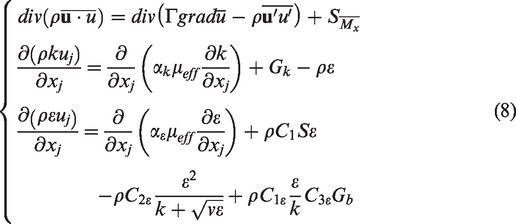
Fluent package 14 is adopted in this study to simulate flow over tree canopy, which is modeled as a source term in governing equation (8). The model will be given in the following section.
Tree canopy simulation
To realize the inertial resistance of the trees canopy in the simulation, the tree canopy is treated as a fluid volume where the porous zone is adopted. The value of the windbreak drag coefficient was determined from the wind tunnel test.
The porous media model can be used for a wide variety of single-phase and multiphase problems. For the windbreak flow simulation, the porous media model is applied and the pressure loss in the flow is determined as described in the momentum equations as follows

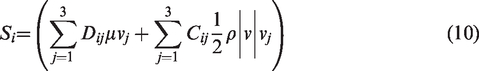
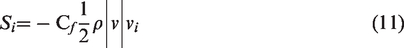

It is widely accepted about the formulas of pressure drop coefficient k and opening ratio φ of simple porous medias such as homogeneous sheet, etc. through a lot of trials, of which k = 1.04(1−φ2) φ2 raised by Reynolds is used commonly. For tree canopy flow, leaf area density a and resistance coefficient Cdf of canopy can be defined as Cf= Cdf ·α.
After the air flowing through the canopy, turbulence profile will be changed, in addition to the momentum equation, and the governing equation of turbulence model is also needed to be corrected.
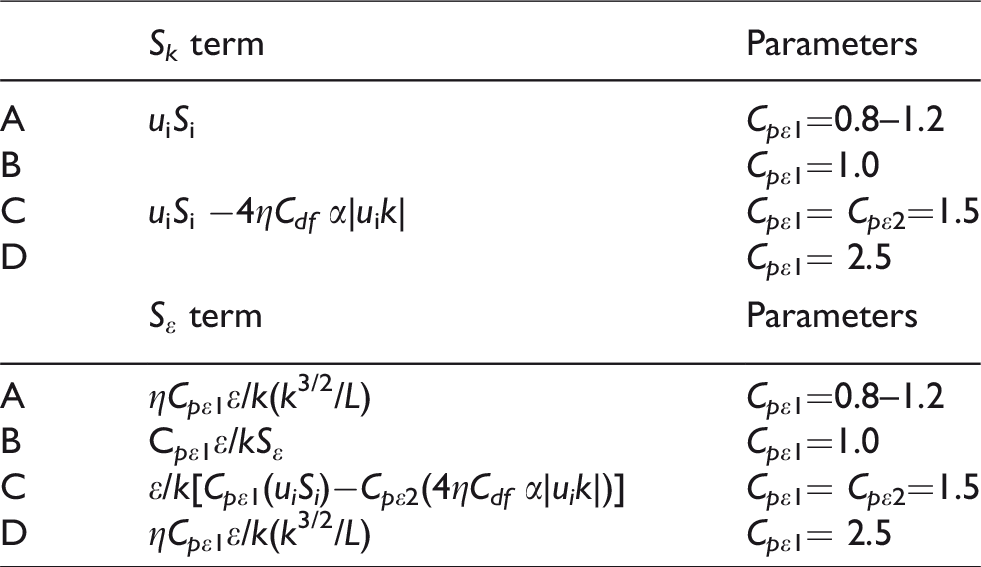
The porous media term of the tree canopy is listed here.
In the above table, η is the fraction of the area covered with trees, a is the leaf area density, Cdf is the resistance coefficient for canopy, and Cpε1 and Cpε2 are coefficients used to control the time scale of energy dissipation processes for canopy.
Numerical schemes and canopy model validation
This section will take the data Mochida offered in the calculation example to establish and verify the model used to simulate windbreak performance of trees 9 ; Model dimensions are shown in Figure 1. The size of calculation domain was taken as 150 m in length and 100 m in height after trial; in the process of grid division, the flow field in canopy is divided separately, and the minimum grid size of the wall is 15 mm and the total grids number is around 265 million. Corresponding boundary conditions of the flow domain are described as Table 2.
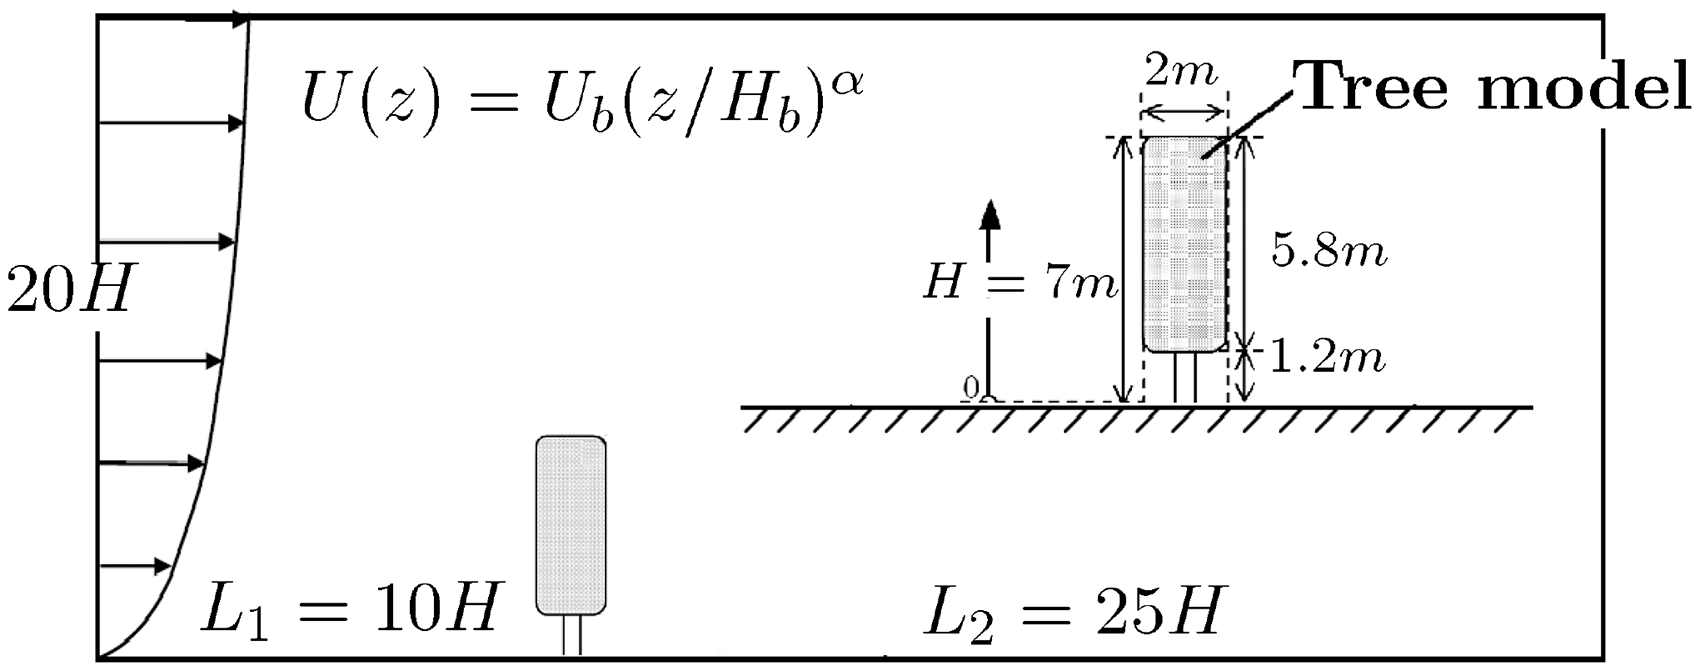
Model of flow domain.
SIMPLE algorithm is adopted as pressure–velocity coupling algorithm. Second upwind scheme is chosen as discrete method of governing equations for flow quantities.14
The choice of the source terms follows calculation formula B in Table 1 for canopy numerical simulation.
Source terms of tree canopy model.
Boundary conditions of the flow domain.
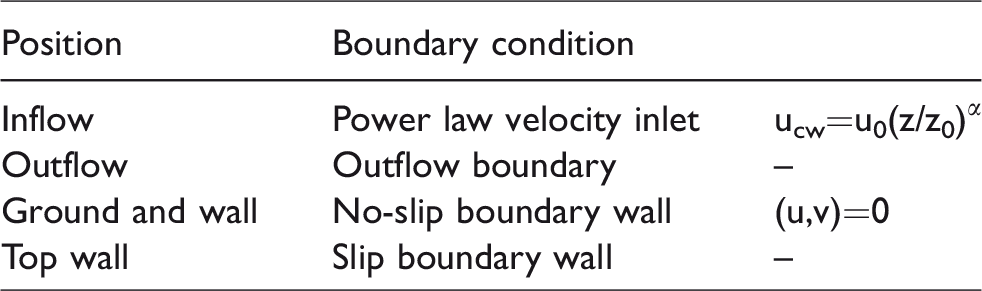
Figure 2 shows the comparison of the CFD values, measurement values provided by Mochida, and the wind tunnel values of wind velocity profiles downstream. As can be seen, at the height of canopy, the simulated results in the paper coincided with measured results. There are no measured data in the area over trees and canopy, but the wind speed variation simulated in this paper is almost the same as Mochida and Lun, 10 except wind speeds are little bigger than Mochida, which is closer to measured results. In summary, it is considered that the model in this paper can be used to simulate windbreak performance of trees.
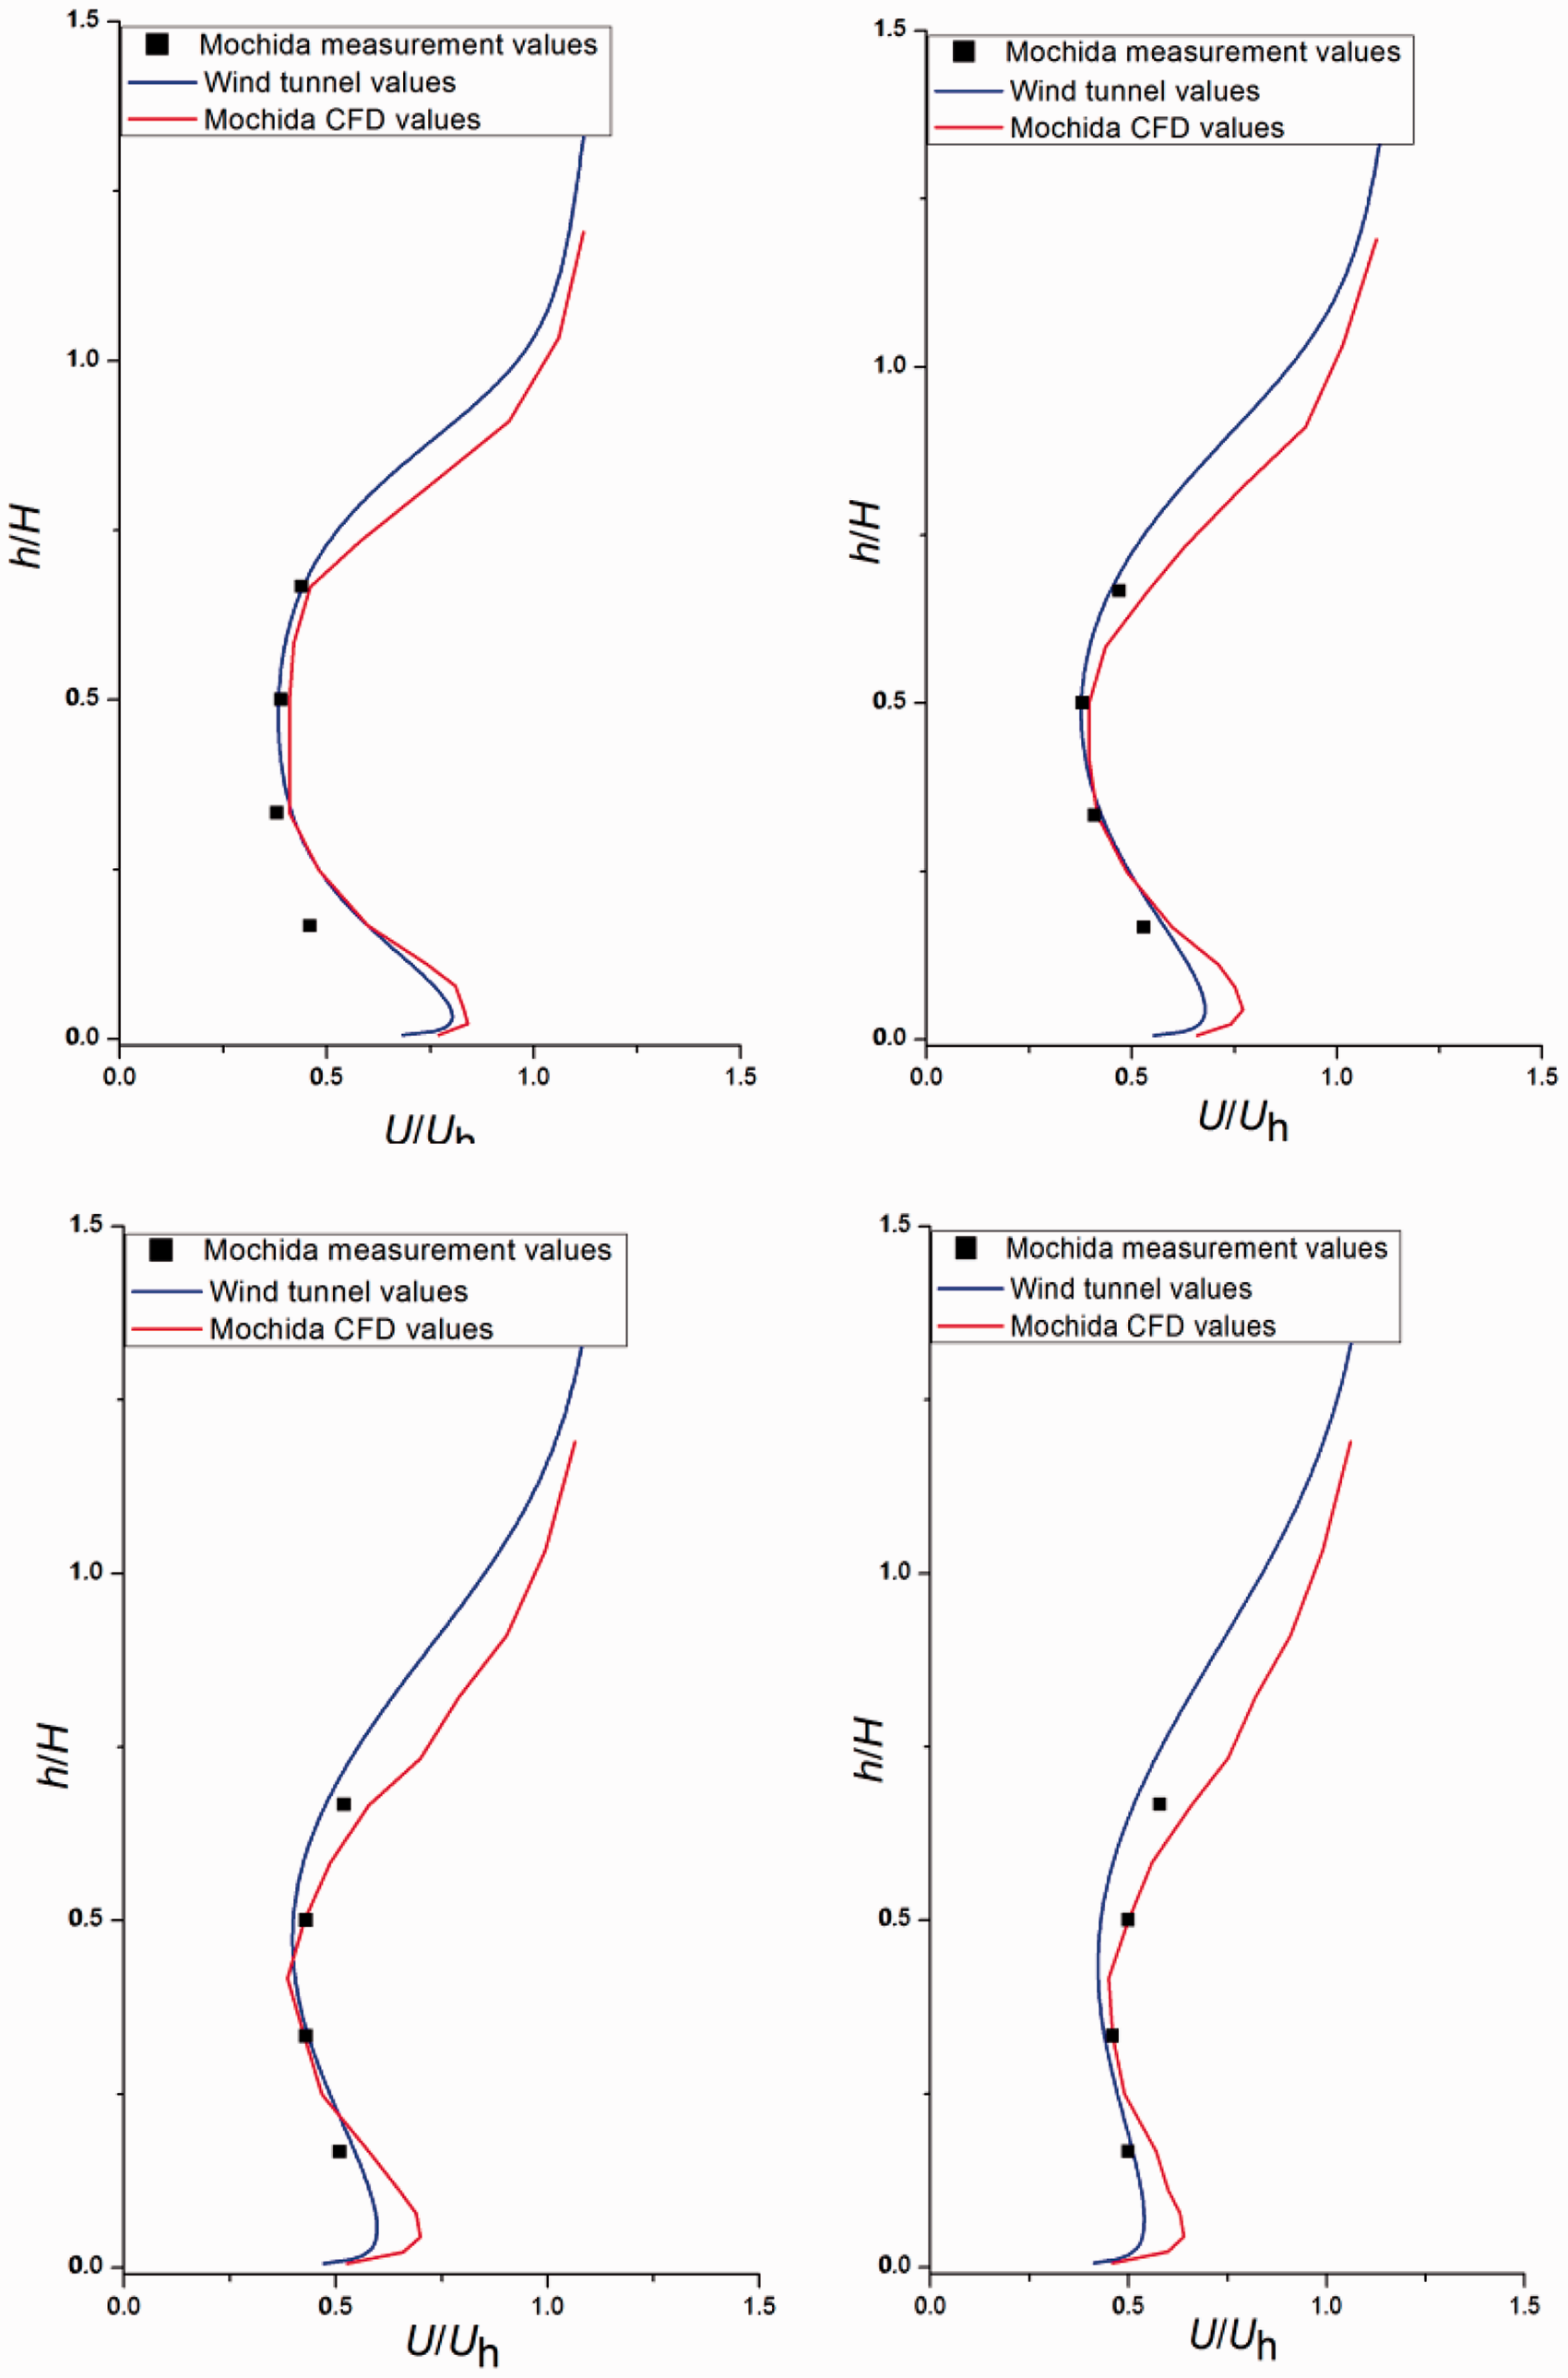
Wind velocity profile at the downstream of tree. CFD: computational fluid dynamics.
Influence of the canopy porosity
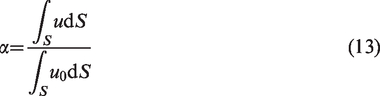
This section will adopt the established numerical model to study the effects of aerodynamic porosity on the windbreak performance of trees. The aerodynamic porosity is defined as
Parameters of aerodynamic porosities and drag coefficients.
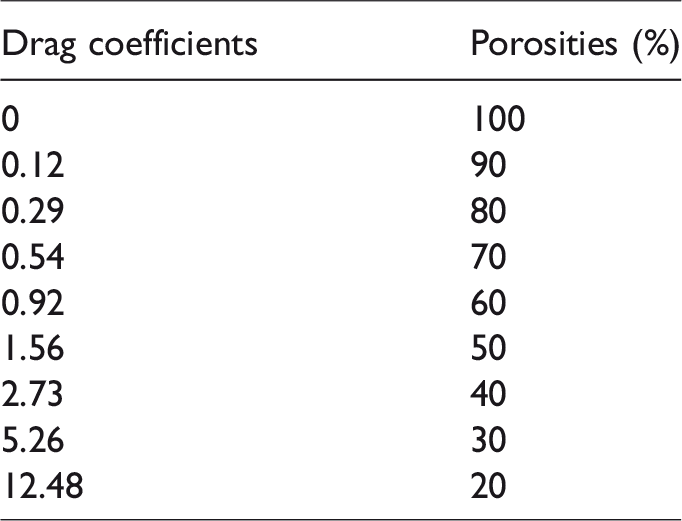
Figure 3 shows the change curve of the wind speed along the height at different distances away from the canopy, where, UH is the reference wind speed. It can be shown from Figure 3 that with the increase of canopy porosity the airflow velocity in downstream region is gradually increased in the height of canopy. However, in the area below canopy, wind speed decreases with the increasing of porosity when closed to tree (x/H = 1). Furthermore, compared with the case without tree, wind speed increases in this region. So, large canopy porosity does not always mean good performance of windbreak.
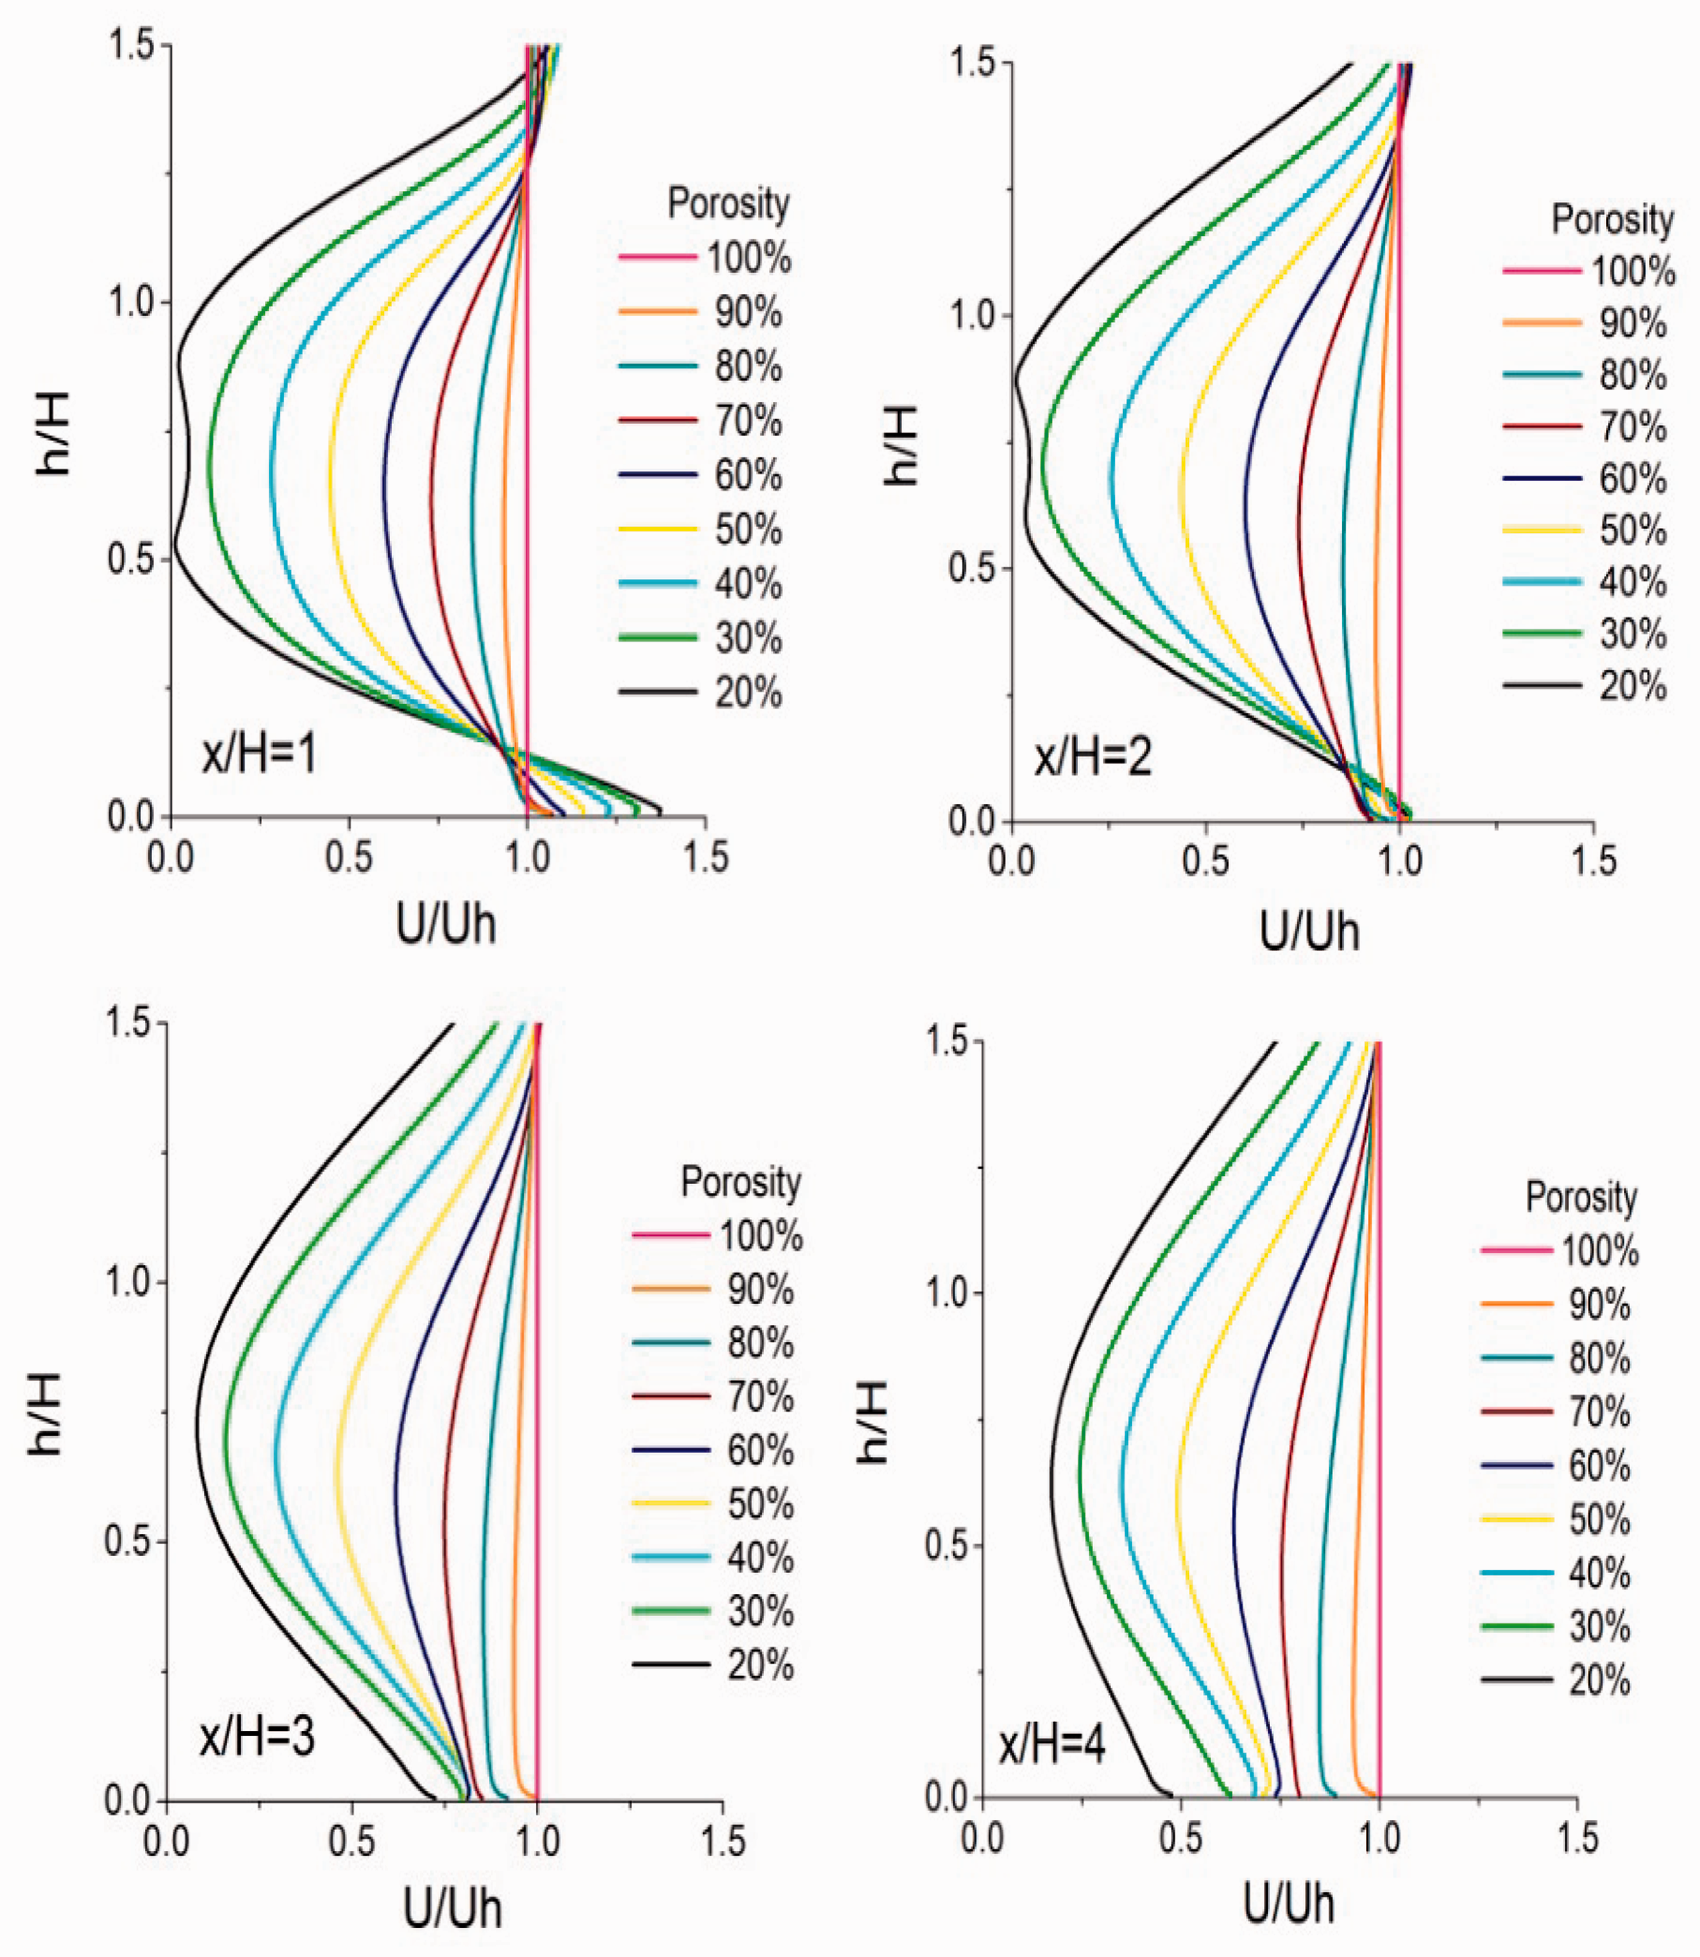
Wind velocity profile at different locations.
Influence of the tree canopy shape
This section will calculate three canopy shapes, i.e. cylindrical, conical, and quadrilateral pyramid (Figure 4), and compare their influence on the downstream wind field.
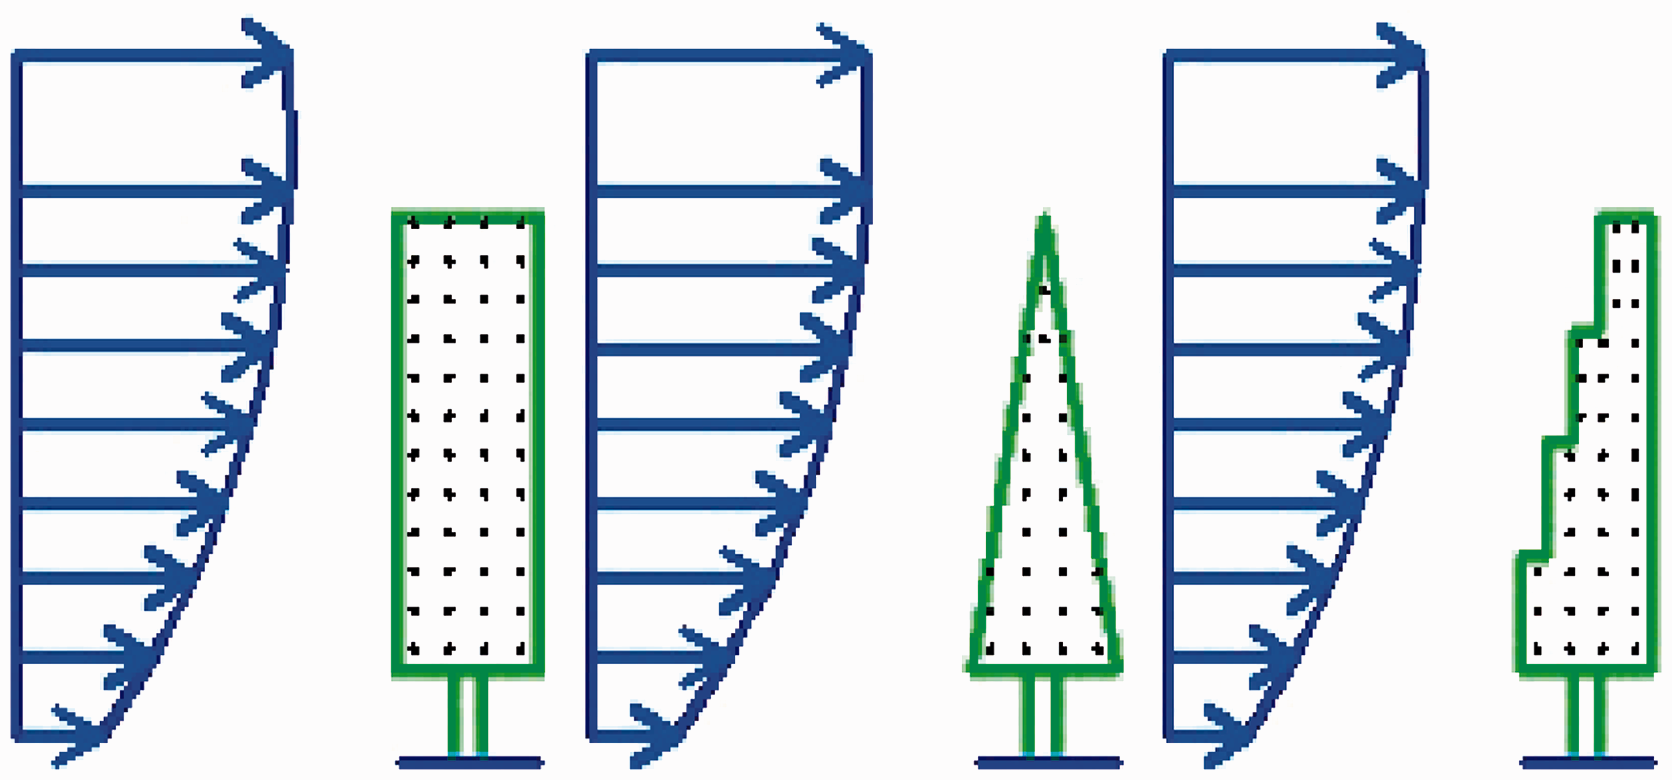
Shapes of tree canopy.
Figure 5 shows the wind profile curve of wind speed changes along the height at different distances away from the canopy. It shows that, in lower region, wind speed seems to be independent of the canopy shape of trees, and wind speed almost keeps the same in three cases in the region. With the height increasing, the effect of canopy shape becomes more and more obvious, especially in the upper area of canopy. In these regions, windbreak performance of tree depends on the thickness of canopy. The effect of canopy shape becomes smaller and smaller when height continues to increase.
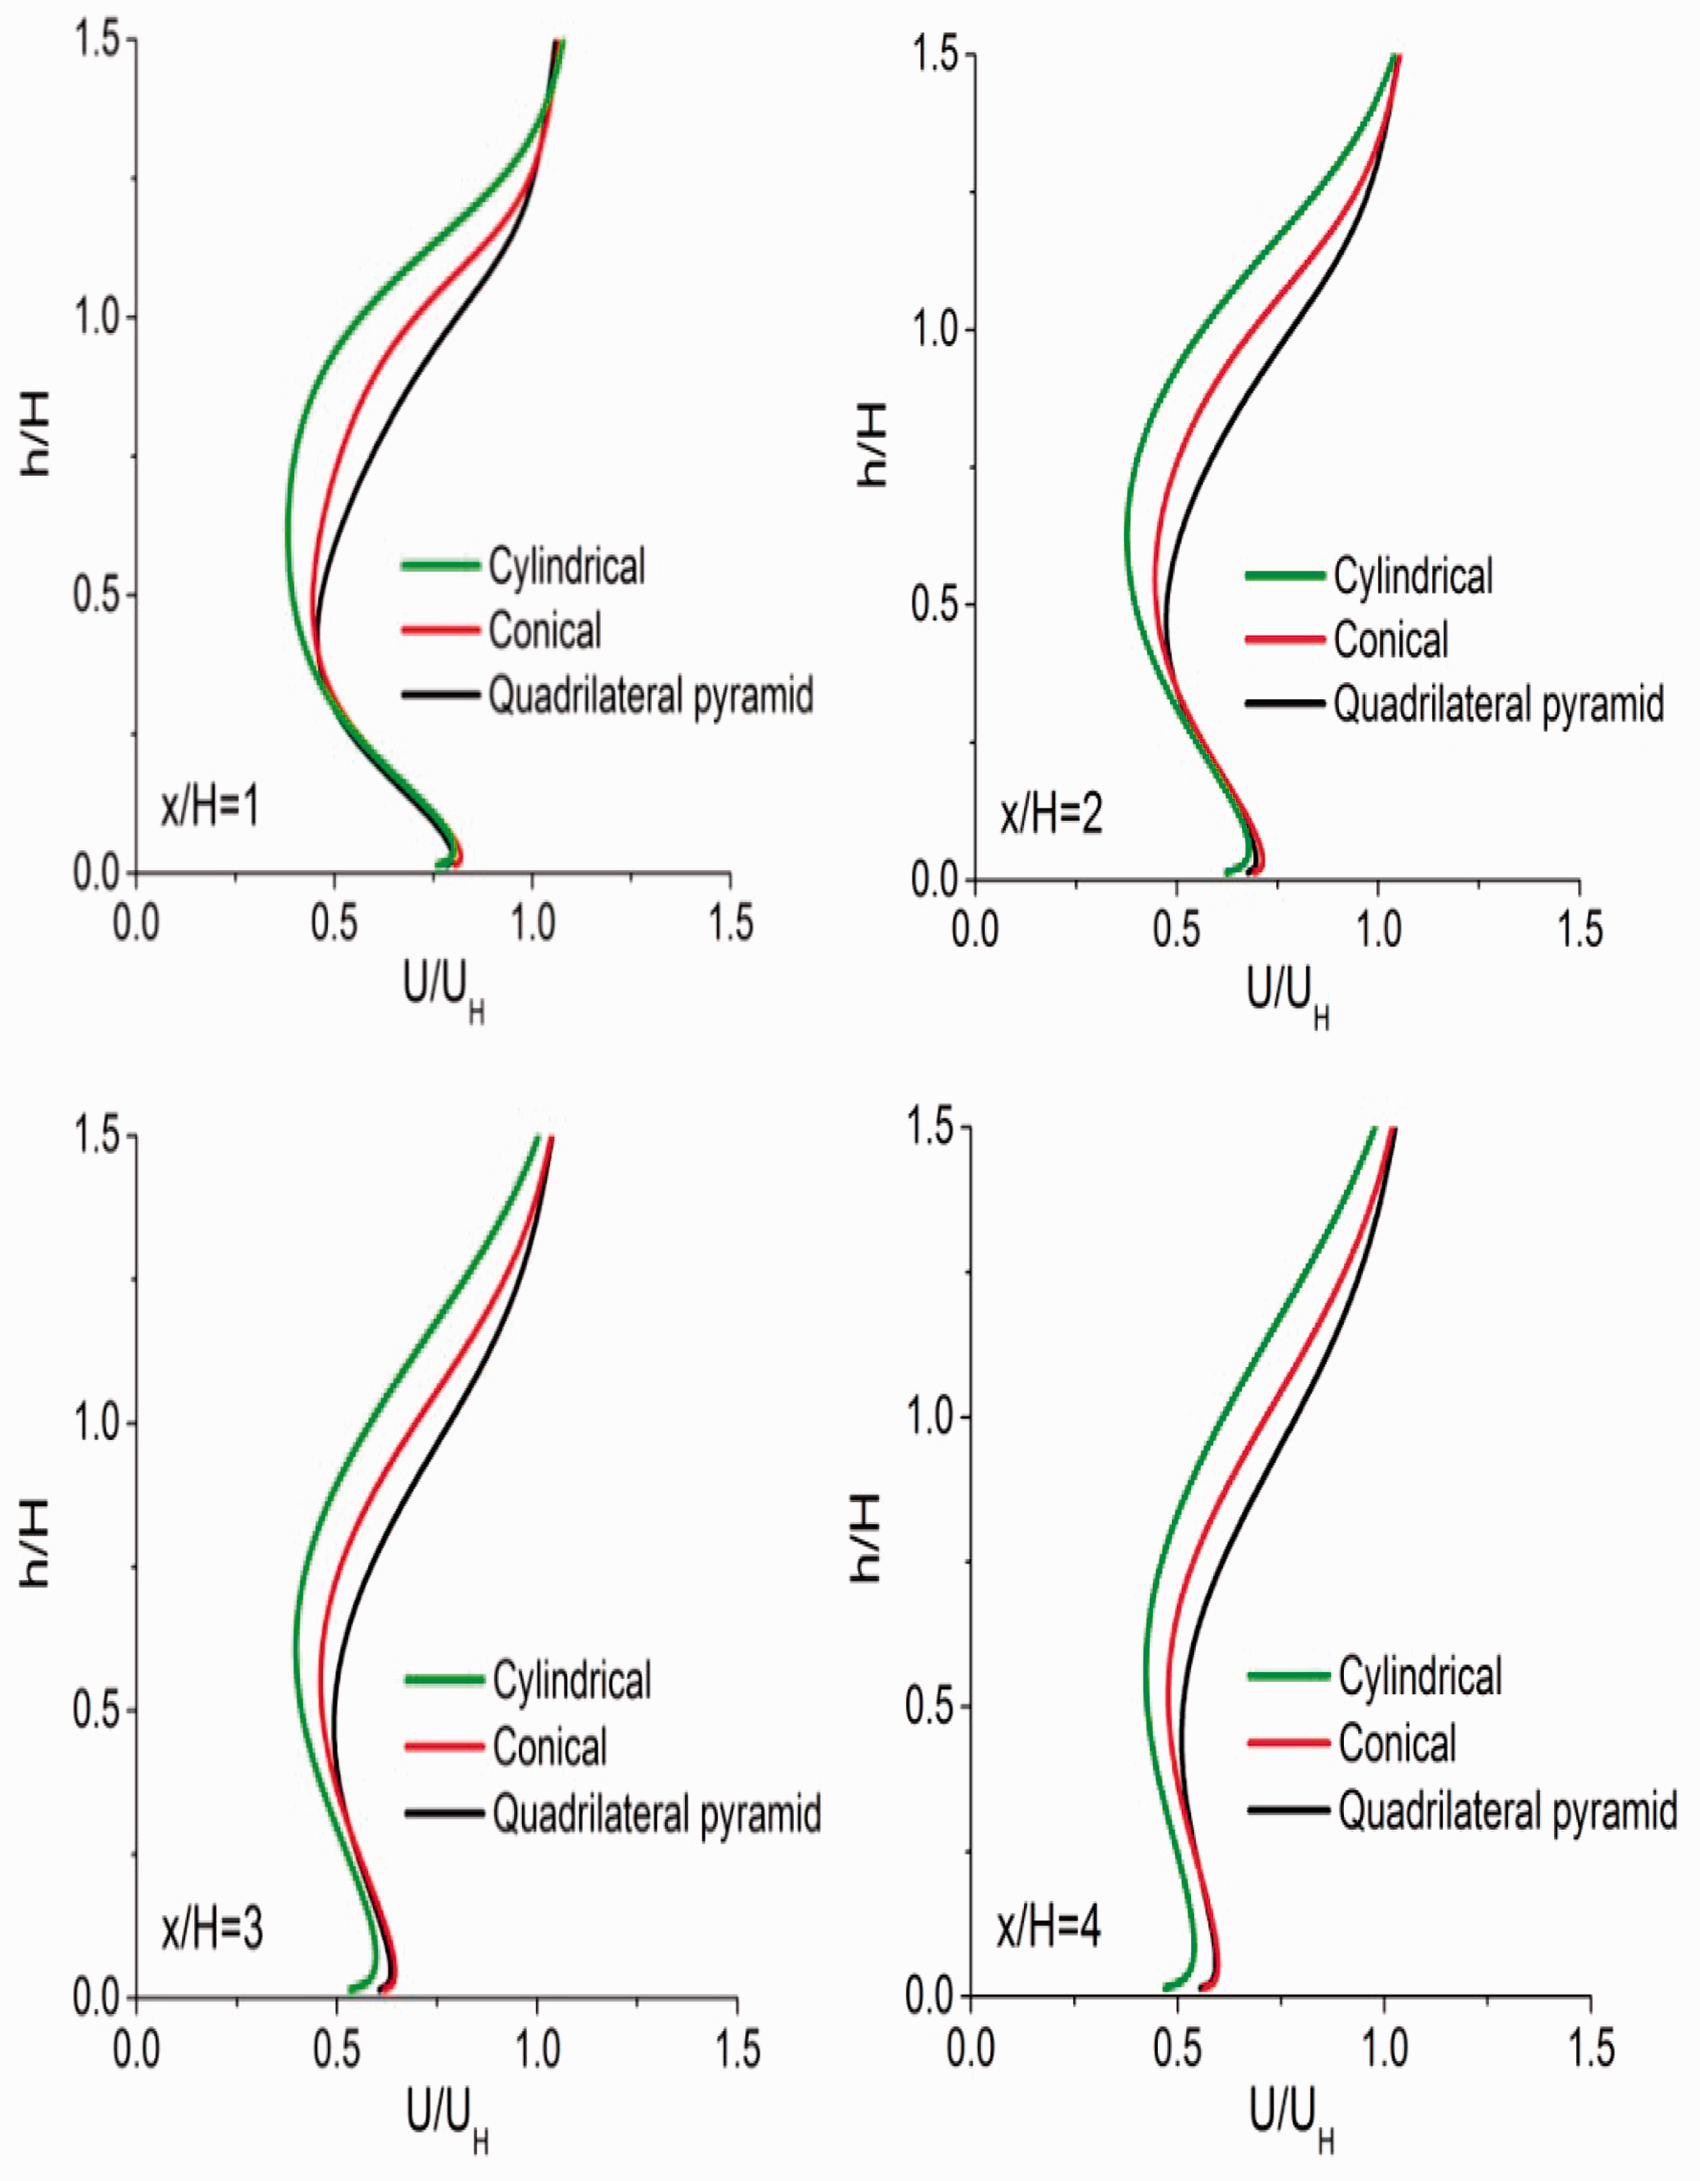
Wind velocity profile at different locations.
Influence of the tree distances
This section will simulate the effect of the changes of the distance between trees on the flow field downstream through a three-dimensional model of single row of trees; the canopy is simplified to cylinder; five kinds of calculation conditions are changes in the canopy pitch d of 2.0, 1.5, 1.0, 0.5, and 0.1 m, and other conditions are the same as the previous sections. A model for the calculation is shown in Figure 6. The section through the canopy center is defined as A and the section through the center of the canopy gap as B.
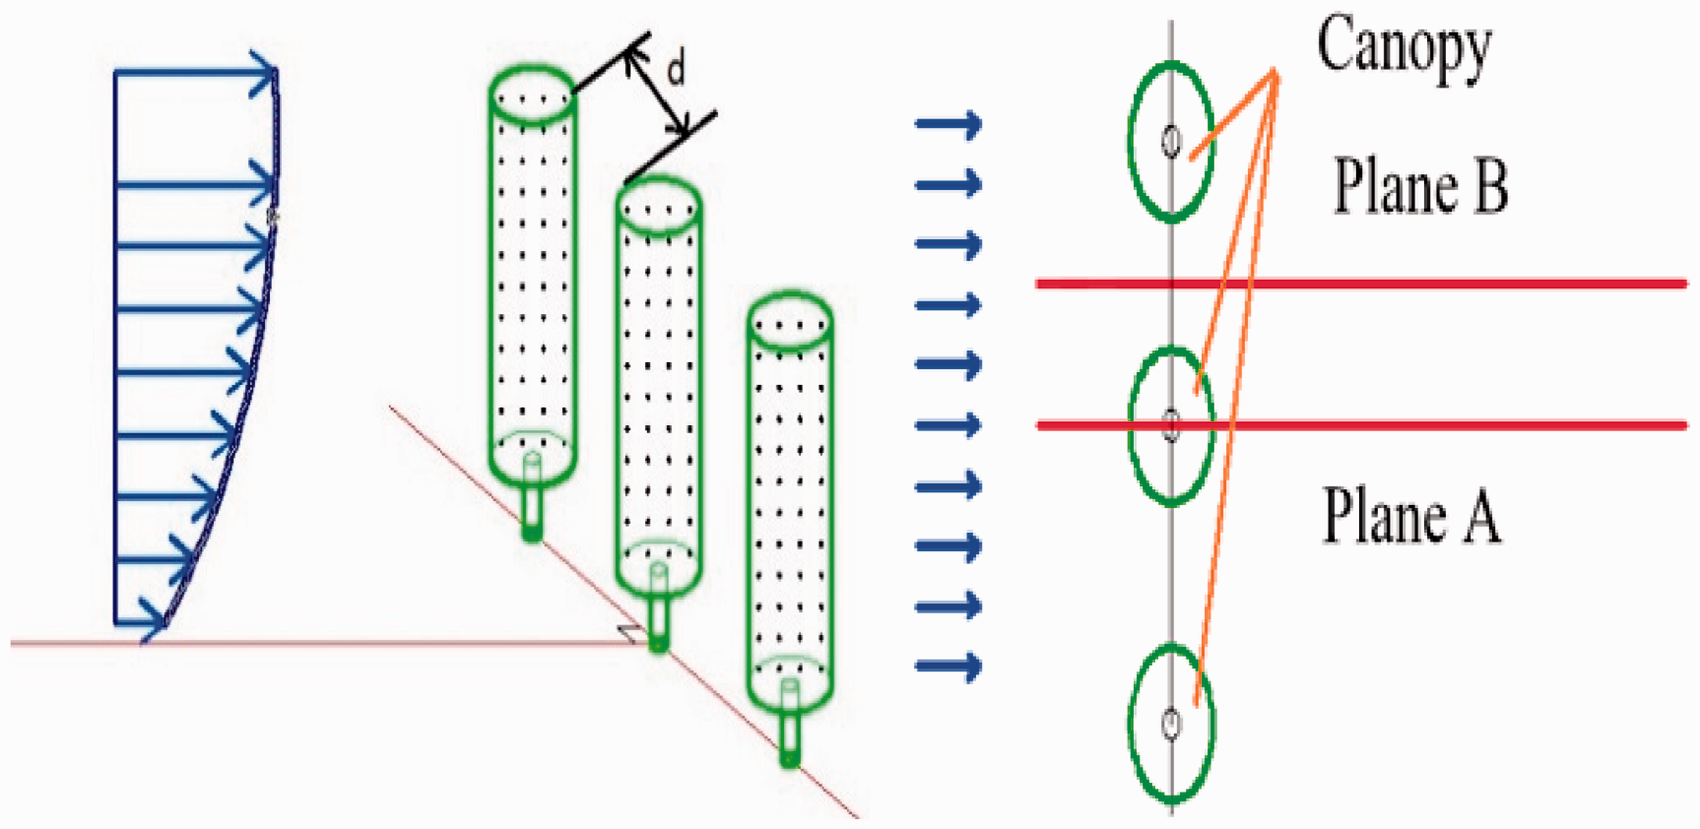
Schematic diagram of calculation model.
Figure 7 shows wind speed profile of different downstream locations on the planes A and B. Comparing wind profile curves of different locations on planes A and B, it can be seen that, when the location is near the canopy, trees’ spacing has little effect on airflow velocity on the canopy center, mainly effects the wind speed distribution in the gaps between canopies. When the location is far from canopy, wind speed distribution is generally the same on planes A and B. At the same time, it can be seen that windbreak performance of canopy decreases with trees’ spacing increasing, and the increase of trees’ spacing may be equivalent to an increase of the porosity.
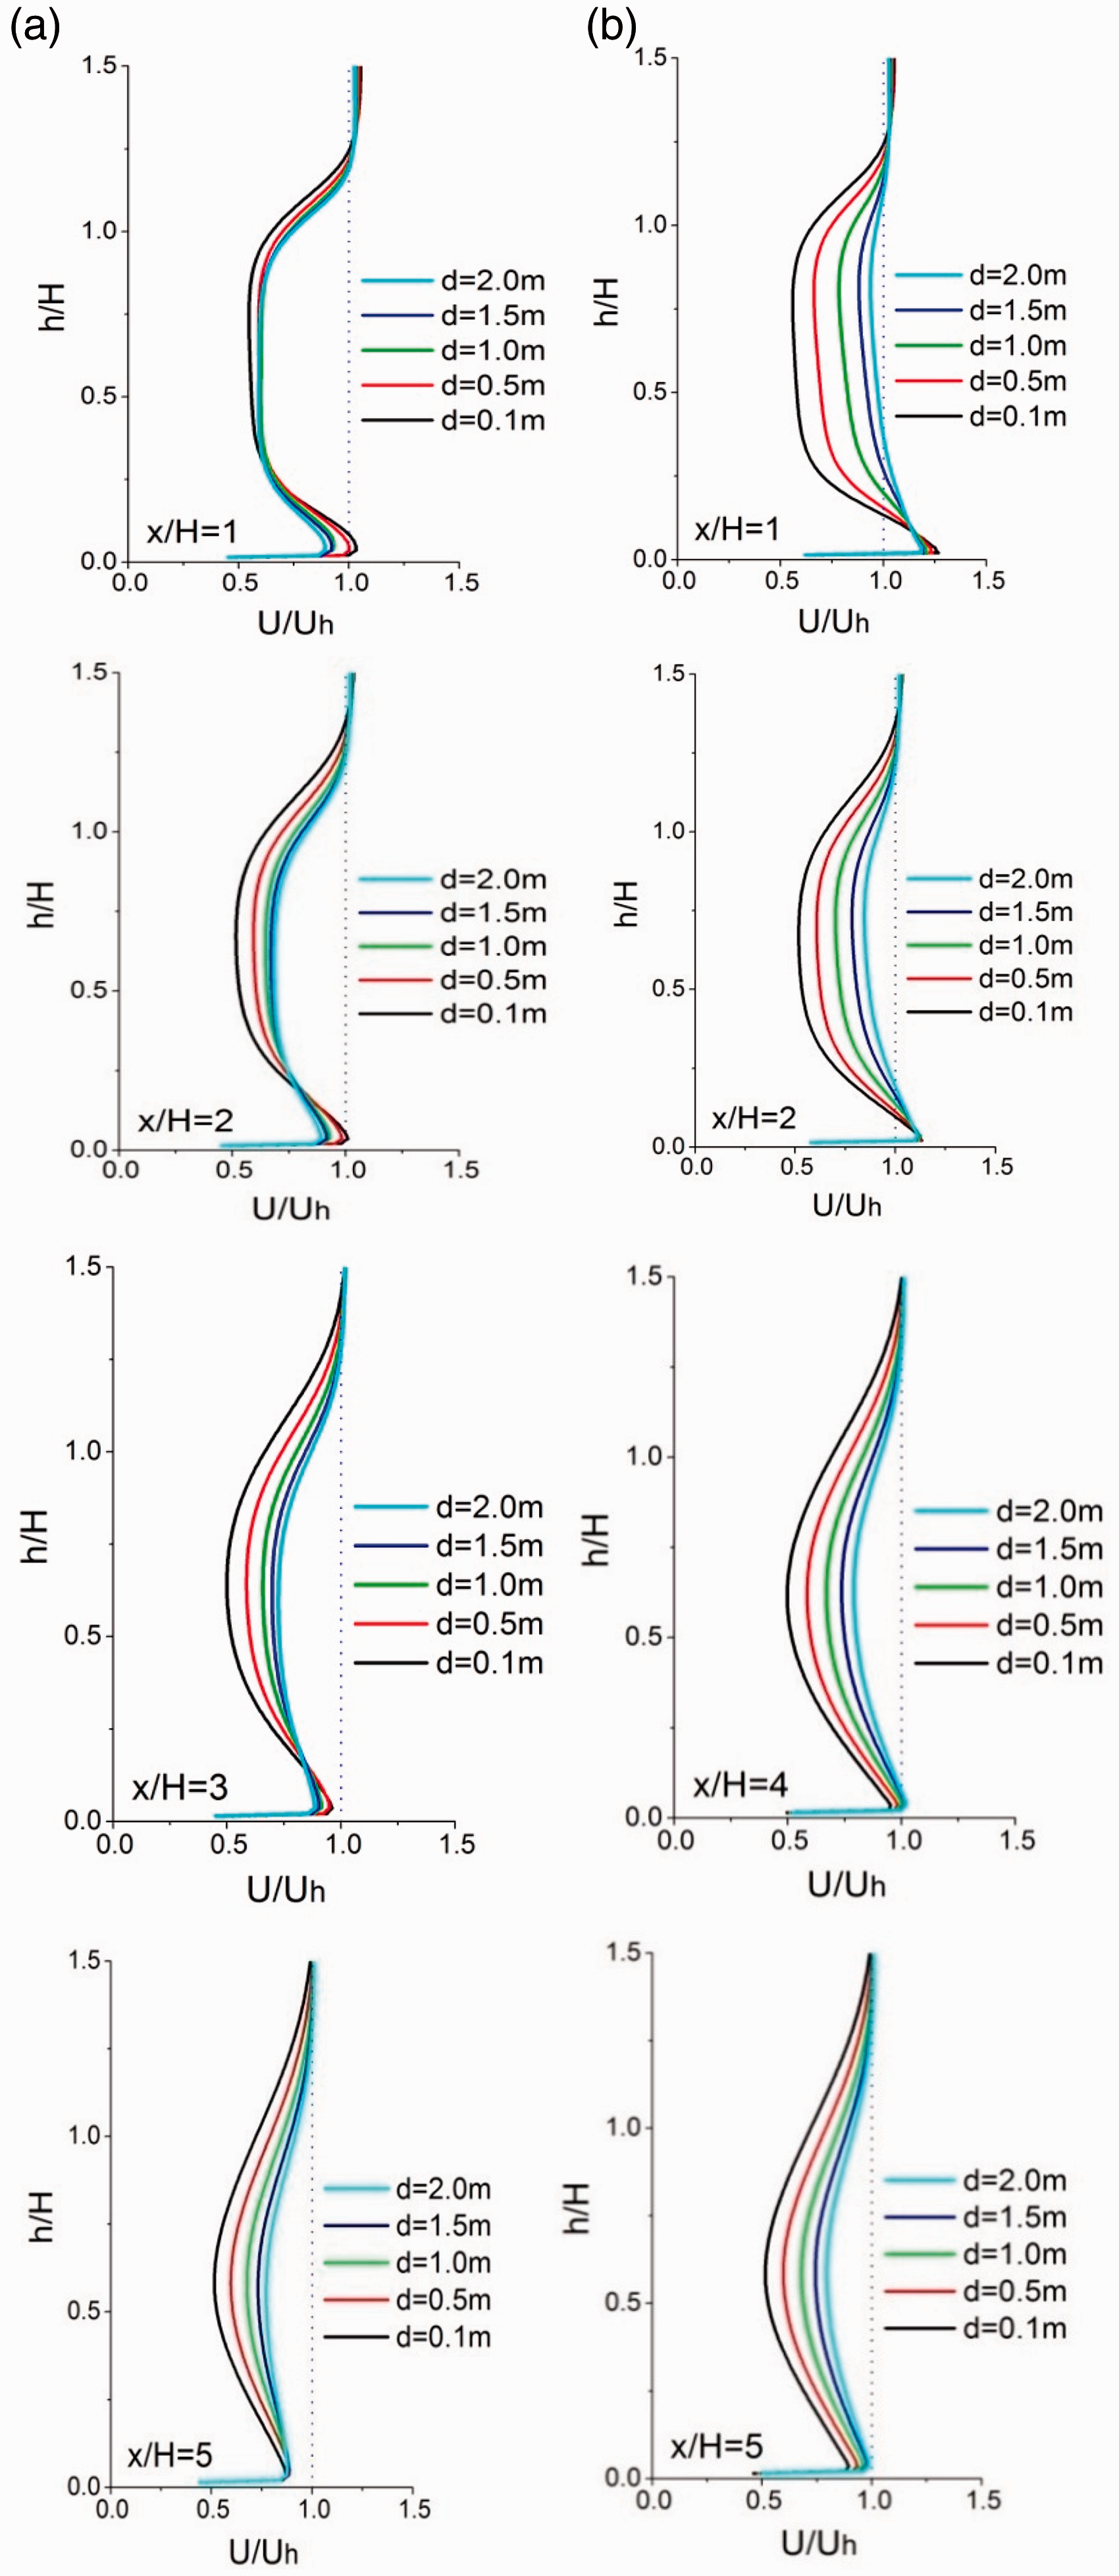
Wind velocity profile at different locations. (a) Plane A and (b) plane B.
Conclusion
Windbreak performance of tree is simulated based on the additional sink method. After evaluating the effect of canopy porosity, canopy shape, and spacing between trees, characteristics of wind flow on the downstream of tree can be summarized as follows.
The characteristics of wind field downstream of the trees are influenced by porosity more heavily; due to the block of canopies, when the wind passing the trees, there will be a positive pressure area in front of the canopy, while there will be a negative pressure area behind the canopy, the peak of positive and negative pressure and the affected area become larger with the decrease of porosity. After the wind passing the trees, there will be some phenomena that wind speed will increase in the upper and lower areas of canopies; the less the aerodynamic porosity is, the bigger the magnitude of wind speed increase will be. There will be airflow vortexes downstream of the trees when the porosity decreases to a certain range.
The position downstream of the trees where the minimum wind speed appears is closely related to the porosity of canopies and the height of trees. The airflow in the region between the canopy and the ground begins to slow down when it reaches a position near the trees and then accelerates in the gap between the canopies and the ground; the maximum wind speed will exceed the wind speed in the situation without trees. At the height of 0.6 tree-heights away from ground, the velocity of airflow will decrease after going through canopies, the minimum velocity appears at a leeward distance of 1–4 tree-heights, and the position of minimum wind velocity will be closer to the trees when the porosity is bigger or the trees are shorter. At the height of 1.2 tree-heights away from the ground, there will be a small increase of wind velocity at the top of the trees, and the velocity gradually reduces to the minimum value at the height of 2–4 tree-heights.
Effect of changes in the shape of the canopy on flow field is small, and simplifying the complex canopy into cylinder will simplify the calculation model and improve efficiency. At the same time, the change of trees’ spacing only affects the area near the trees more heavily; in the area far away from the trees, the changes of trees’ spacing can be equivalent to the changes of aerodynamic porosity.
Footnotes
Declaration of conflicting interests
The author(s) declared no potential conflicts of interest with respect to the research, authorship, and/or publication of this article.
Funding
The author(s) disclosed receipt of the following financial support for the research, authorship, and/or publication of this article: The work described in this paper is fully supported by grants from the key International (Regional) Joint Research Program of China (51720105005) and the National Natural Science Foundation of China (51578059). The 111 project (B13002) and Fundamental Research Funds for the Central Universities (2017JBM084) are gratefully acknowledged.