
Abstract
The particle dynamics in an oscillating alveolus under tidal breathing can be dramatically different from those in a static alveolus. Despite its close relevance to pulmonary drug delivery and health risk from airborne exposure, quantifications of alveolar deposition are scarce due to its inaccessibility to in vivo measurement instruments, tiny size to replicate in vitro, and dynamic wall motions to model. The objective of this study is to introduce a numerical method to quantify alveolar deposition with continuous particle release in a rhythmically oscillating alveolus by integrating the deposition curves for bolus aerosols and use this method to develop correlations applicable in assessing alveolar drug delivery efficiency or dosimetry of inhaled toxicants. An idealized blind-end terminal alveolus model was developed with rhythmically moving alveolar boundary conditions in phase with tidal breathing. The dynamic wall expansion mode and magnitude were based on experimentally measured chest wall motions and tidal volumes. A well-validated Lagrangian tracking model was used to simulate the transport and deposition of inhaled micrometer particles. Large differences were observed between dynamic and static alveoli in particle motion, deposition onset, and final alveolar deposition fraction. Alveolar deposition of bolus aerosols is highly sensitive to breath-holding duration, particle release time, and alveolar dimension. For 1 µm particles, there exists a cut-off release time (zero bolus deposition), which decreases with alveolar size (i.e., 1.0 s in a 0.2-mm-diameter alveolus and 0.56 s in a 0.8-mm-diameter alveolus). The cumulative alveolar deposition was predicted to be 39% for a 0.2-mm-diameter alveolus, 22% for a 0.4-mm-diameter alveolus, and 10% for a 0.8-mm-diameter alveolus. A cumulative alveolar deposition correlation was developed for inhalation delivery with a prescribed period of drug release and the second correlation for the time variation of alveolar deposition of ambient aerosols, both of which captured the relative dependence of the particle release time and alveolar dimension.
Keywords
Introduction
Human lungs consist of approximately 480 million alveoli, which comprise a surface area of 70−75 m2. 1 The rich vascularization of the alveolar surface makes it a vulnerable site to airborne toxins, while at the same time, a desirable target of drug delivery for local or systematic therapies. Knowledge of particle deposition on these surfaces is critical in assessing the exposure health effects or the therapeutic outcomes of pharmaceutical agents. However, because of the submillimeter dimension of the alveolus, the secluded location, the complex structure either individually or as a group, as well as the dynamic motion of the structure, it is highly challenging to study the airflow and particle dynamics within the acinus region. The periodic alveolar wall motion and the resultant oscillating airflow make it challenging to characterize the particle behavior and fate quantitatively. Easy-to-use correlations for dosimetry prediction in either individual alveolus or alveoli sac are still not available, except a recent attempt by Khajeh-Hosseini-Dalasm and Longest, 2 who developed a correlation of particle deposition in a space-filling alveoli sac geometry.
There are three types of structures in the acinar region: (1) respiratory bronchioles with one or a few alveoli attached, (2) alveolar ducts with a high density of alveoli, and (3) terminal sacs as a cluster of alveoli at the end of the lung.3,4 Several studies have been reported on aerosol deposition in the respiratory bronchioles and alveolar ducts. Tippe and Tsuda 5 experimentally studied a scale-up model of a rhythmically moving alveolus mounted on a straight duct with steady and unidirectional flow through the duct. Compared to a rigid wall alveolus, the flow features changed dramatically due to the presence of rhythmic wall motion. More airflow from the duct was pulled into the alveolus during wall expansion, which evolved into a recirculation flow at the center of the alveolus during the exhalation. 6 Appreciable particle dispersion was observed as evidenced by the complex twisting and stretching particle trajectories.3,6 Darquenne and Paiva 7 used two-dimensional (2D) and three-dimensional (3D) multi-orifice plate models to simulate the alveolated duct under unidirectional steady flow conditions and reported large deposition discrepancies between 2D and 3D geometries. The influences of tidal breathing on particle deposition in an alveolated duct model was first reported by Tsuda et al. 8 The rhythmically dilating and contracting wall motion was achieved by varying the whole model in a geometrically similar manner. It was demonstrated that tidal breathing in a rhythmically moving alveolated duct geometry would lead to highly complex and irreversible flows and perceivable particle mixing and dispersion. Sznitman et al.9,10 simulated alveolar flows and particle deposition in both an idealized sphere-mounted duct model and a space-filling acinar model with moving boundaries and tidal breathing. Particle trajectories and deposition were found to be strongly related to the alveolar orientation. In addition, the oscillatory convection had a large impact on 1 µm particles, while had a much smaller impact on 3 µm particles, for which the gravitational sedimentation was more dominant. 10 Experimental studies of airflow and particle kinematics in alveolated ducts have been conducted in both scaled-up 11 and true-scale12,13 acinar models, which showed good agreement with complimentary simulations.14,15 Hofemeier and Sznitman 16 studied the anisotropic expansion effects on particle deposition in a multi-generation acinar network and observed a negligible impact on the deposition of respirable particles. Similar results were reported in a recent study of Talaat and Xi, 17 who compared deposition of bolus aerosols between symmetrically and asymmetrically expanding alveoli and found insignificant differences in particle deposition for 1 µm particles.
Studies of particle deposition in the terminal sacs at the end of the lung are scarce. Airflow in a terminal alveolus is entirely driven by the rhythmical wall motion, which enters and exits the terminal alveolus via the same inlet. By contrast, in the respiratory bronchioles and alveolar ducts, the majority of inhaled airflows are limited in the bronchiolar ducts, with only a minor portion of airflow being ventilated into the duct-mounted alveoli. 8 The airflow and aerosol dynamics in terminal alveoli can be significantly different from those in the alveolated ducts. Kumar et al. 18 numerically studied the airflows in three honeycomb-like acinar models that are representative of respiratory bronchioles, alveolar ducts, and blind-ended terminal alveoli, respectively. It was observed that wall motions induced recirculation regions in alveoli of the respiratory bronchioles and alveolar ducts, while there was no recirculation in the terminal alveoli. Convective mixing in respiratory bronchioles and alveolar ducts were also examined by Kumar et al., 19 who demonstrated that steady streaming is a key mixing mechanism of airflow mixing inside the alveolus. However, wall motion effects on particle behaviors inside the terminal alveoli have not been investigated, even though insightful speculations were given in the above two studies. Recently, Talaat and Xi 17 numerically investigated particle transport and deposition in rhythmically oscillating terminal alveoli. The airflow and particle dynamics in the terminal alveolus were found to be significantly different from those in the respiratory bronchioles or alveolated ducts.3,6,10,20 The flow recirculation inside the alveolus of the respiratory bronchiole model was completely absent in the terminal alveolus model, which is consistent with Kumar et al. 18 Considering the particle trajectories, particles in the terminal alveoli oscillate with the rhythmical wall motion and form a multi-folding profile; 17 by contrast, particles in an alveolus-mounted duct model remain suspended in the alveolus for many cycles, rotating counterclockwise during inhalation and clockwise during exhalation.6,10 Moreover, particles inhaled into the terminal alveolus take several cycles to reach the bottom of the alveolus and another one or two cycles to complete the deposition process. 17 While in the alveolus-mounted respiratory bronchiole model, the majority of particle deposition occurs in the first cycle. 6
Even though alveolar deposition studies of a bolus aerosol can provide useful information on particle dynamics, deposition of inhaled particles under continuous inhalation or during a specified period is of more relevance in inhalation dosimetry and pulmonary drug delivery. However, quantification of transient alveolar deposition under continuous aerosol inhalations has not been reported in either in vitro or numerical studies, mainly because of the tiny size of the alveolus and its dynamic wall motion. 17 The objective of this study is to develop a computational model to quantify the transient alveolar deposition of both bolus aerosols and continuously inhaled aerosols. There are four specific aims in this study: (1) to characterize the airflow and particle dynamics in the alveolus model, (2) to examine the effects of time-related (breath-holding duration, particle release time) and geometry-related (alveolar diameter) factors on bolus alveolar deposition, (3) to compute continuous-inhalation alveolar deposition based on the bolus deposition results, and (4) to develop empirical correlations for continuous-inhalation alveolar deposition.
Methods
Computational alveolus model and motion modes
The alveolus ranges from 0.2 mm to 0.45 mm in diameter (0.36 mm mean) in healthy subjects and from 0.46 mm to 0.89 mm (0.70 mm mean) in chronic obstructive pulmonary disease (COPD) patients.21,22 In this study, the alveolus was approximated as a sphere of 0.4 mm in diameter and was connected to an alveolar duct with a diameter of 0.1 mm and a length of 0.2 mm. Geometrically similar models with the sphere diameter of 0.2 mm, 0.6, and 0.8 were also considered to study the alveolar size effects. The spatial expansion of the alveolus was assumed to follow the anisotropic motion of the chest wall, which had less expansion in the coronal (right-left, y) direction than the sagittal (back-front, x) and axial (head-foot, z) directions (i.e., y:x:z = 0.375:1:1), as shown in Figure 1.23,24 The volume expansion ratio of the alveolus was assumed to be consistent with the ratio of tidal volume over functional residual capacity (VT/FRC = 7/30 = 0.233). 25 Therefore, the volume expansion ratio can be expressed as (1 + 0.375b)(1+b) (1+b) = 1.233, where b is the coordinate expansion ratio. Solving the above equation gives b = 0.0918. For a 0.4-mm-diameter alveolus with 1.5 s inhalation, this “b” translates into a motion of the bottom wall at 2.45 × 10⁻⁵ m/s on average and 4.90 × 10⁻⁵ m/s at its maximum. This is equivalent to the settling velocity of 1 µm particles (2.91 × 10⁻⁵ m/s).
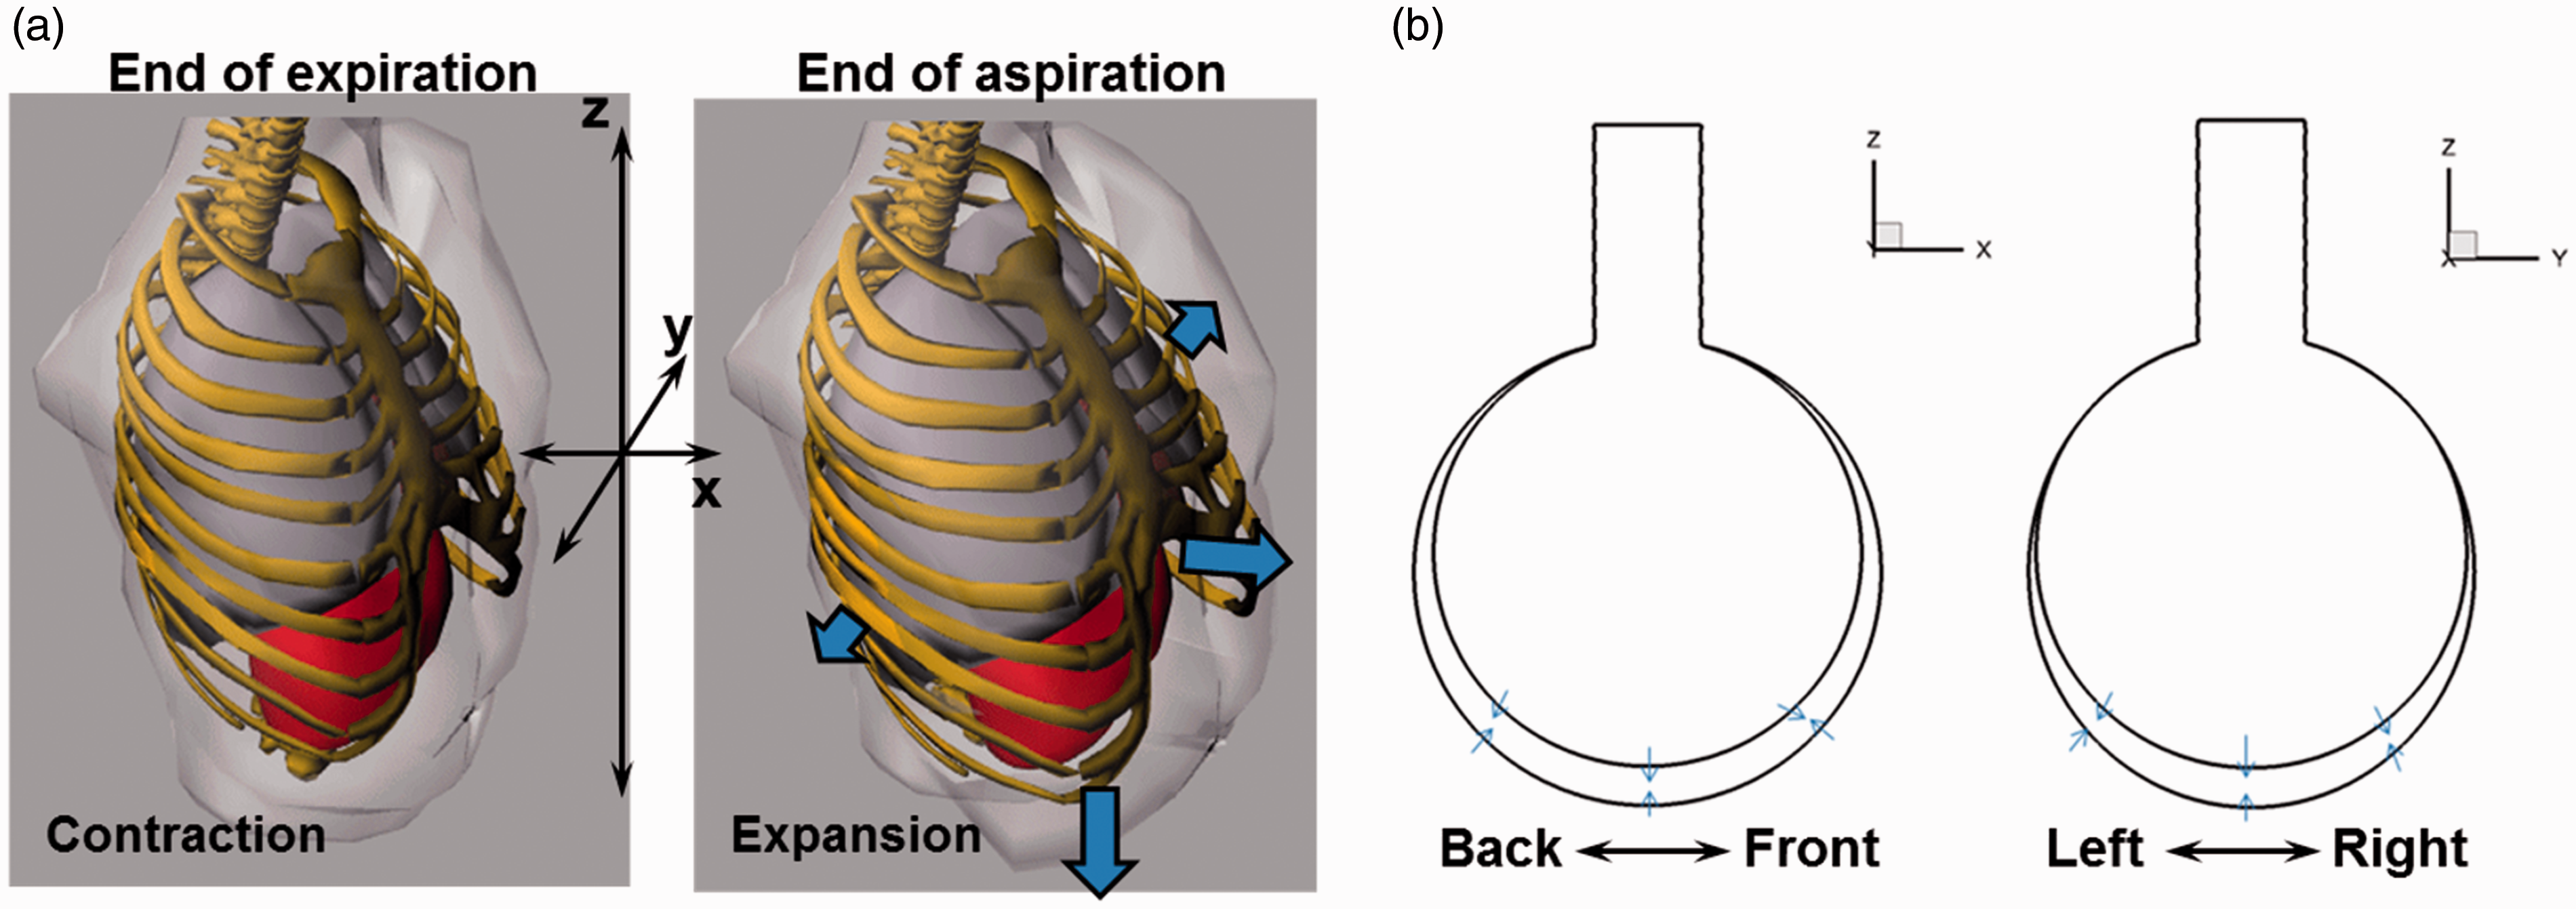
Diagram of respiration: (a) the expansion and contraction of the human lungs are not isotropic in the three directions. The motion ratio between x:y:z = 1:0.375:1. (b) The motion of a respiring alveolus is assumed to be consistent with the chest wall motion (the realistic or anisotropic case). Particle deposition with an isotropic alveolar wall motion will also be simulated and compared to that of the anisotropic case.
A user-defined function was developed to control the rhythmical motion of the alveolar wall. Both the expansion and contraction were assumed to follow a sinusoidal function. The period of one breathing cycle was assumed to be 3 s, with the inspiration-expiration (I:E) ratio = 1.0. The alveolus wall moves differently in three directions, with 1.0918 in x and z directions and 1.0344 in y-direction.
Fluid dynamic and particle tracking models
The particle size range of 0.5–3 µm is selected because smaller nanoparticles deposit in the alveolus by diffusion, while larger micrometer particles are filtered out in the upper airway and cannot reach the alveoli sacs. Multiple breathing cycles will be simulated, with the first breathing cycle to establish the transient airflow field. An amount of 1000 particles for each particle size considered will be released as a bolus at the beginning of the second breathing cycle and will be tracked until all particles deposit or exit the alveolus.
The flows were assumed incompressible and isothermal. The inlet Reynolds number is less than unity even at peak inhalation rates and the flow regime is laminar. 14 Therefore, laminar flow model was used to solve the airflow field. A well-tested direct Lagrangian algorithm was used to track particle trajectories in the flow field.26,27 This Lagrangian model, in combination with the near-wall correction treatment, 28 has been shown in our previous studies to agree with in vitro deposition results in human upper airways for both nanoparticles 29 and micrometer particles.30,31
Bolus and continuous-inhalation alveolar deposition fraction
The alveolar deposition fraction (DF) is the ratio of particles depositing in the alveolus to the number of particles entering the alveolus. There are three types of the DFs used in this study, which is defined as below. The first type is the bolus alveolar DF, where the particles are released into the alveolus as a bolus at one instant during the inhalation and are tracked for multiple respiration cycles until all particles either deposit onto the wall or are exhaled out of the alveolus. In our previous study, only bolus alveolar deposition was considered. 17
The second type is the cumulative alveolar deposition (

The third type is also a cumulative alveolar deposition (
This type of deposition
Numerical methods
The transient simulations of airflow and particle dynamics were conducted using ANSYS Fluent (Canonsburg, PA). User-defined Fortran and C modules were used to specify inlet particle profiles and calculate particle DFs. ANSYS ICEM CFD (Ansys, Inc.) was utilized for computational mesh generation. One-way coupling from the airflow to particles was assumed. The method of least squares was used to develop the deposition correlation. 32 A grid independence study was carried out by varying mesh densities ranging from very coarse (0.3 million) to very fine (2.4 million), with the variation of total deposition rate as the criterion. Increasing the mesh size from 1.2 million to 2.4 million gave a deposition variation less than 1%. Therefore, the final mesh size was chosen to be 1.2 million.
Results
Airflow and particle dynamics
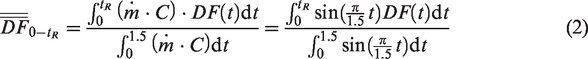
Airflow and vortex topologies inside the alveolus are shown in Figure 2 at three different instants within one breathing cycle. The vortices were identified as the iso-surface of the λ−2 criterion at the magnitude of 0.034, which indicates the mixing intensity. 33 The streamlines were also plotted in each figure, which seems to be invariant with time in the overall pattern. The first two rows represent the start and end of the inhalation phase. At the acceleration phase (t/T = 0.1), the alveolar wall expands, drawing in airflow via the alveolar duct. After t/T = 0.4, the expansion of the alveolus slows down. As a result, the inhalation speed decreases and the vortex structures start to shrink. Interestingly, the vortices do not decay entirely at the end of inhalation. There is still a small portion of vortex structures remaining at the alveolus exit and in the duct. These residual vortices may result from the flow irreversibility, a phenomenon that has been observed in periodically moving structures.34,35 In addition, particle transport and deposition can be affected by these residual vortices and will be examined in more details in later sections.
Airflow and coherent structures at various times during aspiration: (a) t/T = 0.10, (b) t/T = 0.40, and (c) t/T = 0.80.
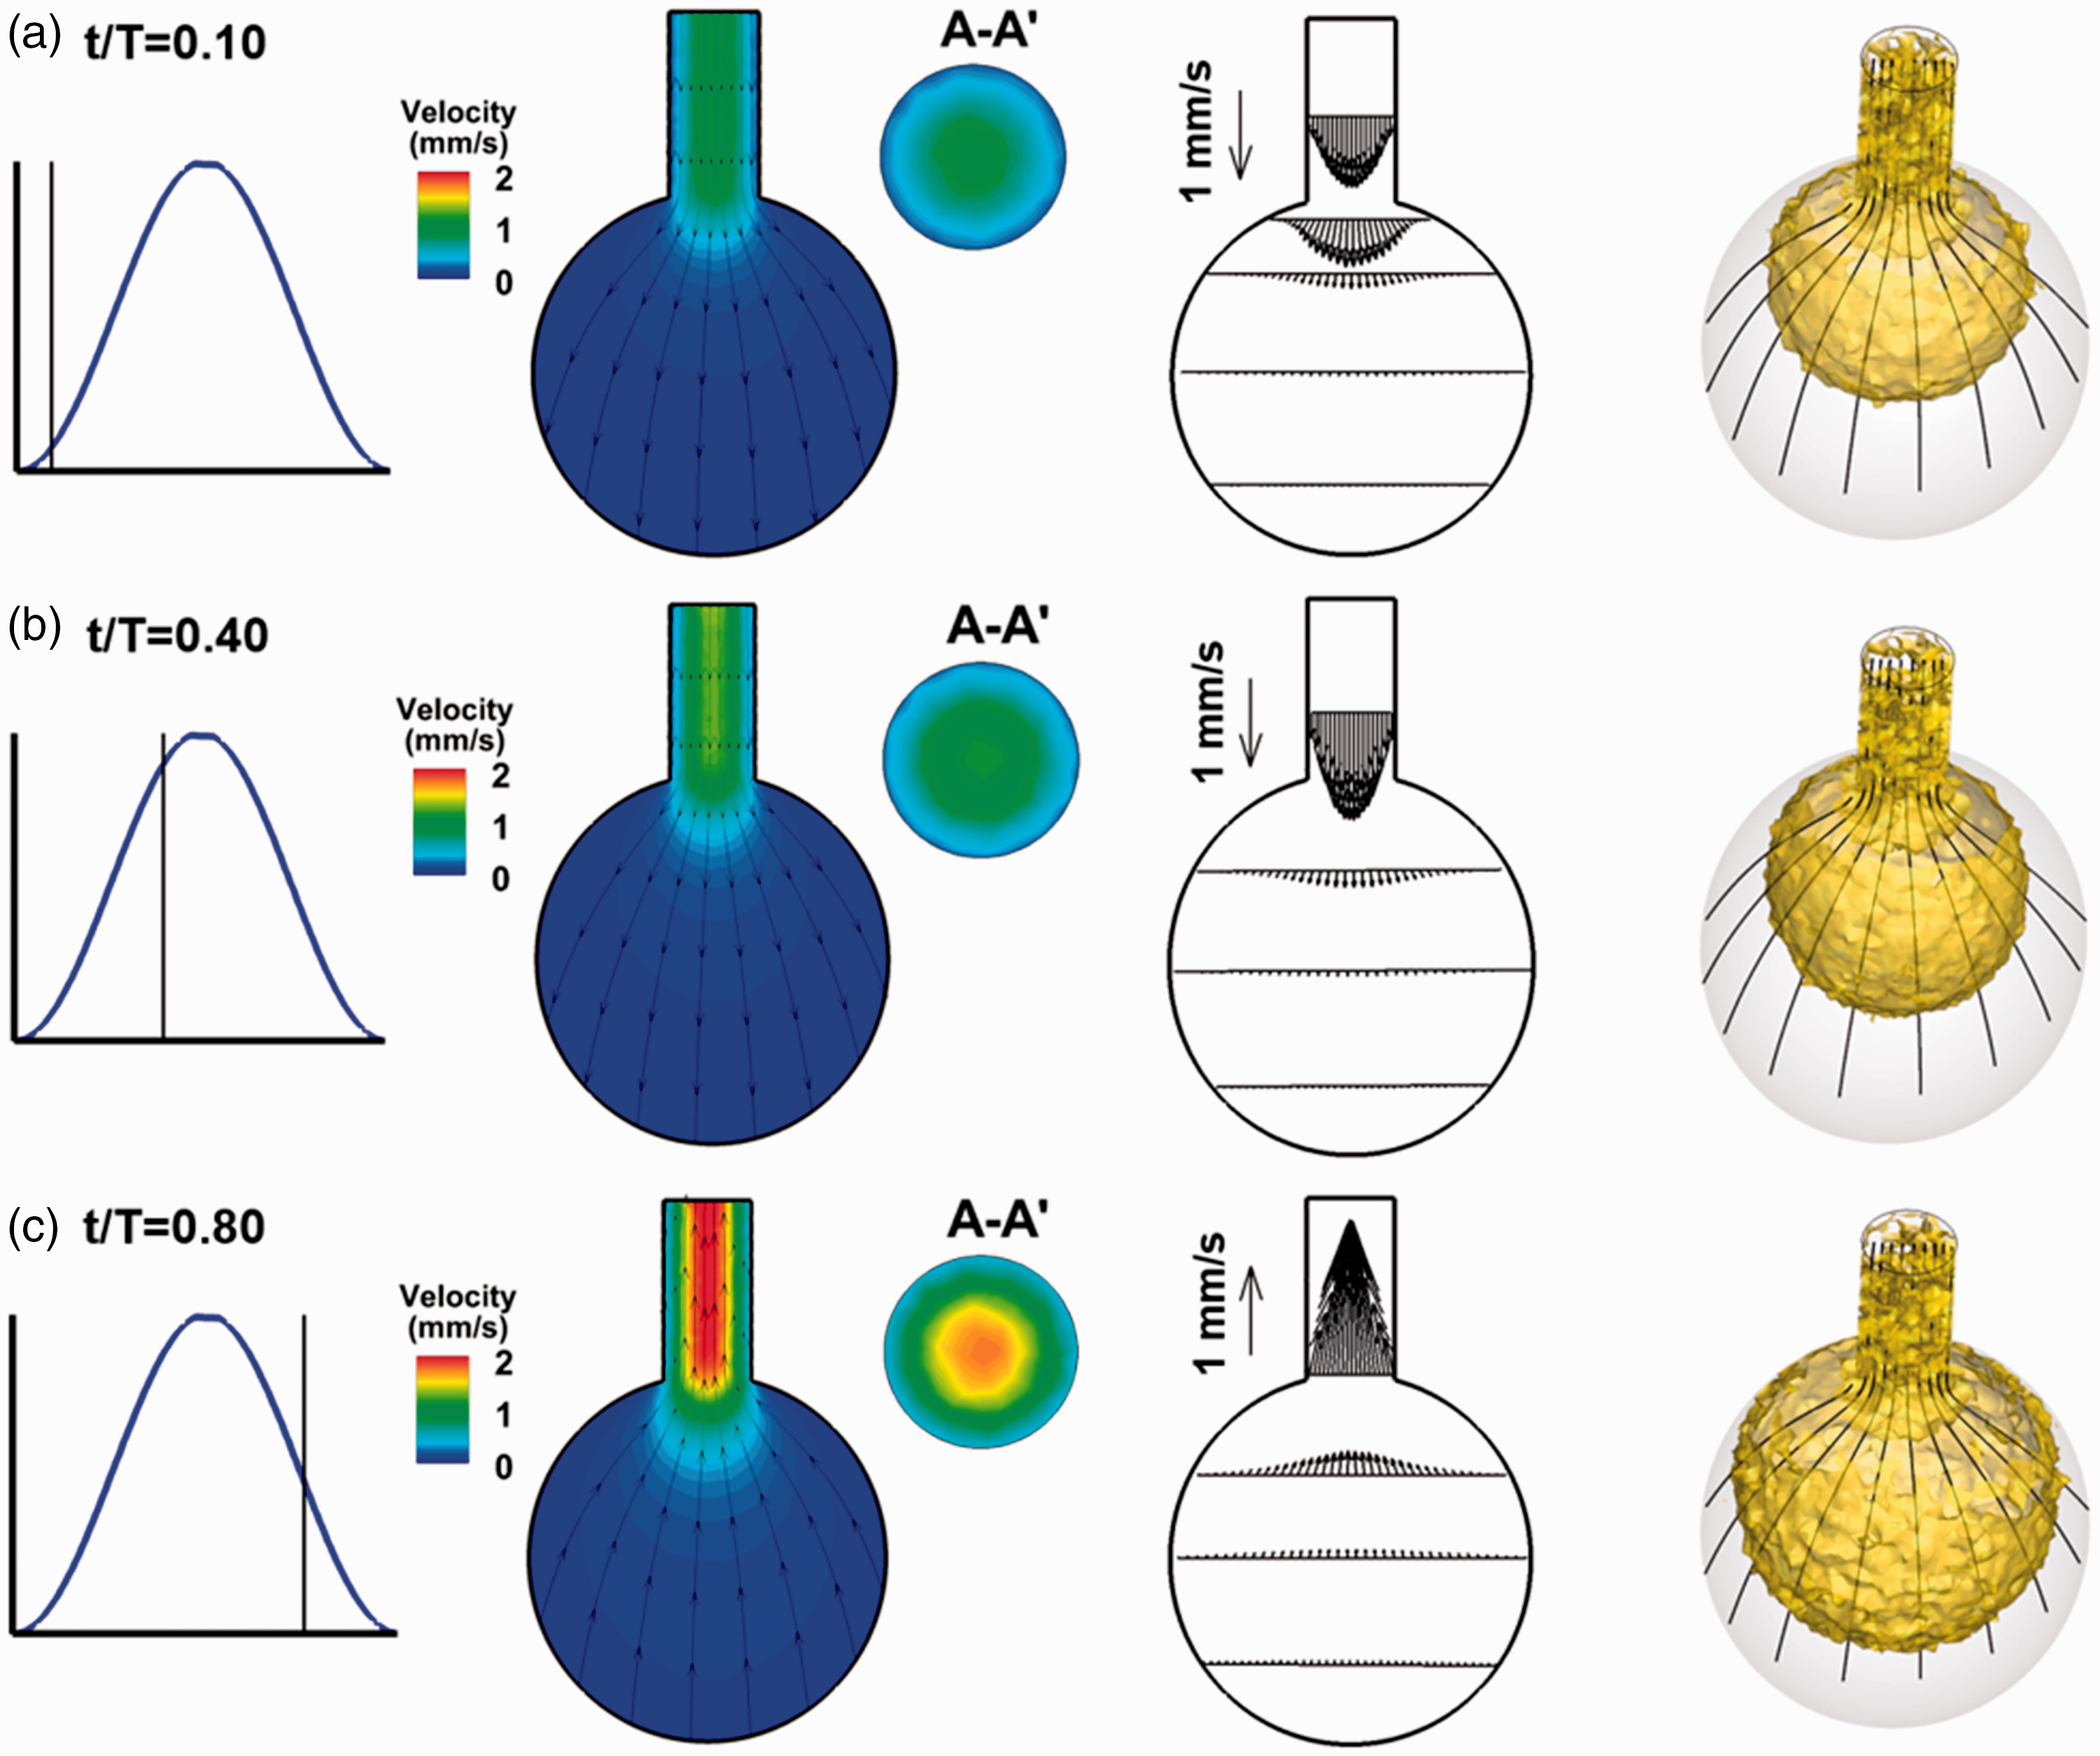
Figure 3 shows the snapshots of particles in the first four cycles after release, from particles initially entering the alveolus to particles starting to deposit on the alveolar wall. A bolus aerosol of 1000 particles (1 µm) was inhaled into the bronchiolar duct at the beginning of the inhalation and was transported by the inspiratory and expiratory flows. In the first cycle, the front of the particle swarm exhibits a parabolic shape at the beginning of the inhalation (t/T = 0.10), which is consistent with velocity profile. At the end of the first-cycle inhalation (t/T = 0.4), most particles enter the alveolus and form an approximately spherical shape. However, the front of the particle swarm is still less than halfway to the alveolus bottom. During exhalation at t/T = 0.8, particles reverse their direction and start to move backward due to the alveolar wall contraction. Due to the dramatic velocity change in the upper alveolar region, noticeable effects are expected in the first exhalation cycle, such as flow mixing, and particle dispersion. As a result, a fraction of particles is exhaled out of the alveolus. The front of the particle swarm advances progressively in the subsequent three cycles and come to the proximity of the alveolar bottom at the beginning of the fourth cycle. However, because the alveolus bottom wall also moves downward, which is faster than the settling velocities of 1 µm particles, no particle deposits in this cycle, as will be shown in Figure 4. During the second and third cycles, the particle swarm suspends inside the alveolus, which exhibits a half hemisphere shape and oscillates in phase with the rhythmically expanding and contracting wall motion. The particle suspension weakens the influences from the oscillating wall motion. Therefore, in the fourth cycle, gravitational effect becomes dominant and the particle swarm gradually shifts from the half-hemisphere shape to a cylindrical shape (Figure 3).
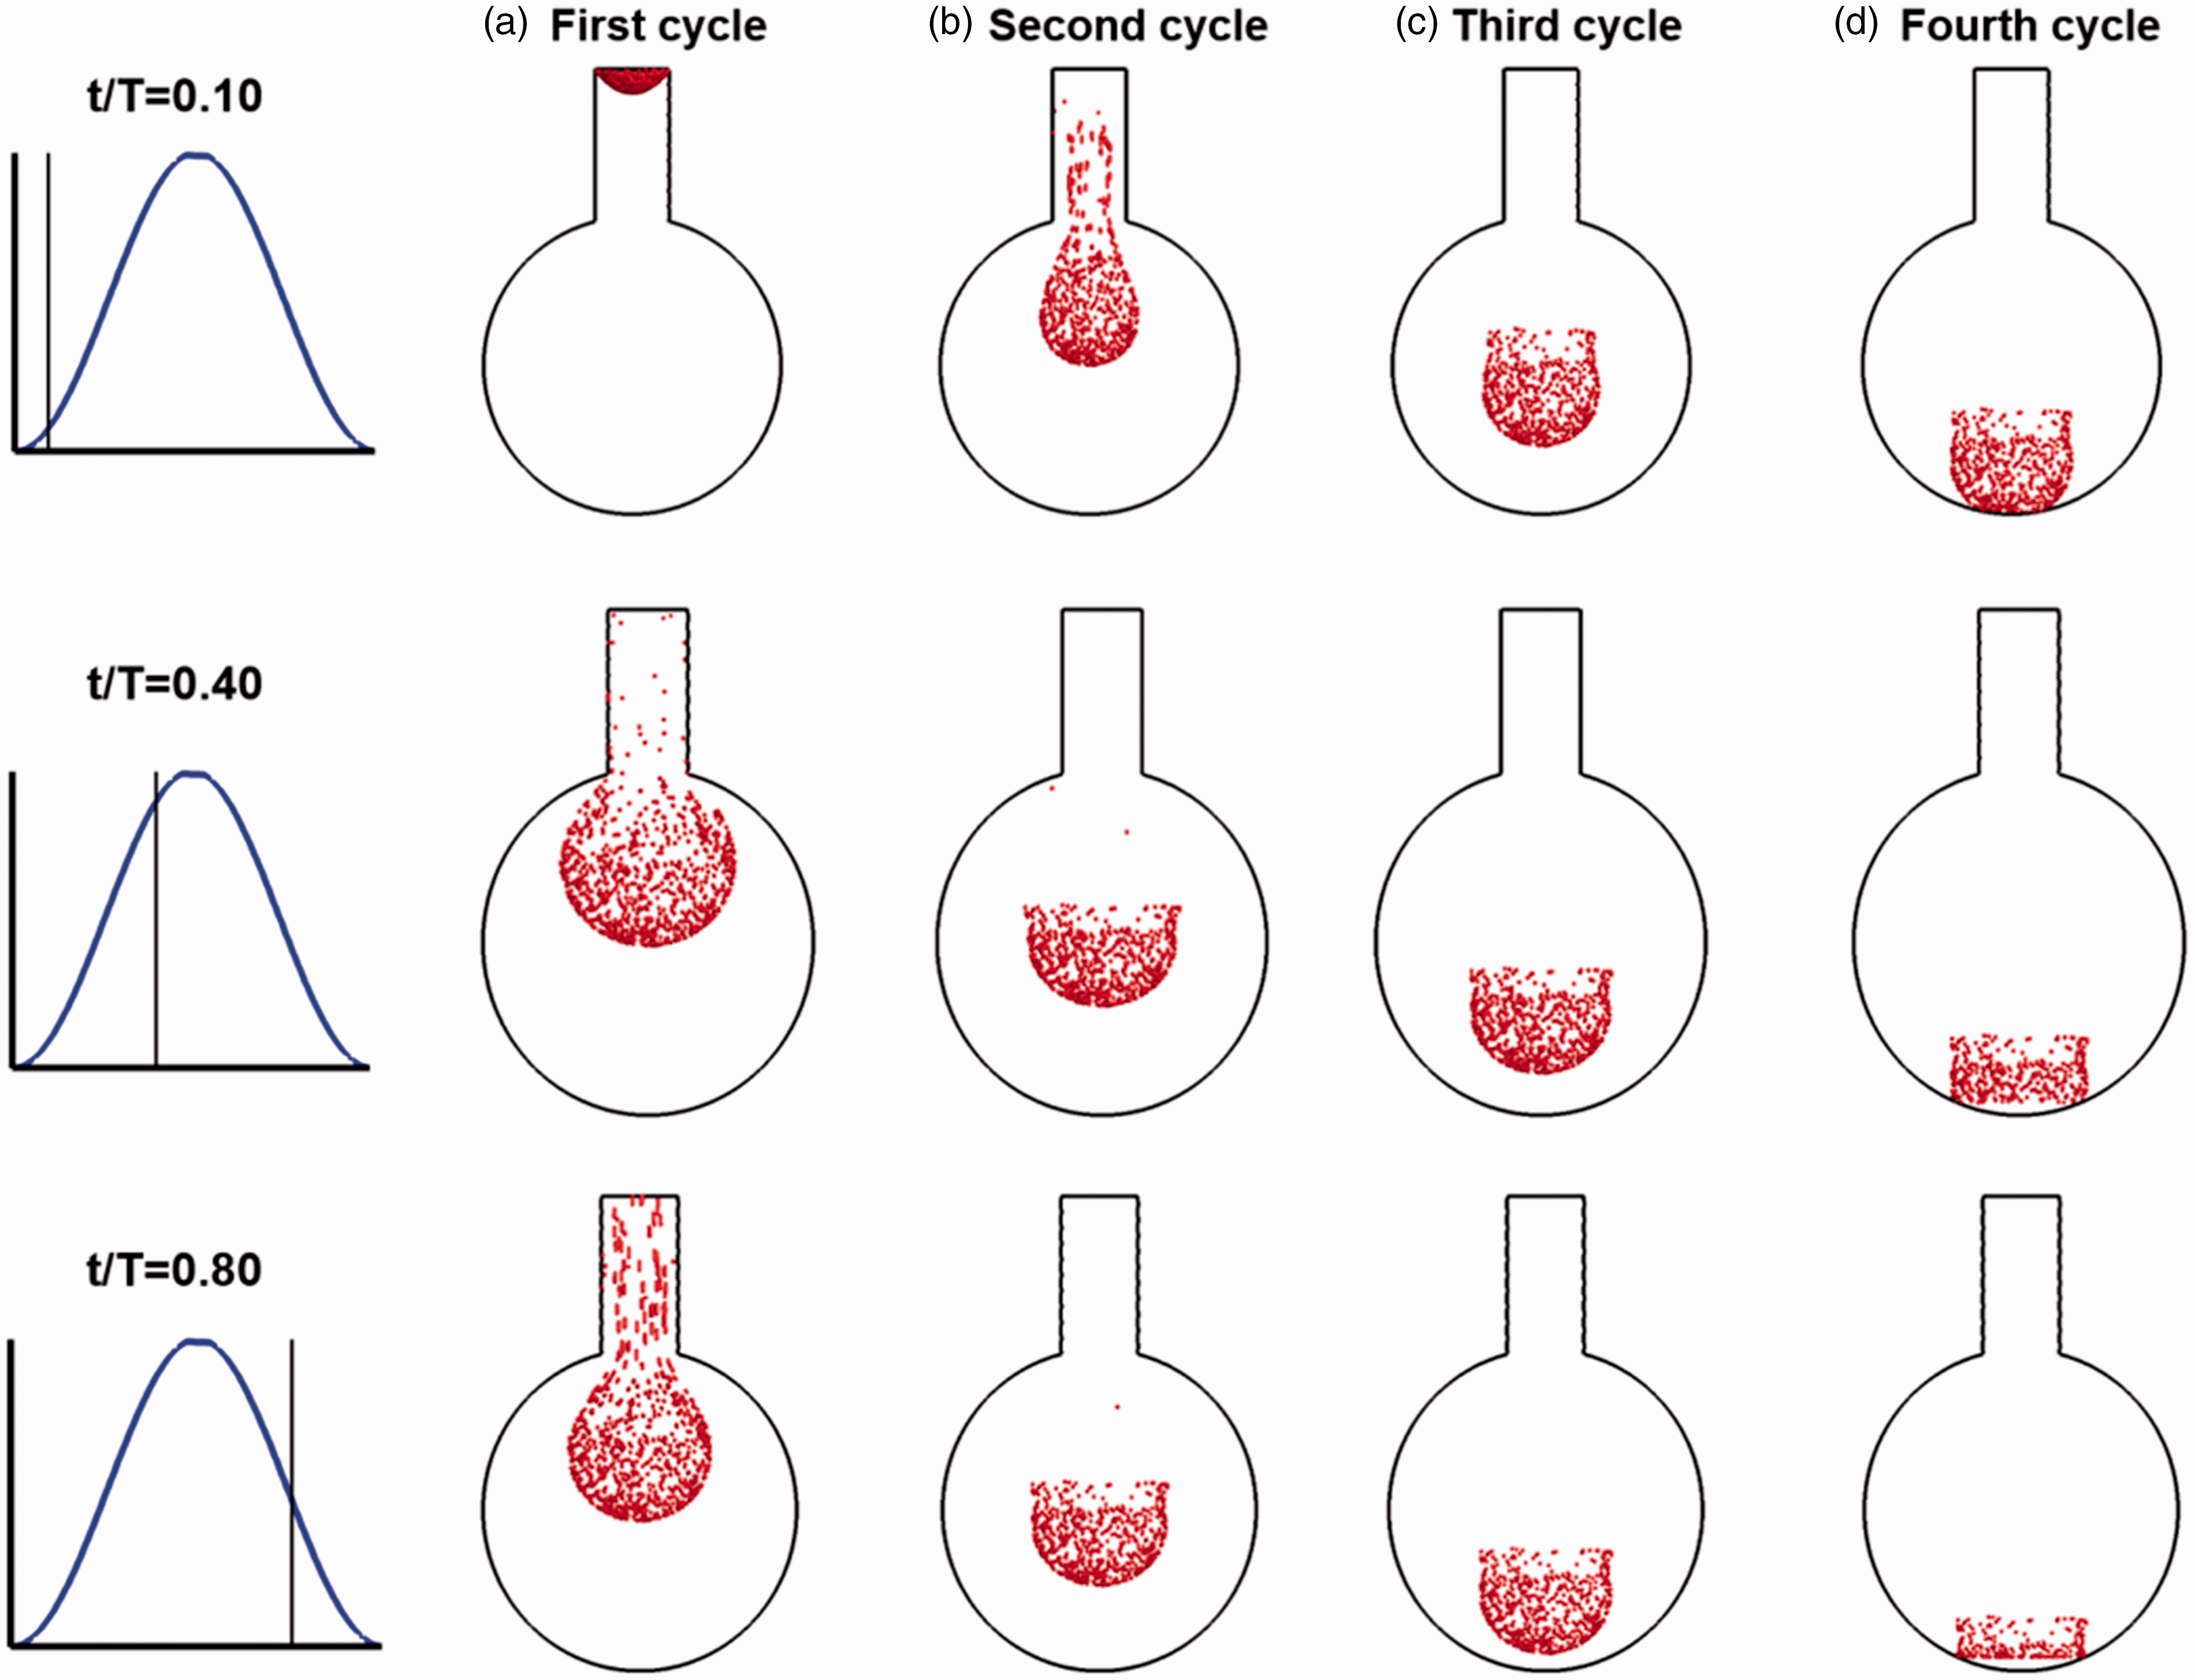
Snapshots of particle locations at different instants during the first four breathing cycles after release: (a) first cycle, (b) second cycle, (c) third cycle, and (d) fourth cycle. The three instants are corresponding to those shown in the previous figure. The upper two rows are for the inhalation phase, and the third row is for the exhalation phase. A fraction of particles was exhaled out of the alveolus-duct geometry at the end of the first breathing cycle.
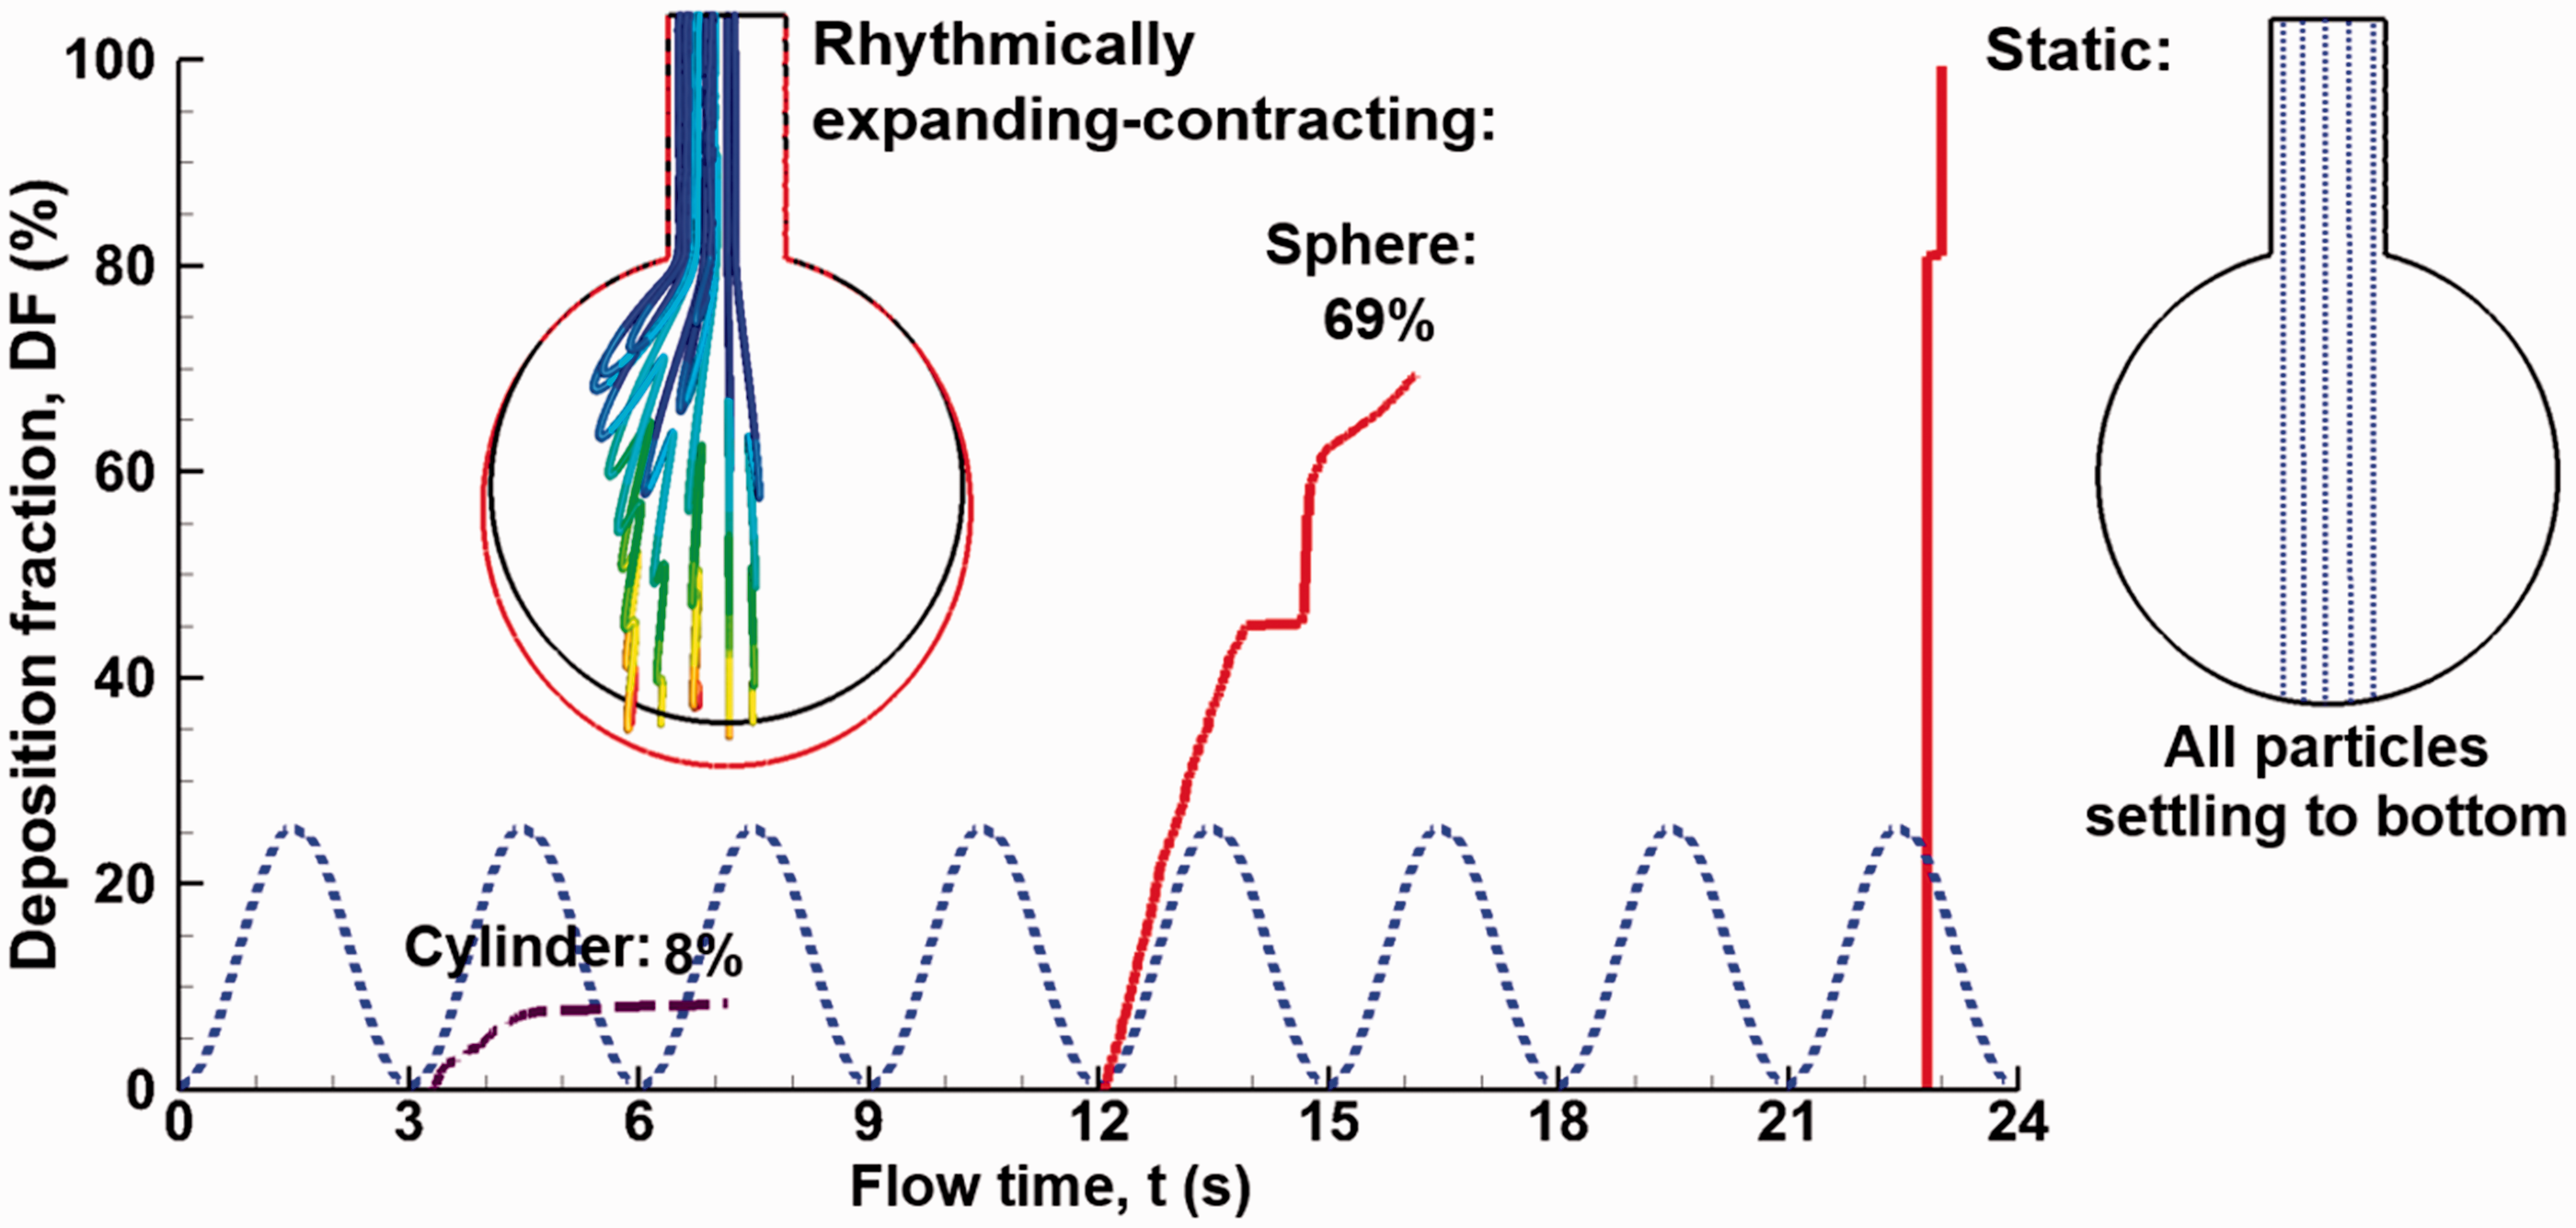
Comparison of the time evolution of the alveolar deposition rates and particle trajectories in a dynamic and static alveolus for 1 µm particles.
The particle dynamics is further visualized using particle trajectory as a function of time and breathing cycles, as illustrated in Figure 4. Zig-zag motions (or particle folding) were observed for all particles considered, with each fold representing an expansion-contraction cycle. The length of the fold is larger at initial breathing cycles and becomes shorter at subsequent cycles, indicating that the influence of the higher speed duct flow on particle motion decreases at later breathing cycles.
An interesting phenomenon was observed when comparing the behavior and fate of inhaled particles between a dynamic and a static sac model. The rhythmical motion of the alveolar wall induced faster (12.5 s vs. 19.5 s after release) but lower (69% vs. 100%) depositions of 1 µm particles in the alveolus (Figure 4). It is noted that particles were released at the beginning of the second cycle (t = 3.0 s), allowing the first cycle to establish the flow field inside the alveolus. While particles in the dynamic alveolus travel with zig-zag motions, particles in the static alveolus descend steadily to the alveolar bottom under the influence of gravity. The zig-zag motions induce repeated particle depositions in the expanding-contracting alveolus. By contrast, there is no particle deposition until 19.4 s after release in the static alveolus; after that, all particles quickly settle onto the alveolar bottom. Considering the conventional practices of using settling velocity to estimate the alveolar size (equivalent to assuming static alveoli), the striking differences between the static and dynamic alveoli in Figure 6 call for a deeper understanding of particle transport and deposition in the rhythmically oscillating alveoli.
Influencing factors on bolus alveolus deposition
Effect of post-inhalation breath-holding
The airflow in the alveolus during breath-holding is not stagnant. Instead, two regions of higher velocities are observed in Figure 5(a), with one above the sphere center and the other below the sphere center. A ring-shaped vortex forms in the alveolus (Figure 5(b)) due to the downward inertia of the inhaled air and the resistance from the non-moving alveolar bottom wall during the post-inhalation breath-holding. The ring-shaped vortex started approximately 0.25 s after the inhalation and lasted about 0.15 s before it broke into scattered vortices, which gradually disappeared. Due to the much lower swirling velocities (∼1 × 10⁻⁷ m/s) than the particle settling velocities (2.9 × 10⁻⁵ m/s for 1 µm particles), little effects on particle motions are expected from this vortex motion. The particle motion exhibits only one staggering trajectory (Figure 5(c)), in contrast to the multiple staggering trajectories in the absence of breathing-holding (Figure 4).
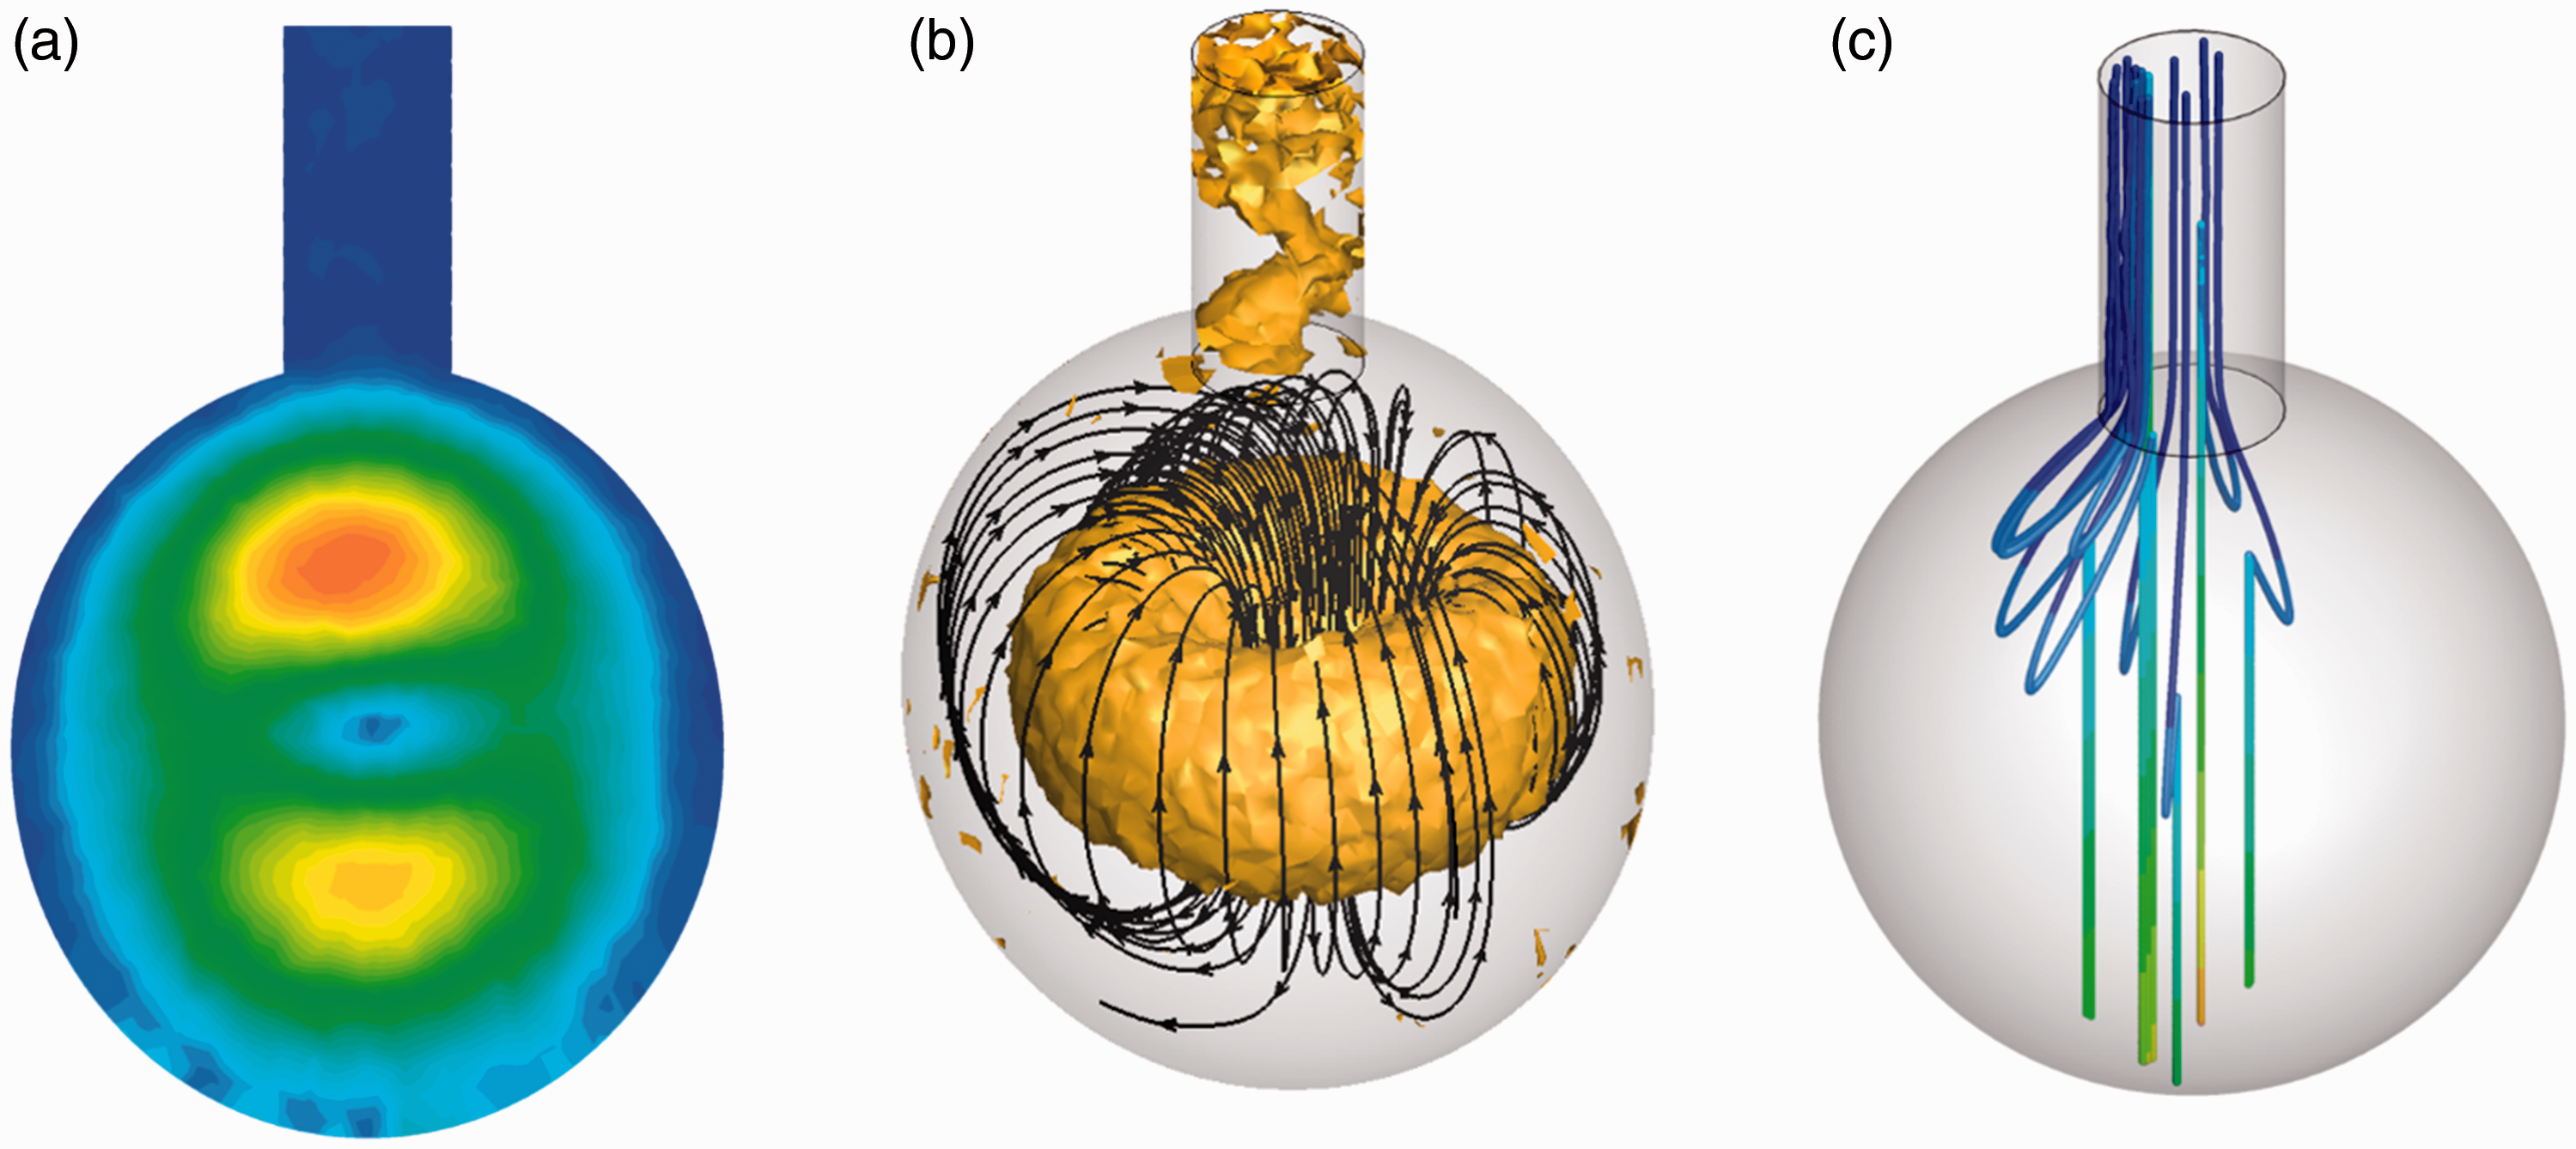
Airflow topologies and particle motions in an alveolus during breath-holding at the end of inhalation: (a) velocity contour, (b) vortices and streamlines, and (c) particle trajectories.
Post-inhalation breath-holding noticeably increased the DF for 1 µm particles (Figure 6). Holding breath for 2 s enhanced alveolar deposition from 69.1% to 82.3%, while holding 4 s enhanced the deposition to 90%. This deposition increase results from the longer time for particles to move downward before the alveolar wall starts to contract.
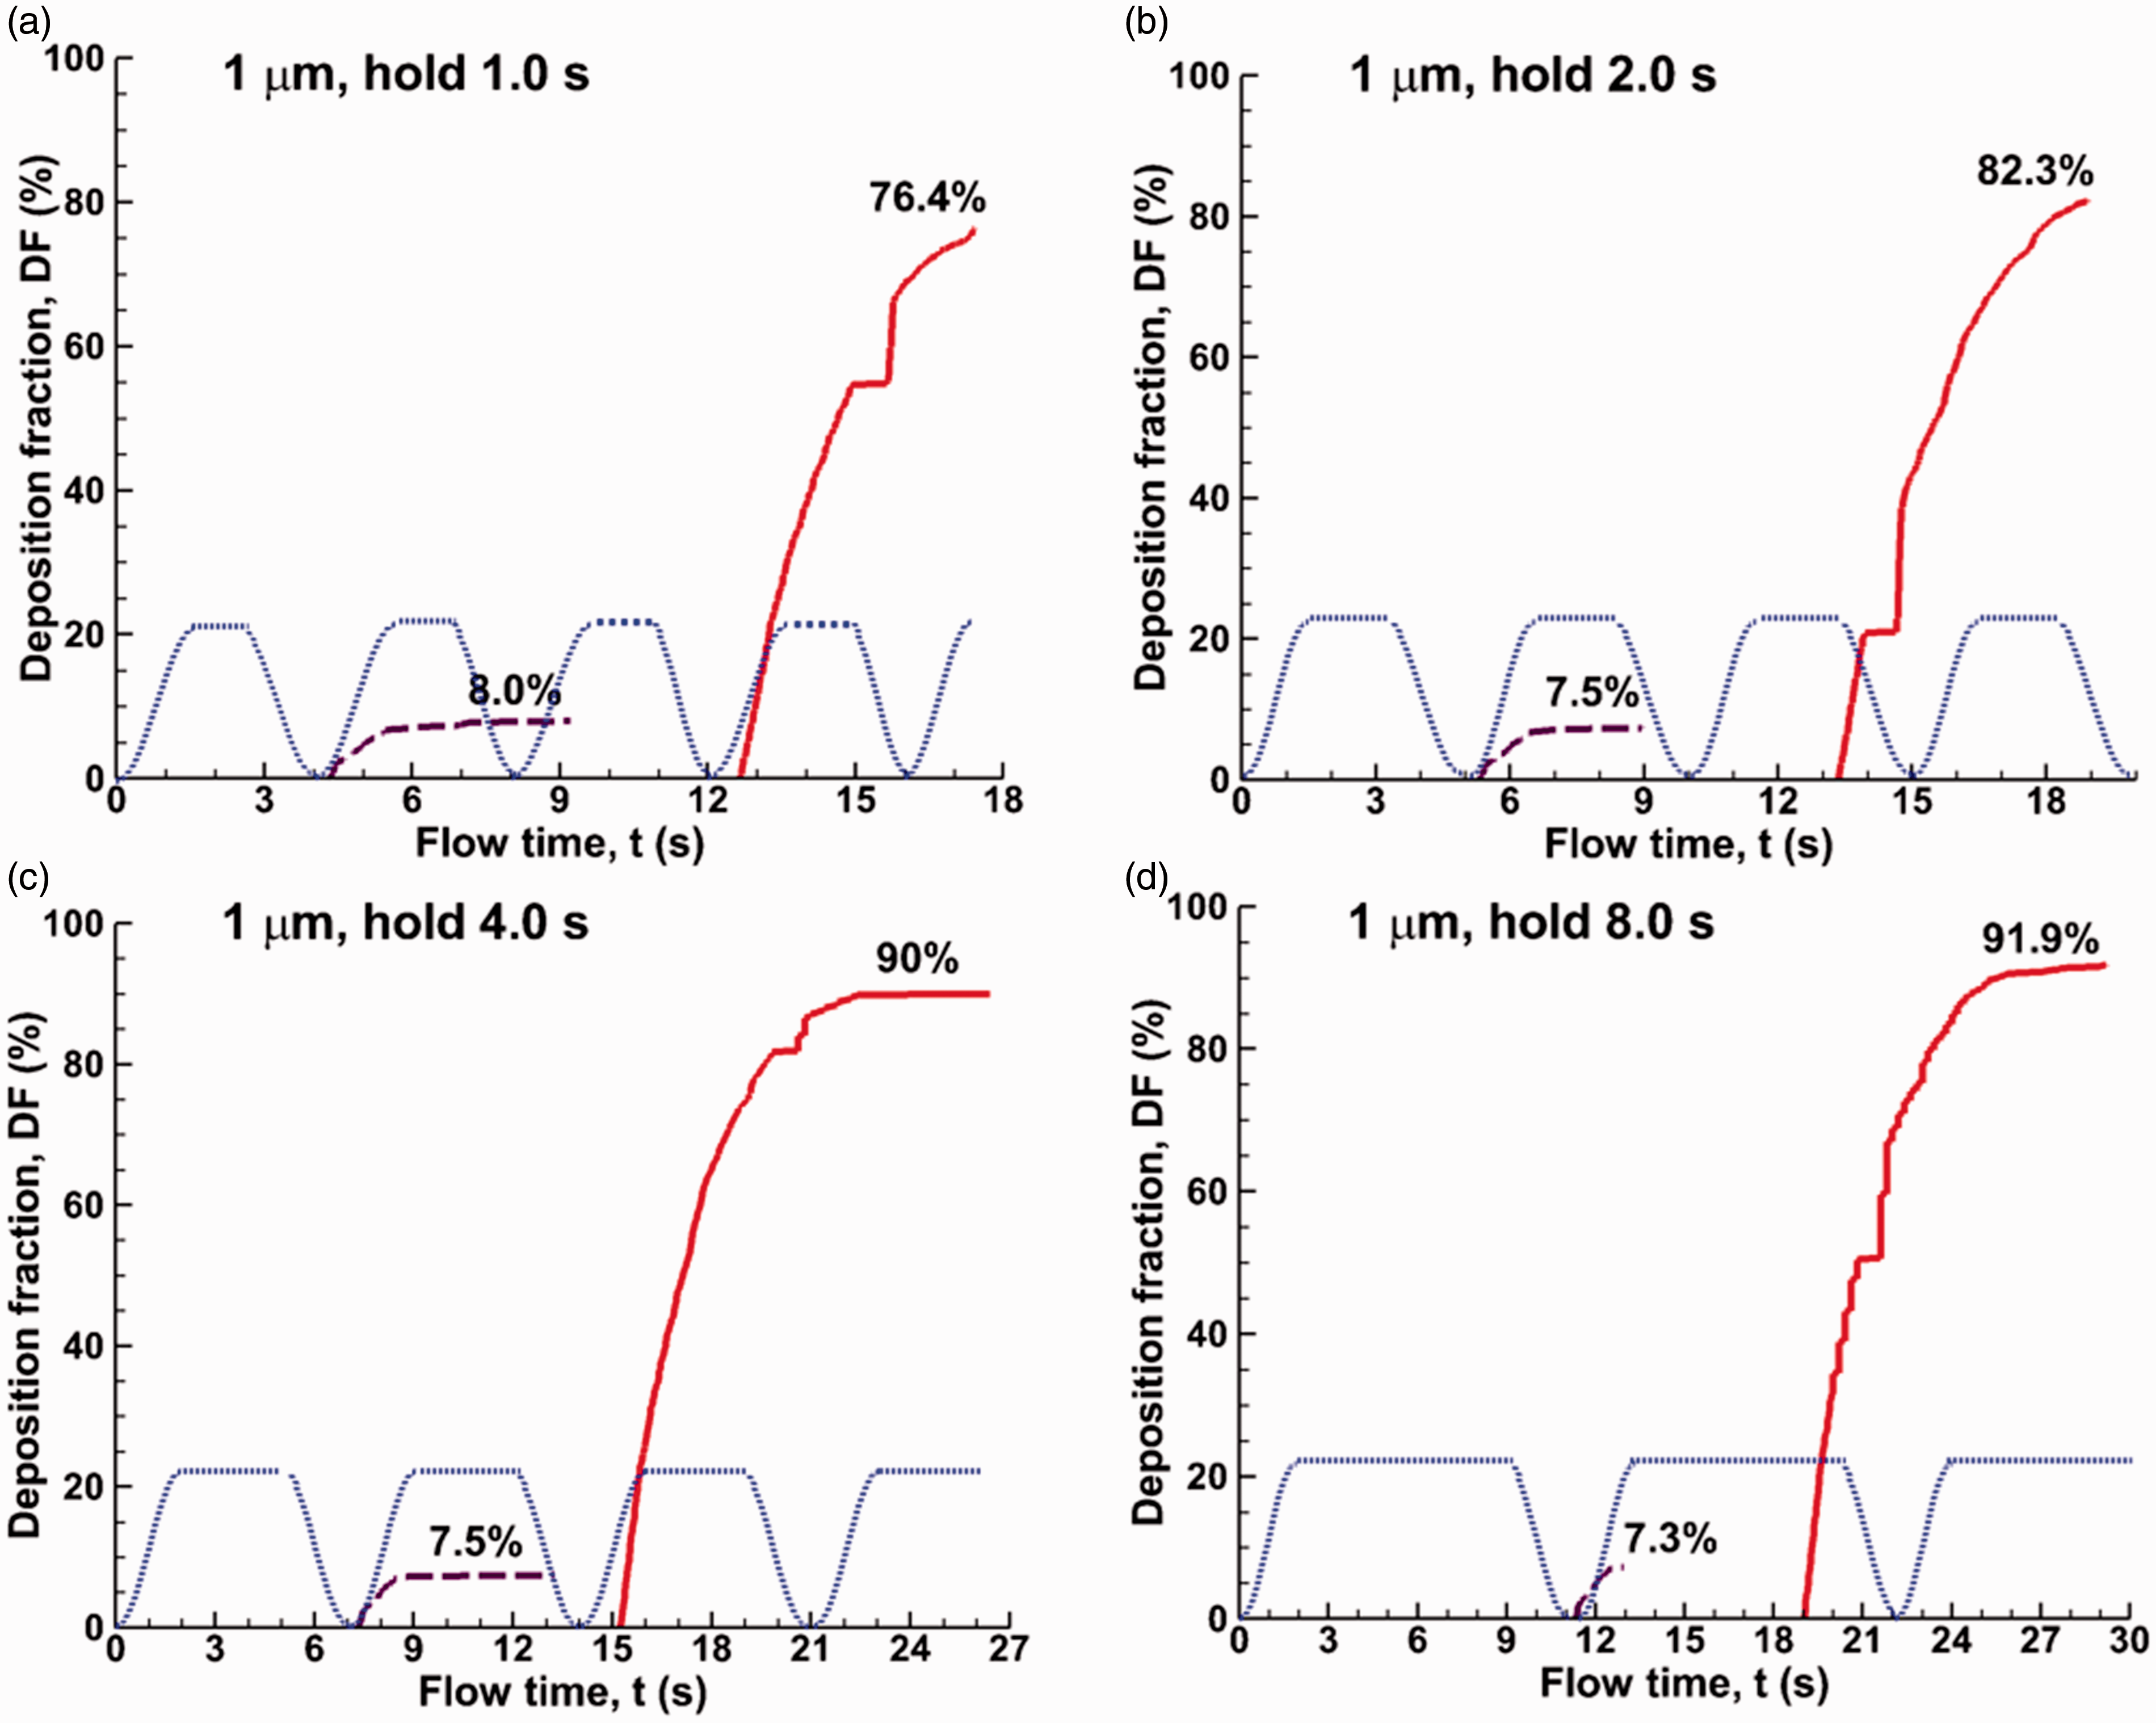
Comparison of time evolution of the alveolar deposition rates of 1 µm particles for varying periods of post-inhalation breath-holding: (a) 0 s, (b) 0.5 s, (c) 1.0 s, (d) 2.0 s, (e) 4.0 s, and (f) 8.0 s.
The effect of post-inhalation breath-holding on particle deposition of 2 µm particles is shown in Figure 7. Little/no increase in DF was added by post-inhalation breath-holding for 2 µm particles as particles deposit fully without breath-holding. The gravitational force dominates over the flow force and leads to full deposition regardless.
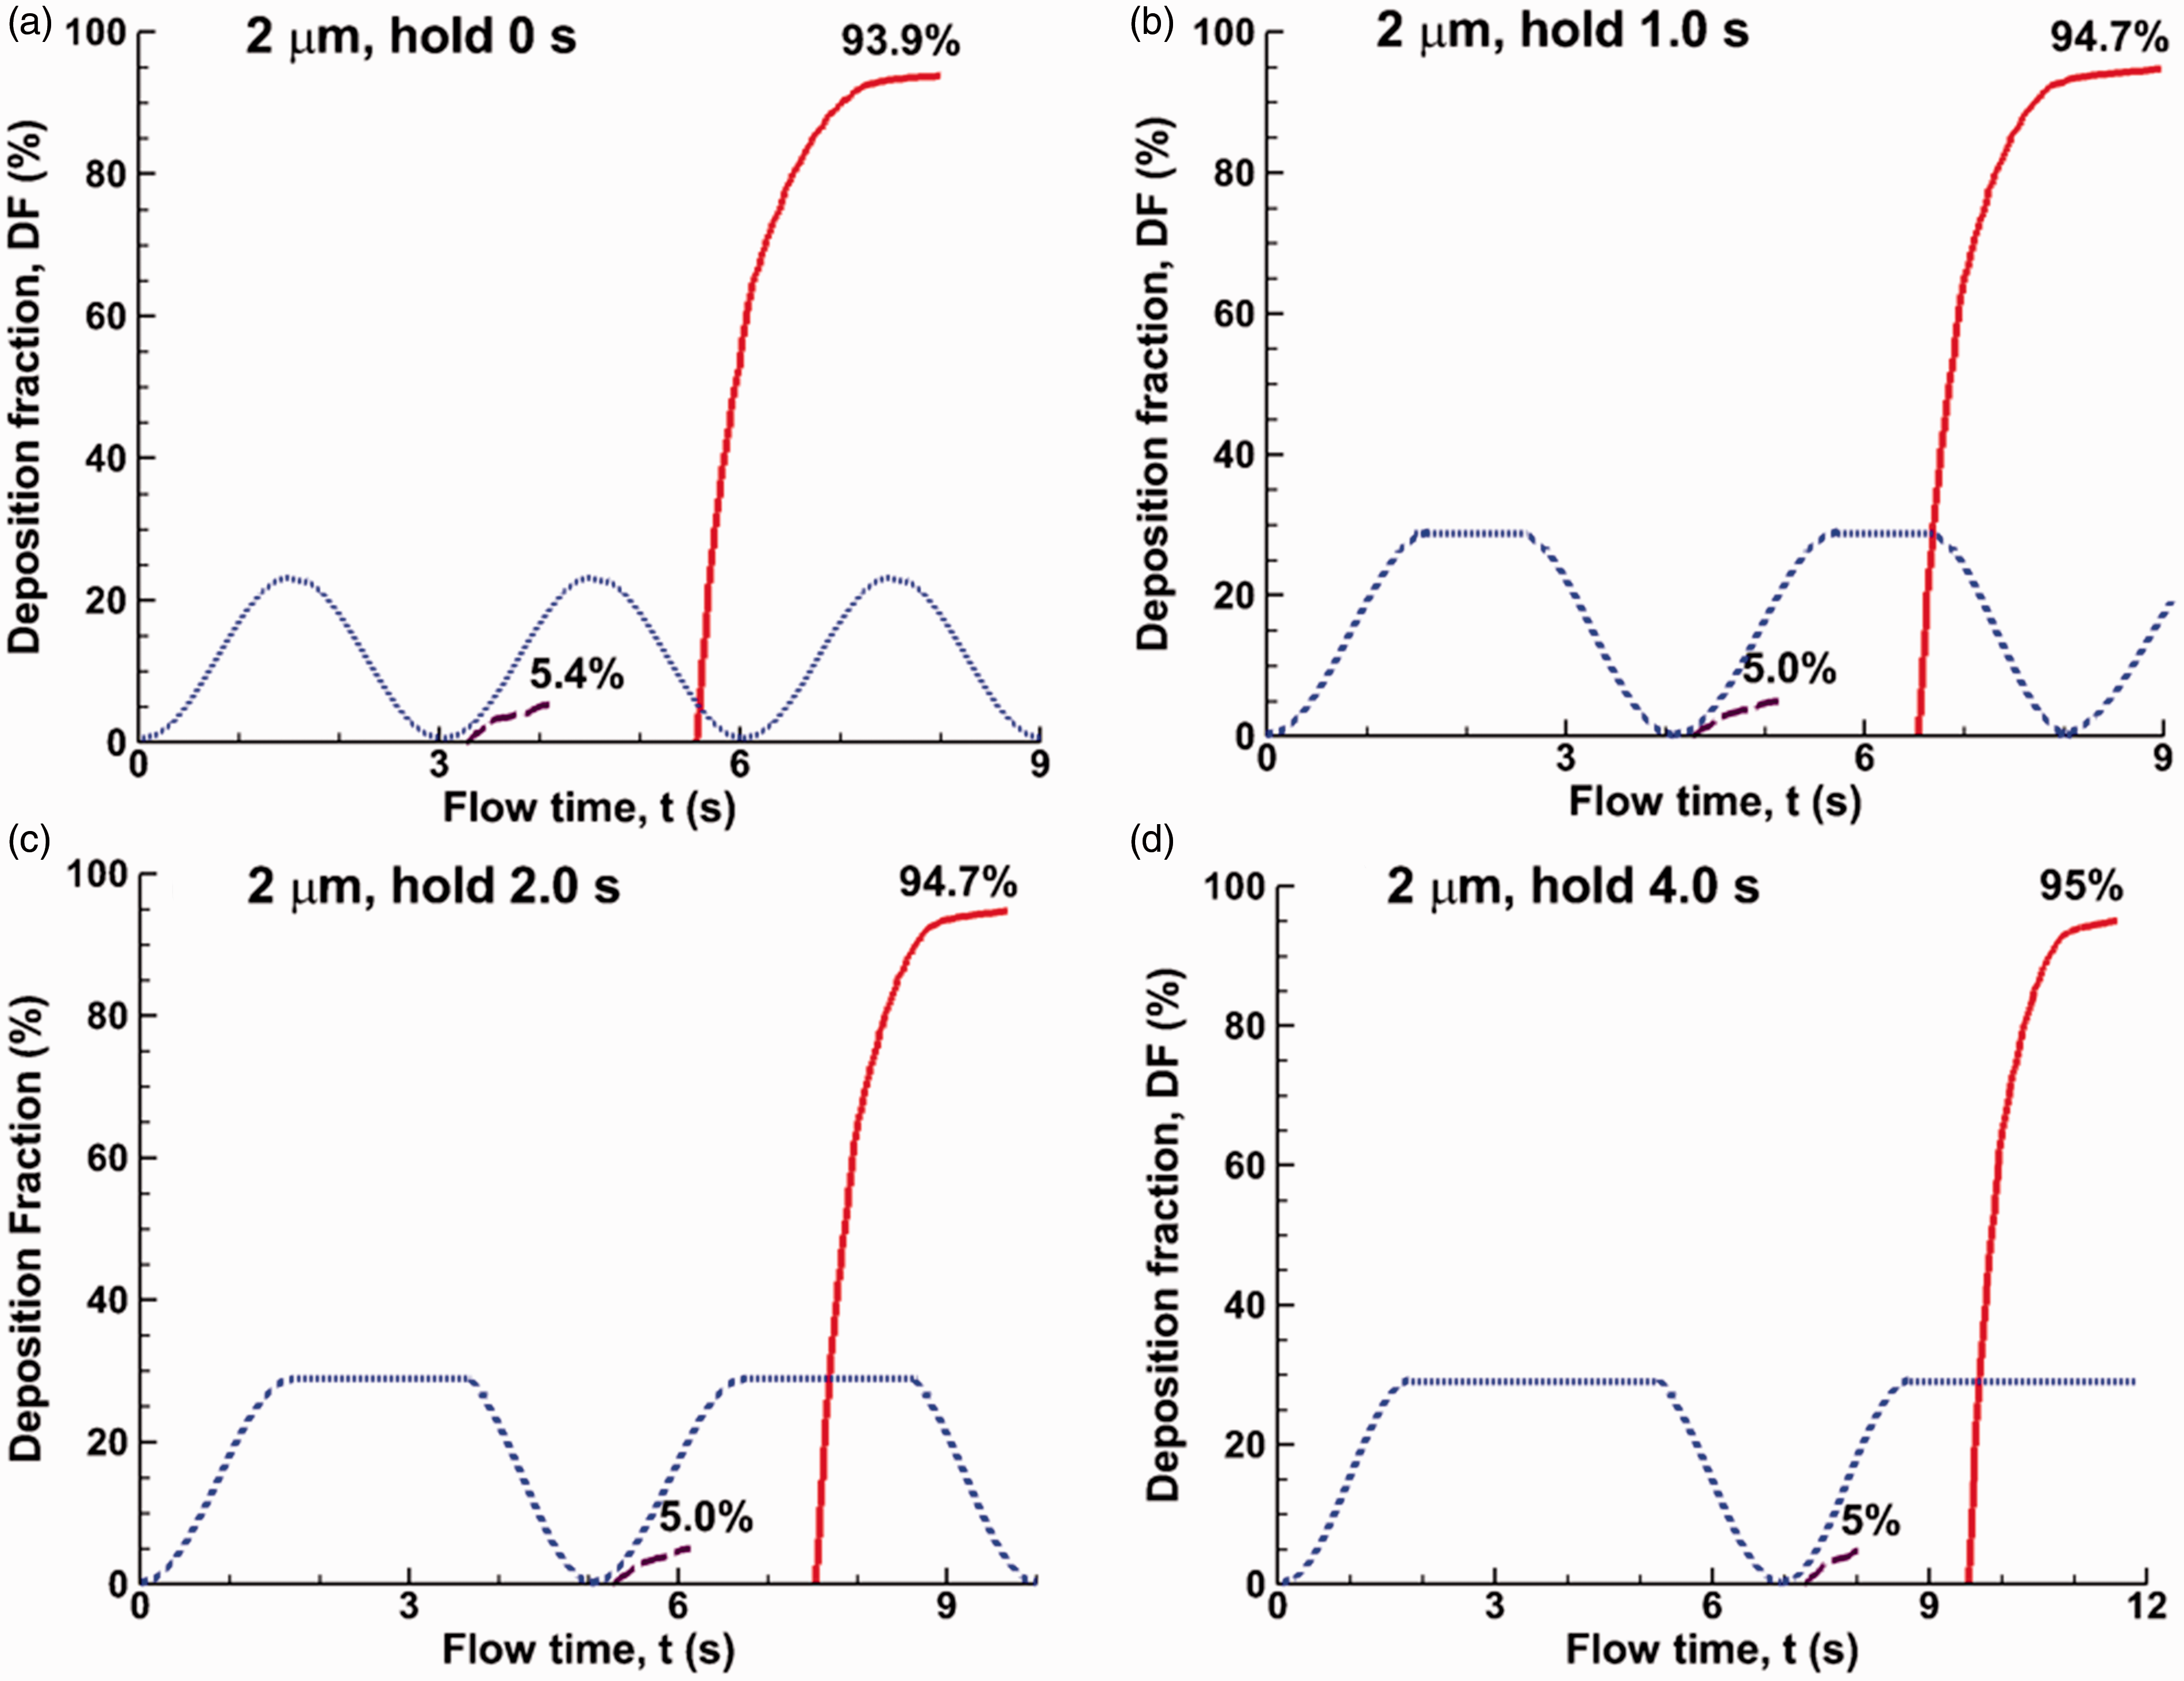
Comparison of time evolution of the alveolar deposition rates of 2 µm particles for varying periods of post-inhalation breath-holding: (a) 0 s, (b) 0.5 s, (c) 1.0 s, and (d) 2.0 s.
Effect of particle release time
Time evolution of the alveolar deposition is shown in Figure 8(a) to (c) for 1-µm bolus aerosols released at different instants. A progressive decrease in bolus DF was observed over particle release time tR during the inhalation cycle. This is expected considering that there is a less downward impulse from the alveolar wall expansion, which promotes particle deposition; on the other hand, the upward impulse, which is gained from the wall contraction and promotes particle escape, keeps unchanged regardless of the particle release time. Similarly, the onset of deposition delays with a later particle release, which starts from the beginning of the fifth cycle when releasing at 0.2 s, while from the middle of the fifth cycle when released at 0.6 s (Figure 8(a) vs. (c)). The variation of the final alveolar deposition of a bolus aerosol vs. aerosol release time is plotted in Figure 8(d). In contrast to a gradual decrease in alveolar deposition in the range of tR = 0–0.6 s, the deposition decreases dramatically for aerosols released after 0.6 s. No particles deposit if released after 0.8 s, which just passes the peak of inhalation. This indicates that the downward impulse gained through the alveolar wall expansion and gravity in the period between tR and 1.5 is outweighed by the upward impulse gained through the wall contraction in the entire exhalation cycle.
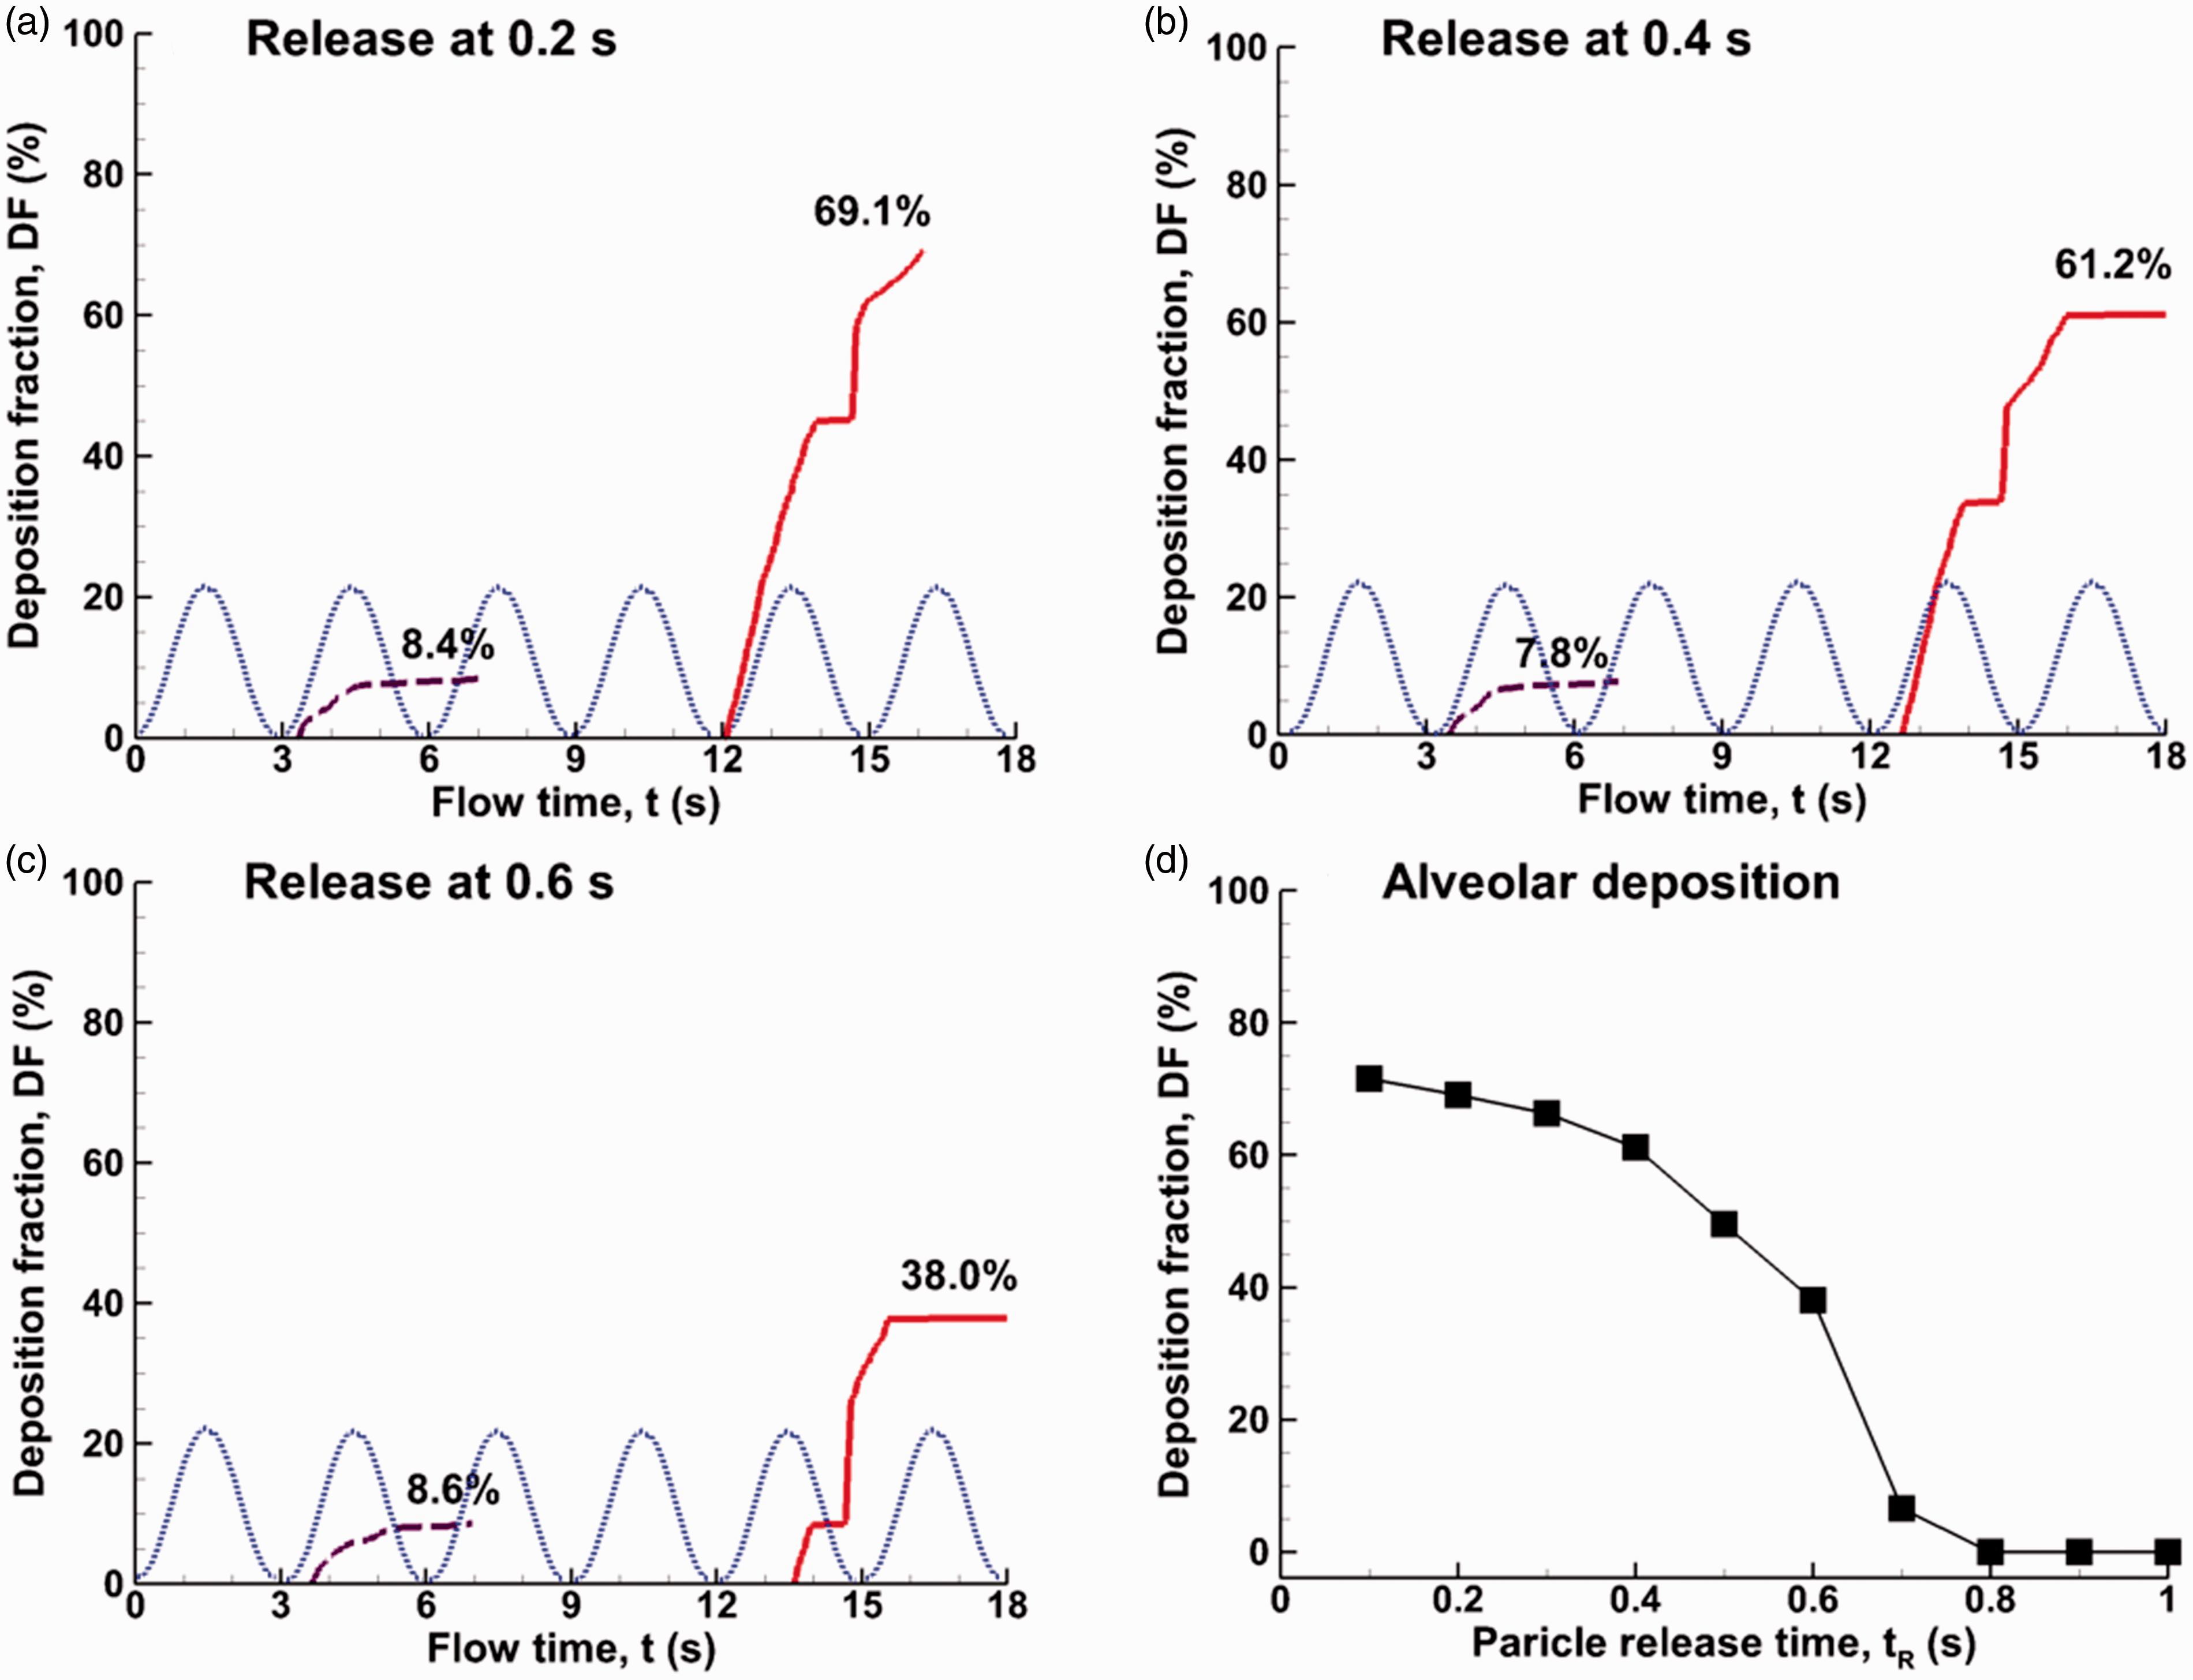
Time evolution of the alveolar deposition of 1 µm particles that were released at different instants from the beginning of the inhalation: (a) 0.2 s, (b) 0.4 s, and (c) 0.6 s. The variation of the final alveolar deposition as a function of the particle release time is shown in (d).
Effect of alveolar size
The effects of alveolar size on particle transport and deposition are shown in Figure 9 for bolus aerosols released at the beginning of the first cycle. Three geometrically similar alveoli (d = 0.2 mm, 0.6 mm, and 0.8 mm) were considered in addition to the 0.4-mm-diameter alveolus, with an identical expansion ratio (ΔV/V0 = 0.233) for all alveoli considered. Compared to the case of the 0.4-mm-diameter alveolus, a smaller (0.2-mm diameter) alveolus yields a higher deposition rate (82.1% vs. 69.1%) and earlier deposition onset (7.7 s vs. 12 s), as illustrated in Figure 9(a) vs. (b). Conversely, increasing the alveolar diameter decreases the deposition rate and postpones the deposition onset. Reminding that particles are exhaled out of the alveolus only when they are in the upper alveolar region (during the first or second exhalation phases), where airflows are perceivably influenced by the oscillating wall motion. There may exist one line, above which particles are potentially exhaled out and beneath which particles are most likely settling to the bottom wall by gravity. Put in another way, above this line (upper alveolar region), the aerodynamic effects induced by the oscillating wall prevail over the gravitational effects, while below this line (lower alveolar region), the aerodynamic effects from the oscillating wall motion are less significant than the gravitational sedimentation. For a geometrically similar but larger alveolus, the size of this aerodynamically affected (upper alveolar) region is similarly larger, which takes the particles more time to get through by gravitational settling and therefore particles are more likely to be exhaled out.
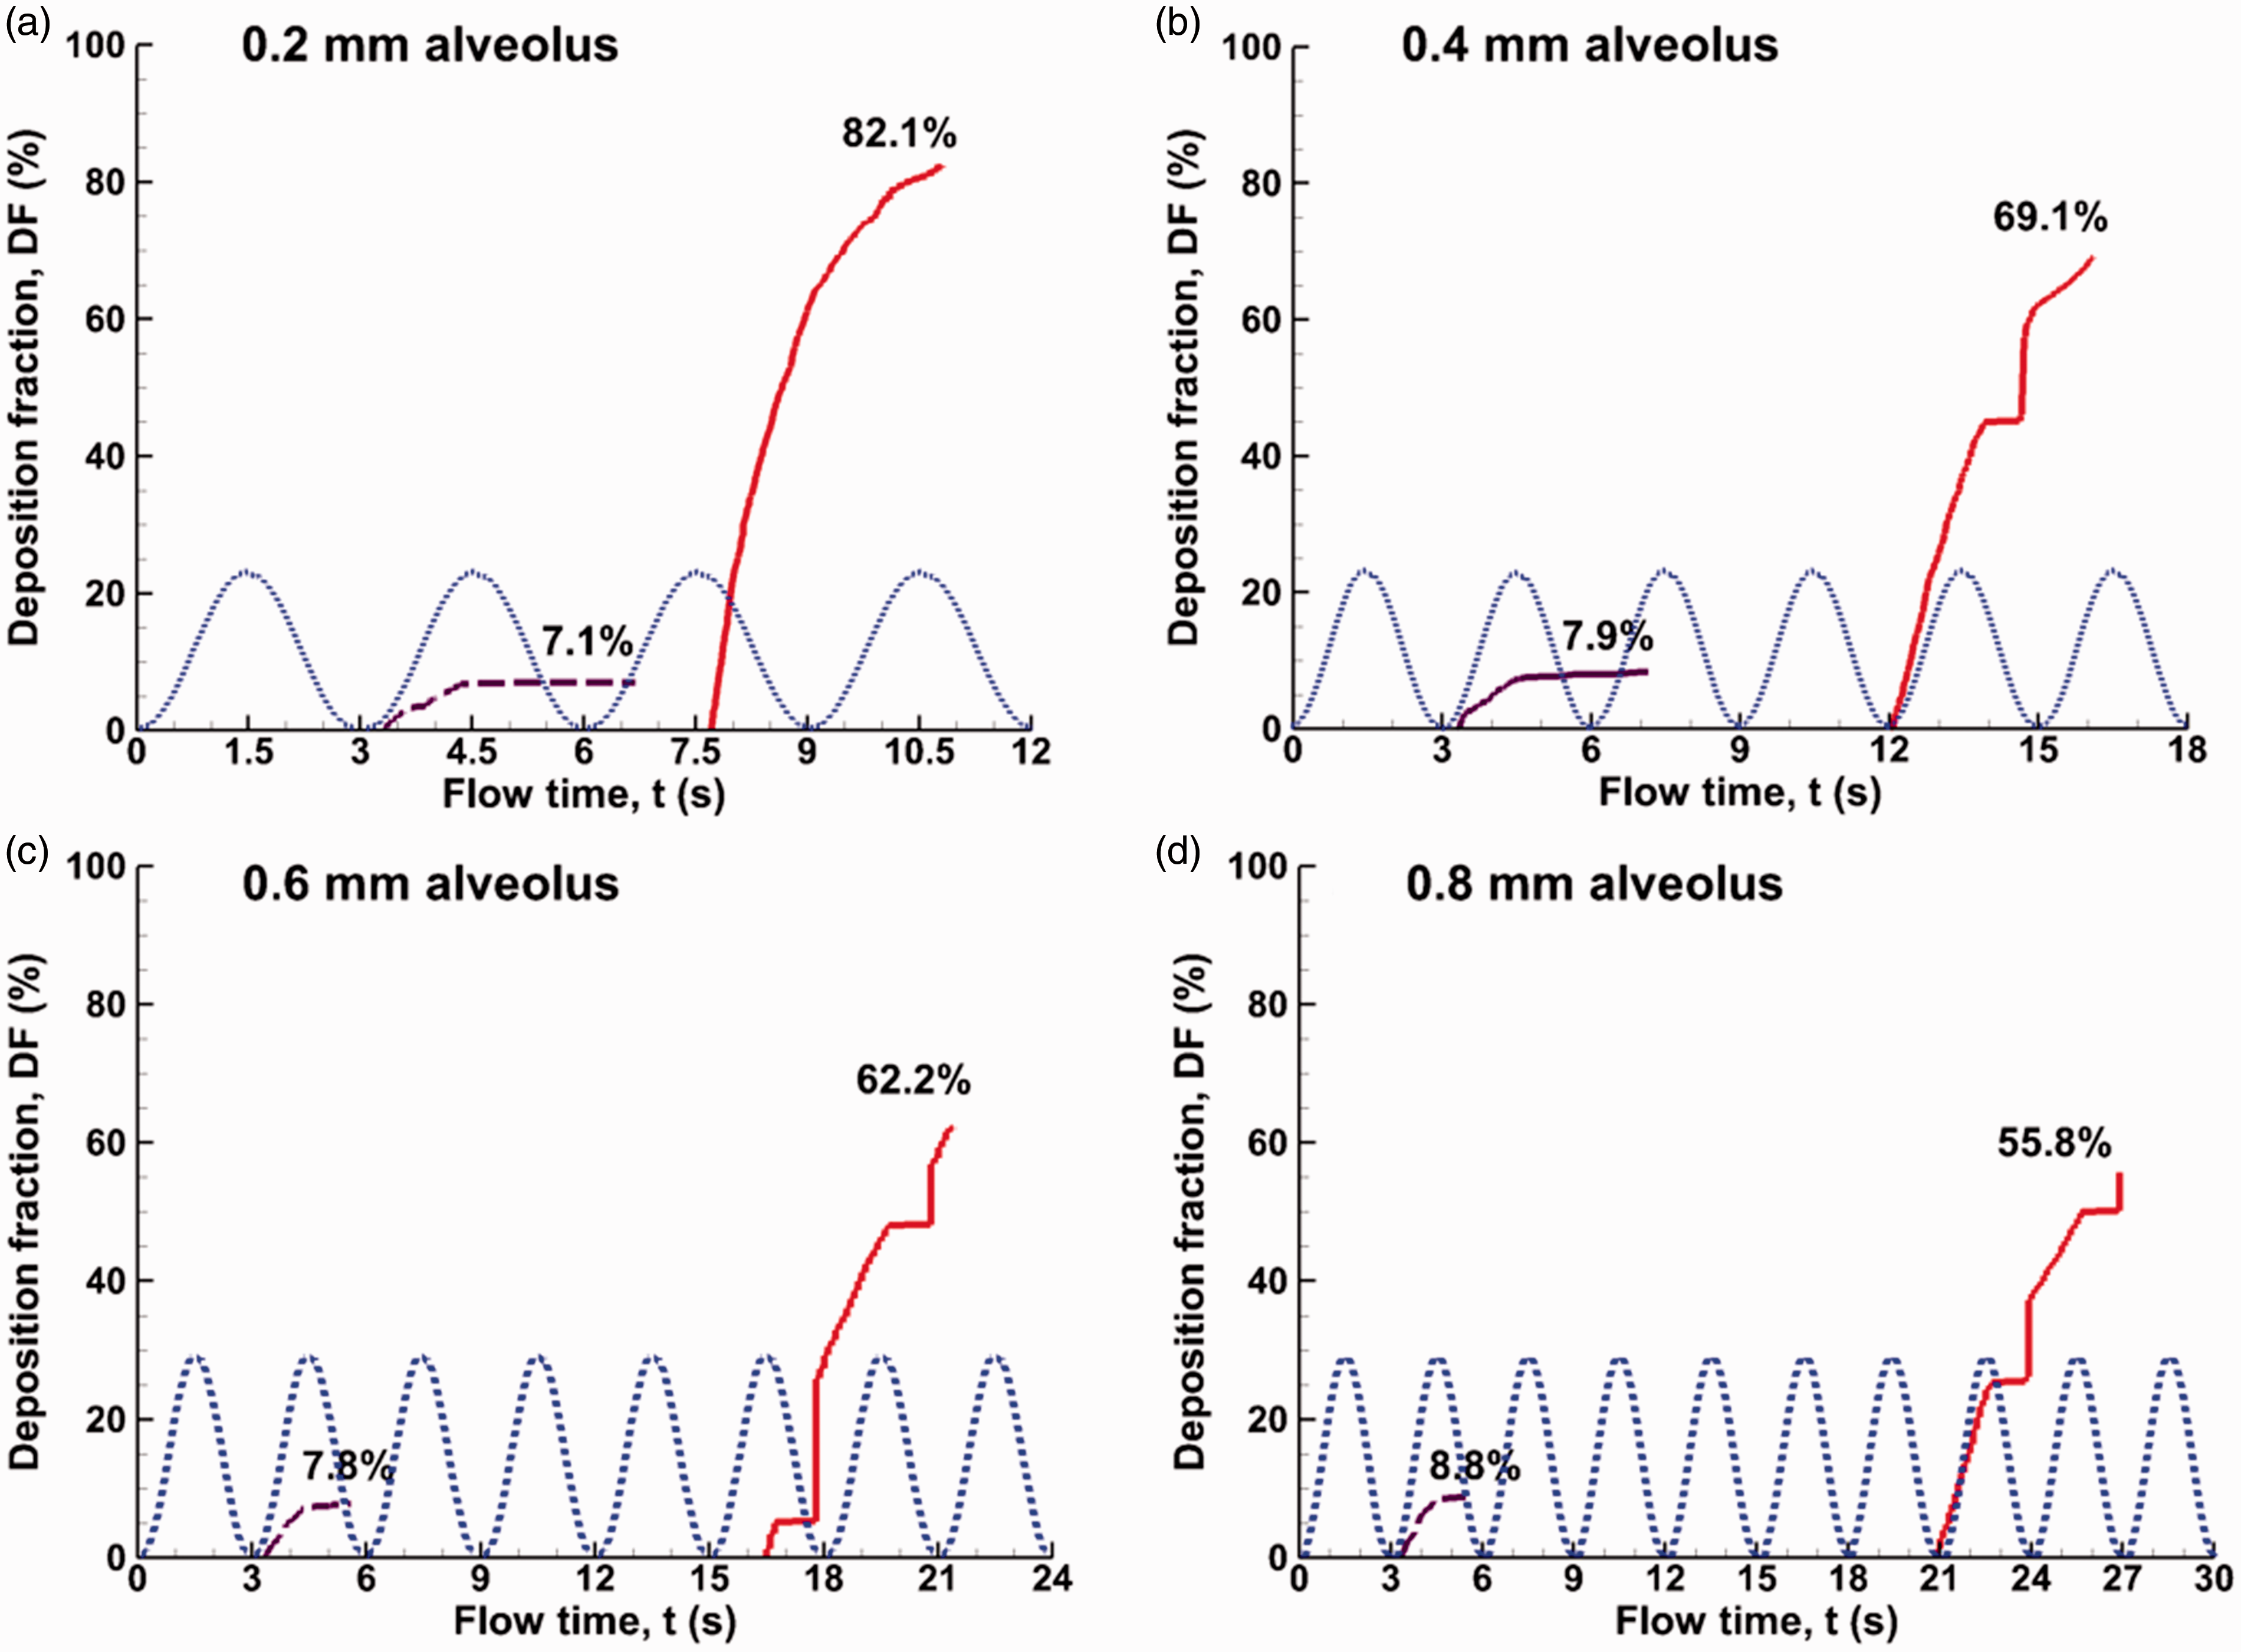
Time evolution of the alveolar deposition of 1 µm particles released at 0.2 s in the alveoli of different diameters: (a) 0.2 mm, (b) 0.4 mm, (c) 0.6 mm, and (d) 0.8 mm.
Develop an alveolar size-sensitive correlation for bolus deposition
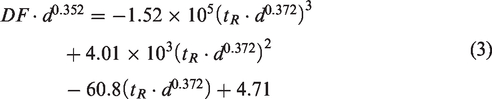
Comparison of bolus alveolar deposition among alveoli of different sizes is shown in Figure 10(a) as a function of particle release time. As discussed in the previous figure, deposition in small alveoli is higher than the large ones for a given particle release time. For all alveoli considered, the deposition rate decreases with increasing particle release time, until it reaches a critical (cut-off) release time such that particles released later than this time will be all exhaled out, leading to zero alveolar deposition. This cut-off release time also decreases with increasing alveolar diameters. In order to develop a deposition correlation for continuous particle release, a regression curve was found for each alveolar size (d) using a three-order polynomial function of d. The coefficients for each regression curve (a3, a2, a1, and a0) and the resultant relevance (R2) with the original data are listed in Table 1. Observing that the deposition curves look similar among different alveolar sizes, a further attempt was undertaken to identify a regression function that collapses all deposition curves. In doing so, a weighted deposition (DF·d0.352) and particle release time (tR·d0.372) were proposed (with the unit of d being mm), and the deposition data are re-plotted in Figure 10(b). The computational fluid dynamics (CFD)-predicted deposition data were grouped into one curve, indicating that the weighted deposition and time parameter adequately captured the effects of the alveolar diameter. The regression curve was expressed as below
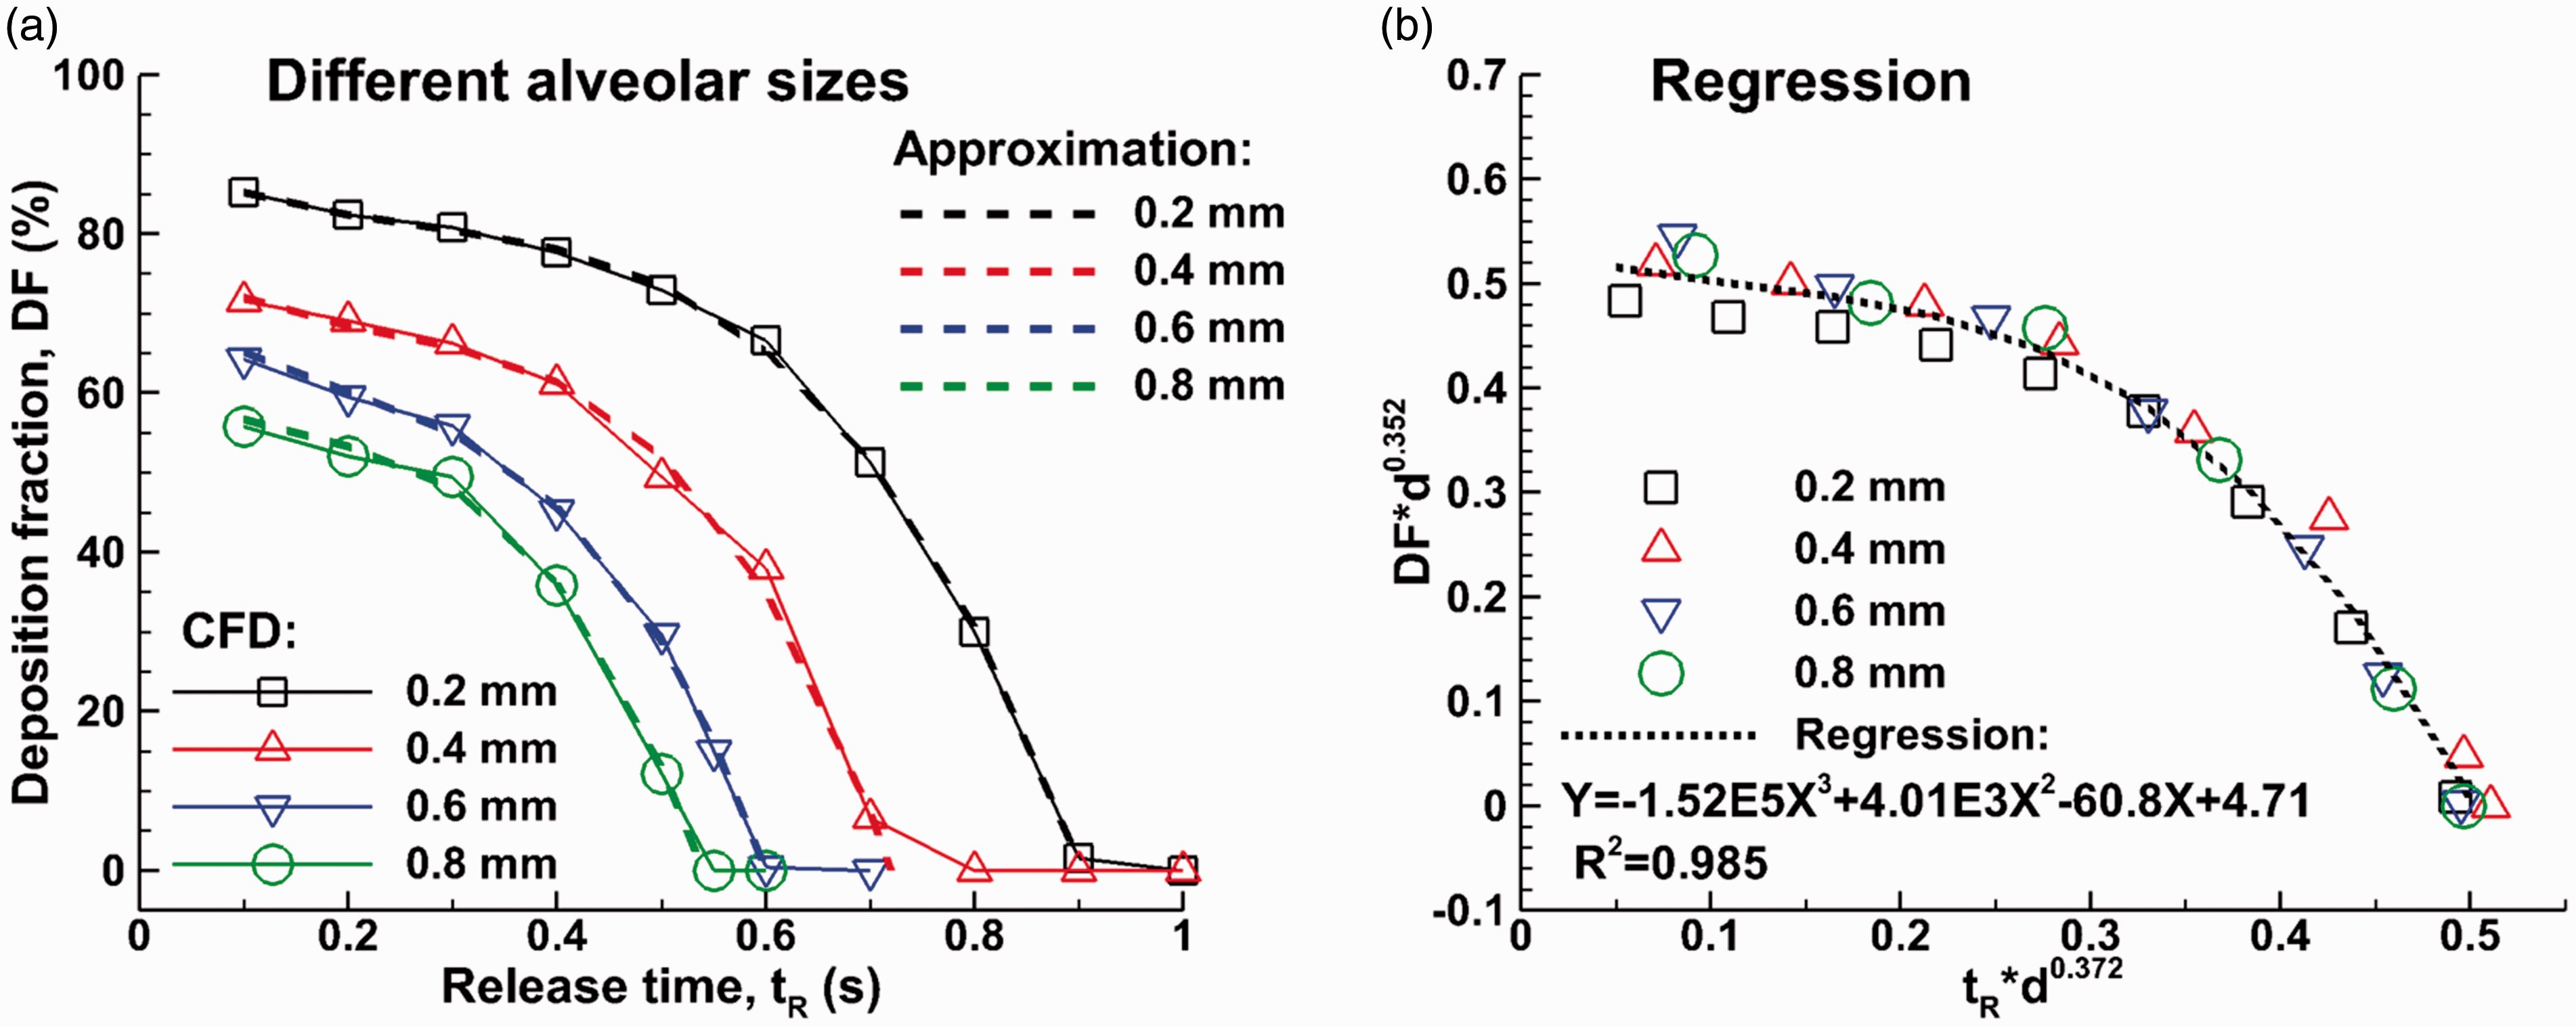
Alveolar deposition of 1 µm particles in alveoli with different diameters (a) as a function of the particle release time and (b) regression of alveolar deposition fractions for different sized alveoli and different particle release times.
Correlations for bolus deposition as a function of the particle release time: DF = a3tR3 + a2tR2 + a1tR + a0.
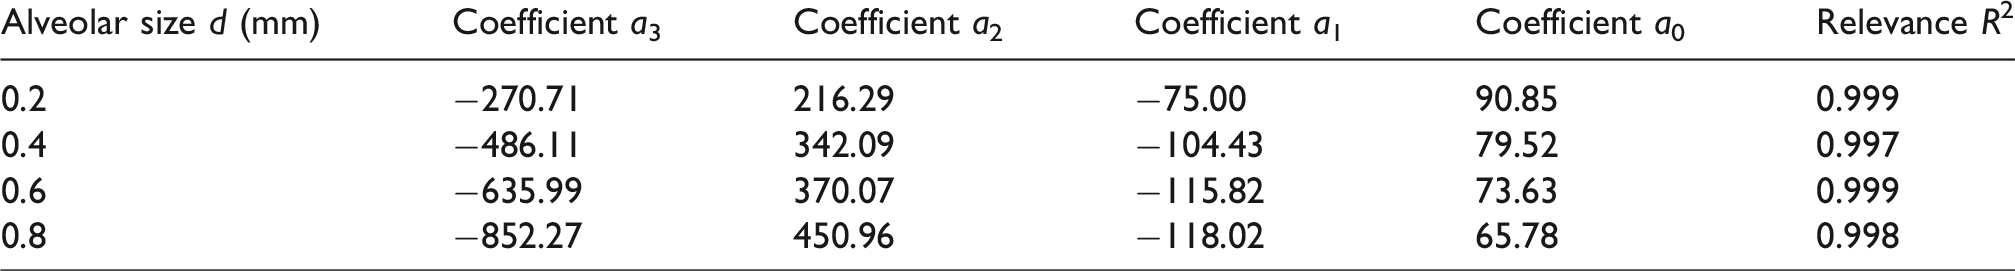
Good agreement was also obtained between the regression curve and deposition data (R2 = 0.985).
Develop an alveolar size-sensitive correlation for continuous-release deposition
Alveolar deposition during 0–tR:
The correlation development of the alveolar deposition with continuous particle release by integrating the bolus deposition curves is shown in Figures 11 and 12. Figure 11(a) shows the method to calculate the deposition in a 0.4-mm-diameter alveolus with continuous particle release for a duration of 0–tR, which is also shown in equation (1). A constant aerosol concentration C was assumed herein. The particle mass entering the alveolar duct during the period of 0–tR is the integration (
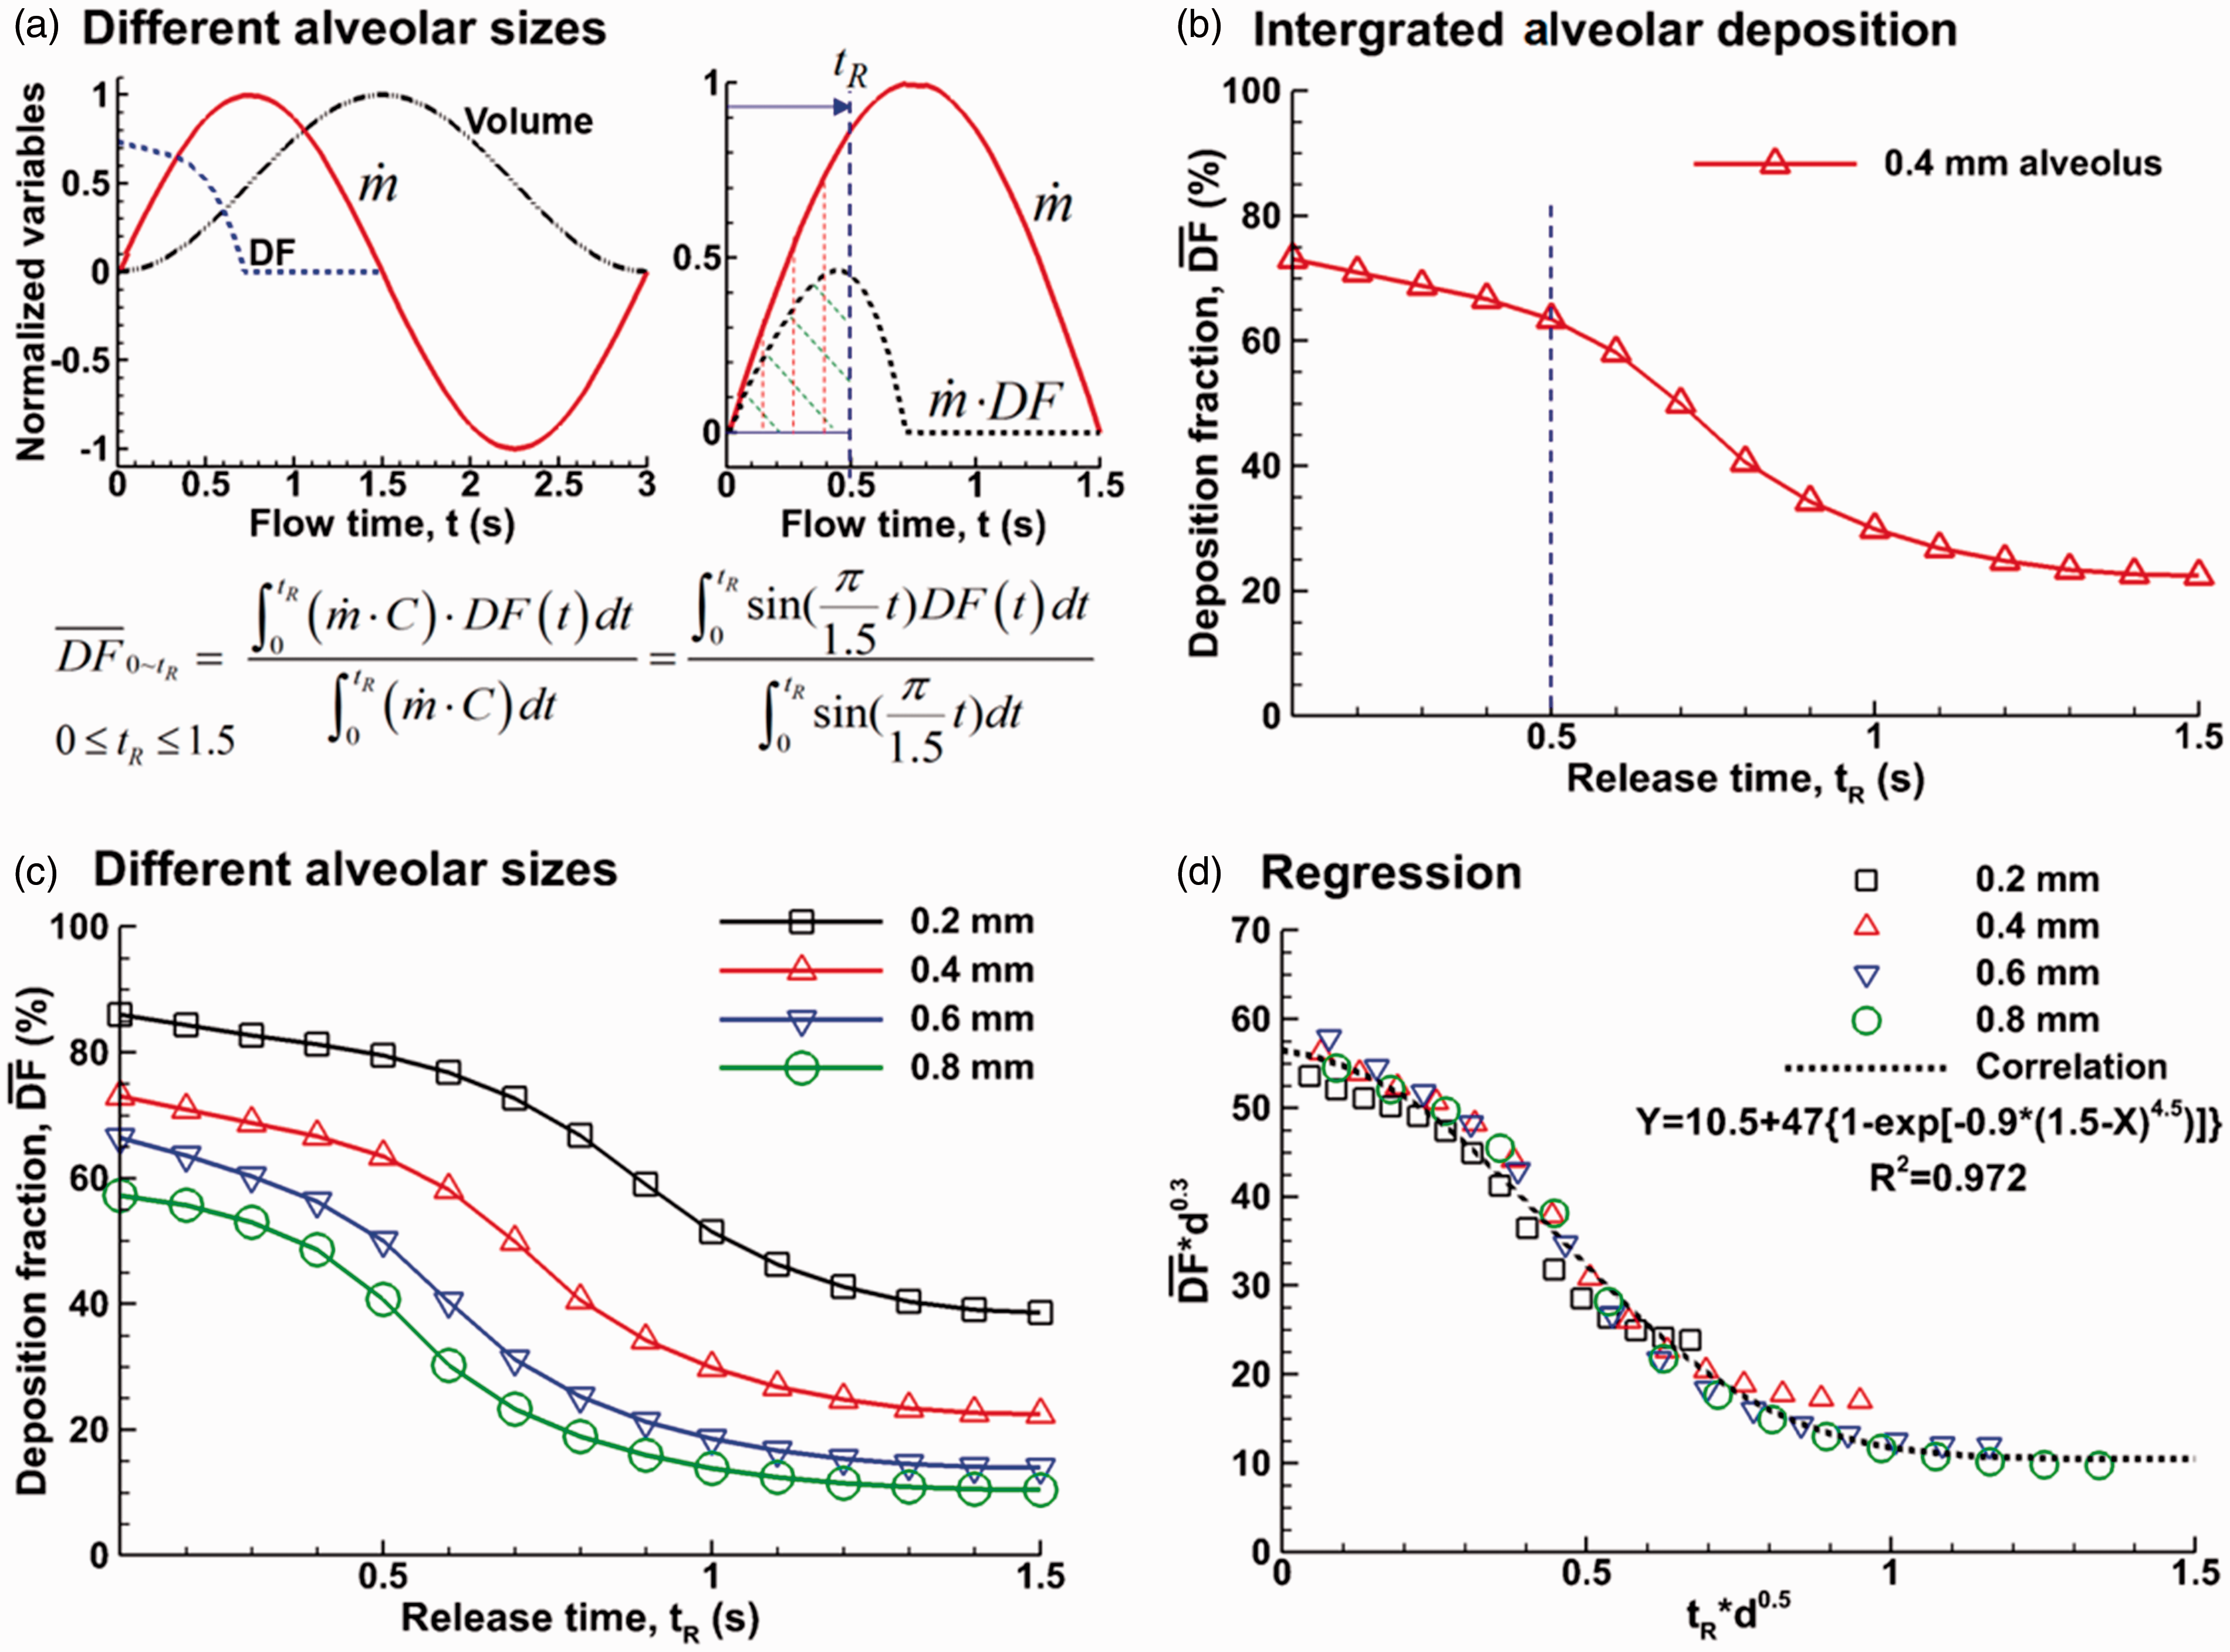
Calculation of the cumulative alveolar deposition (DF) with continuous inhalation of particles for a duration of 0∼tR: (a) the diagram and equation to calculate DF, (b) the calculated DF in the 0.4-mm-diameter alveolus, (c) DF in the alveoli of different sizes, and (d) regression of the calculated DFs.
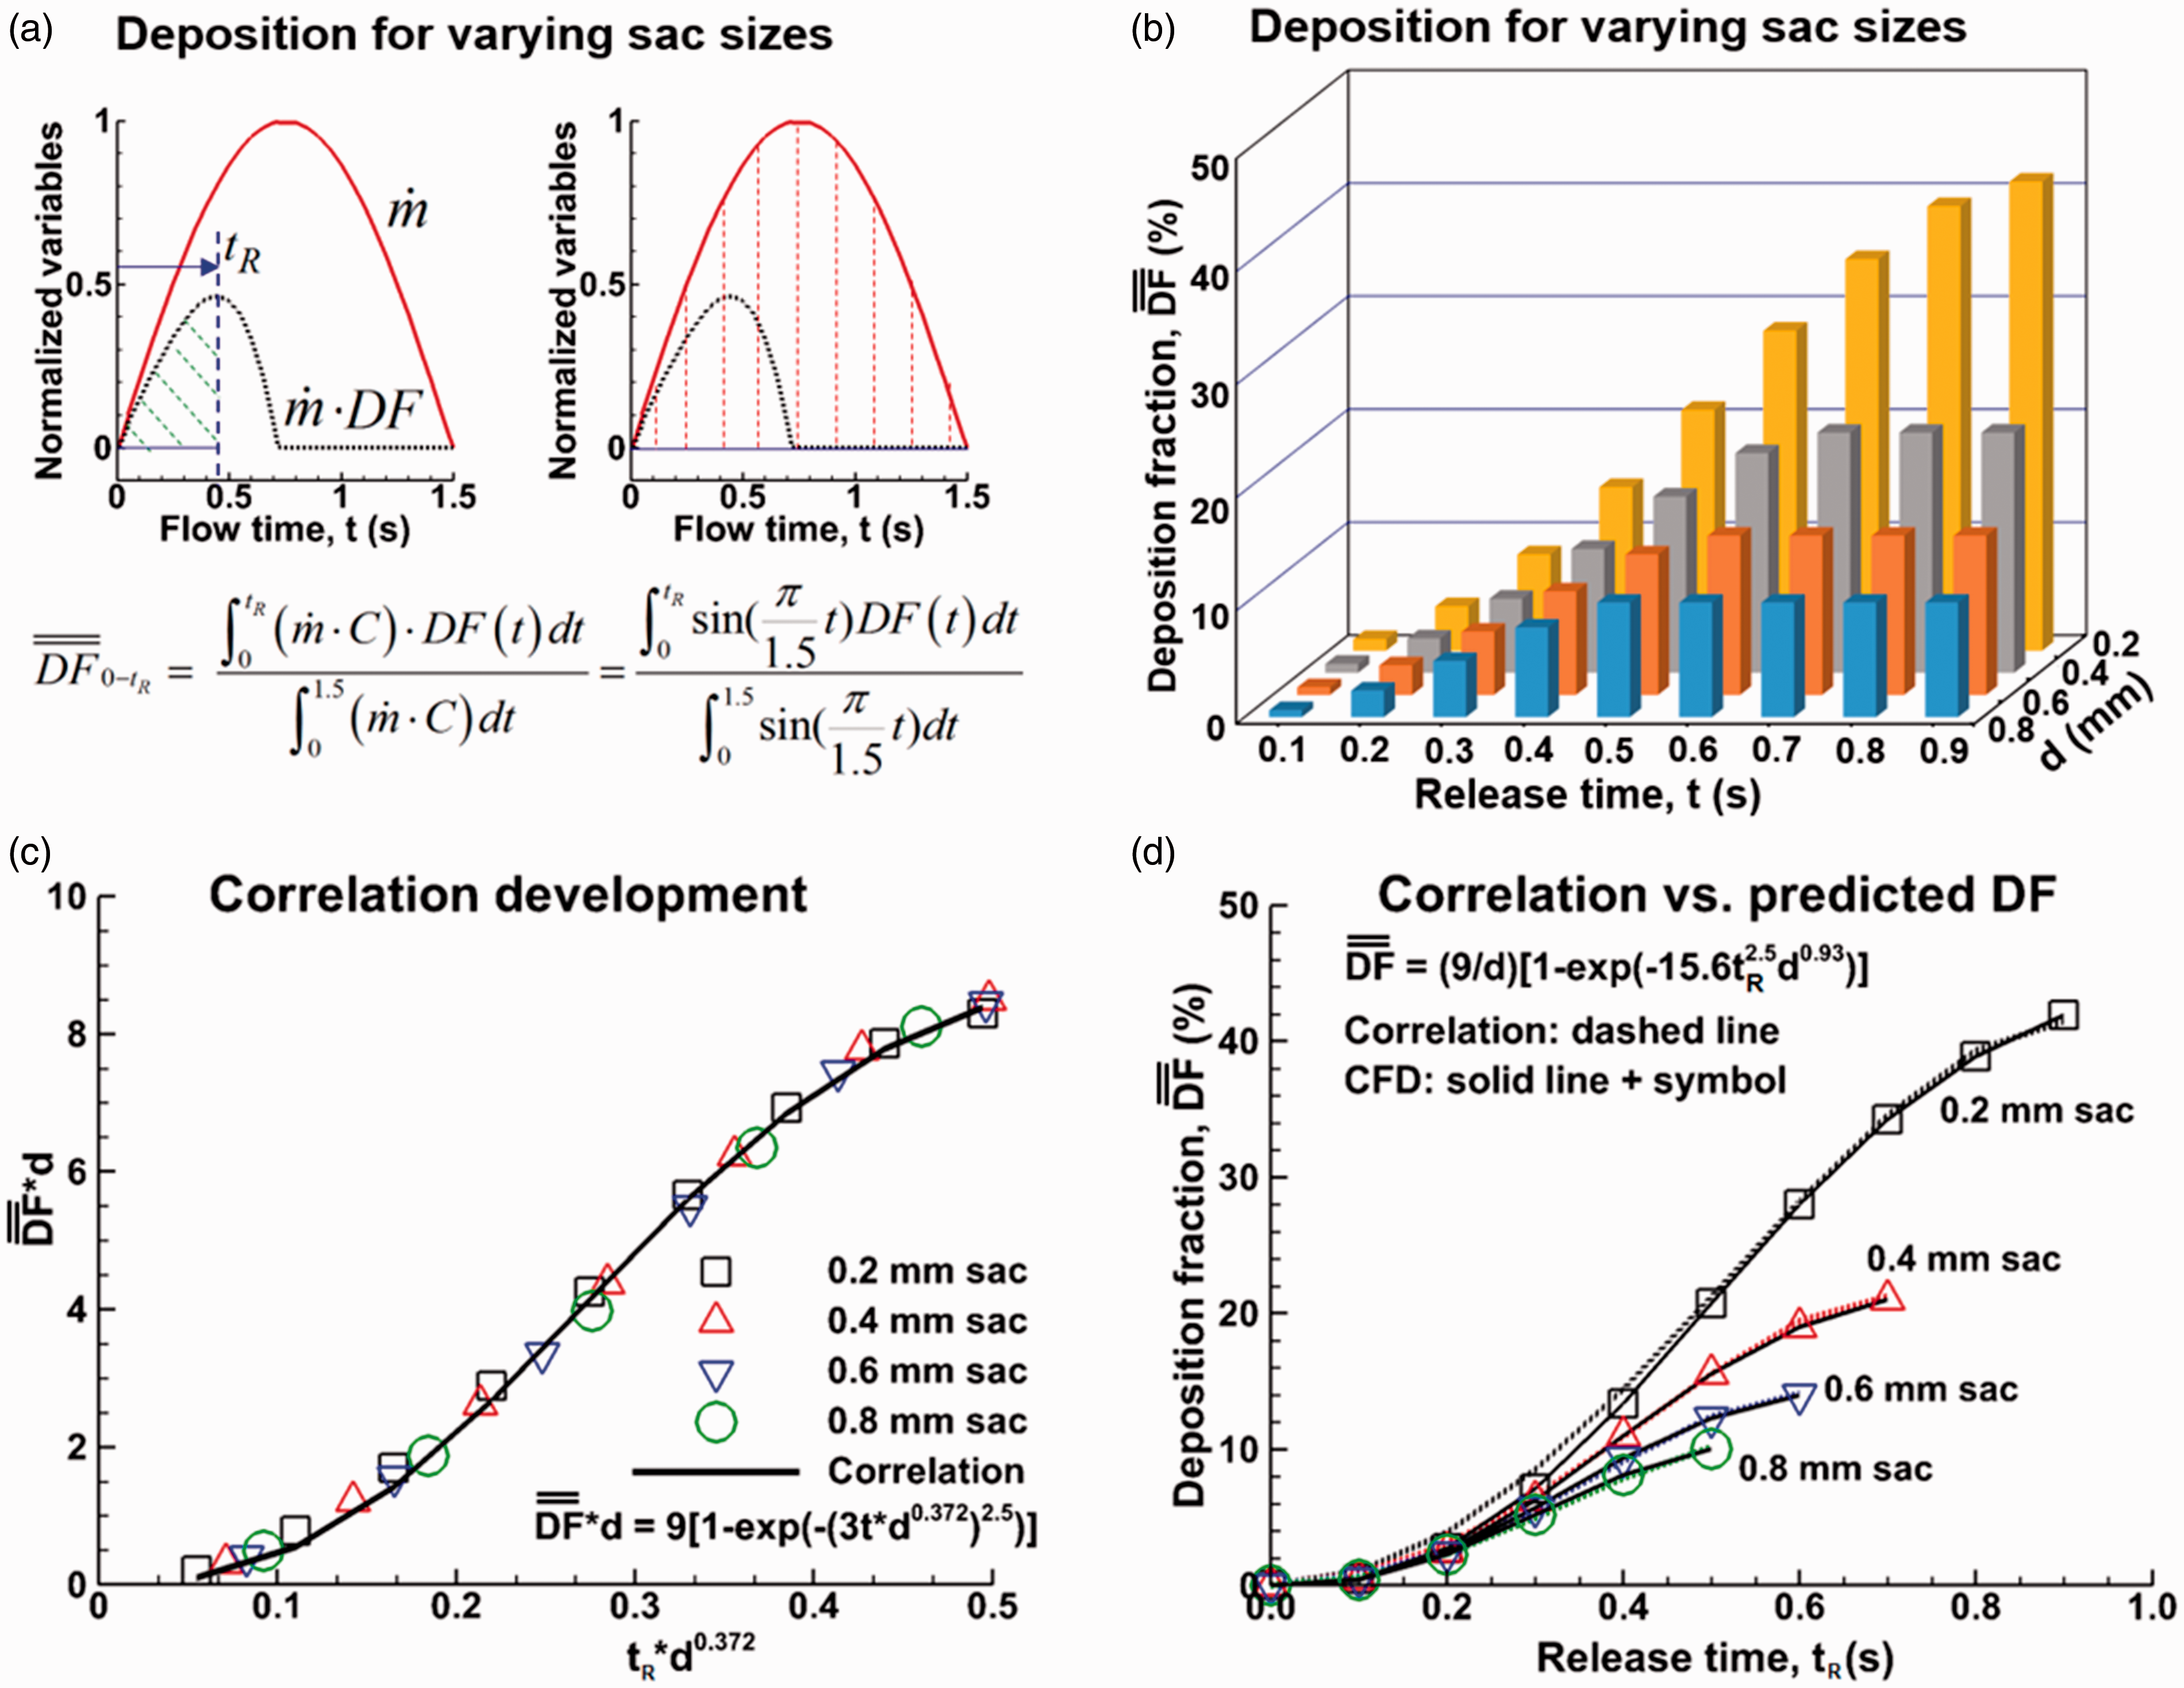
Time evolution of the continuous-inhalation deposition rate relative to all inhaled particles in one cycle: (a) the diagram and equation to calculate DF, (b) DF in the alveoli of different sizes, (c) correlation development, and (d) correlation vs. predicted DF.
Cumulative alveolar deposition:
As discussed, the continuous-release alveolus deposition df1 at tR = 1.5 s represents the inhalation dosimetry during the whole cycle or the final deposition of one inhalation cycle. It is also of interest to know the time growth of the inhalation dosimetry during inhalation. For instance, in spite of a high 
To verify the newly proposed correlation, the correlation- and CFD-predicted DFs are compared in Figure 12(d), where close agreement was achieved for all alveoli considered.
Discussion
This study presented a methodology to numerically quantify alveolar deposition with continuous particle release by integrating bolus deposition curves. Parametric studies were conducted of the influences from both temporal and geometrical factors, including breath-holding, particle release time, and alveolar dimension. Continuous regression curves were obtained for bolus aerosol deposition released at different points in the inhalation cycle in the alveoli of different sizes. These curves were further integrated with respect of time to calculate the cumulative alveolar deposition with continuous particle release for a prescribed period of time or during an entire inhalation cycle. Correlation was subsequently developed for the cumulative alveolar deposition with continuous particle release, which captured the relative dependence on particle release time and alveolar dimension.
Particle deposition in an oscillating terminal alveolus exhibits characteristics that are distinct from those in other parts of the respiratory tract. In contrast to a thorough flow, airflows enter and exit the blind-end terminal alveolus via the same alveolar duct. Inhaled particles oscillate with the rhythmically expanding and contracting wall motion. Due to the resident air in the alveolus, particles cannot reach the bottom wall in the first inhalation cycle and need several breathes to reach the bottom and deposit there. Similar observation has been reported in experimental studies by Berg et al., 36 who used particle image velocimetry to visualize the flow field in an expanding-contracting alveolus model and showed that inhaled particles could not reach the alveolar wall in a single breath even for deep breathing. Sera et al. 37 also found in their numerical studies that inhaled aerosols hardly deposited within one inhalation cycle but increased with repeated breathing. Concerning the particle deposition mechanisms inside the alveolus, even though the oscillating laminar flow and gravitational sedimentation of particles are the two most important features in the terminal alveolus, these two factors alone cannot explain the alveolar deposition process. A purely oscillating laminar flow will cause zero deposition because particles return to their release position after every cycle; on the other hand, gravitational sedimentation will lead to complete deposition given sufficient time for particles to settle. A third mechanism, particle dispersion, was proposed in our previous study 17 based on the observations that the particle swarm disperse progressively in successive respirations. Due to the dispersion, a portion of particles will be exhaled out of the alveolus during the exhalation and lead to incomplete deposition. The level of particle dispersion dictates the deposition faction, which in turn is dictated by many factors such as particle release time, alveolar dimension, particle diameter, breathing frequency, and so forth.
Bolus deposition in the alveolus can differ significantly from the cumulative deposition with continuous particle release. Depending on the time particles were released during the breathing cycle, the fraction of the particles depositing onto the alveolar surface can vary from 100% to 0%. Generally, particles released at a later stage of the inhalation cycle will be more likely to be exhaled out. There is a cut-off release time, later than which all released particles will be exhaled out, resulting in zero bolus deposition. For 1 µm aerosols and 0.4-mm-diameter alveolus, the cut-off release time was predicted to be 0.8 s; in other words, only particles released during 0–0.8 s will possibly deposit. Likewise, the cut-off release time was predicted to be 1.0 s in the 0.2-mm-diameter alveolus, 0.6 s in the 0.6-mm-diameter alveolus, and 0.56 s in the 0.8-mm-diameter alveolus (Figure 11). The alveolar deposition with continuous particle release is the cumulative depositions from the period when the particles are released and can be quantified by integrating the bolus deposition curves that are regressed from discrete deposition data.
Results of this study indicated that the alveolar size has an important impact on alveolar deposition, which decreases with the alveolar size. The cumulative alveolar deposition was predicted to be 10% in the 0.8-mm-diameter alveolus and is approximately four times that (39%) in the 0.2-mm-diameter alveolus. The alveolar size can vary in a wide range, for instance, from 0.2 to 0.45 mm in healthy subjects and from 0.46 to 0.89 mm in COPD patients.21,22 The alveolar size also changes with age. It hardly changes in the first three or four years of life, but increases steadily thereafter, with alveolar volume doubling around the age of 14. 38 A smaller alveolar size has high DF of inhaled irritants, which makes the 0- to 4-year-old children more susceptible to respiratory risks.39,40
One implication of the results of this study is that aerosol release time is a key factor in determining the drug delivery efficiency to deep lungs. In aged or diseased lungs, the alveolus may lose their supporting structures and become dilated. 41 For COPD patients with larger alveoli, the DF will be smaller than that in healthy subjects, which means lower respiratory distress from environmental exposure. However, it also means a lower drug delivery efficiency to the acinus region (for instance, 10% in 0.8-mm-diameter alveoli with drug release from 0 to 1.5 s) and a compromised therapeutic outcome, given all other factors being the same. In order to improve the delivery efficiency (and therapeutic response), drugs can be administered at the inhalation onset only, which has a much higher bolus alveolar DF (for instance, 56% in 0.8-mm-diameter alveoli with drug particles being released at t = 0 s), as shown in Figure 11(c).
An sinusoidal breathing waveform with an I:E ratio of 1:1 was considered in this study. In life conditions, the I:E ratio can vary in a large range and a normal breathing generally has an I:E ratio of 1:2. 42 Compared to an I:E ratio of 1:1, this means a longer period of exhalation, a slower expiratory speed, a further downward motion, and therefore a higher deposition rate. This scenario should be close to the case with a post-inhalation breath-holding of 1 or 2 s.
Other assumptions that may affect the applicability of the results of this study include an idealized (spherical) alveolar geometry, a limited number of particle size, and one-way (wall-flow-particle) interaction. In vivo pulmonary alveoli possess complex morphology as revealed by histology and microscopy studies.36,43–45 Moreover, intricate architectures exist among alveoli, forming grape-like sacs.2,46,47 More complex alveolar models that had polyhedral structures and multiple alveoli had been demonstrated to influence aerosol deposition at different levels.2,10,15,48 However, when the acinar structure had more than three alveolar ducts, increasing model complexity had a negligible effect on total acinar deposition. 2 The alveolar wall motion also exhibits high levels of variability in contrast to an idealized sinusoidal function.45,49 A one-way momentum exchange was assumed from the rhythmically oscillating wall to airflows and further to inhaled particles. For simplicity, particle charge,50,51 size, 52 and hygroscopy effect 53 were also excluded. All these factors affect the behavior and fate of inhaled particles at different levels. However, using an idealized geometry with simplified breathing waveform and particle properties allows us to isolate the fundamental physiological factors in determining the alveolar deposition by omitting secondary factors that would otherwise make the study too computationally complicated. In addition, the model developed in this study can serve as a platform where more anatomically and physiologically realistic factors can be considered. Elevated deposition and earlier deposition onset are expected in more realistic alveolar geometries in light of more complex flows and higher chances of particle-wall interceptions. 37 Considering that the alveolar motion is inherently a two-way coupling phenomenon, further studies are needed to consider the real-time interactions between the airflow and elastic alveolar walls, as well as the airflow and inhaled particles.
In conclusion, a numerical method was introduced for the quantification of alveolar deposition with continuous particle release. Specific findings are listed as follows:
There are large differences in alveolar deposition between dynamic and static alveoli in terms of particle motion, deposition onset, and final alveolar deposition. Bolus alveolar deposition decreases with the release time. For 1 µm particles, the cut-off release time (zero bolus deposition) is 1.0 s for a 0.2-mm-diameter alveolus, 0.8 s for a 0.4-mm-diameter alveolus, and 0.56 s for a 0.8-mm-diameter alveolus. Two correlations were developed for cumulative alveolar deposition, with one for inhalation delivery with a prescribed period of drug release and the second for the time variation of alveolar deposition when exposed to ambient aerosols. For 1 µm particles, the cumulative alveolar deposition is predicted to be 39% for a 0.2-mm-diameter alveolus, 22% for a 0.4-mm-diameter alveolus, and 10% for a 0.8-mm-diameter alveolus.
Footnotes
Declaration of conflicting interests
The author(s) declared no potential conflicts of interest with respect to the research, authorship, and/or publication of this article.
Funding
The author(s) disclosed receipt of the following financial support for the research, authorship, and/or publication of this article: This study was funded by NSF Grant CBET 1605434.