
Abstract
In the high-temperature gas-cooled reactor pebble-bed module, the helium bypass flow among graphite blocks cannot be ignored due to its effect on the temperature distribution as well as the maximum temperature in the reactor core. Bypass flow was previously analyzed in the discharging tube, in vertical gaps between graphite reflectors, and in control rod channels. The focus of this study is on the bypass flow that connects the small absorber sphere channels. Different from bypass flow connecting the control rod channels, there was no evident inlet or outlet flow paths into or out of the small absorber sphere channels at the top or bottom of the reactor core. Therefore, the bypass flow connecting the pebble bed with the small absorber sphere channels was mainly caused by the horizontal gaps, in which those gaps would also be irregular due to installation, thermal expansion, or irradiation of the graphite reflectors. After clarifying the resistant coefficients of those gaps by computational fluid dynamic tools, the bypass flow distribution was calculated by the flow network model including the flow in the reactor core, small absorber sphere channels, as well as horizontal gaps. Cases with various size combinations of gaps were adopted into the flow network model to test the sensitivity of bypass flow distribution to those parameters. Finally, the bypass flow in the small absorber sphere channels was concluded to be not significant in the reactor core.
Keywords
Introduction
The inherent safety concept of modular high-temperature gas-cooled reactor (HTGR) has been widely accepted with respect to negative temperature coefficients and the efficient decay heat removal in accidents. 1 Based on the successful design, construction, operation, and safety performance tests of the Chinese test reactor HTR-10, 2 the high-temperature gas-cooled reactor pebble-bed module (HTR-PM) was further developed at the demonstration plant and supported by the Chinese National Science and Technology major project.3,4 After the first concrete poured in 9 December 2012, the HTR-PM finished the construction of reactor buildings in 2015 and started the installation in 2016. Up to now, major components including reactor pressure vessels and metallic internals have been installed well in position, while the installation of ceramic internals is still ongoing. Following the commissioning phase, the HTR-PM is planned for grid connection in 2018.
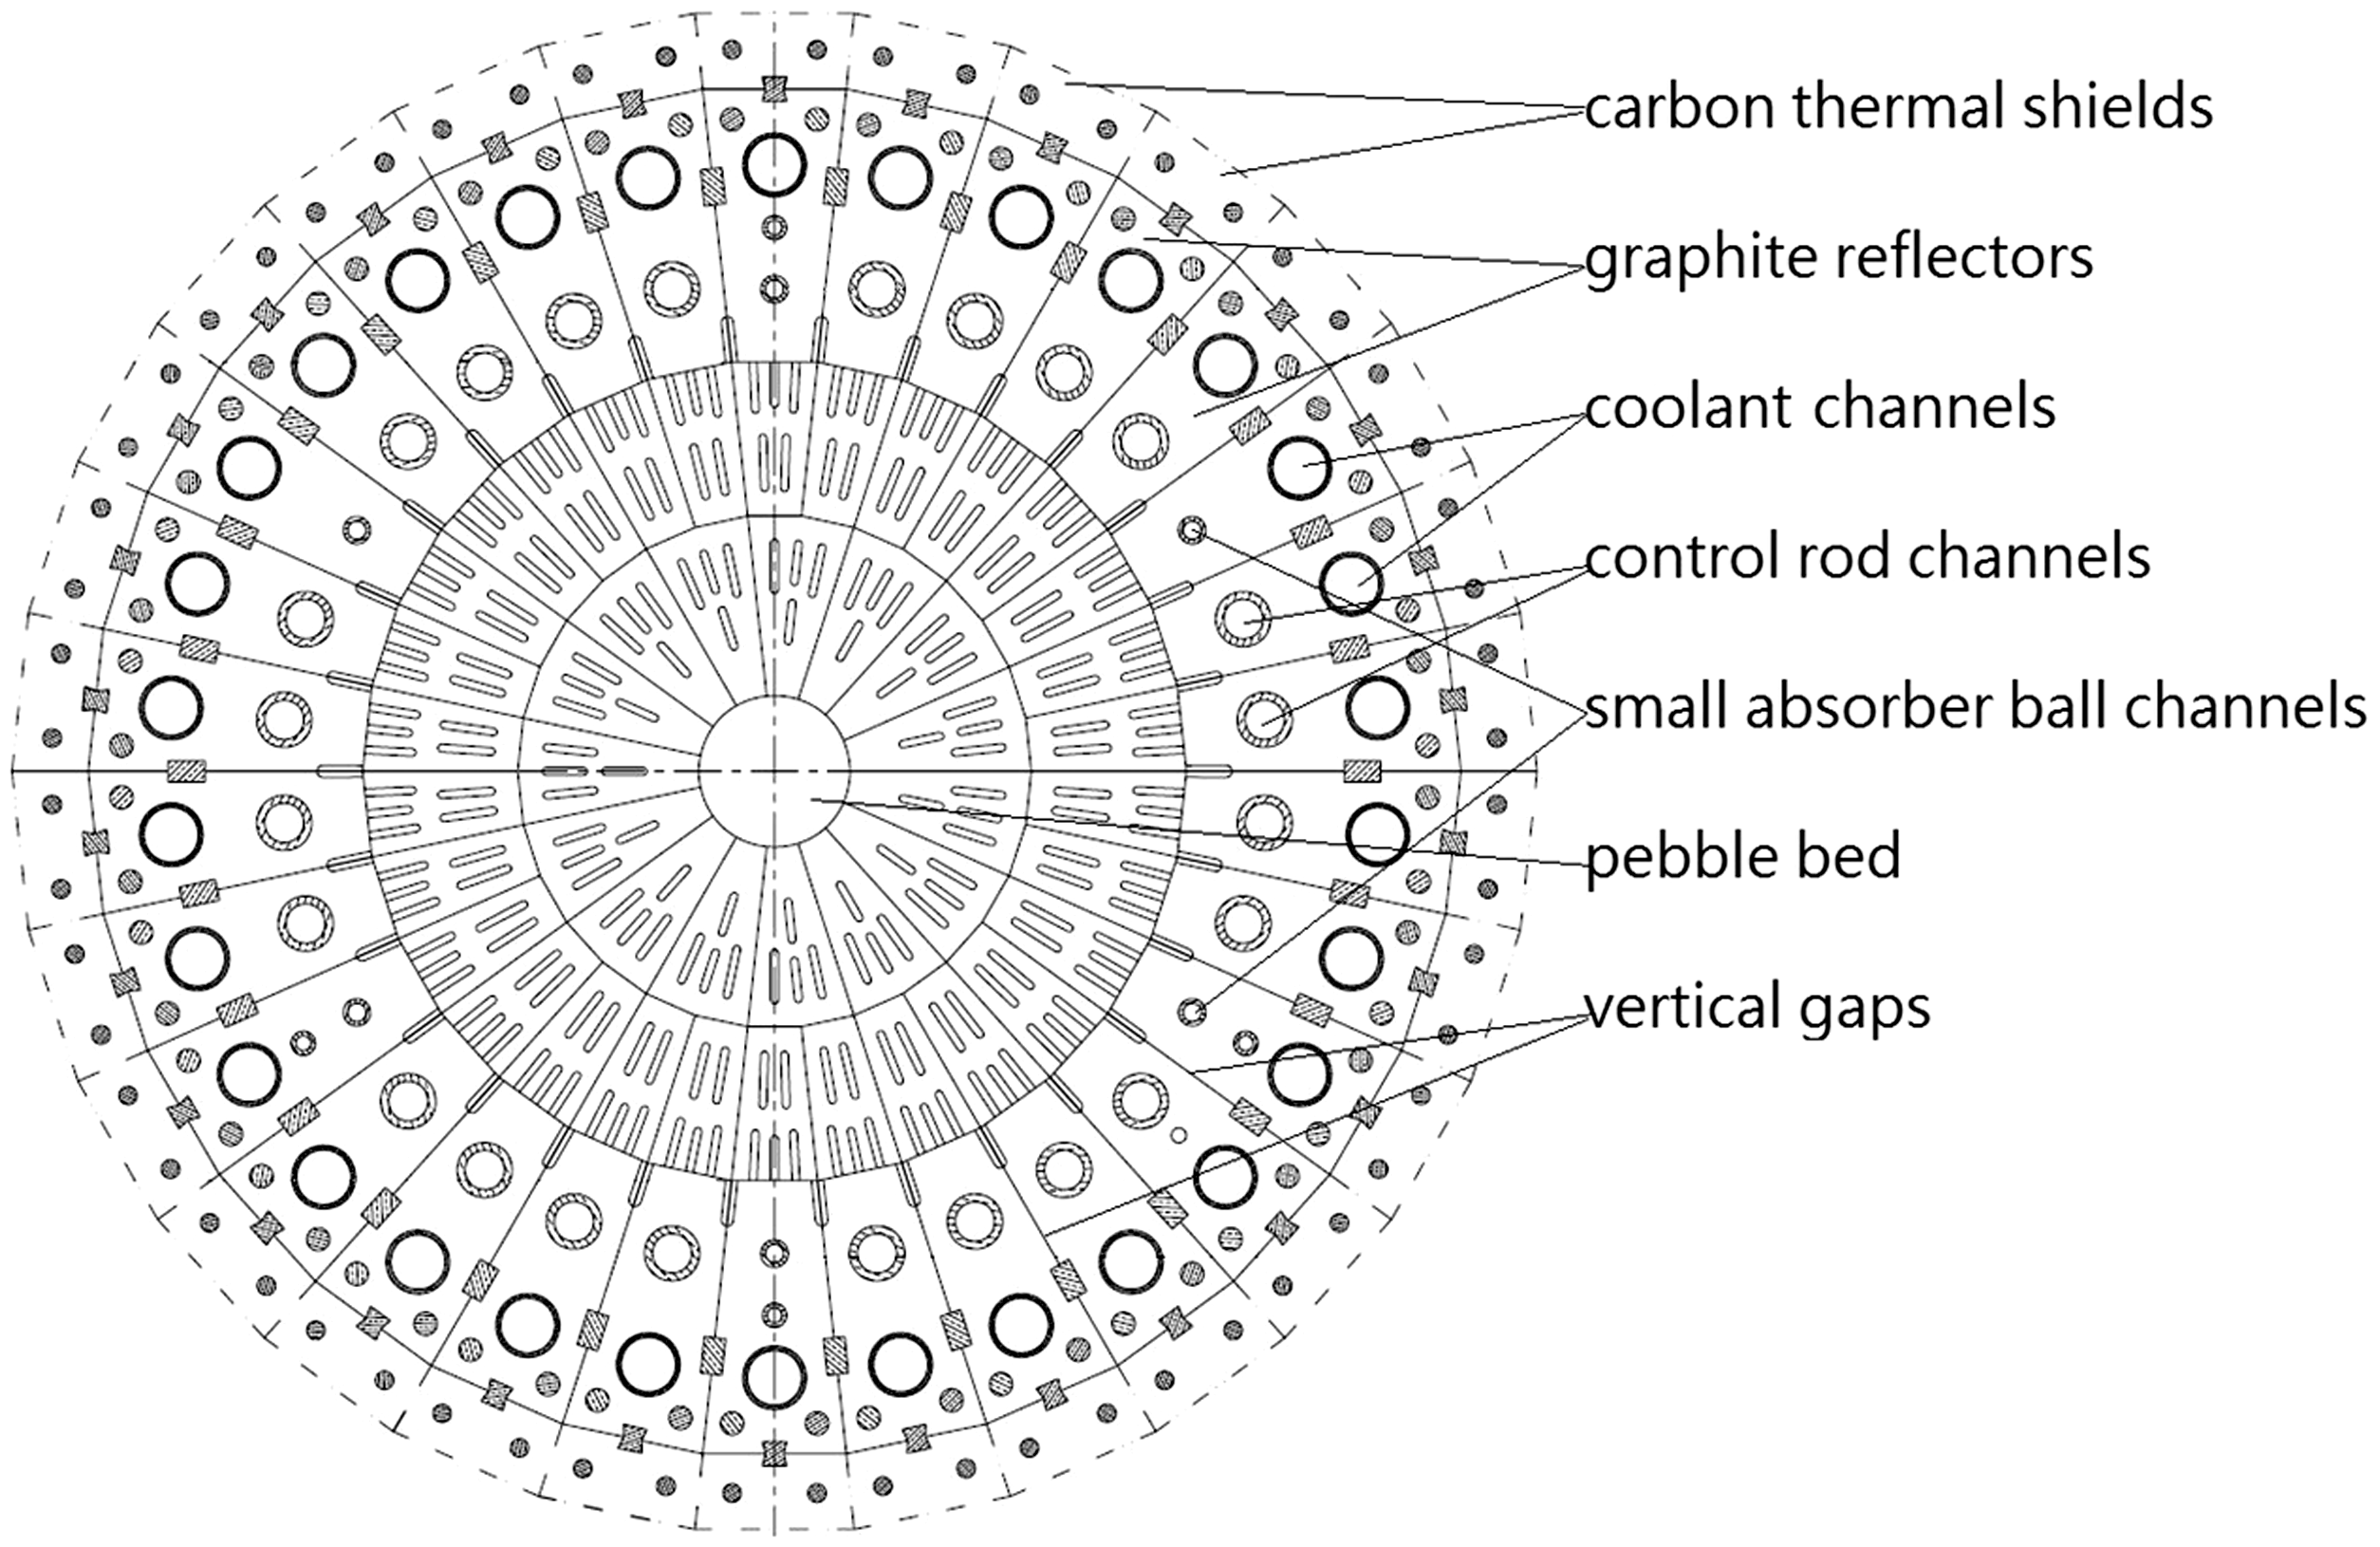
From the design of HTR-PM, about 420,000 fuel pebbles are loaded and packed randomly into the middle of the reactor core, as shown in Figure 1, in which the helium flow directions in the primary circuit are also illustrated by arrows. Large amount of graphite blocks surrounds the pebble bed from the top, bottom, and outside and serves as the neutron reflectors and the structure materials. From the horizontal cross section of the reactor core shown in Figure 2, channels are carved inside graphite reflectors to form 30 coolant channels, including 24 control rod channels and six small absorber sphere channels. Besides this, graphite blocks are piled up to form the loose body structure so that gaps among those blocks are normal and also become possible helium flow paths, such as the vertical gaps between two adjacent graphite reflectors shown in Figure 2. Thirty coolant channels and the pebble bed are the main helium flow paths in the reactor core to remove the fission heat, while a small part of helium flow is less heated and becomes bypass flow in the control rod channels, small absorber sphere channels, and through many other gaps.
Drawing of the main nuclear island systems and structures in the HTR-PM. Horizontal cross section of the HTR-PM reactor core.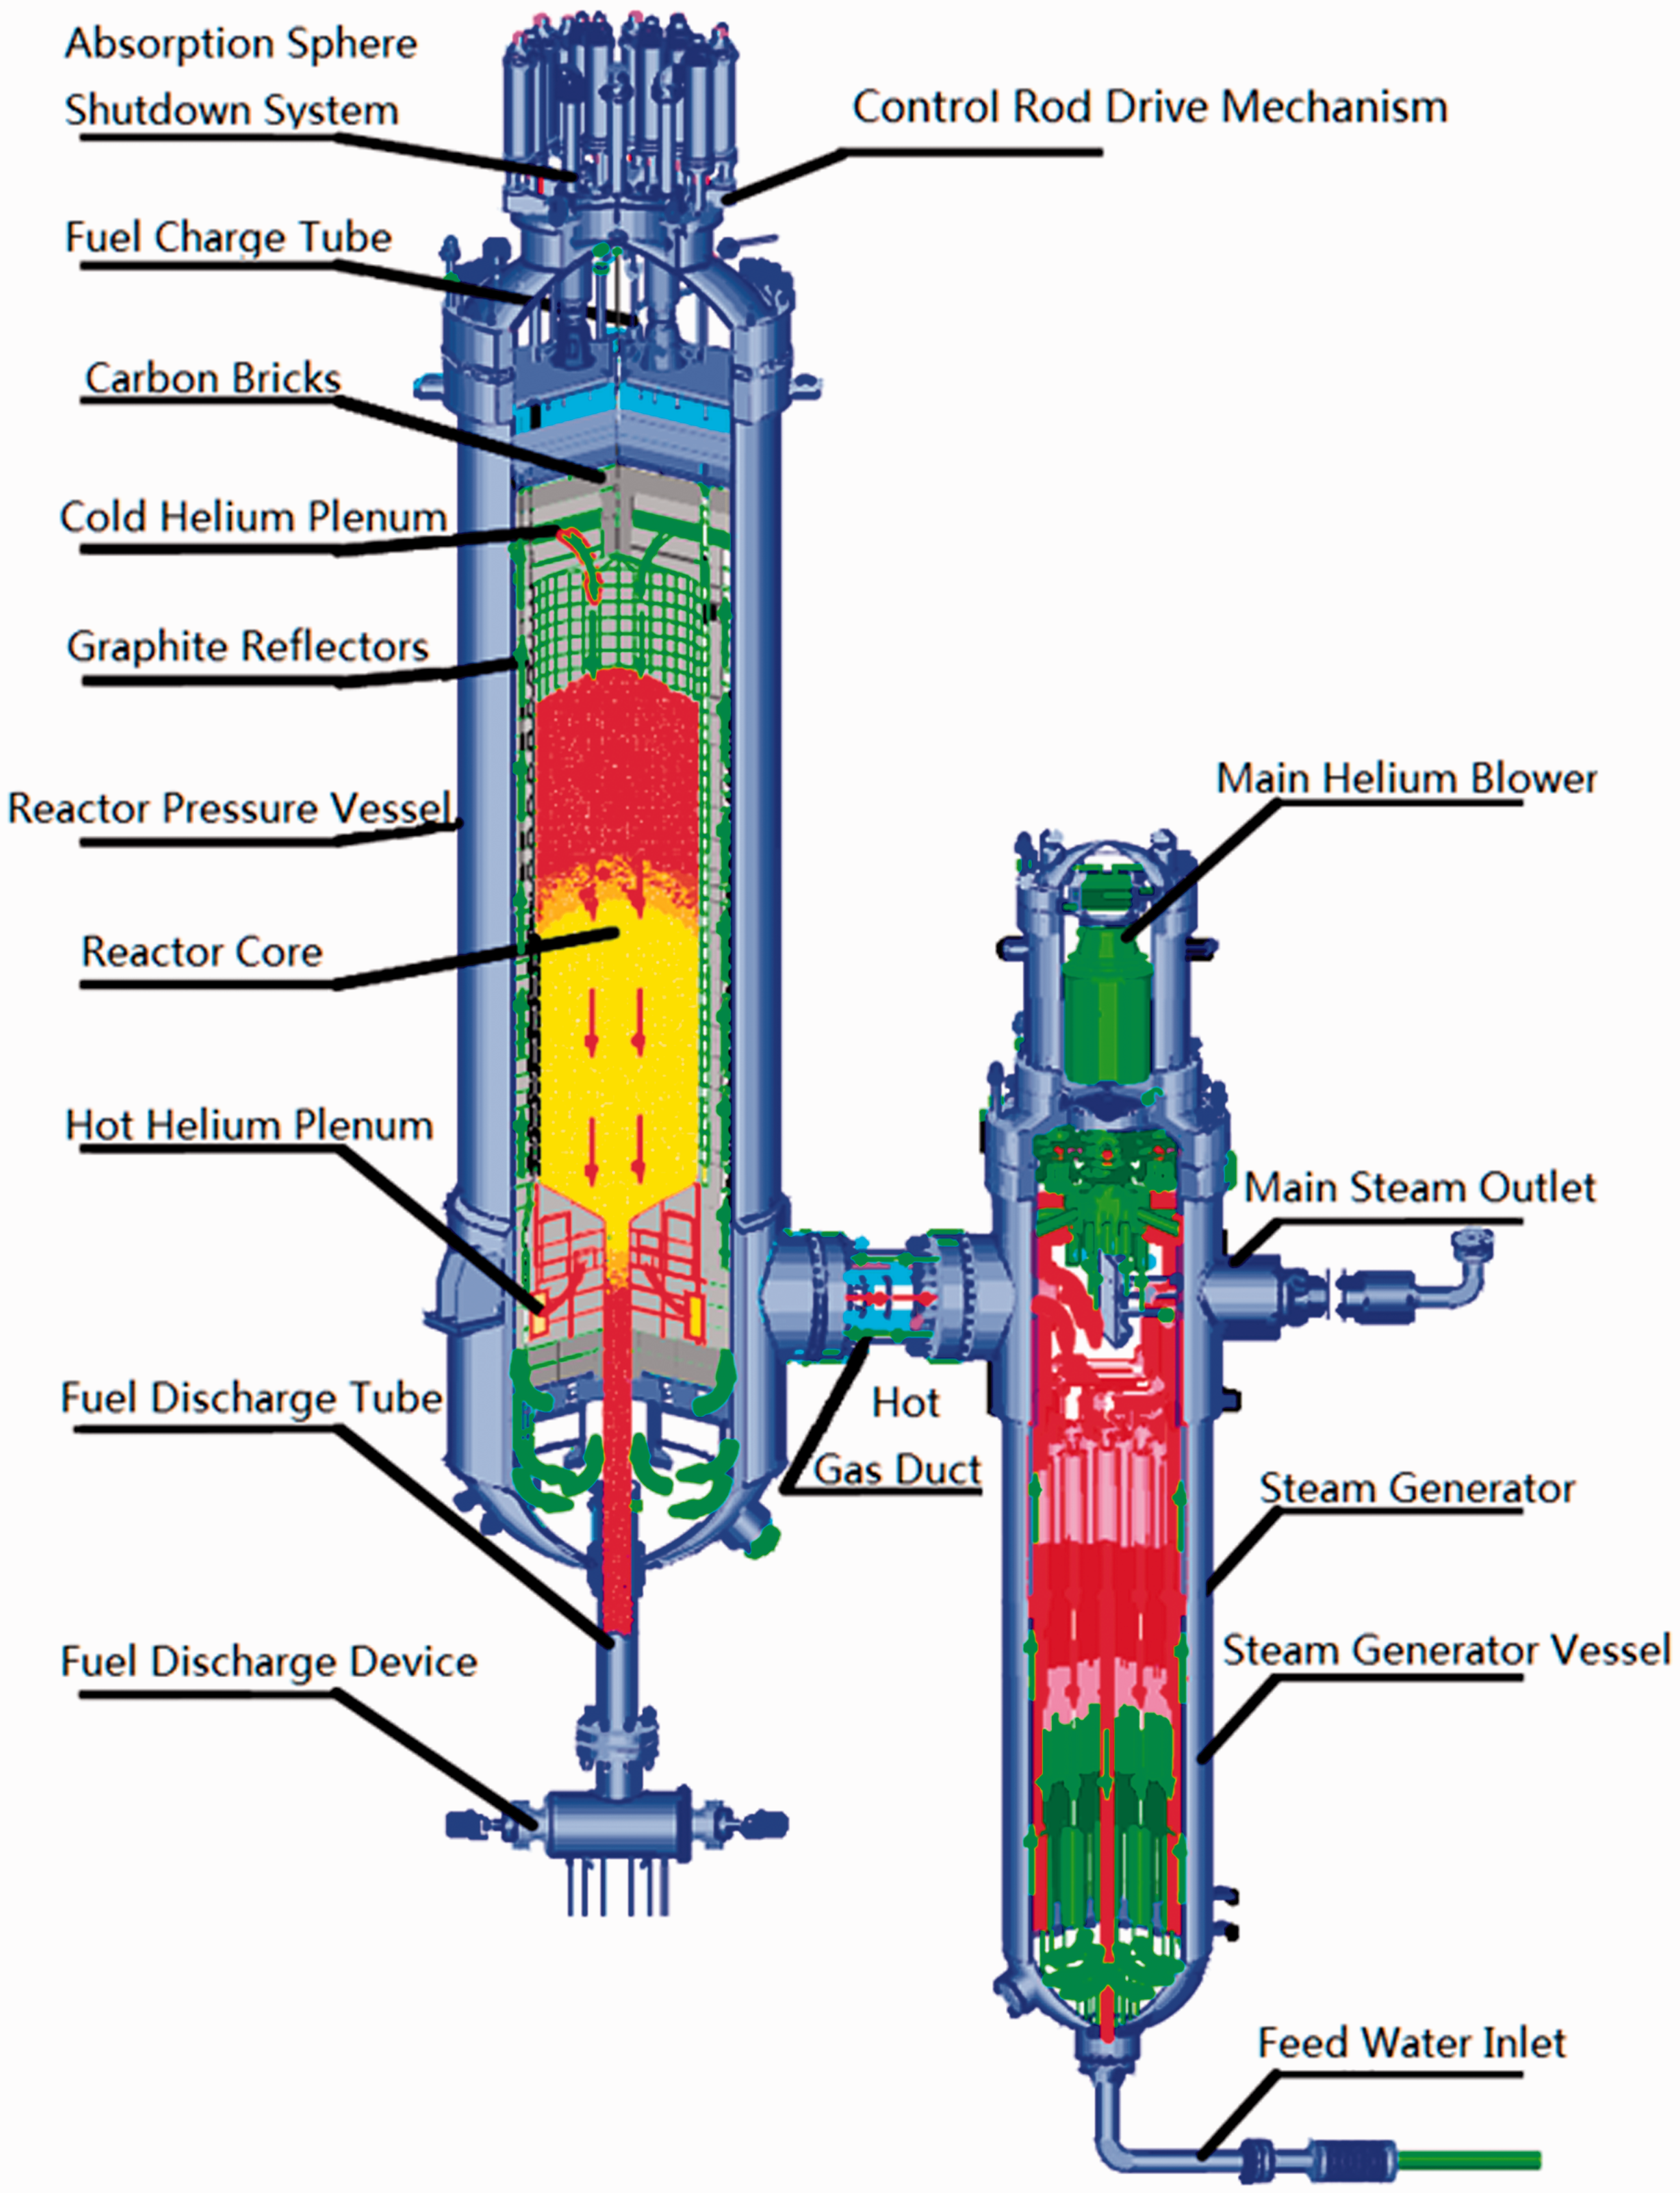
The amount of bypass flow matters to the thermal hydraulic design and safety of HTGR because unexpected bypass flow alters the flow and temperature distributions in the reactor core. More bypass flow leads to less efficient coolant flow through the pebble bed and higher fuel temperatures in normal operations, as the result of which fission product would be more likely to diffuse to the primary circuit and the safety margins become less for the radioactivity and temperature limits. Meanwhile, enough bypass flow is necessary to maintain some components’ functions. For instance, the cladding material of the control rod neutron absorber should be kept lower than its temperature limit and the recycled pebbles in the discharge tube should be cooled before unloaded. Therefore, the bypass flow should be controlled to be at the reasonable level. Typical classification of bypass flow paths of the HTR-PM was illustrated in Figure 3, including bypass flows in control rod channels, vertical gaps between graphite side reflectors, radial gaps between graphite side reflectors, discharge tube, and also small absorber sphere channels.
Typical bypass flow paths in the HTR-PM reactor core. RPV: Reactor Pressure Vessel.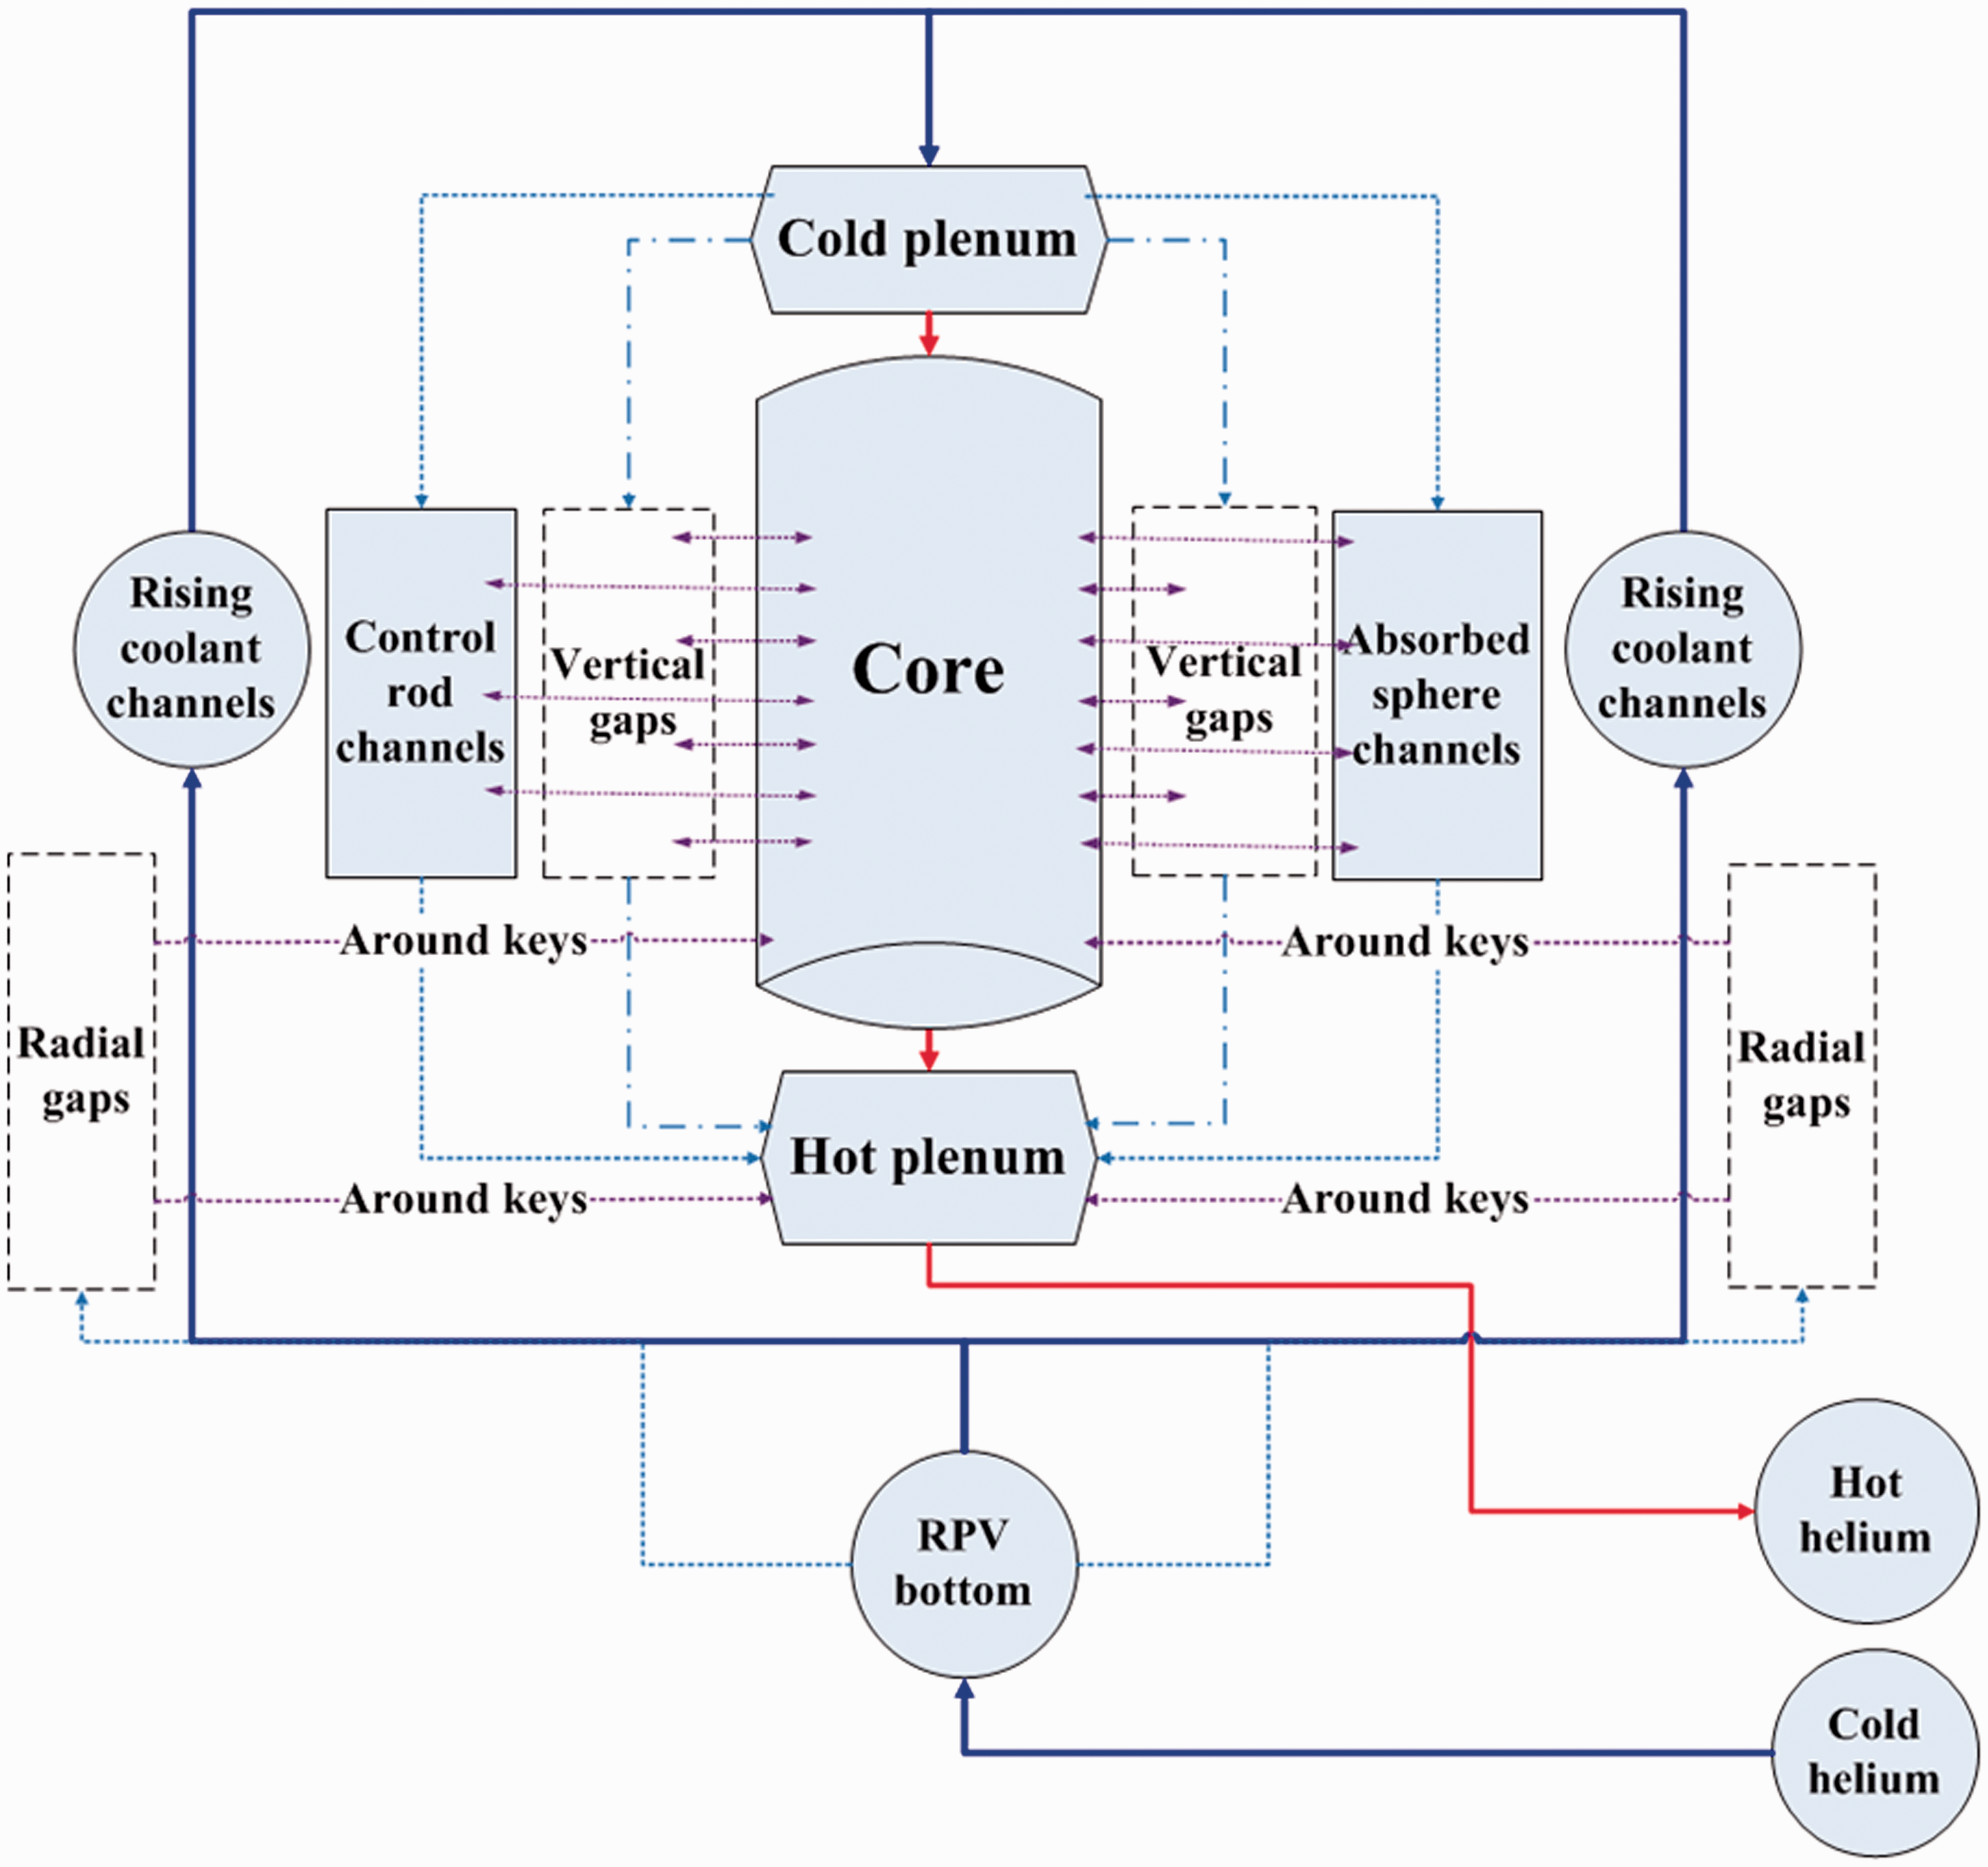
From the thermal hydraulic point of view, flow and heat transfer inside the reactor core depends on boundary conditions, including the helium blower performance, the resistance performance of all flow paths, the heat sources from fuel elements, as well as the gas environment inside the reactor pressure vessel. As for the analysis of bypass flow and its distribution, the most important step is to understand the internal structure to clarify possible bypass flow paths and their connections, especially for the structure of graphite internals surrounding the pebble bed.
As shown in Figures 1 and 2, thousands of graphite and carbon blocks are piled up from bottom to top forming the cylindrical reactor core. Due to the loose graphite internal structure, gaps among them are also of a large number and widely distributed, which makes the bypass flow problem complex and difficult to understand. Immersed in helium gas inside the reactor pressure vessel, bypass flow paths, such as gaps, interact closely with the pebble bed. Thus, the knowledge of connectivity of pebble bed, gaps, and other channels is a priori to the bypass flow analysis. In our previous researches,5–7 some local structures of the reactor core were identified and analyzed to study the bypass flow in the fuel discharge tube, in vertical gaps from cold plenum to hot plenum, as well as in control rod channels. Proper flow network models were established to discuss the bypass flow distributions. The flow network method is employed to describe connected main flow paths and bypass flow paths, in which complex three-dimensional flow fields are simplified into one-dimensional pipe flow network. Meanwhile, the mathematical expressions of all helium flows in the reactor core are also simplified by linear algebraic equations instead of nonlinear Navier–Stokes equations. Since bypass flow paths are in large number and are mostly irregular in shape, flow network method, other than full three-dimensional computational fluid dynamics (CFD) method, is the practical method to predict the bypass flow and distribution in the HTR-PM reactor core. Once the resistant performance of each flow path in the flow network is confirmed by correlations from experimental or numerical means, the flow network could be solved efficiently to obtain the flow and pressure distributions.
In this paper, we further focused on the bypass flow inside the small absorber sphere channels, which were also located in graphite reflectors. Similar to the bypass flow in control rod channels, horizontal gaps between upper and lower graphite blocks were considered and simulated with various shapes and sizes. Induced horizontal flow also connected the main flow in the pebble bed and bypass flow in the small absorber sphere channels. However, the small absorber sphere channels were empty in normal operation conditions, so that it was not necessary to import helium flow into the small absorber sphere channels by digging inlet and outlet flow paths in the graphite reflectors, which made it different from the bypass flow in control rod channels.
In the following sections, the flow network method combined with the CFD method was briefly reviewed as the basis. Then, the flow network was modeled relative to the bypass flow problem in small absorber sphere channels. The horizontal gaps were discussed and simulated with various shapes and sizes. The results indicated that the shapes and sizes as well as the locations of those gaps did affect the bypass flow rates and distributions in the small absorber sphere channels. Compared with the primary loop flow rate, the bypass flow in the small absorber sphere channels was not significant. Finally, the conclusion and future work was presented.
Methodology and models
According to the bypass flow features, the flow network and the CFD methods were both used to model and analyze the bypass flow problem in the HTR-PM by the following steps:
Clarify the possible bypass flow paths and their connections in the reactor core; Build flow network models of all flow paths, with proper discretization of the flow nodes and flow links; Determine the flow resistance of each flow path, use CFD simulations if necessary; Solve the flow network with given boundary conditions and integrated flow resistances.
Flow network
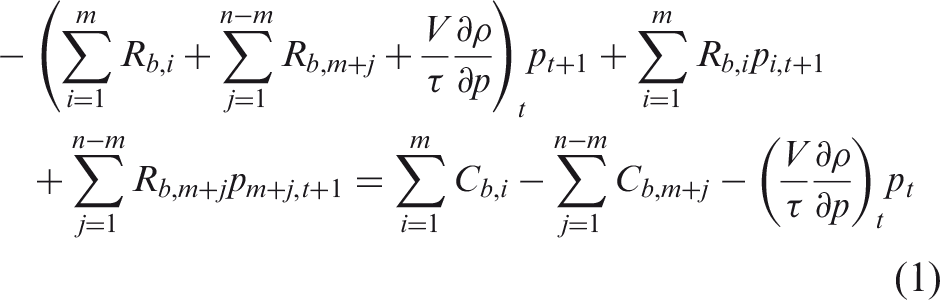
In the flow network method, three-dimensional flow field was simplified into interconnected one-dimensional flow paths network, in which the flow paths were named flow links characterized by the resistance and flow rate, while the connection points of flow links were named flow nodes featured with the values of mass, pressure, and temperature. Benefiting from such simplifications, the flow network model has a much lower computational cost than three-dimensional methods. The common form of the linearized pressure equation for the ith flow node with m upstream flow links and n−m downstream flow links, at the time (t + 1) was
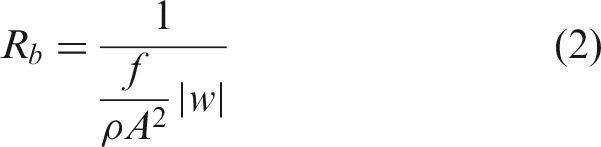
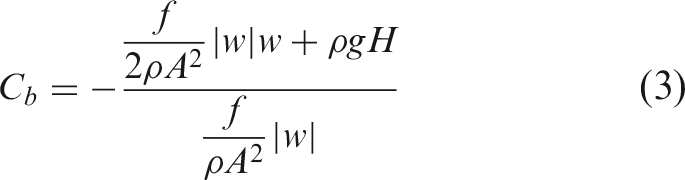
In solving the flow network, it was important to clarify the resistance of each flow path. In the bypass flow problem, various flow paths could be divided into two categories. The first category was those flow paths, the resistance of which could use empirical correlations. For helium flow through the pebble bed, the KTA rule 3102.3
8
was the most appropriate one. For turbulent flow in regular tubes, the commonly used formula was
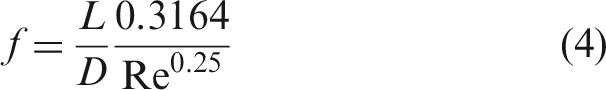
Usually, these kinds of local resistant coefficients could also be inquired and calculated in many reference books.
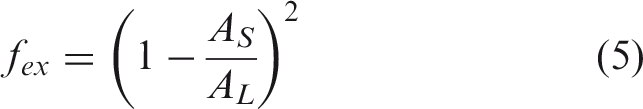
The other category of flow paths was for irregular channels with complex shapes. In the bypass flow problem, single gaps or combination of several gaps were typical, especially for the gaps among deformed graphite blocks under long time irradiation. CFD tools were used to model flow in those gaps and calculate the flow resistances, which was described in the next part.
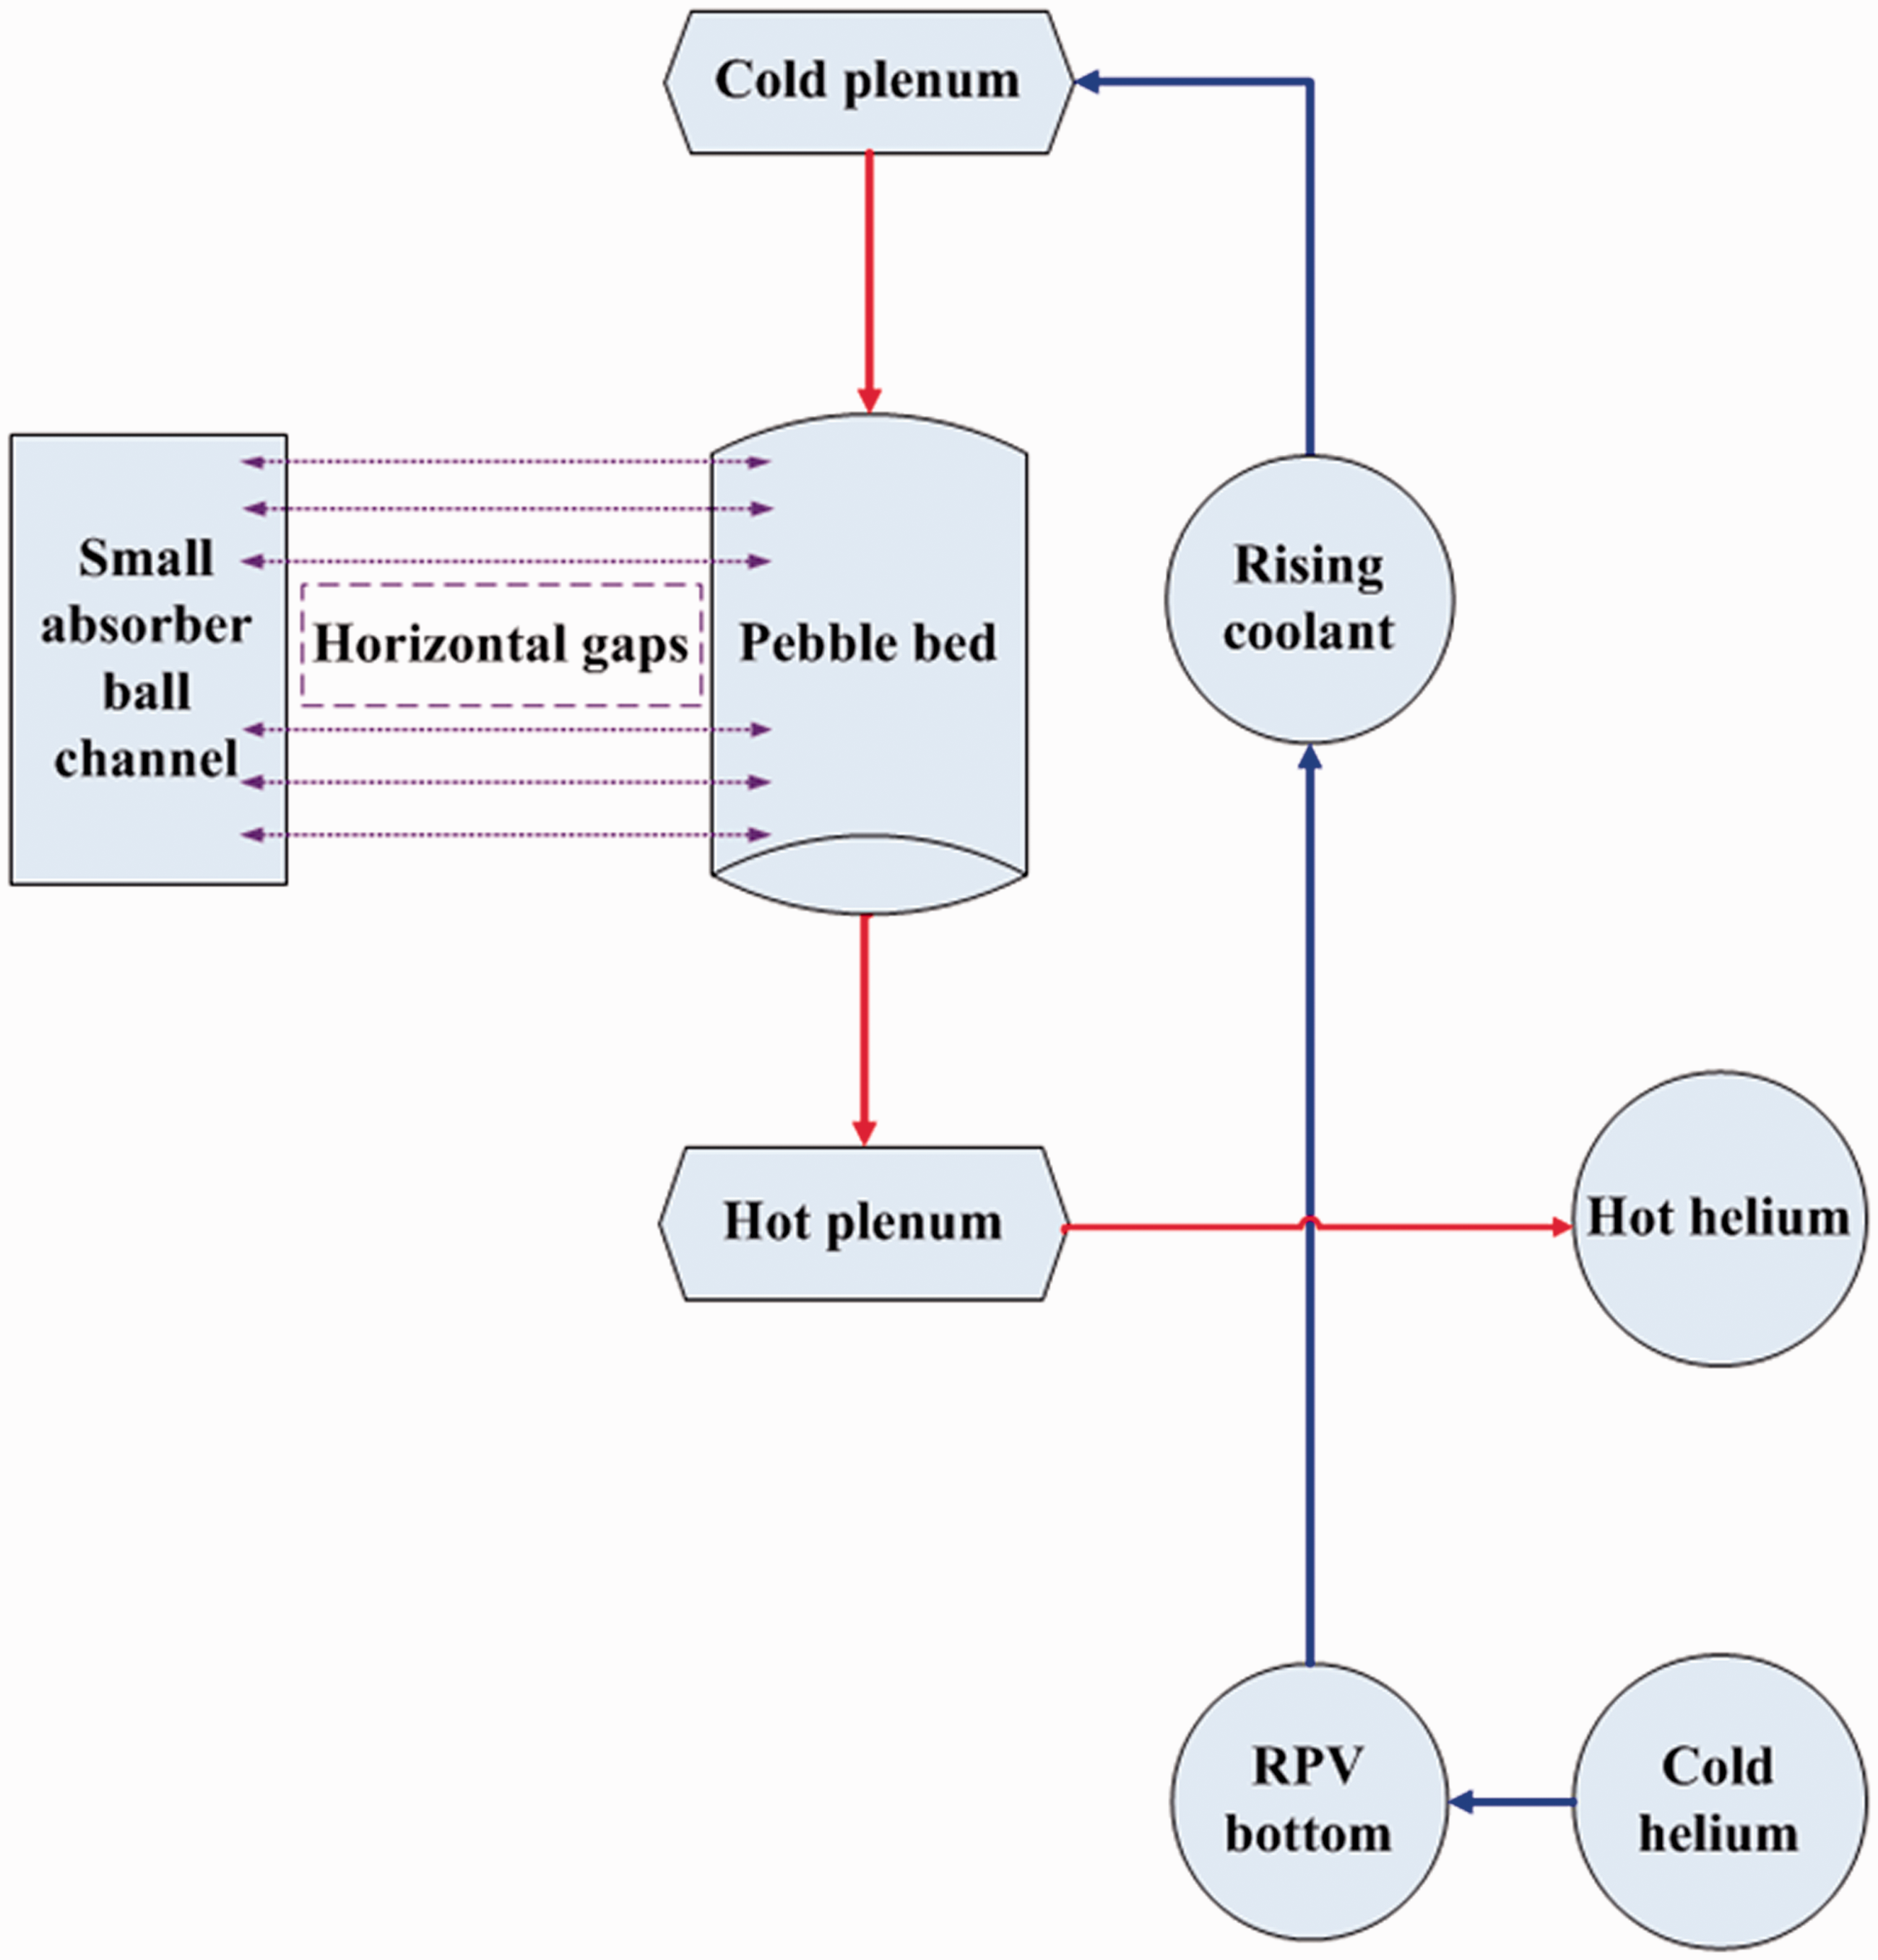
As the second independent shutdown mechanism, the small absorber sphere shutdown system is illustrated in Figure 4. The storage vessel filled with small absorber spheres is isolated from the top of small absorber sphere channel by a valve in normal operations. Only for long-term shutdown purposes, the valves are opened to drop the small absorber spheres into the channels by force of gravity. As for the bottom of channels, the breeder is connected with sealed tubes and the riser to the storage vessel. There is also a valve isolating the breeder from another helium compressor, which is only opened during the reactor start-up process from long-term shutdown. Therefore, helium in the small absorber sphere channels can only flow into the pebble bed through gaps among graphite blocks. According to the structure of graphite reflectors with carved small absorber spheres channels, the flow network model for the bypass flow in the small absorber sphere channels included flow paths of pebble bed, small absorber sphere channels, and many horizontal gaps in different heights, as shown in Figures 5 and 6.
The illustration of small absorber sphere shutdown system in the reactor core. Related flow paths for the bypass flow in the small absorber sphere channels. RPV: Reactor Pressure Vessel. Flow network model for the bypass flow in the small absorber sphere channels.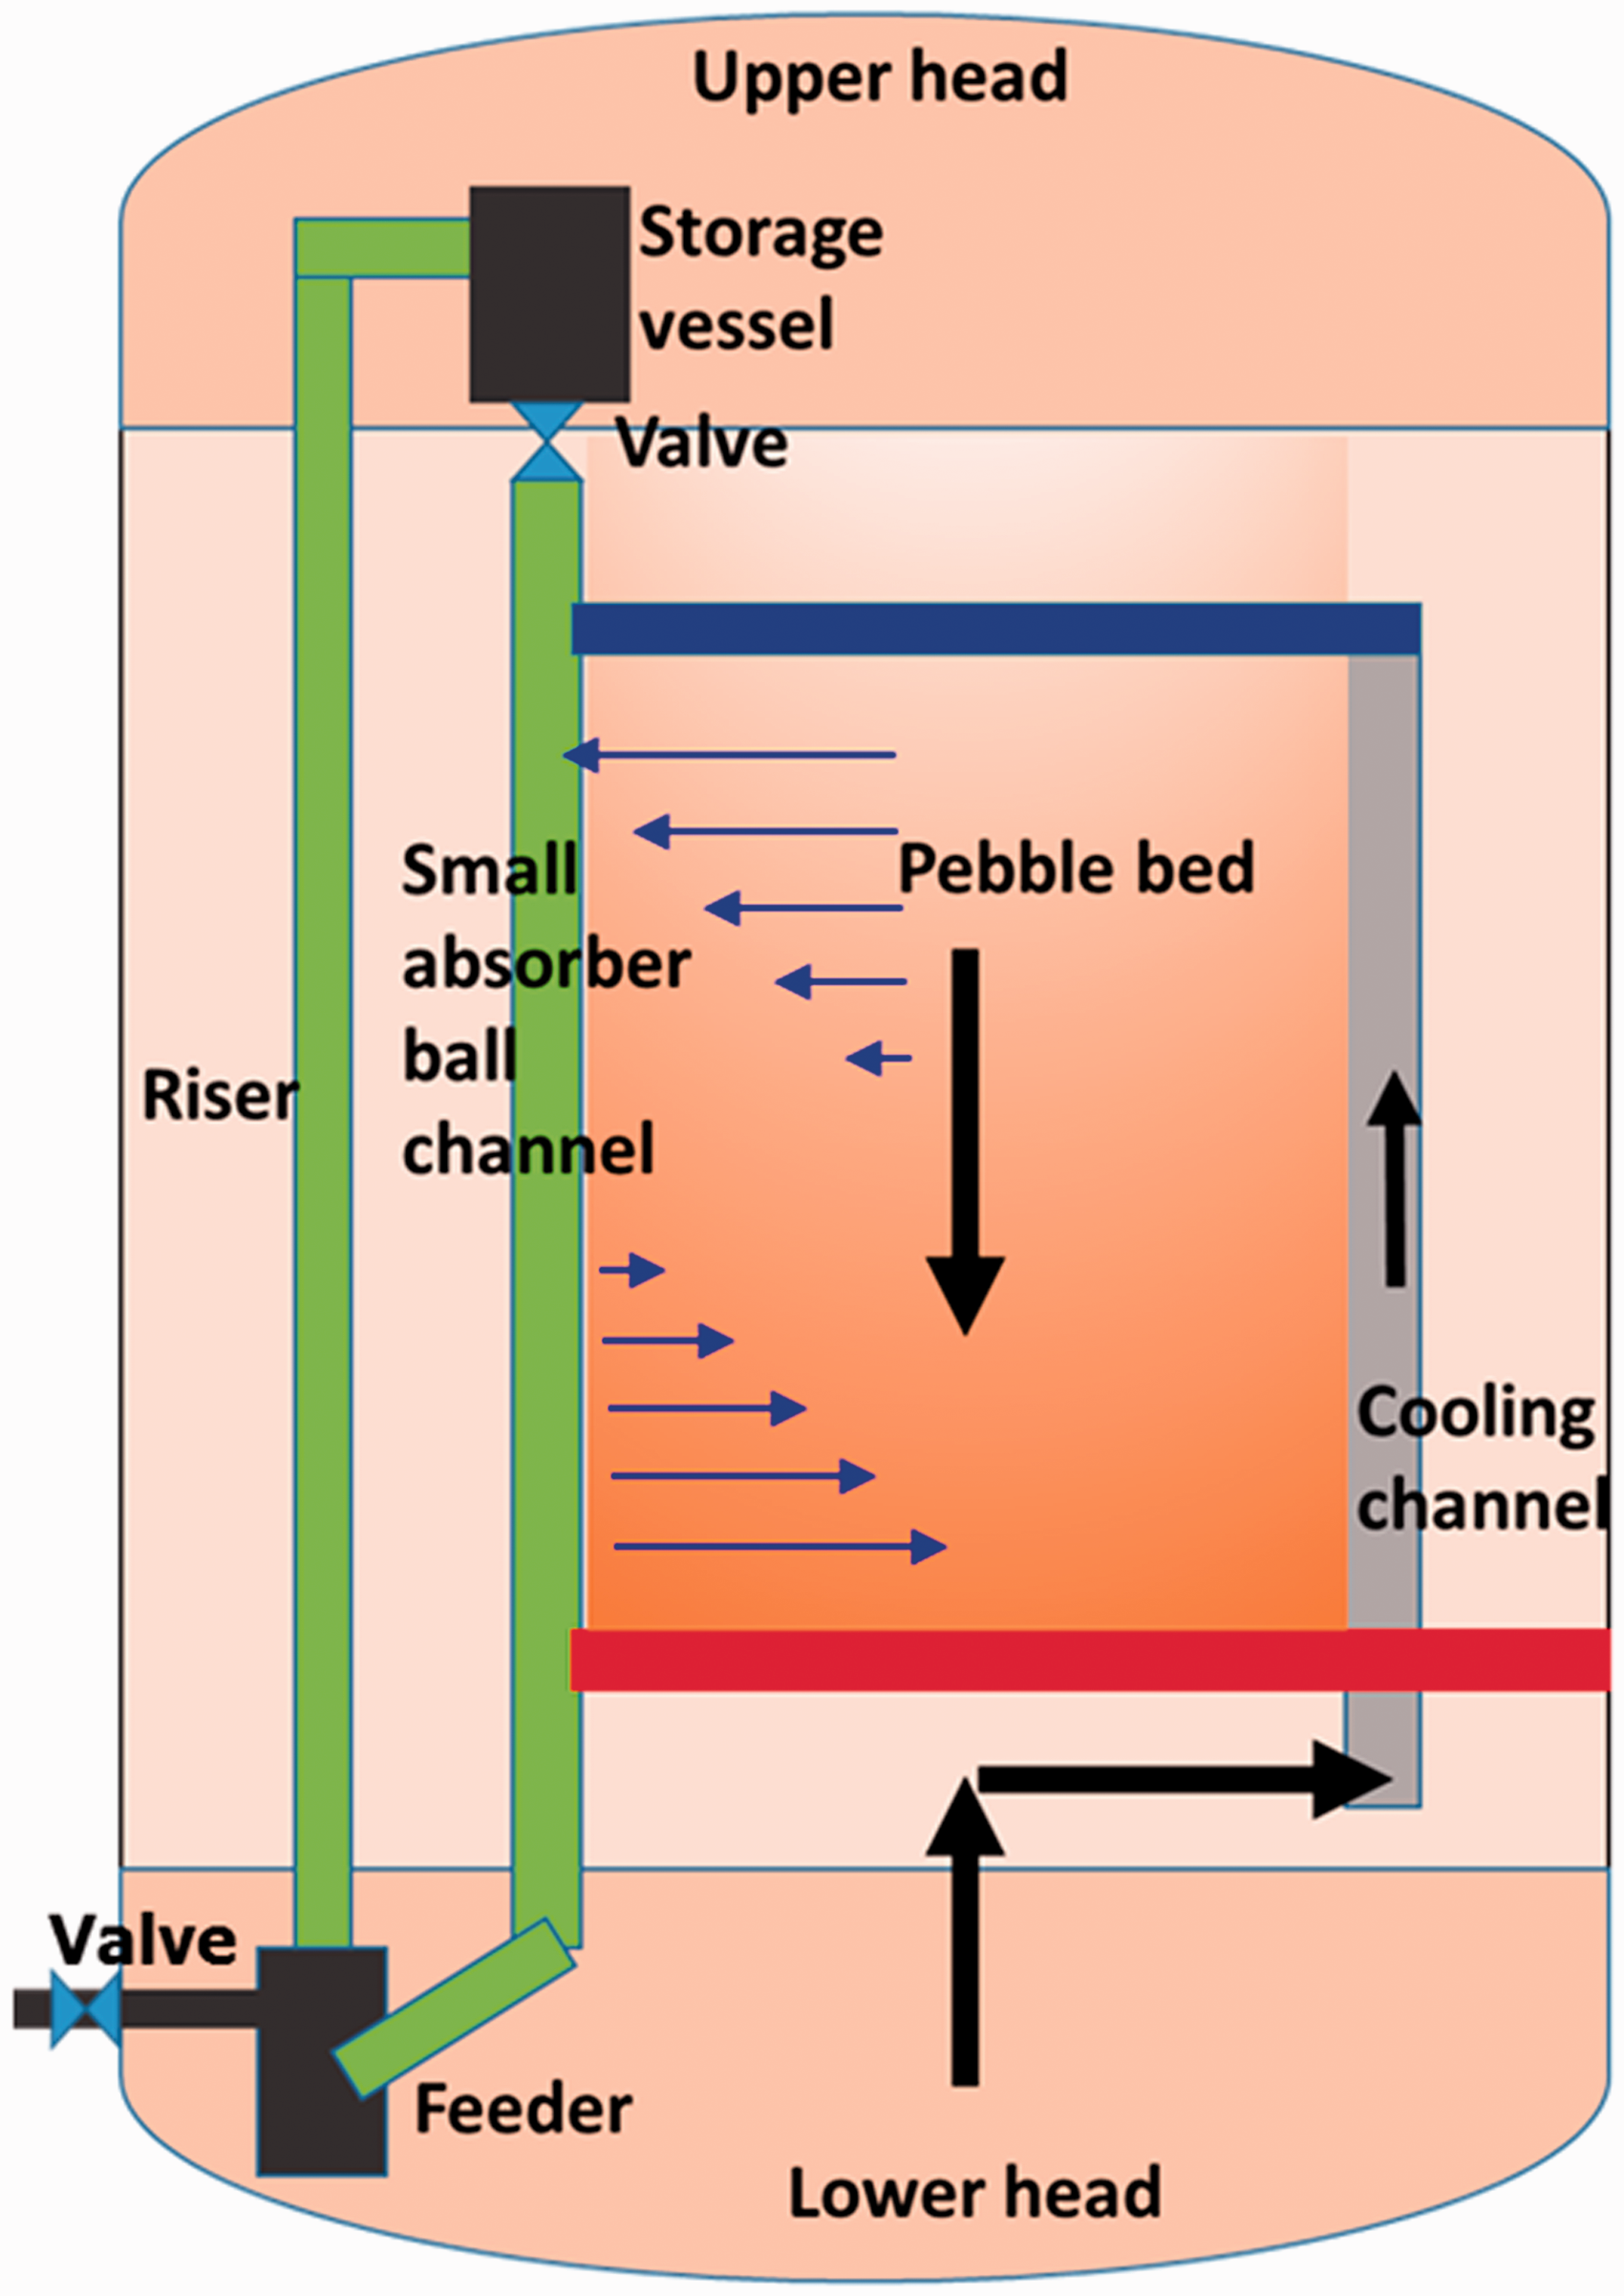
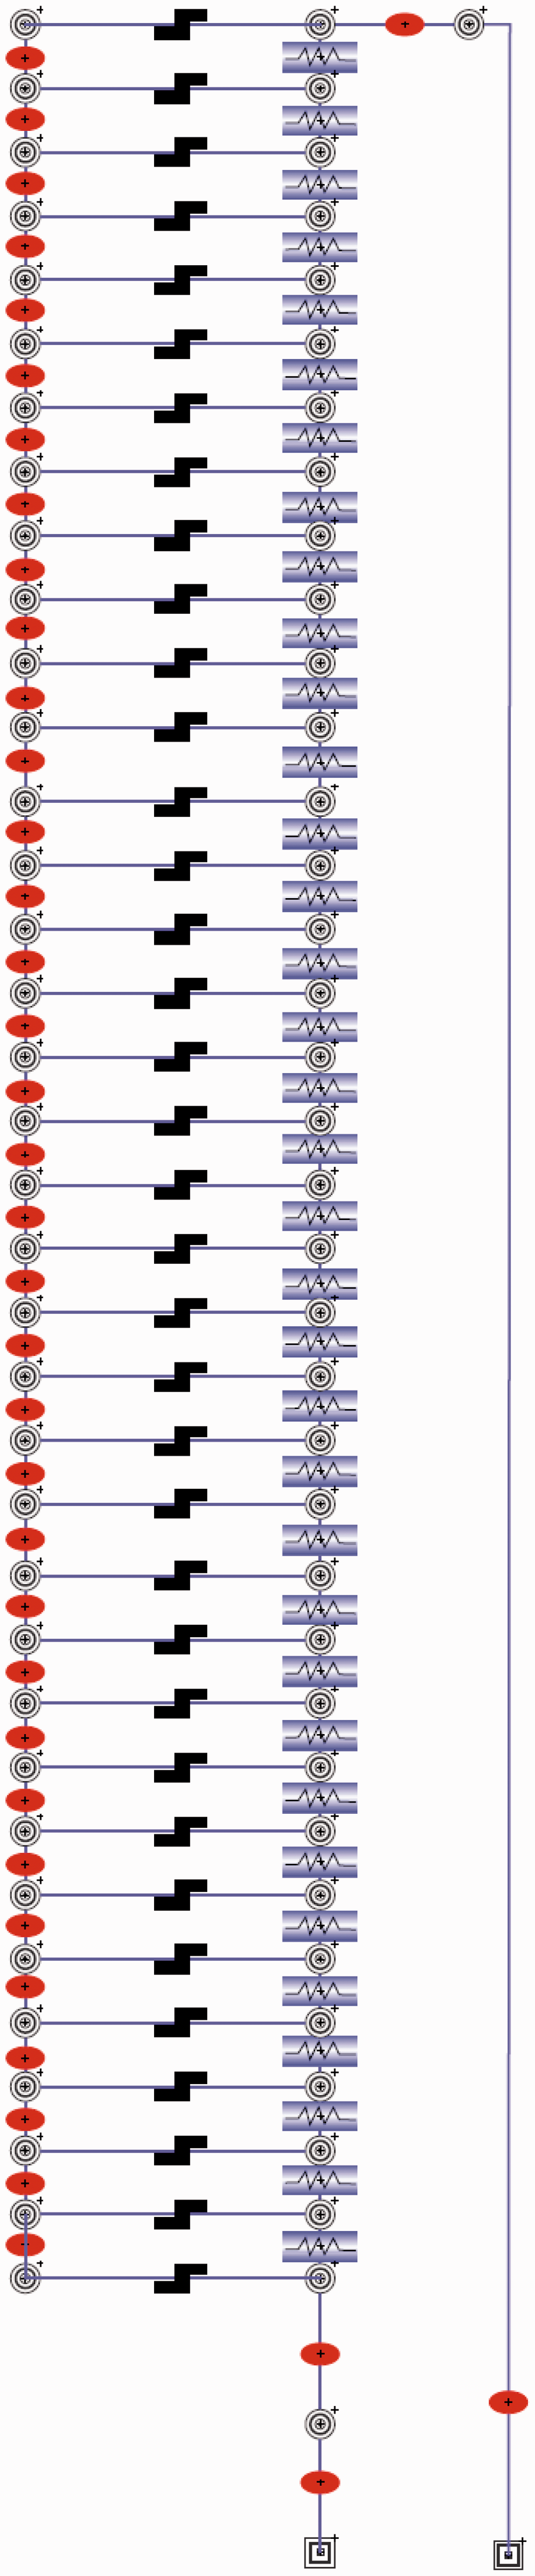
The flow network was modeled on the vPower integrated simulation platform, 9 developed by Beijing Neoswise Sci. & Tech. Co., Ltd, in China. The vPower, good simulator platform for fossil plants and nuclear power plants, could supply graphical models of flow nodes, flow links, and many commonly used equipment and systems, the mathematical algorithm of which could be further developed to fit the characteristics of flow and heat transfer in HTR-PM. 10
The flow resistant performance of each flow link usually used the concept of admittance, instead of resistance coefficient. The definition of admittance (use ADM for short) was
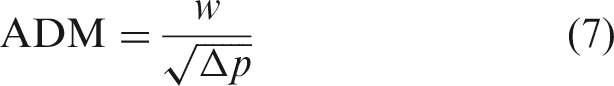
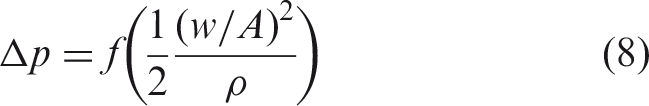
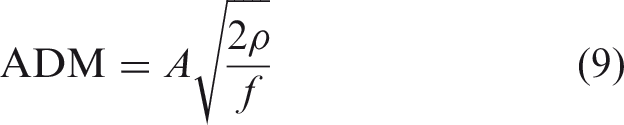
Thus, larger admittance meant lower resistance in the flow link.
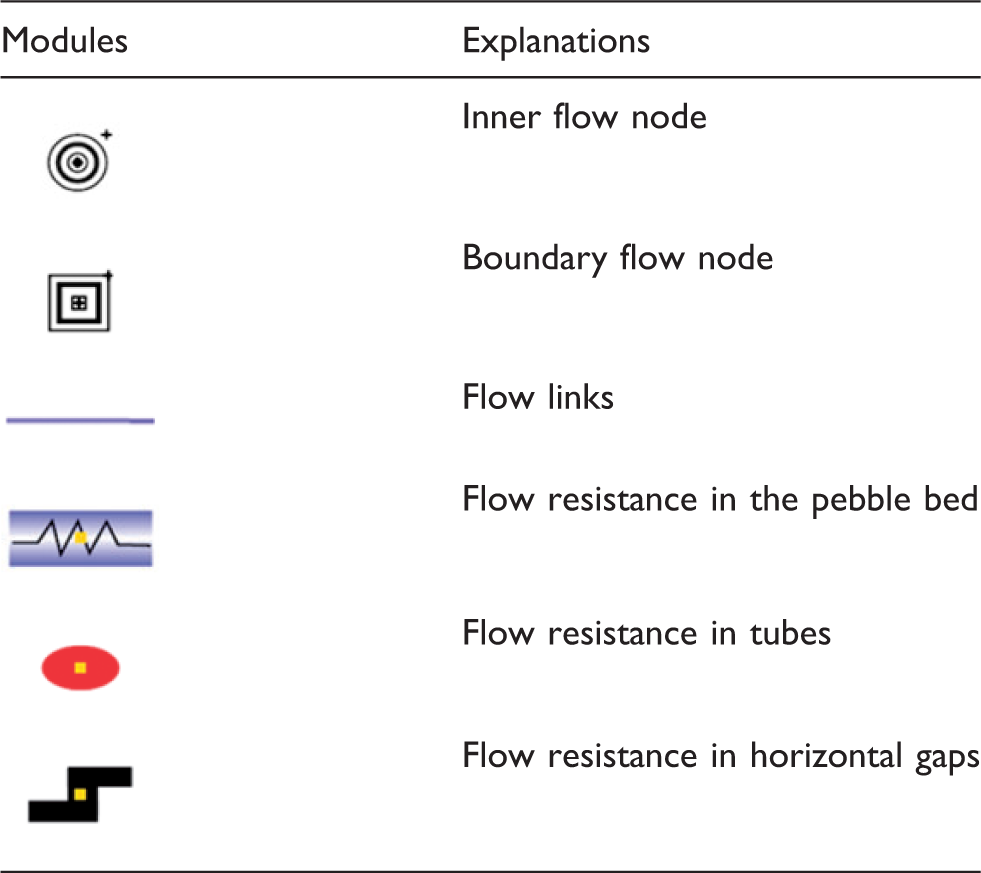
Modules in the flow network.
CFD
With rapid development of computational tools and computer technology, the CFD method has become increasingly applicable in the nuclear engineering field. Based on conservation equations of mass, momentum, and energy, irregular channels or gaps in the bypass flow problem could be effectively simulated by the CFD method.
For the horizontal gaps in this paper, the geometrical structures could be modeled in Gambit 2.4 and discretized into a mesh of control values. With the mesh files imported into the ANSYS Fluent 12, proper fluid and solid materials, turbulent models, and solving algorithms were selected. Given initial and boundary conditions, the flow and heat transfer performance could be calculated after the convergence criteria are satisfied. Usually, several cases should be simulated for a group of boundary conditions, such as various pressure differences at the inlets and outlets, in order to cover the ranges of flow rates and pressure differences for the operation conditions. The relationship of pressure drops and mass flow rates could be obtained based on CFD results by regressing those data sets and to calculate the ADM with equation (7). Constant value or function of the ADM could be implemented in the flow network calculations later.
Focused on the small absorber sphere channel and the horizontal gap between upper and lower graphite reflectors, possible flow directions are shown in Figure 7(a) and (b). Since the cross section of the small absorber sphere channel was obround, no sealing ring was designed around the horizontal gap due to structural analysis. The shape of horizontal gap could be simpler than that in the control rod channels. In this paper, two types of horizontal gaps were assumed: straight ones and deformed ones.
Illustration of small absorber sphere channel and possible flow due to the horizontal gap. (a) Vertical view and (b) three-dimensional views.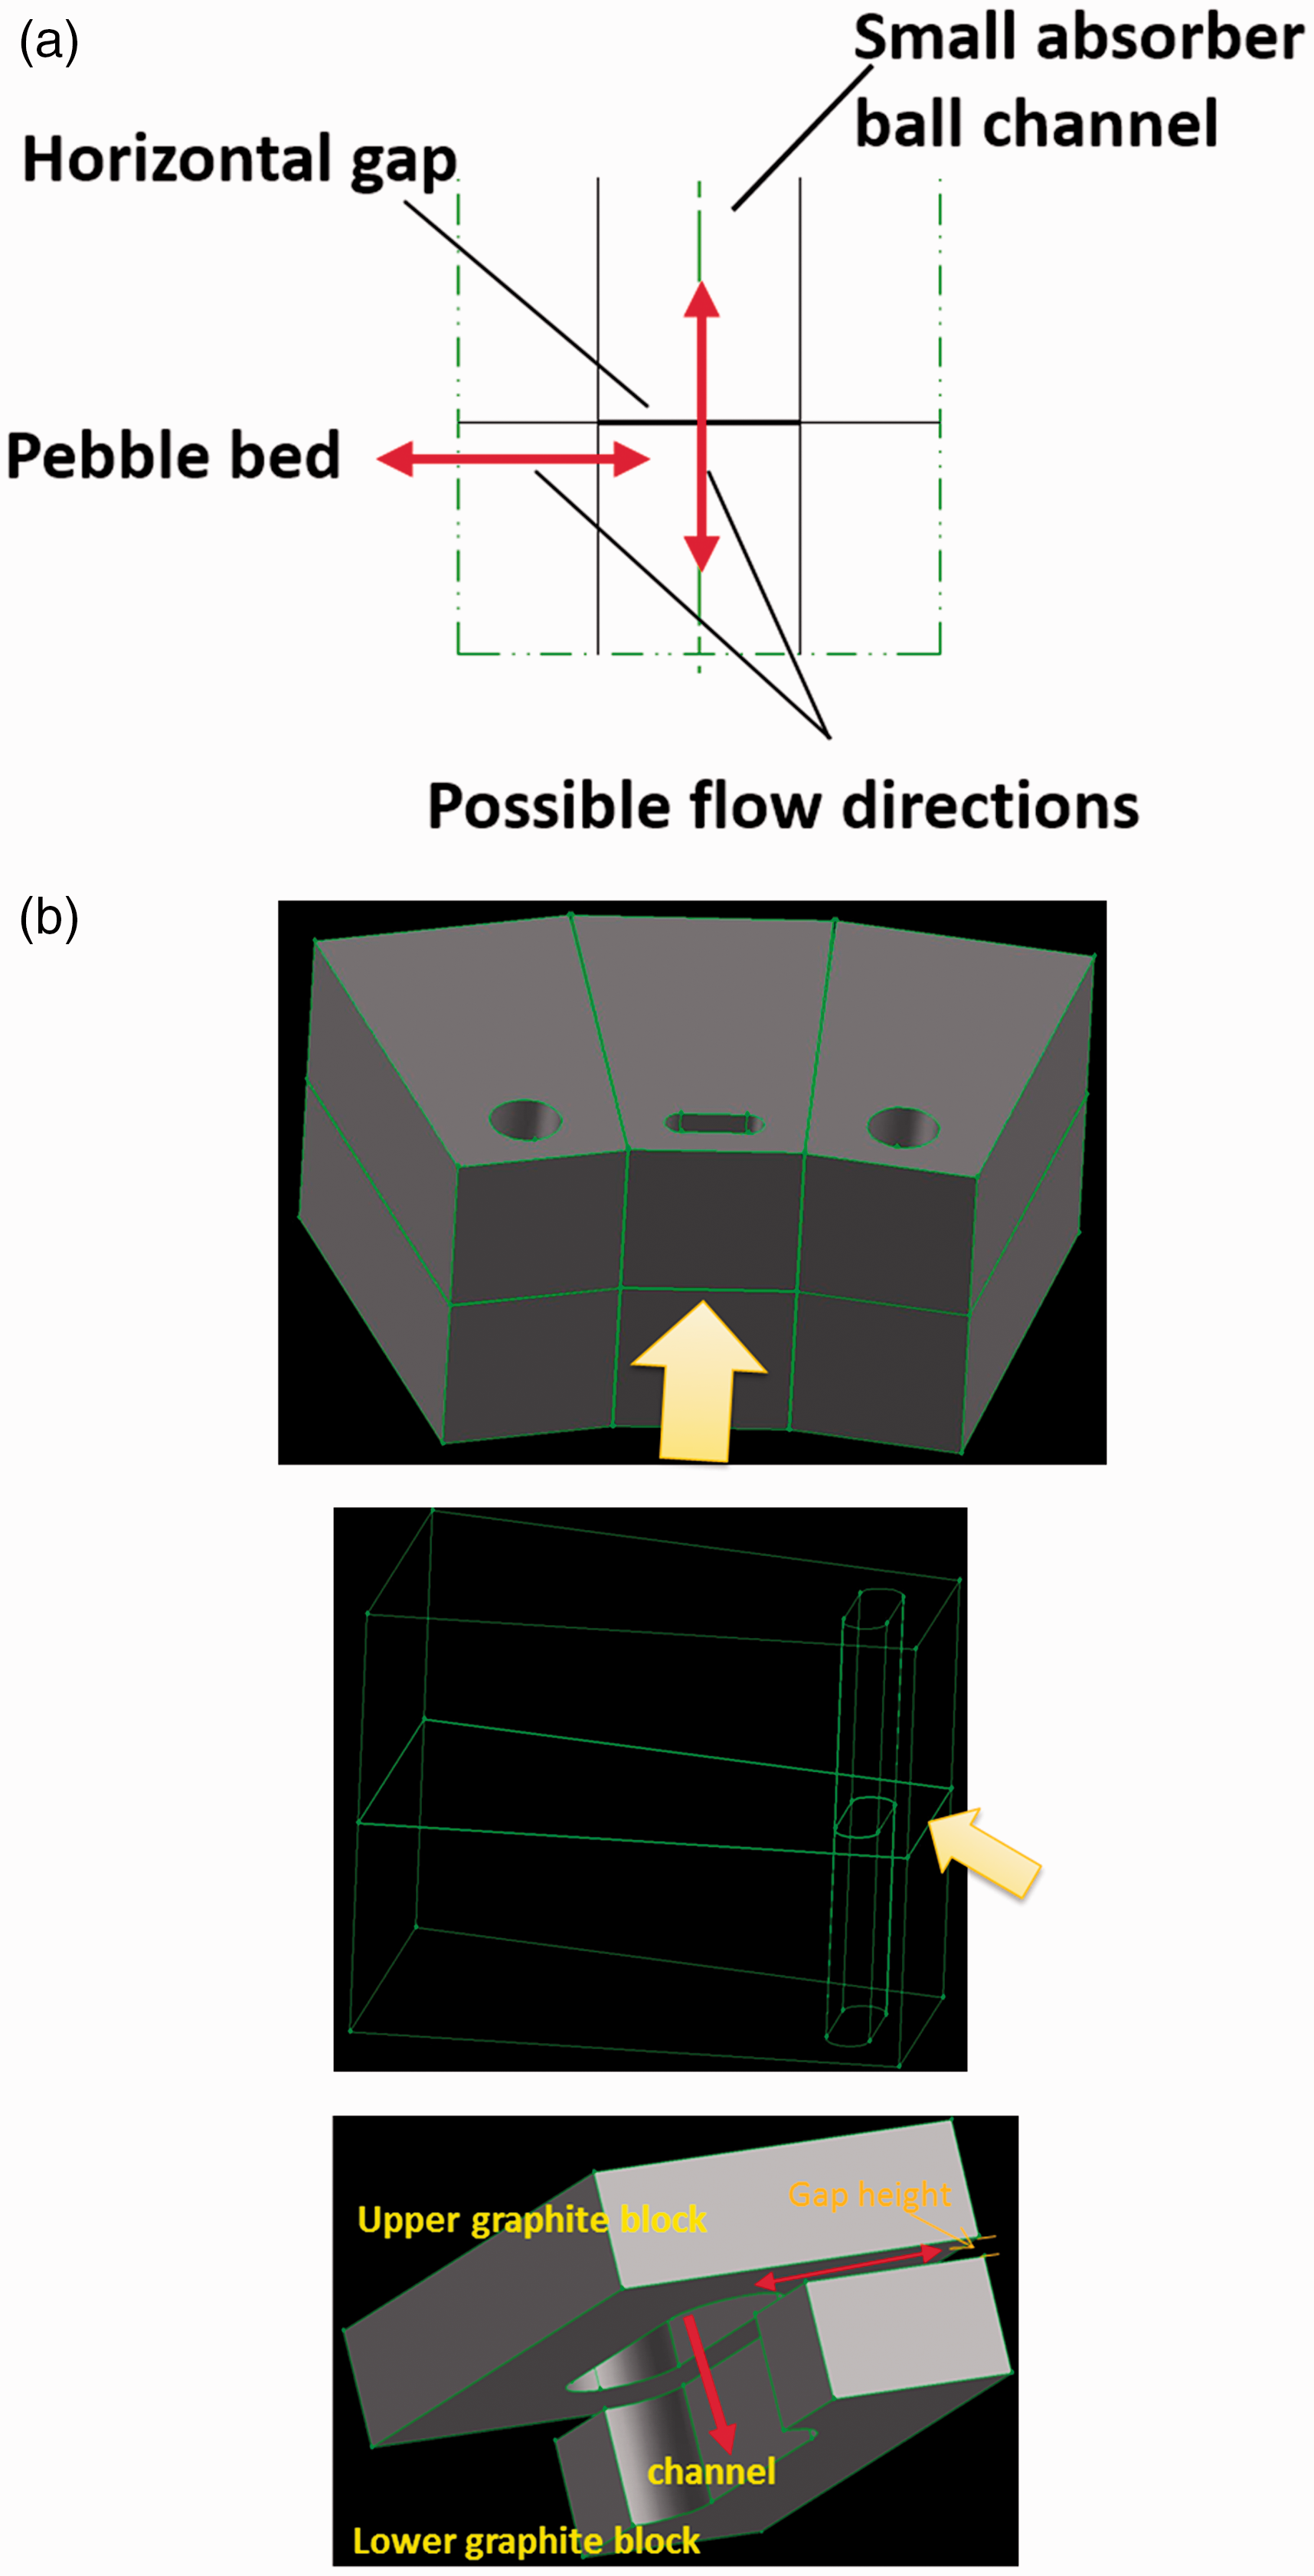
In the early operating stage of the HTR-PM, the graphite reflectors maintained the shapes as designed so that the horizontal gaps were straight and the gap heights were consistent between upper and lower graphite reflectors, shown in Figure 8. According to the design parameter, the fit tolerance, and the installation error, the gap height was less than 0.1 mm. For sensitivity analyses, two sizes of gaps 0.1 and 0.01 mm in height were calculated.
Straight horizontal gap.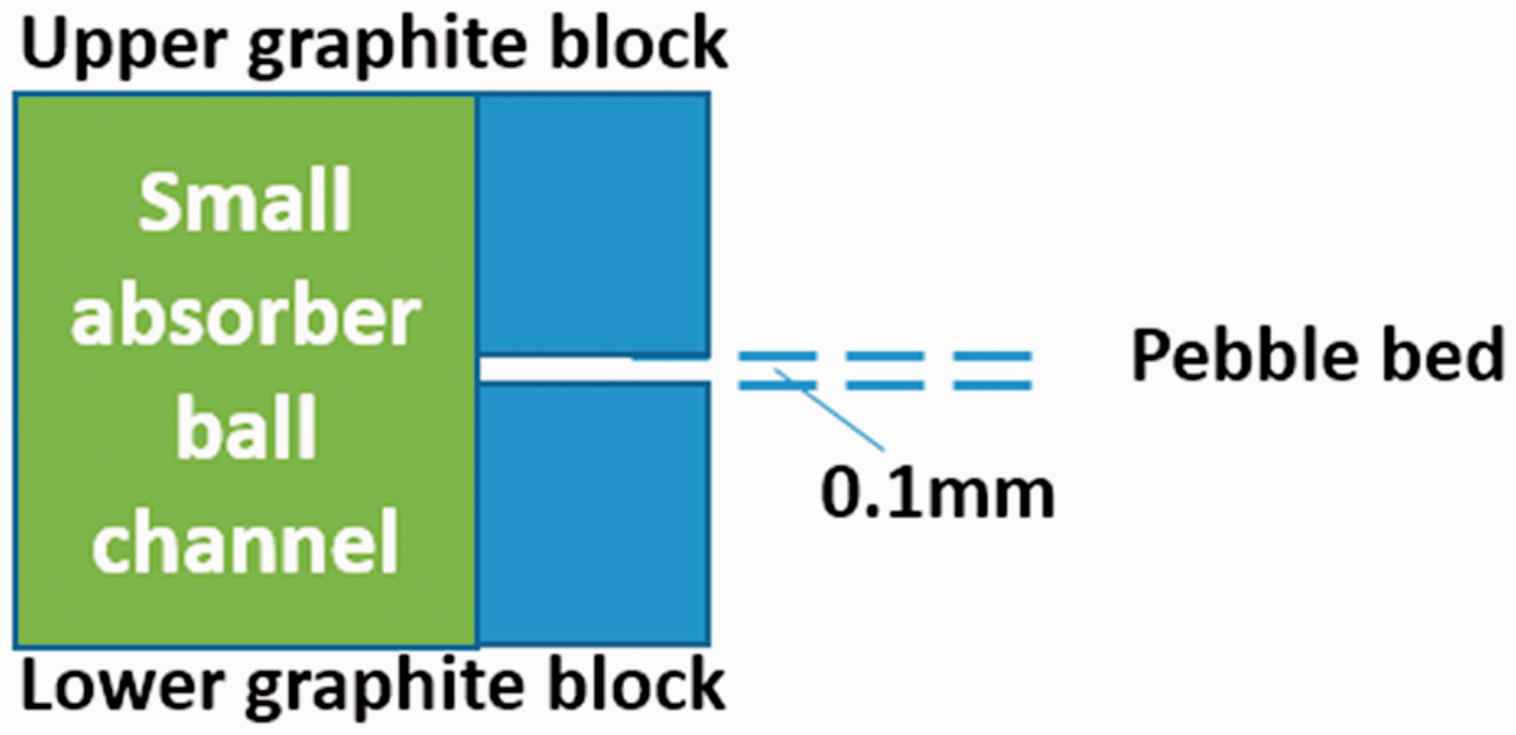
After long time operation and irradiation, the graphite reflectors deformed in different extents due to accumulated irradiation doses. As the neutron flux was at the largest level on the middle-upper part of pebble bed, the deformation of graphite blocks could be also significant at the same height. Assume that the largest shrinkage of one graphite block was 3.0 mm at the one tip of the graphite block close to the pebble bed. Therefore, the gap was not straight and the gap height varied from 6.0 mm (from both up and down surface) to less than 0.1 mm and the size variation was not linear, as shown in the left part of Figure 9. For modeling convenience and enough conservative assumptions, the nonlinear gap height distribution was simplified into combination of two sections: one half of 6.0 mm in height and the other half 0.1 mm in height, as shown in the right part of Figure 9.
Deformed horizontal gap and its simplification.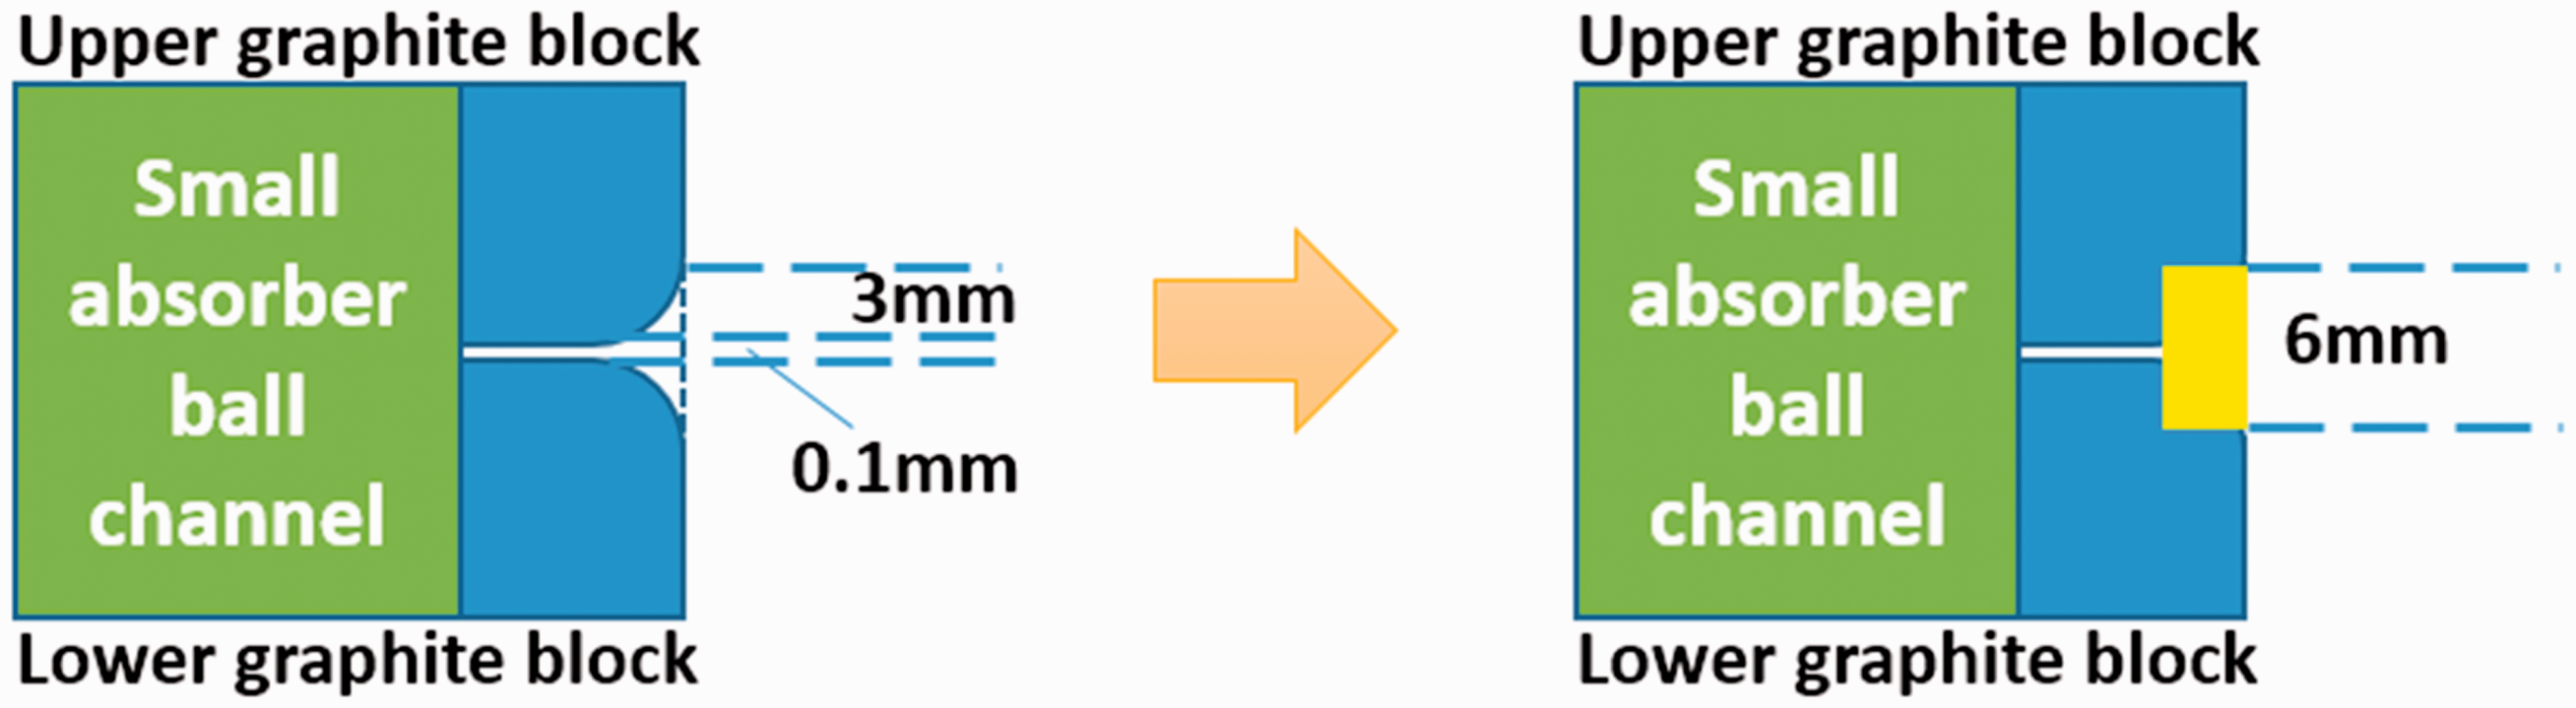
The straight and deformed gaps were modeled and simulated in many cases after mesh-independent tests, in which the helium flow properties followed the KTA 3102.1 rule
12
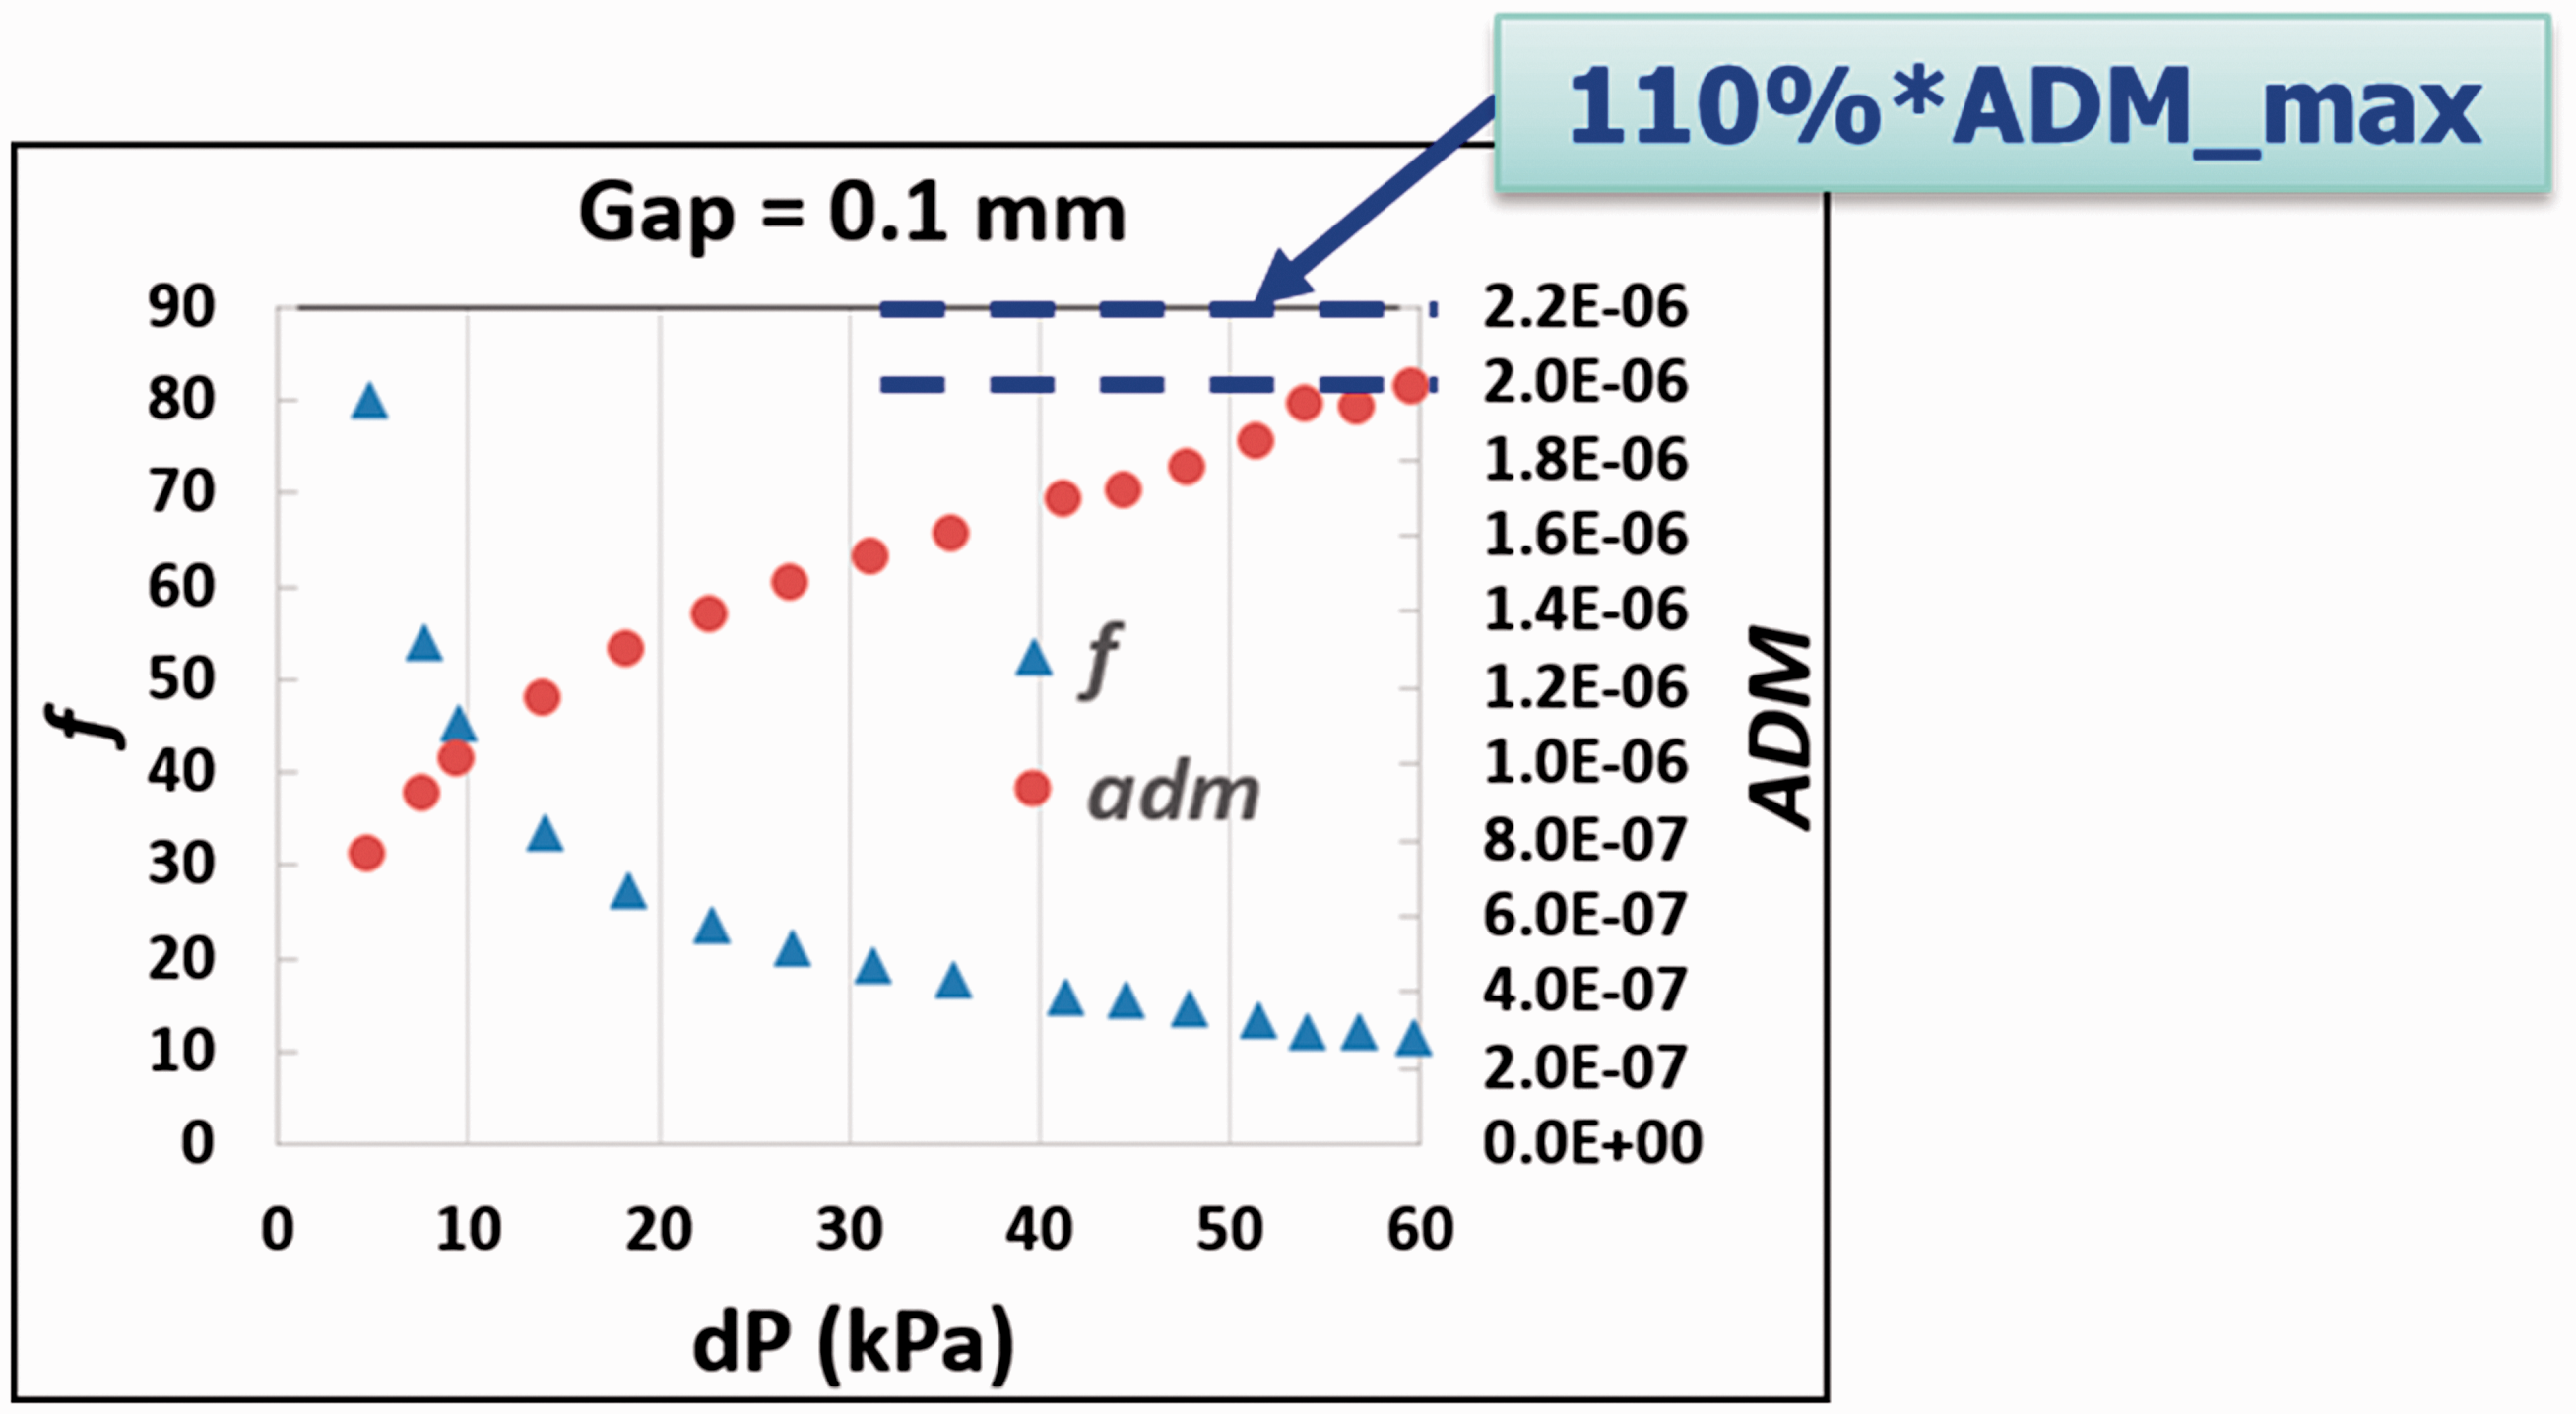
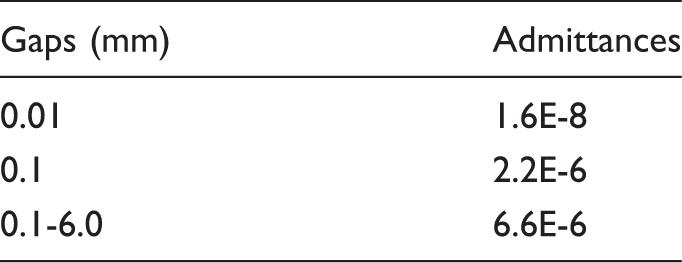
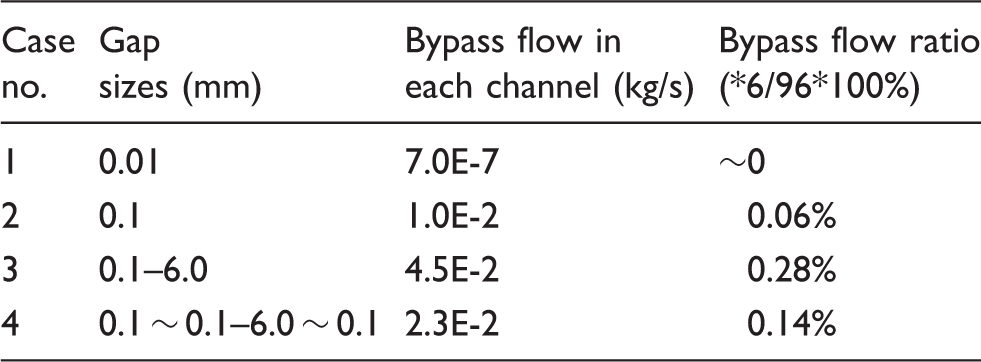
and the k–ω SST turbulent model was used due to the low Reynolds numbers. Figure 10 shows the three-dimensional geometrical model of the test case with gap size of 0.1 mm, in which large ranges of pressure inlet and outlet boundary conditions were given to calculate corresponding flow rates. The resistance coefficients and admittances were calculated in several cases and plotted in Figure 11. When the pressure drop of the gap increased, the resistance coefficient deceased and the admittance increased. The maximum value of admittance of the whole pressure drop range plus additional 10% was implemented into the flow network model for enough conservative consideration of larger bypass flow. Within the pressure drop range of pebble bed and small absorber sphere channels, the admittances of three kinds of simulated gaps were listed in Table 2. When assigning the admittances into the corresponding horizontal gap modules, the flow network could calculate the flow exchange distribution along with the pebble bed.
Geometrical model of test cases. Resistance coefficients and admittances for the test case of 0.1 mm gap. Admittances of various gaps.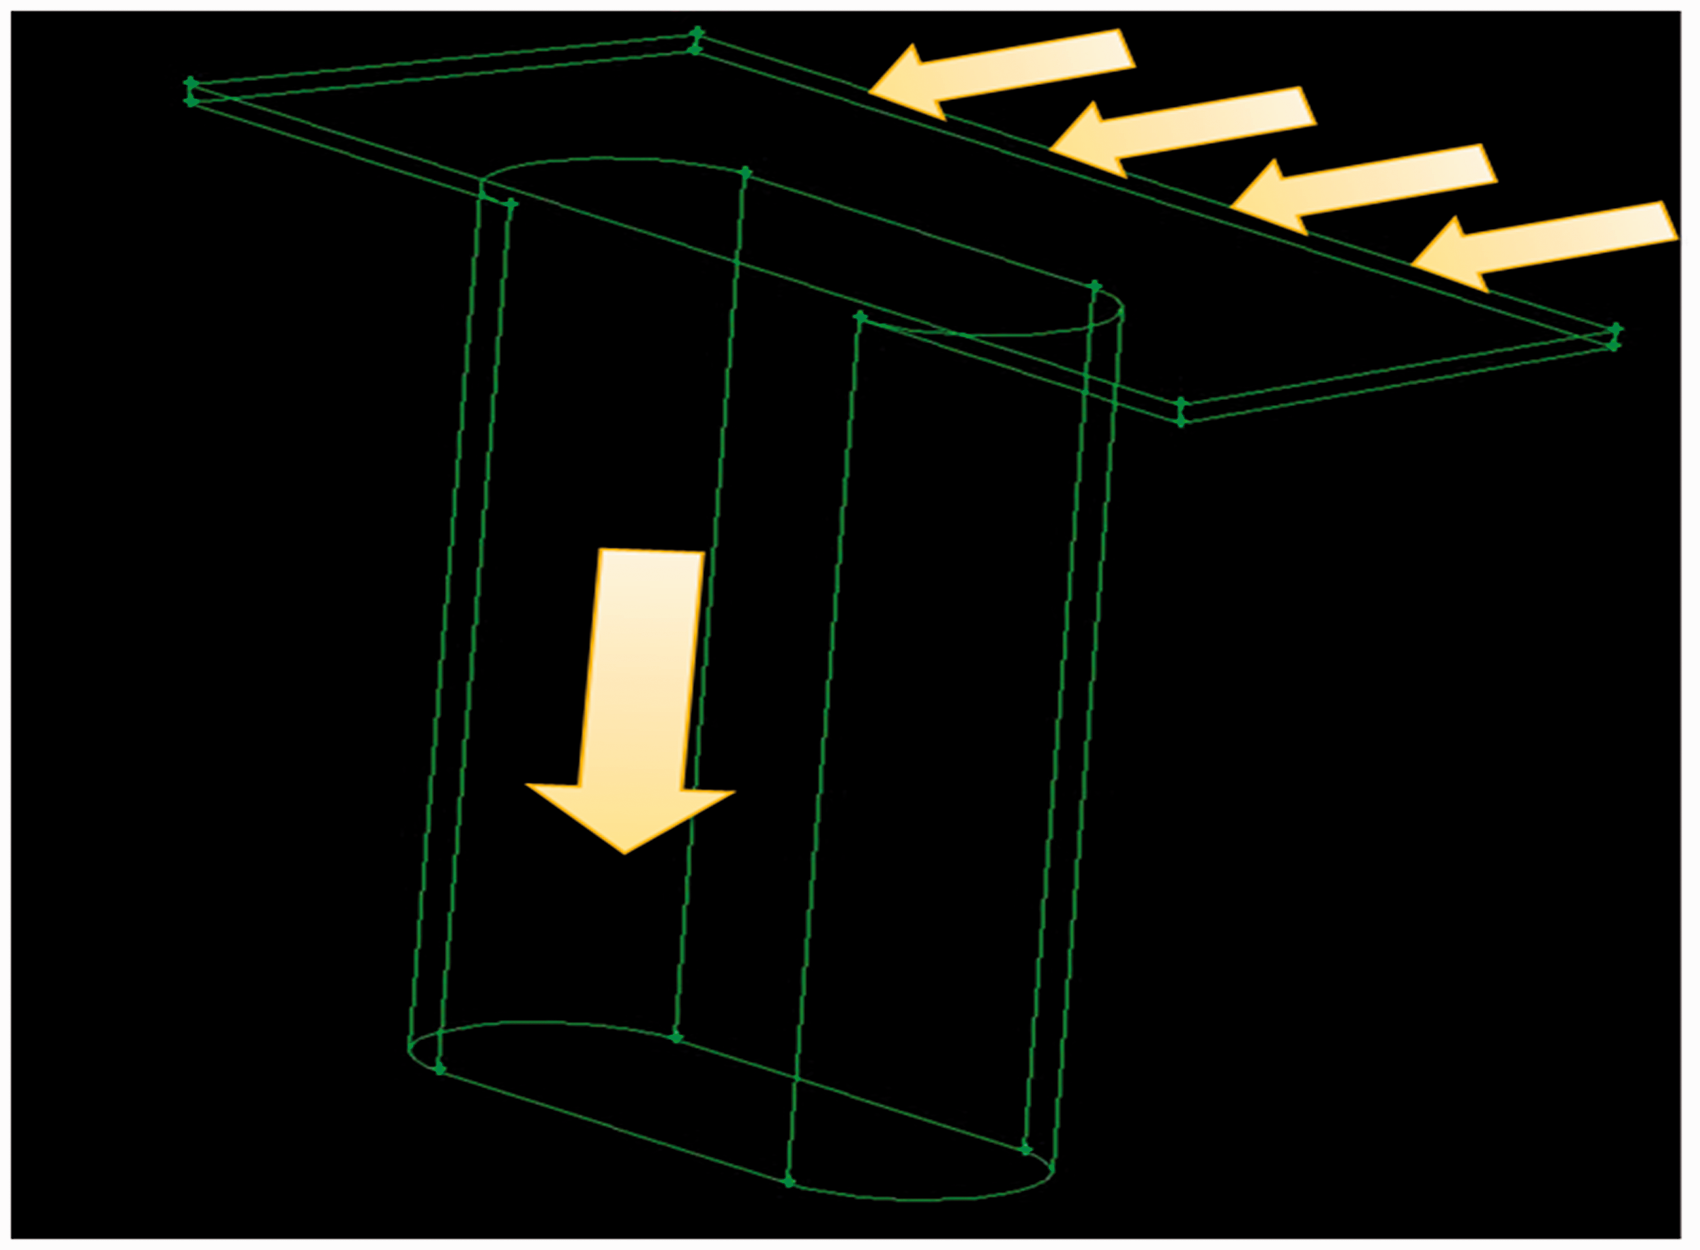
Bypass flow analyses
According to the flow network model in Figure 6 and the admittances of various horizontal gaps, the bypass flow phenomenon could be studied with proper boundary conditions. The total mass flow rate was 96 kg/s, which could be distributed into pebble beds and six small absorber sphere channels. Given the outlet pressure boundary 7 MPa, inlet helium temperature 250℃, the total pressure drop of the pebble bed was around 80 kPa and the helium was gradually heated up through the pebble bed and the outlet helium temperature reached about 750℃.
Gap size distributions in various cases.
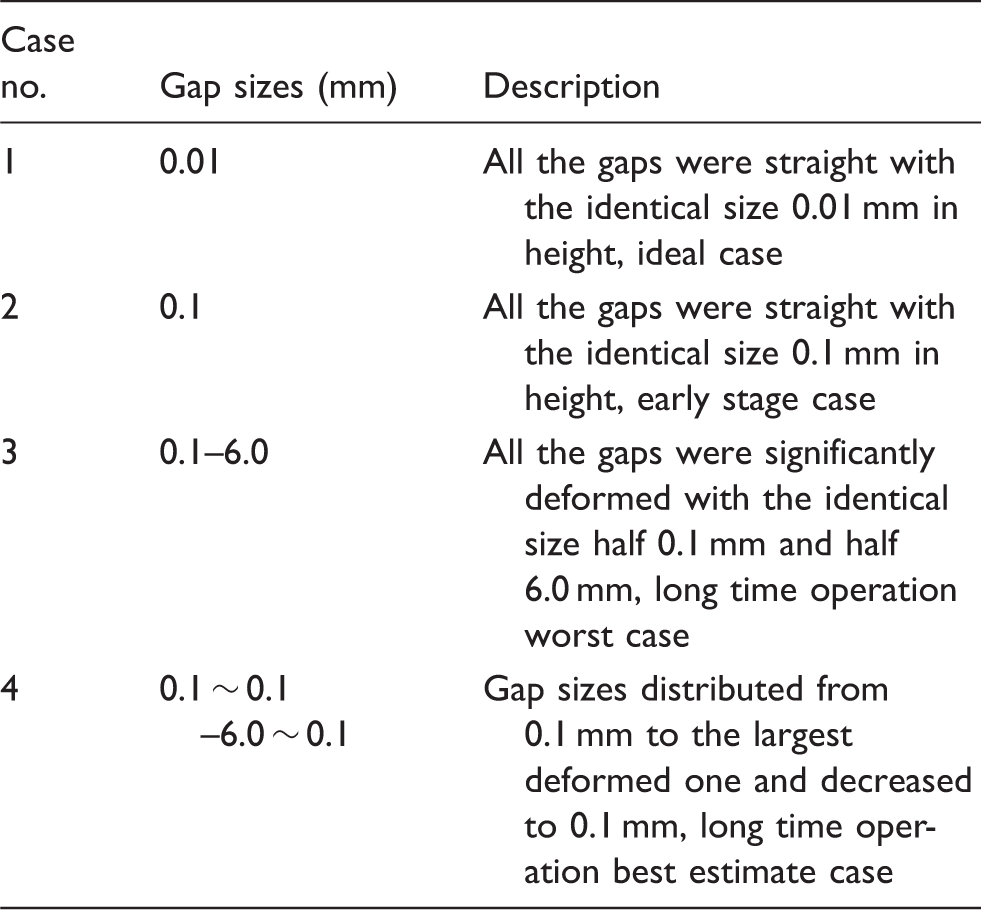
Easy to understand, Cases 1–3 had the identical gaps from top to the bottom, in which Case 1 was the ideal condition, Case 2 was the more real condition at early stage of reactor operation, and Case 3 was the worst condition after long time operation of the reactor. While for Case 4, it was a kind of best estimate condition compared with Case 3. After long time operation and irradiation, graphite blocks deformed to different extent at different positions. Along with the 11 m high pebble bed, the largest deformation occurred at 8 m from the bottom of active core, and the deformation gradually decreased from 8 m to the top and to the bottom of the pebble bed due to decreased local neutron flux. Therefore, the highest and lowest horizontal gaps were assumed to be not affected by the neutron flux and maintain the straight shapes with 0.1 mm in height, and the case was noted by “0.1 ∼ 0.1–6.0 ∼ 0.1”. For those gaps between the top and 8 m, and 8 m and the bottom, although the gap sizes were between 0.1 and 6.0 mm, we did not assume the linear distribution of gap sizes and simulate them by CFD tools. As an alternative simplicity, the admittances of those gaps were assumed to be the linear distribution between 2.2E-6 and 6.6E-6.
Since the gap sizes were identical in Cases 1, 2, and 3, the horizontal gap flow distributions were much more similar, with the flow directions shown in Figure 12. Bypass flow in the small absorber sphere channel flowed downward and was parallel with the flow in the pebble bed. At the top half part, the pebble bed had higher pressure so that helium flowed into the small absorber sphere channel. While at the bottom half part, the horizontal gap flow reversed. Thus, the top and bottom gap flow had larger flow rates, and the gap flow rate decreased to the turning point. Even the positions of the turning points were close. The difference between these three cases was the amount of horizontal flow rates.
Flow directions of the bypass flow in the small absorber sphere channels.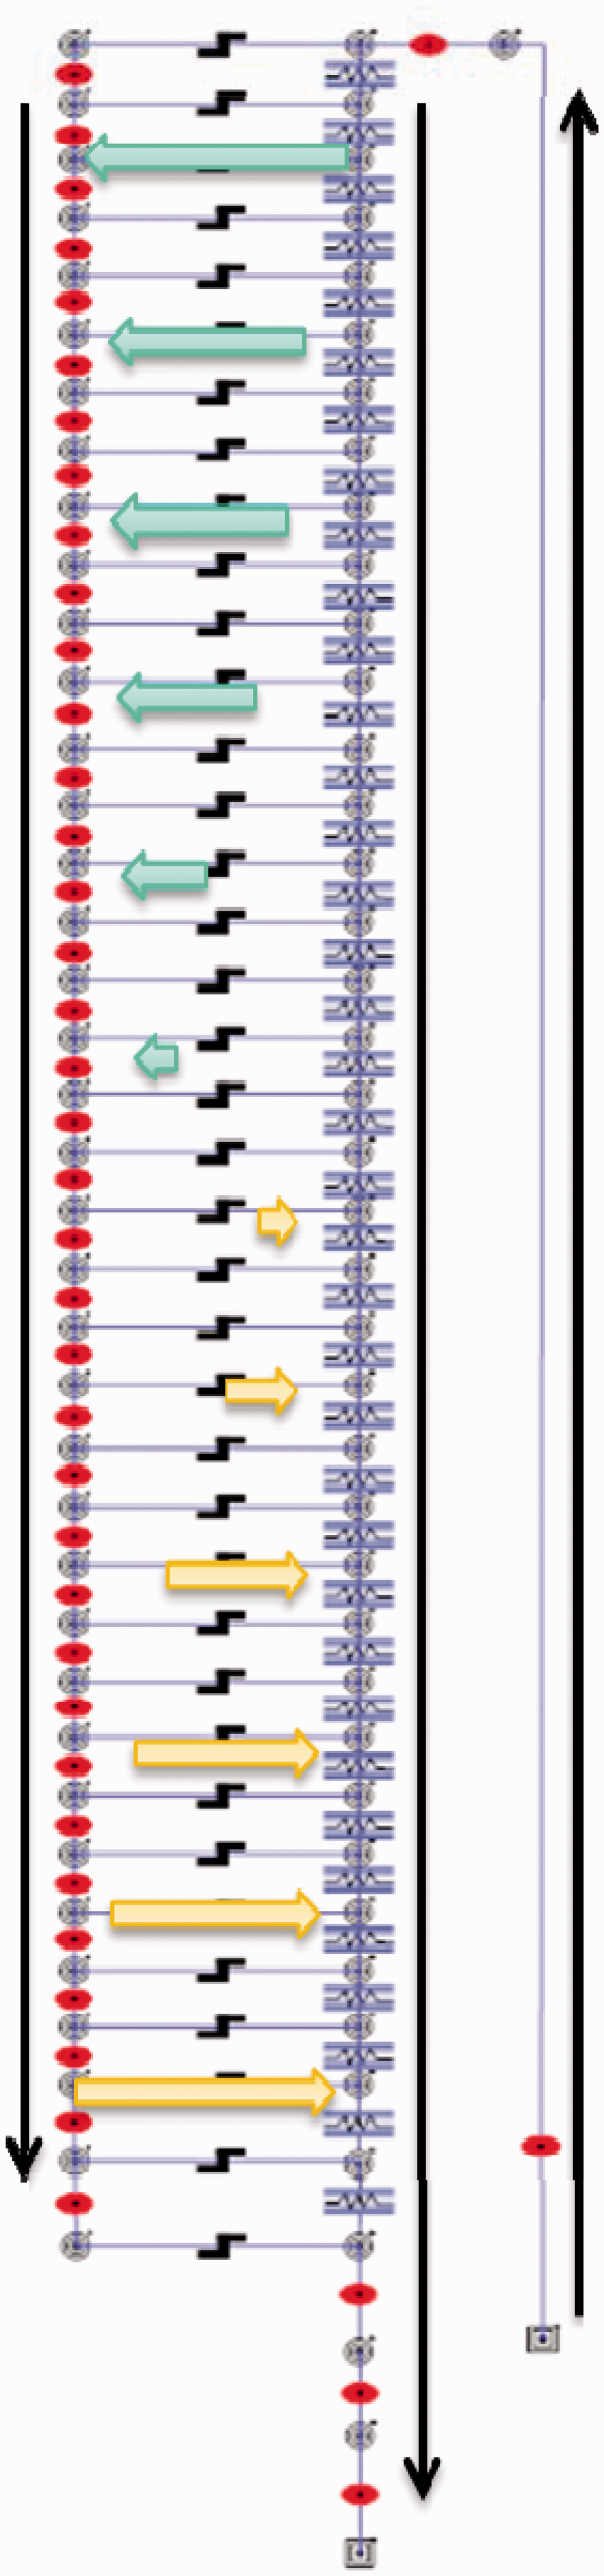
In Case 1, the gap size was so small to induce much larger horizontal resistance that the largest horizontal flow rate was less than 6E-8 kg/s. In this ideal condition, there was barely no horizontal flow.
In Case 2 and Case 3, larger gap size had lower resistance and larger admittance so that the flow exchange between the pebble bed and small absorber sphere channel was more evident. In Figure 13, the horizontal gap flow rate distributions were compared along the height of pebble bed, in which 0 m meant the bottom of pebble bed active core, and positive flow rates indicated flow into the pebble bed. The results indicated that the gap flow distributions and turning points were much similar for Case 2 and Case 3, to be about 5 m high of the pebble bed. The total flow rates exchanged between the pebble bed and one small absorber sphere channel (the sum of gap flow rates into or out of pebble bed) were 1.0E-2 kg/s in Case 2 and 4.5E-2 kg/s in Case 3 due to different gap sizes.
Horizontal gap flow rate distributions in Cases 2 and 3.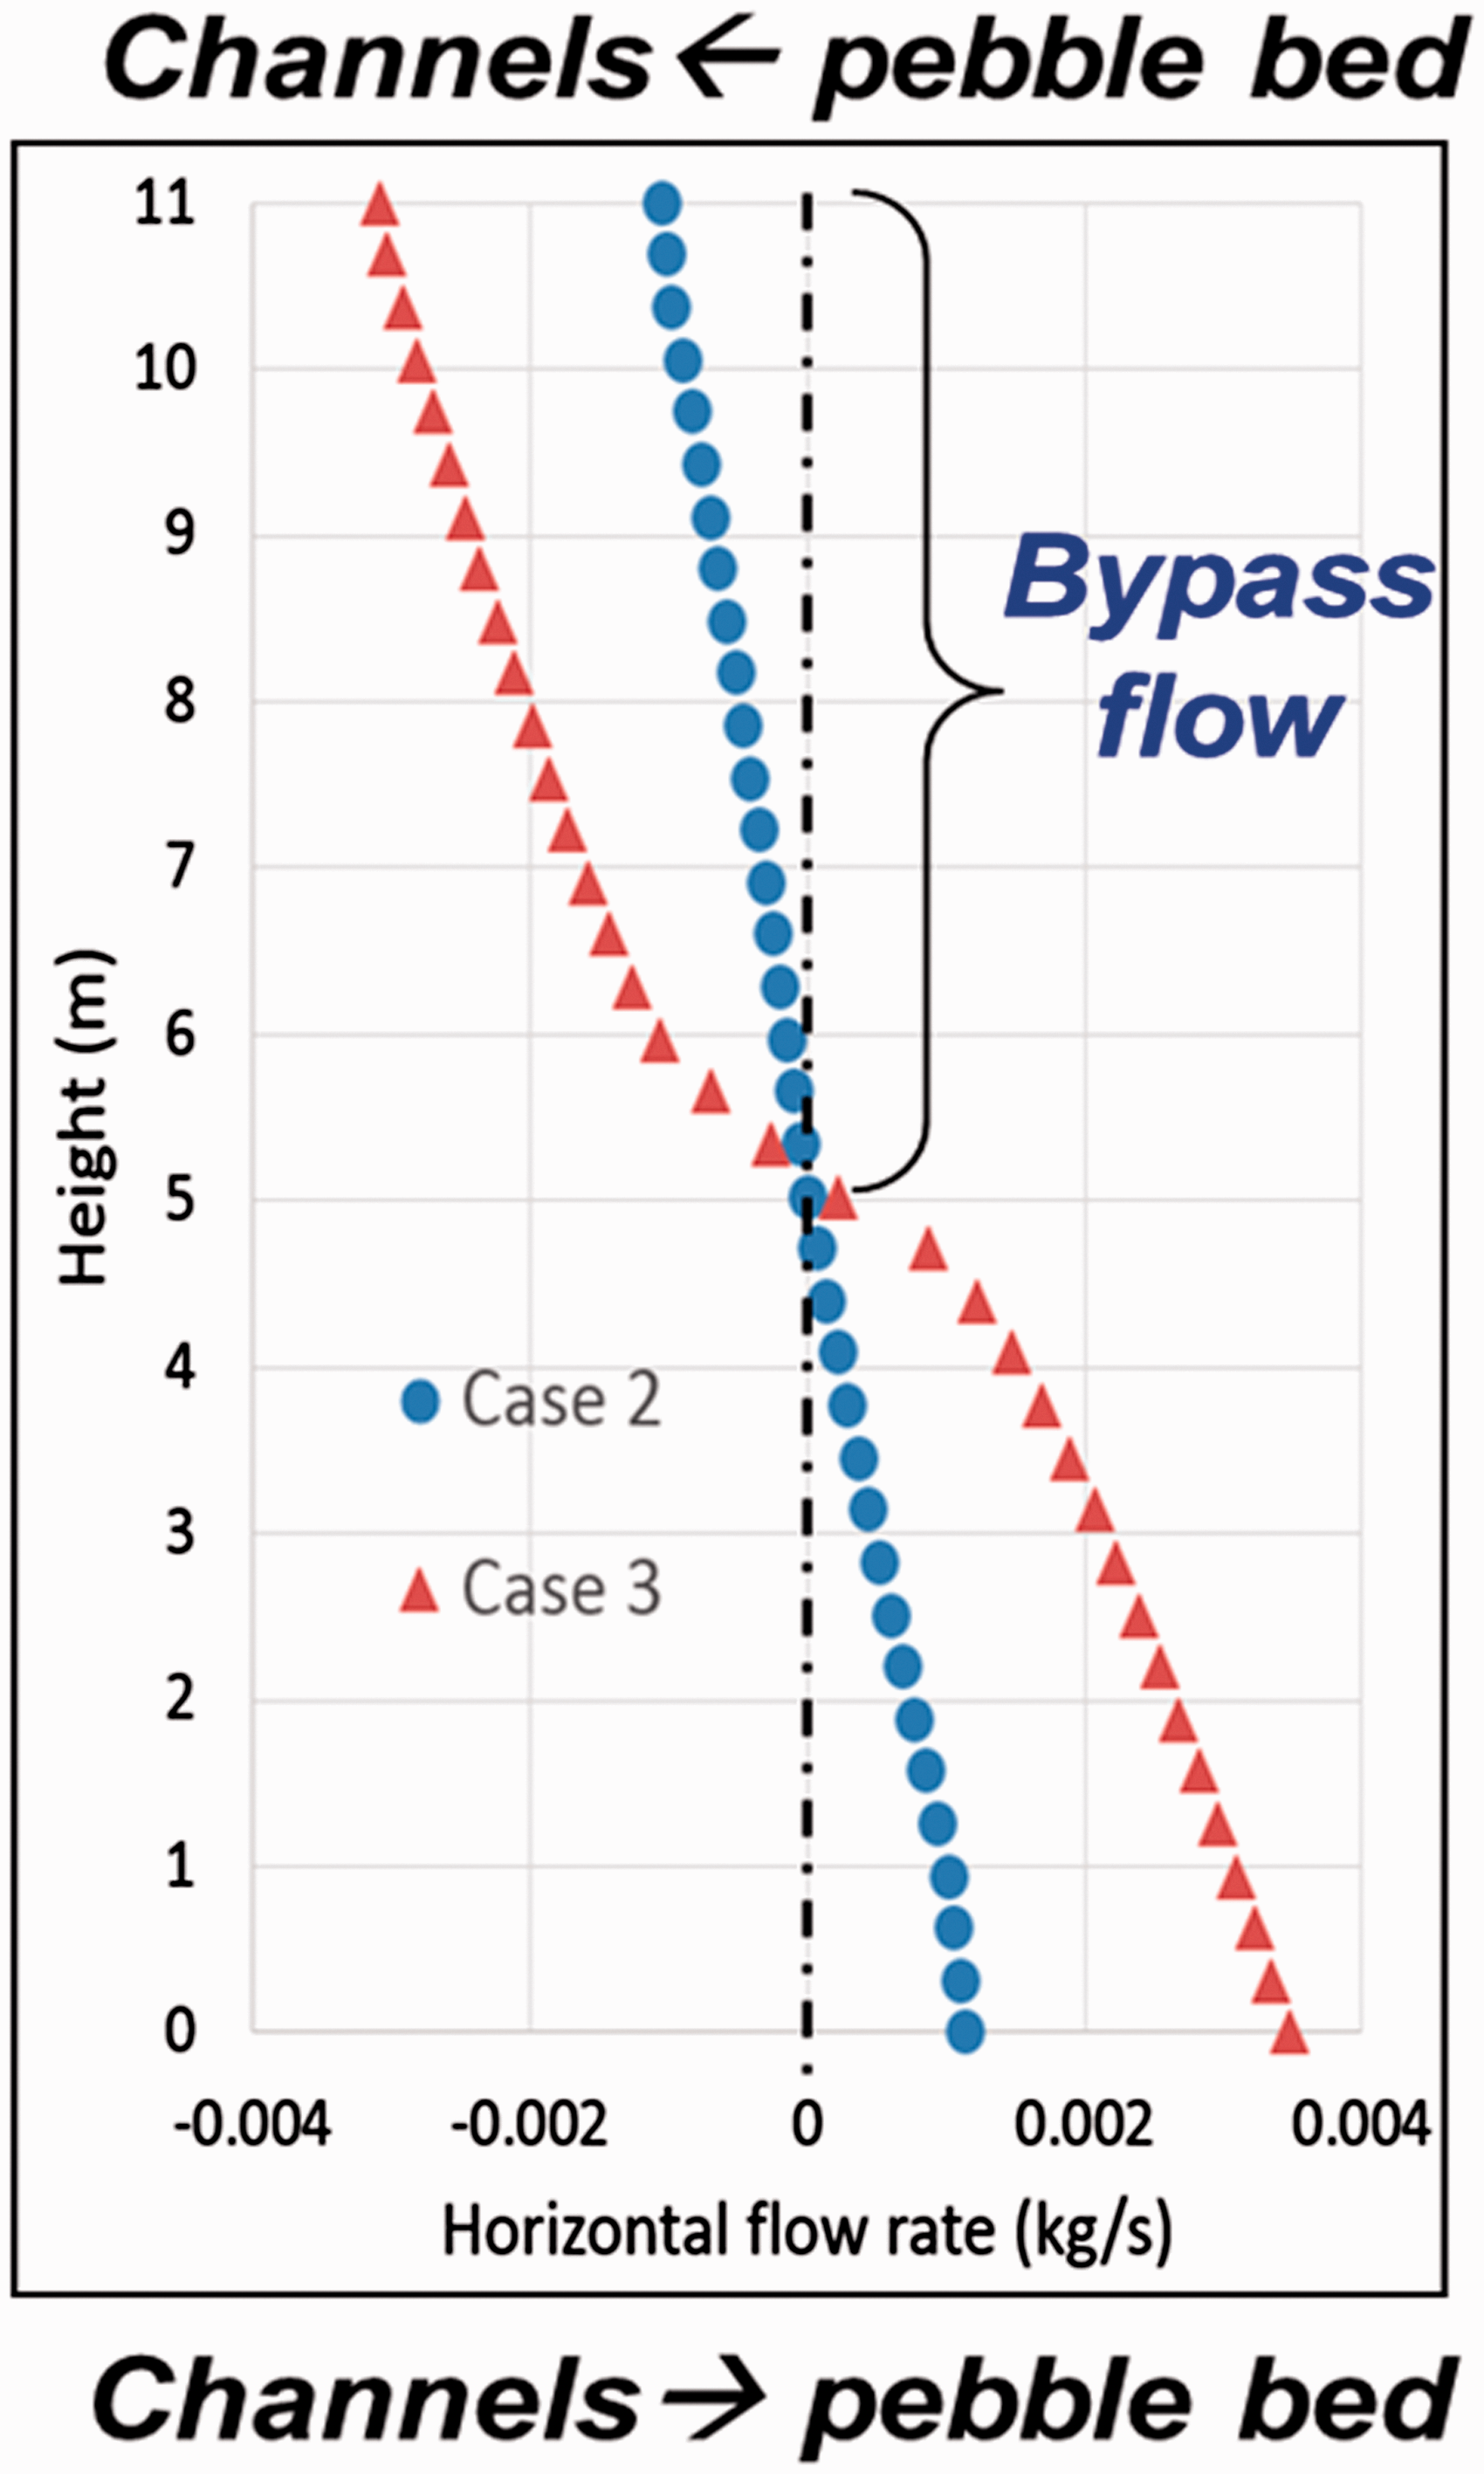
While in Case 4, since the admittance varied at different positions, the horizontal flow rates were different from other cases. According to the linear distribution of admittances assumption in Case 4, as shown in Figure 14, the gap flow distribution was different from other cases: the largest gap flow rates were with the maximum gap admittance, not at the top or bottom, and the turning point was also a little higher to about 5.7 m. As the best estimate case for the end-of-life condition, the total exchanged gap flow rate was 2.3E-2 kg/s, which was smaller than that in worst condition of Case 3.
Horizontal gap flow rate and admittance distributions in Case 4. ADM: admittance.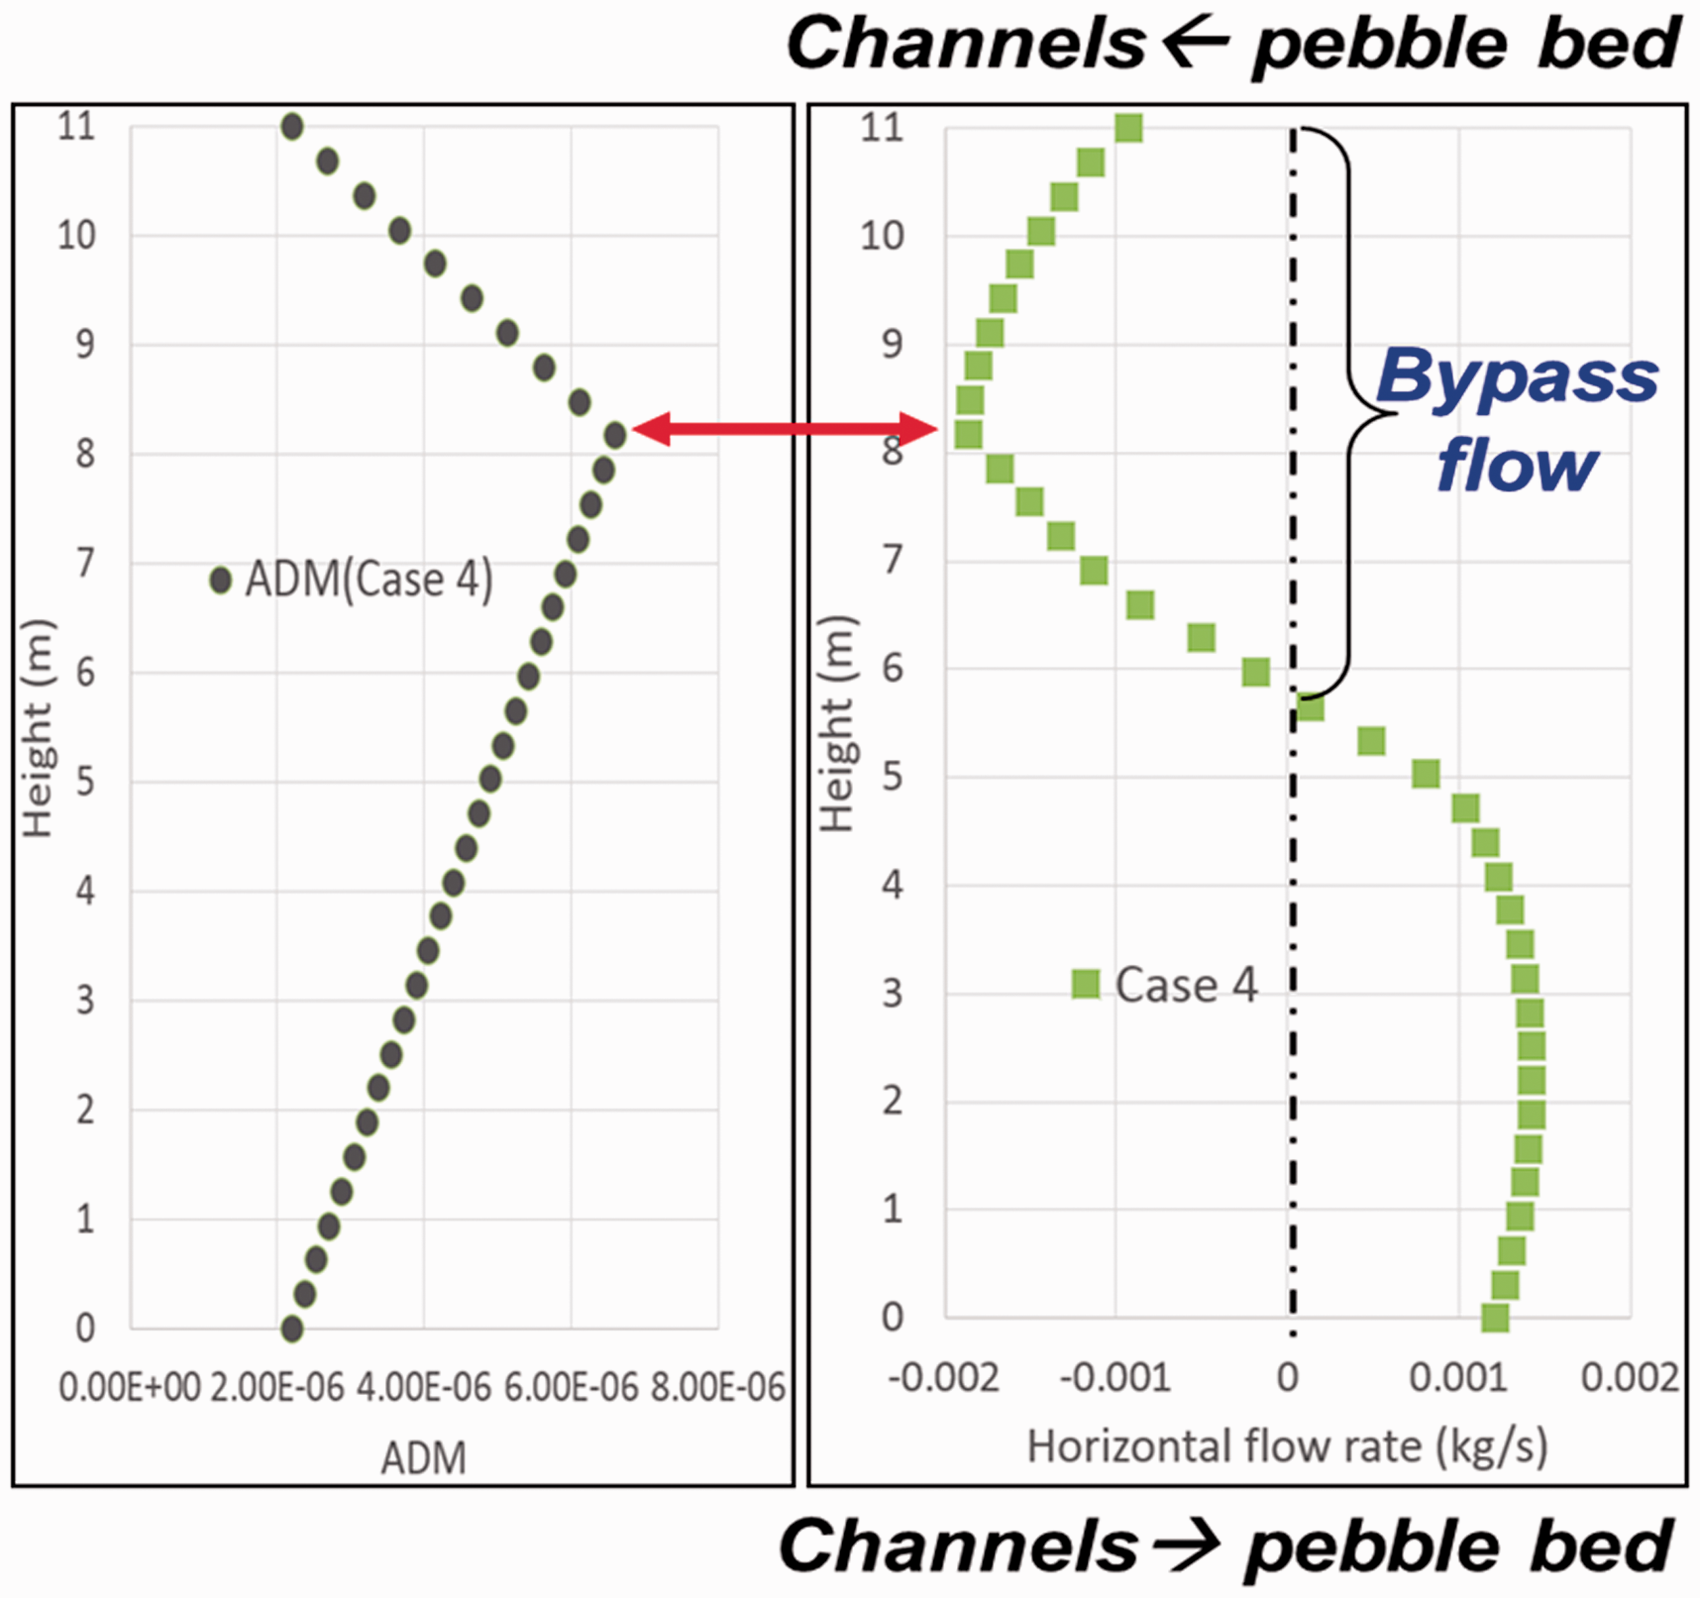
Bypass flow results in various cases.
Conclusions
The bypass flow phenomenon of HTR-PM was investigated in the small absorber sphere channels. Flow network and CFD methods were used to obtain the flow distribution on different height of pebble bed, in which three kinds of gaps were simulated in CFD to clarify the resistant performance, while four cases of gap size distributions were calculated to understand the bypass flow rates and flow directions.
The results indicated that larger horizontal gaps induced more flow exchanges between the pebble bed and small absorber sphere channels, in which bypass flow was out of the pebble bed at the top and into the pebble bed at the bottom. The flow rate distributions also depended on the gap size distributions.
At the early stage of reactor operation, the total flow rates exchanged between the pebble bed and one small absorber sphere channel were 7.0E-7 kg/s in ideal condition and 1.0E-2 kg/s in more realistic condition. While at the end life of reactor, long-term irradiation made the graphite blocks and gaps deformed so that the bypass flow in small absorber sphere channels was larger. The total flow rates exchanged between the pebble bed and one small absorber sphere channel were 2.3E-2 kg/s for best estimate condition and 4.5E-2 kg/s for the worst condition. As for all the six small absorber sphere channels in HTR-PM, the total bypass flow rate was 0.27 kg/s, only 0.28% of the mass flow in the primary loop. Therefore, the bypass flow in the small absorber sphere channels was not significant in the reactor core.
In the future work, the bypass flow inside the graphite reflectors could be considered with the vertical gaps and horizontal gaps together. The porosity variation of the pebble bed close to the graphite reflectors could also be further investigated.
Footnotes
Acknowledgement
The flow network was modeled and solved on the vPower simulation platform developed by Beijing Neoswise Sci. & Tec. Co., Ltd.
Declaration of conflicting interests
The author(s) declared no potential conflicts of interest with respect to the research, authorship, and/or publication of this article.
Funding
The author(s) disclosed receipt of the following financial support for the research, authorship, and/or publication of this article: This work has been supported by the National Natural Science Foundation of China (Grant No. 51406102) and the National S&T Major Project (Grant No. ZX069).