
Abstract
This paper reviews the use of non-intrusive optical infrared sensing for gas–liquid flow characterisation in pipes. The application of signal analysis techniques to infrared-derived temporal signal outputs enables the objective determination of flow characteristics such as flow regimes, phase fractions and total pressure drops. Key considerations for improving the performance of infrared sensors are discussed. These include global and local measurements, ray divergence, effects of ambient light and temperature variations. Most experimental studies have reported consistent and excellent results for flow regime identifications and phase fraction estimation but with a few validating total pressures drop from correlations and direct pressure measurements. Other gaps in research were highlighted; these include the use of pipes sizes greater than 0.005 m for experimentation under high superficial velocities conditions greater than 10 m/s. The capabilities of infrared sensing as a standalone measurement for flow metering were considered a possibility via an inferential approach for phase volumetric rates. More so, the derived infrared sensing flow characteristics could be combined with available pressure–volume–temperature correlations in estimating mass flow rates of each phase. As a future development, a conceptual modification to surface installations using a transparent opaque coupling is suggested to overcome the accessibility limitation of infrared light penetration for opaque pipes.
Introduction
The characterisation of multiphase flow (MPF) in pipes is essential for engineering design and flow performance predictions. The oil and gas industry experiences MPF in the form of gas–liquid flow (GLF) from its upstream to downstream sectors. These characteristics include flow regimes, phase fractions and two-phase pressure drops. Flow regimes describe the geometrical distribution of each phase in the pipe or tubing and it depends on the velocities, fluid properties and pipe orientations.
1
They are qualitatively categorized over varied flow conditions as mainly dispersed and stratified flows. Dispersed regimes are dominant for vertical flows and with increasing gas fractions, the flow regimes transition from a bubble flow, slug, churn and to annular flows. Typical vertical flow regimes for GLF are illustrated in Figure 1(a). Stratified flows are dominant for horizontal flows as well with transition occurring for increasing phase fractions. They are categorized by most researchers as stratified, plug, bubble and annular flows. Figure 1(b) shows typical flow regimes of horizontal flows. Other subjective variations exist with a detailed review from Omebere-Iyari and Azzopardi
2
and Bratland
3
Typical flow regimes for (a) vertical and (b) horizontal flow of gas and liquid flow.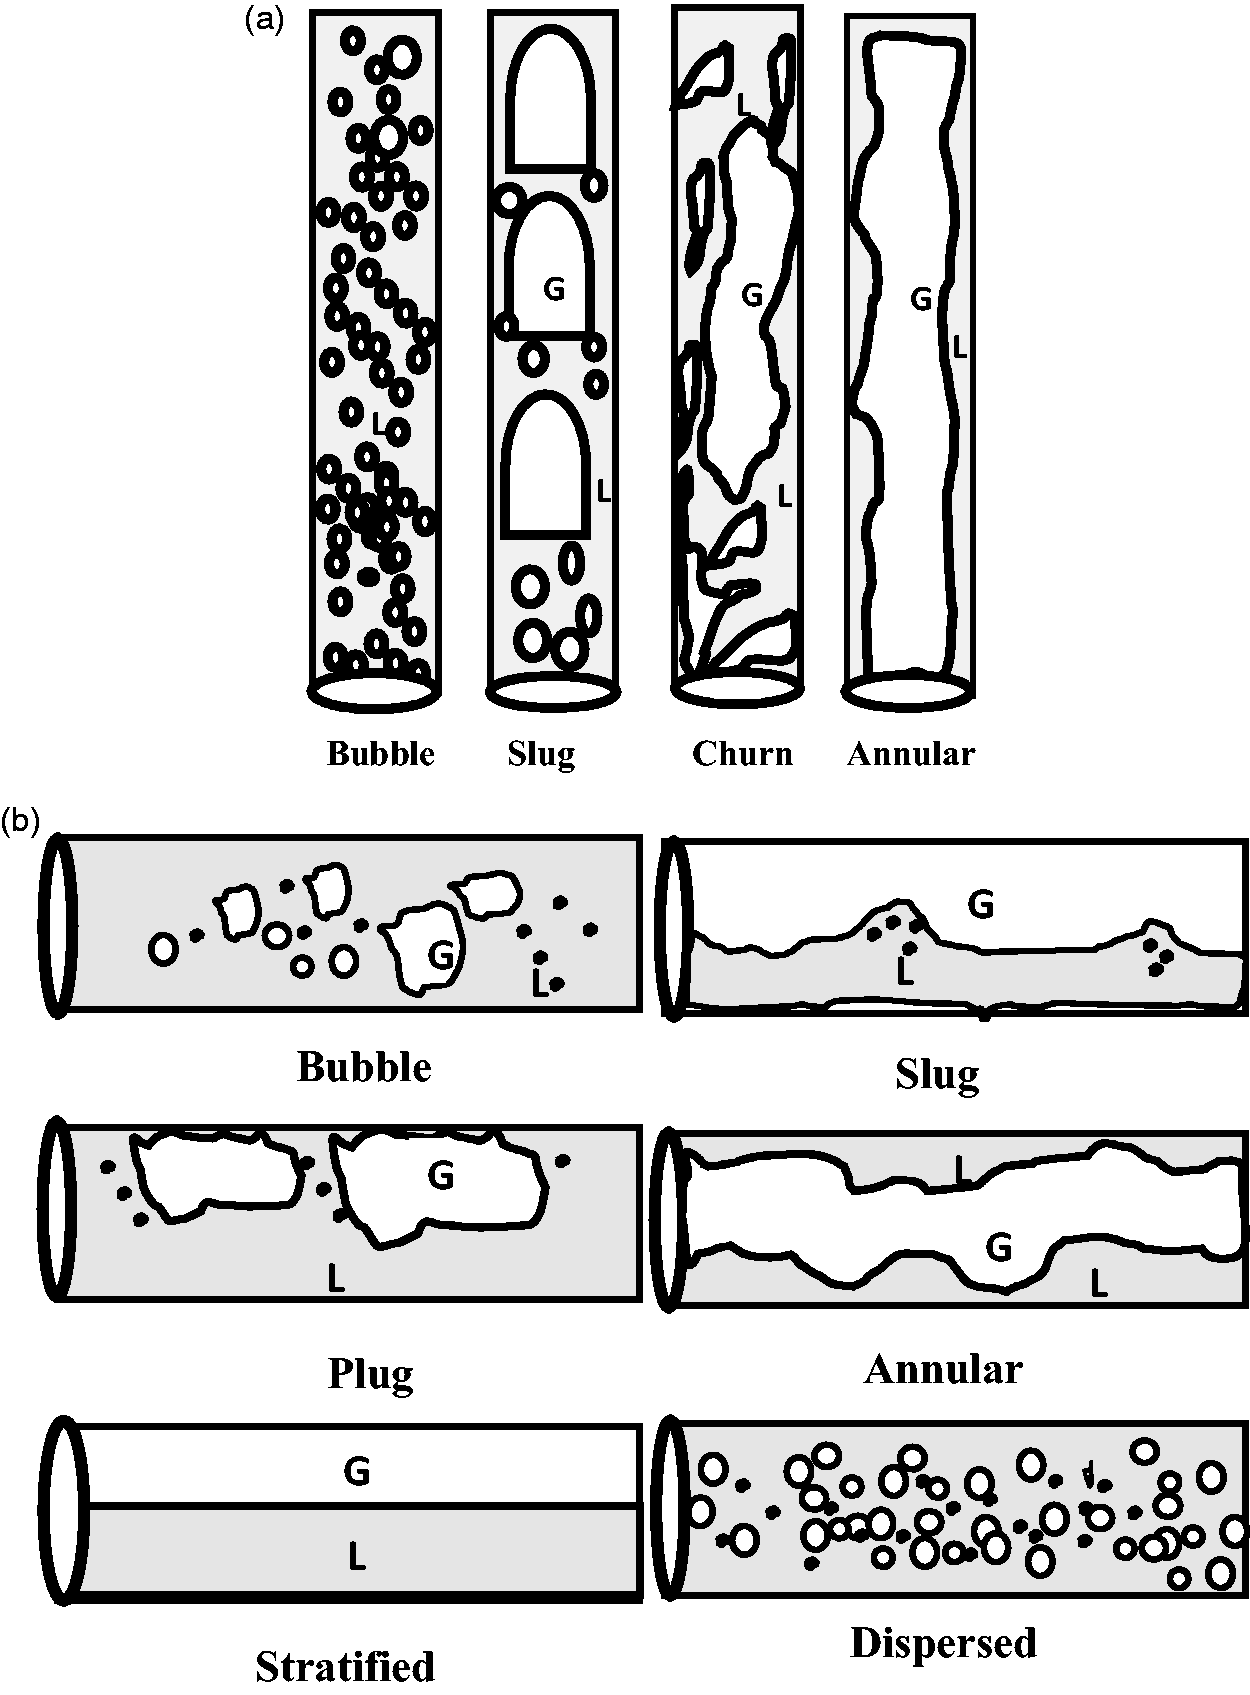
Phase fraction refers to the ratio of volume of gas or liquid to the total volume of phases in the pipe or tubing over time. The fraction of gas refers to the void fraction and that of liquid refers to liquid hold up. These characteristics are important input parameters for the calculations of phase flow rates, mixture fluid properties and total predicted pressure drop along the pipe. Therefore, adequate monitoring and accurate measurement of these characteristics are critical. It is, however, not a straightforward task since GLFs become more chaotic and unstable for increasing flow velocities. 1
As of today, MPF meters are considered by industries to monitor and measure these characteristics along the pipe in real time. 4 The measurements are made possible with the incorporation of sensing techniques that combine sensors and data processing. These sensing elements may include a combination of electrical, acoustic, electromagnetic, radioactive, vibrational, pressure and or optical based sensors. However, most of the available sensing techniques are built with intrusive probes which affect the flow geometry and distorts the actual behaviour of the already complex flow in the pipe. Various researchers have sort to improve the accuracy of these sensors. 5
Shen et al. 6 worked on improving the reliability of an intrusive four sensor optical probe for the measurement of interfacial area concentration (IAC) and void fraction of air and water flow. They classified these errors as signal processing and hydrodynamic errors and revealed that these led to a 31% deviation in void fractions and IAC and was worse for higher flow rates. Moreover, complications such as sensor tip shape and effects of the delayed response time make real interpretation of flow characteristics difficult.7,8
Shaban and Tavoularis 9 made an assessment on the measurement of gas flow rates using wire mesh sensors (WMS) for a GLF. They concluded that systematic errors existed due to the presence of the mesh wire in the test section. Occurrences such as bubble and slug fragmentation by the mesh wires led to significant distortions of flow regime predictions and bubble velocities interpretation. WMS is also only applicable for limited flow ranges. These conclusions were made after proposed corrections were employed for the cross correlation of signals generated by the sensor pair. Vuong et al. 10 also investigated uncertainties associated with using WMS method. They focused on the effect of the grid orientation and alignment of this sensor. It is reported that the misalignment of the sensors affected the void fraction measurements logarithmically with increasing hold up.
The application of intrusive conductive and resistive sensors probes has been useful for local phase fraction measurements. 11 These electrical probes generally produce temporal response signals based on the disparities in fluid conductivities. The sensor geometries are critical for accurate measurements and are effected based on contact of each phase in the conduit. Also, the generated signals need to be calibrated based on subjective thresholding values for improved flow regime identification. 12 Other forms of intrusive sensing involve the use of Ventri technologies for phase velocity measurements. These introduce distortions in flow regime development due to abrupt changes in the cross section (throat) of the sensor. This leads to erroneous flow rate estimates since the distribution of phases is misrepresented. 13
These limitations have justified the need for the application of non-intrusive sensing for MPF characterization which would meet cost effectiveness and technical requirements. This type of sensing also prevents sensor exposure to corrosion and erosion, hence reducing maintenance costs for operators.
This paper focuses on the review of the applicability of a non intrusive optical infrared (IR) sensing technique as a tool for GLF characterisation in pipes. Temporal signal responses coupled with appropriate signal analysis are used in discriminating flow regimes, estimating phase fractions and inferring total pressure drop estimation in a pipe. Also, limitations and future developments for the application of IR sensing for laboratory and oil field operations are discussed.
Summary of non-intrusive sensing techniques
The term non-intrusive sensing techniques, as used in the context of this review, refer to the method of measurement where a sensor setup is positioned at the wall of a pipe or conduit to detect and relay signal or visual information without having physical contact with the flow within the pipe (Figure 2). These techniques comprise (a) the sensing component and (b) the signal analysis components. The sensing components are the actual sensors (based on similar technologies as intrusive sensors) that provide raw signal or visual data to be analysed. The signal analysis component includes spectral, statistical and image processing techniques used in the analysis of the raw signals for inferential interpretation. A comparison of these techniques and their setbacks as it relates to GLF characterization have been detailed by Bertani et al.
14
and Thorn et al.
15
A general schematic for non-intrusive sensing techniques.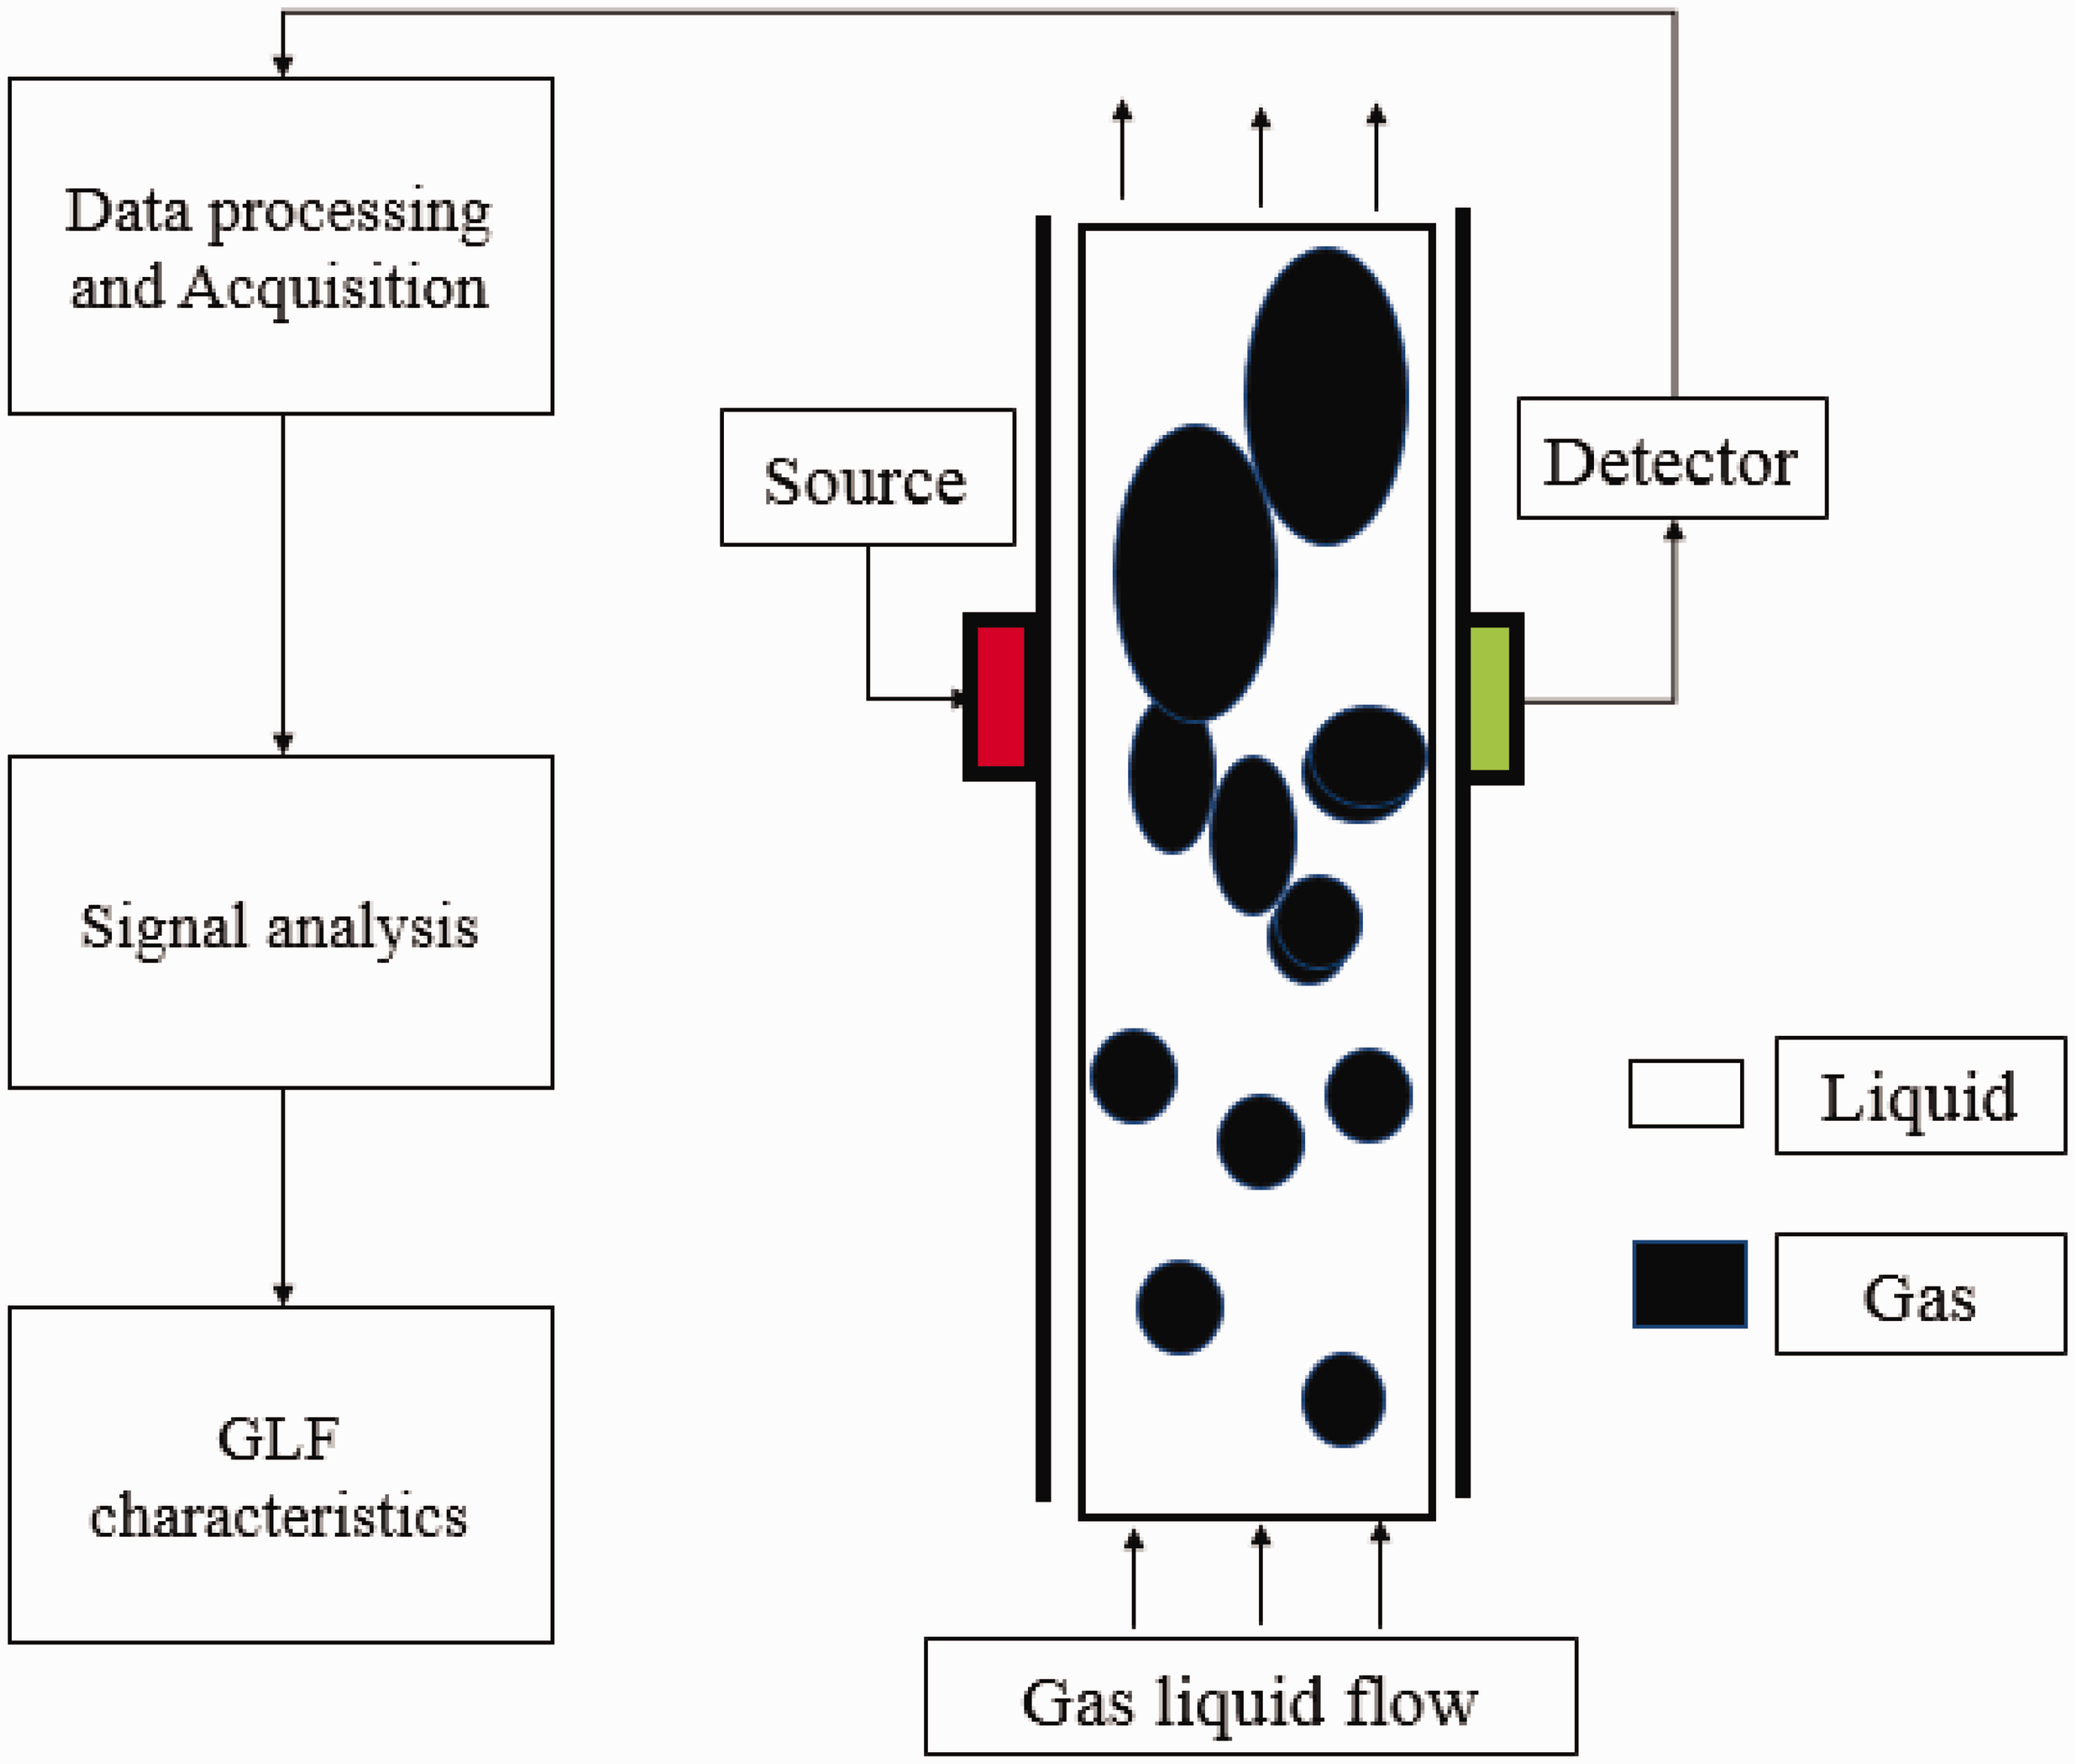
A reasonable number of non-intrusive techniques are available. These include radioactive, electrical, acoustic and videometry technologies. 15 The use of non-intrusive radioactive techniques has been considered for phase fraction estimation, flow regime identification and density measurements. 16 The sensing components consist of a radioactive source and detector. This source emits a penetrating beam of particles which interacts with the fluids in the pipe. A radiation attenuation is observed due to the preferential absorption of each phase in the pipe. The unabsorbed energy is detected and transmitted for inferential interpretation which could be a temporal signal or tomographic information. Investigators have considered the use of X-rays, 17 photon and neutron set ups.18,19 These set ups are used to produce either a single or double gamma ray beam for local and global measurements, respectively. Accurate results have been reported using radiography for flow regime identification. 20 However, high cost of dedicated setups and critical safety concerns are key limitations using these technologies. 21 The cost estimates of a typical radioactive setup for MPF metering as reported by Falcone 40 are in the range of $5000–400,000 and $1–4 million for subsea special applications.
In recent years, tomographic technologies have been investigated for GLF characterization due to low cost and high temporal resolution in image capture. One common form of this technology is electrical impedance tomography (with variations in forms of conductance, inductance or capacitance) which discriminate between gas and liquid interfaces based on disparities in resistance, permittivity and dielectric properties. 23 The electric fields generated by the sensor electrodes are preferentially distorted based on the spatial distribution of each phase. The phase fractions and flow regimes are later interpreted via image reconstruction techniques. The efficiency of this technology depends on the design of electrode configuration which has been reported to be challenging. 24 This challenge is primarily due to the fact that the electrode geometries define the uniformity of the electrical field distribution. Most investigators have sort to develop various geometries that would minimize the distortion of electric field by varying electrode shape, surface area and lengths.
Xie et al. 25 considered concave electrodes which were designed to reduce sensitivity to axial flow distributions. Andreussi et al. 26 designed a ring electrode to achieve a uniform electric field around the pipe. Other documented electrode designs include helical, rotating and multiple electrode arrangements.17,27 dos Reis and da Silva Cunha 22 compared the performances of the above electrode geometries and concluded that the ring electrode gave the best performance in determining phase fractions for a GLF. Similar comparisons were made by Salehi et al. 28 for flow regime identification, and they concluded that the concave electrode gave a good agreement with photos from high-speed camera. Albeit these efforts to improve accuracy, the problem of recommending a standard configuration for varied flow conditions remains.
Non-intrusive acoustic emissions have also been investigated by a few researchers. Al-lababidi et al. 29 investigated the performance of acoustic emissions for GLF using ultrasonic sensors. They correlated the acoustic emission energies with gas void fractions and phase velocity for a horizontal flow case. They concluded that this sensor needed additional testing for higher flow velocities. Ultrasonic Doppler velocity measurement was studied under MPF conditions. 30 The aim was to measure a reliable bulk velocity of phases for determination of phase flow rates. The investigators concluded that the results on bulk velocity were not reliable because of gas bubbles in the liquid phase, thus limiting the interrogation depth of the ultrasonic wave to a shallow liquid region near the pipe wall.
Videometry techniques also present non-intrusive options especially for cross validation of results from other techniques. It involves the use of cameras used to visualize flow regimes directly and capture images for phase fraction estimation using image processing techniques. For high flow rates, the use of high-speed cameras which incorporate image processing presents a more objective method of identifying flow regimes and phase fractions. Recent investigators have considered this technique for characterizing slug lengths and interfacial velocities.31,32
In addition, the estimation of bubble flow characteristics such as bubble sizes distribution and liquid film thickness for annular flows were reported to be in good agreement with flow models.33,34 Videomerty is, however, limited to only transparent or clear pipes and could be expensive in the case of high speed imaging. It is also only applicable to controlled laboratory conditions where adequate lighting for quality imaging is required. Uncertainties exist in detecting bubble overlaps when two or more bubble or slugs overlap in the field of view. 35
Despite this range of technologies, a trade-off in terms of cutting cost, meeting safety requirements and still achieving the desired technical requirements for measurements is essential regarding the choice of non-intrusive methods. IR sensing has been considered as a cheap, safe, fast and continuous measurement for GLF. The next session presents the theory, application and design considerations for improving this sensing technique.
Non-intrusive optical IR sensing
Optical sensors convert light energy or electromagnetic radiation in quantum into electrical energy or vice versa into a form that is delineated by an instrument. For most measurements, the output signals are electronic when the sensors are linked to a photoelectric trigger that generates a time series of changes in light intensity. Almost all these types of sensors are designed to emit and detect light in the IR region and hence could also be referred to as IR sensor pairs.
The emitter is mainly a light emitting diodes (LEDs), while the detector or receiver is either a photodiode and or phototransistor. LEDs convert electrical energy to light energy and are operated in the forward bias mode. The receiver sensor, generally termed as a photodetector is a semiconductor that converts light absorbed as photons into electrical signals or electric current, and is operated in the reversed biased mode. Moreover, the photo detectors could be photodiodes, phototransistors or light-dependent resistors (LDR). The choice of any detector depends on the application. For instance, the photo transistor has a high response time compared to other detectors but vulnerable to slight surges in electromagnetic energy.
The sensor pair arrangement could be transmissive or reflective. Transmissive IR sensors (Figure 3(a)) are designed to transmit the ray of light through a path from source to detector, where the detector is positioned at the opposite end of the object section. When an object crosses this ray path, there is an interruption of the beam of light which changes the intensity of detected radiation. Transmissive arrangements are more applicable for fluid flow detection, since there is response time for transmitted rays to be detected as compared to reflected rays. Also, it eliminates the problem of filtering incident ray scattering at the interface of the object.
Infrared sensor-detector arrangements (a) transmissive type (b) reflective type.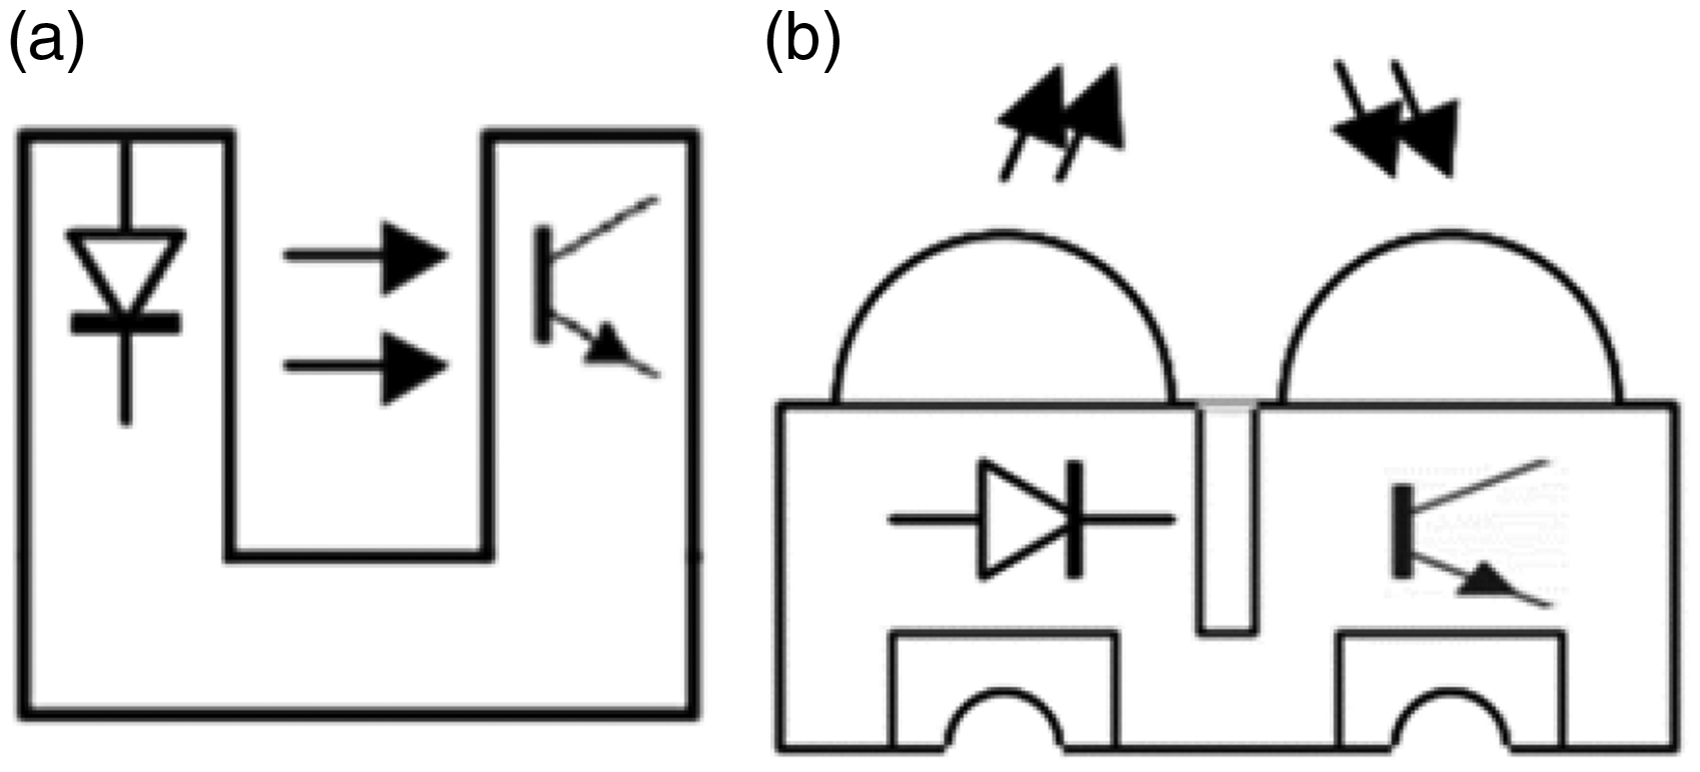
Reflective IR sensor arrangements have the emitter and detector adjacent to each other as shown in Figure 3(b), such that the reflection of the incident rays from any object in the domain of radiation is detected by the photodetector. This arrangement is mainly applicable for solid reflective bodies. Potential applications include particle presence sensing, movement detection and counting.
For non-intrusive GLF detection, a transparent pipe is needed for light emitted from the LED to the detector for any form of arrangement. A typical IR detection circuit for this application is shown in Figure 4. The circuit consists of basic elements;
Voltage source to power the circuit. The IR sensor pair (LED and photo detector). Resistors for adjusting current and power requirements and thus incident light intensity. Amplifier component to boost the output signal generated from the photodetector. A typical IR sensing circuit for GLF sensing.
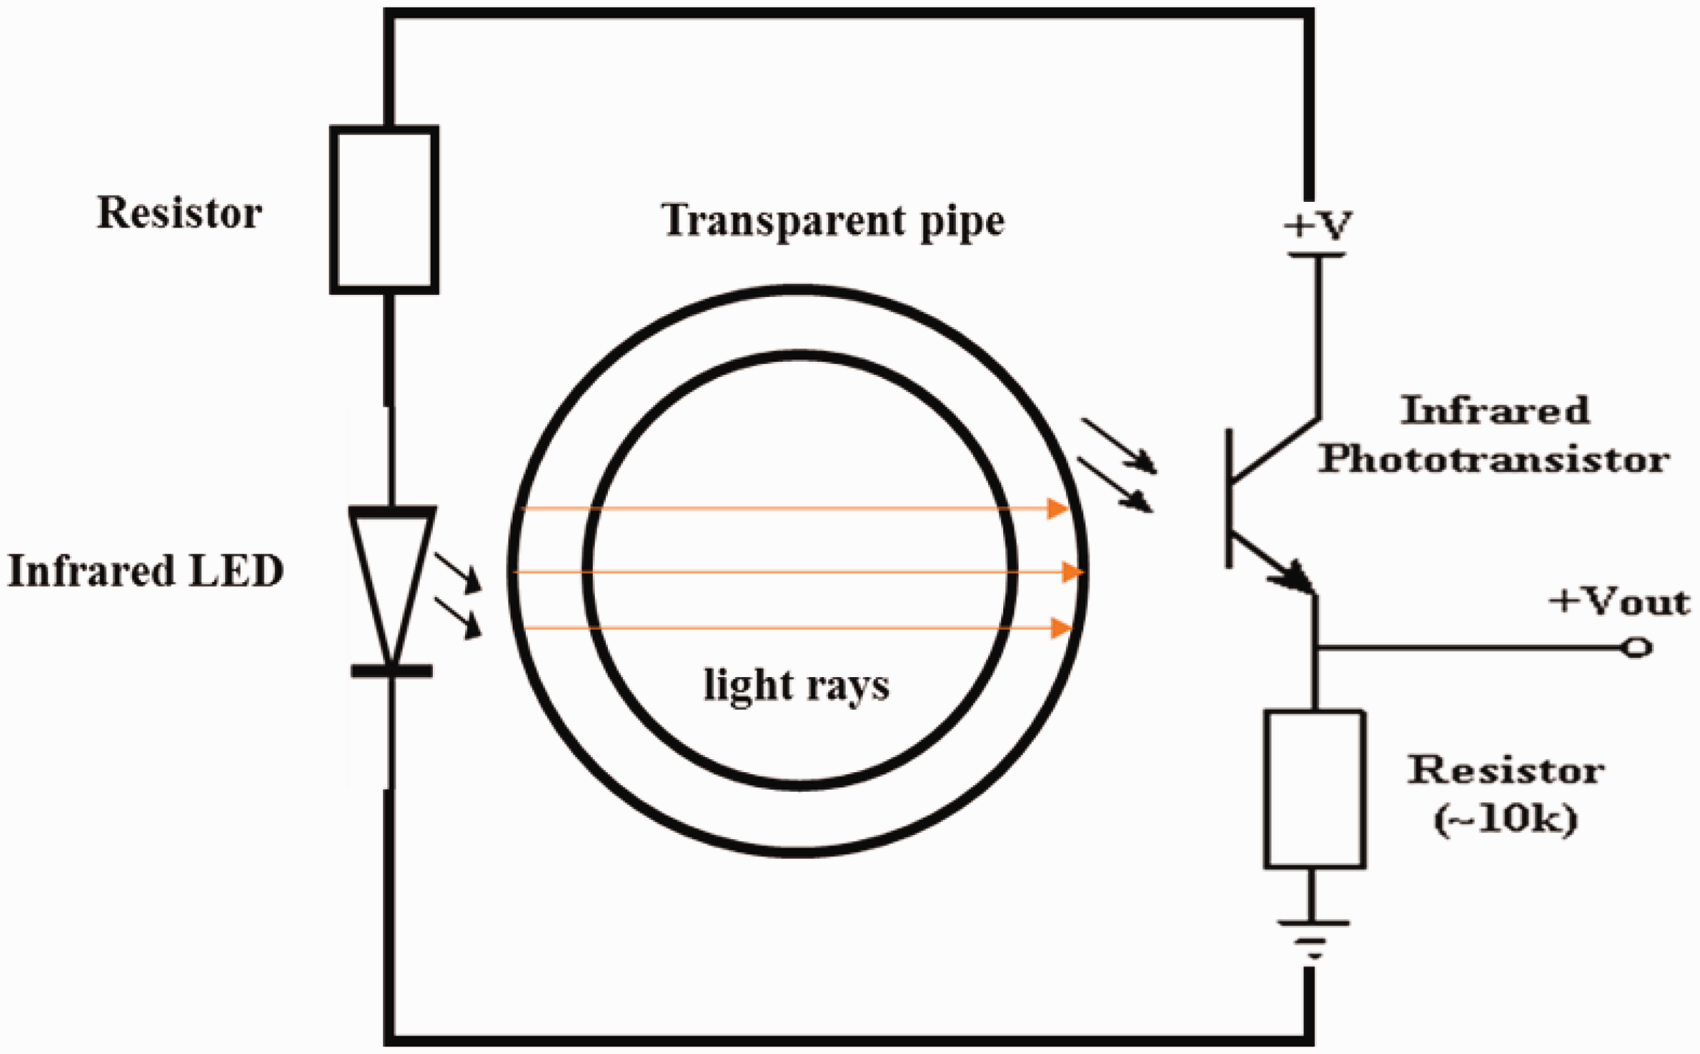
In the case of GLF, the variance in light intensity assuming a constant emission from the LED is due to the disparity in refractive index of each phase flowing past the penetrating light. These variations are converted to electrical current or voltage signals and are analysed for flow characteristics.
Relationships as cited in Luker and Luker
36
are shown as equations (1) and (2) describing the exponential variation of light intensity for a single phase and GLF detected in the pipe, respectively
I is the emergent light intensity, Io is the incident light intensity, µ, µl and µg are the absorption coefficients of the single phase, liquid and gas phases respectively, w is the thickness of phase in the pipe, d is the diameter of the pipe, h is the elevation of liquid in the pipe.


Design considerations
To ensure accuracy in monitoring and detection of GLF, it is important to design the IR sensing circuit to (a) handle global and local measurements, (b) minimize ray divergence and (c) compensate for changes in temperature and ambient light. The impacts of each consideration on the design are detailed below.
Global and local measurements
To be able to detect local and global characteristics of GLF, IR sensor pair arrangements need to be installed on at least two points along the pipe. A practical solution is to design an optical sensor setup that emits a consistent beam through the transparent pipe with more than one detector system at appropriate spacing on the test section to give an improved representation of flow in the pipe. Signals from each detector are correlated and used to determine flow characteristics. Also, the use of an appropriate sampling rate by a data logger is required to capture temporal information of flow structures of interest. Furthermore, the choice of sensor spacing between sensor pairs along the pipe needs to be optimized to ensure accurate cross correlation between sensor signals. It is a rule of thumb to optimally space sensors according to Nyquist sampling theorem as 3 + 5 times smaller than the characteristic dimension of the flow structure of interest. 12
Ray divergence
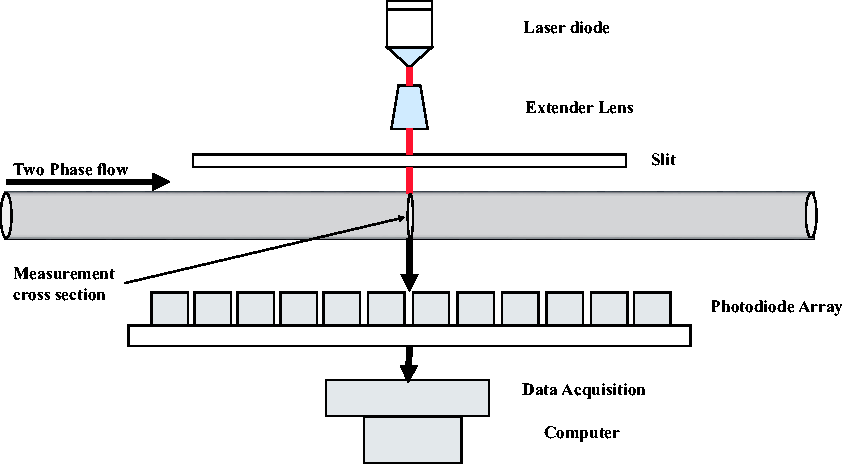
The divergence of the incident beam due to the refractive index of the pipe wall should be minimized to improve transmittance of the IR light across the pipe section. A recent publication by Li et al.
37
on the characterisation of GLF for a horizontal flow details the design of a multi array optical sensor setup as shown in Figure 5.
37
This uses an extender lens with slits to minimize beam divergence and to create parallel beams. More so, to minimize ray scattering effects at the pipe wall,
33
it made use of fluorinated ethylene propylene (FEP) pipes, which has a refractive index close to that of water.
Multi array IR sensor set up for a focused laser beam (source: Li et al.
37
).
Ambient light
The interference of ambient light could affect the incident and transmitted light intensity penetrating the test section. For instance, an exposure of the photodetector to ambient light could saturate the signal output and increase signal output. This situation causes misinterpretation of results and frequent recalibration of the sensors. It is therefore advised to cover the sensor pairs with an opaque material which prevents ambient light from affecting results. Furthermore, a reduction in the aperture size reduces exposure of the photodetector to ambient light. 38
Temperature variations
LEDs and photodiodes are affected by the changes in temperature
Ambient temperature variations also affect absorption coefficient of the pipe wall and fluid mixtures and thus would alter the reference output signals detected by the photodetector. To compensate for these changes, appropriate monitoring techniques must be employed to alter the circuity parameters. For instance, a temperature decrease could be compensated by increasing the output power of the LED and decreasing the sensitivity of the photodetector. This measure assists in keeping the overall signal constant as temperature changes. 39
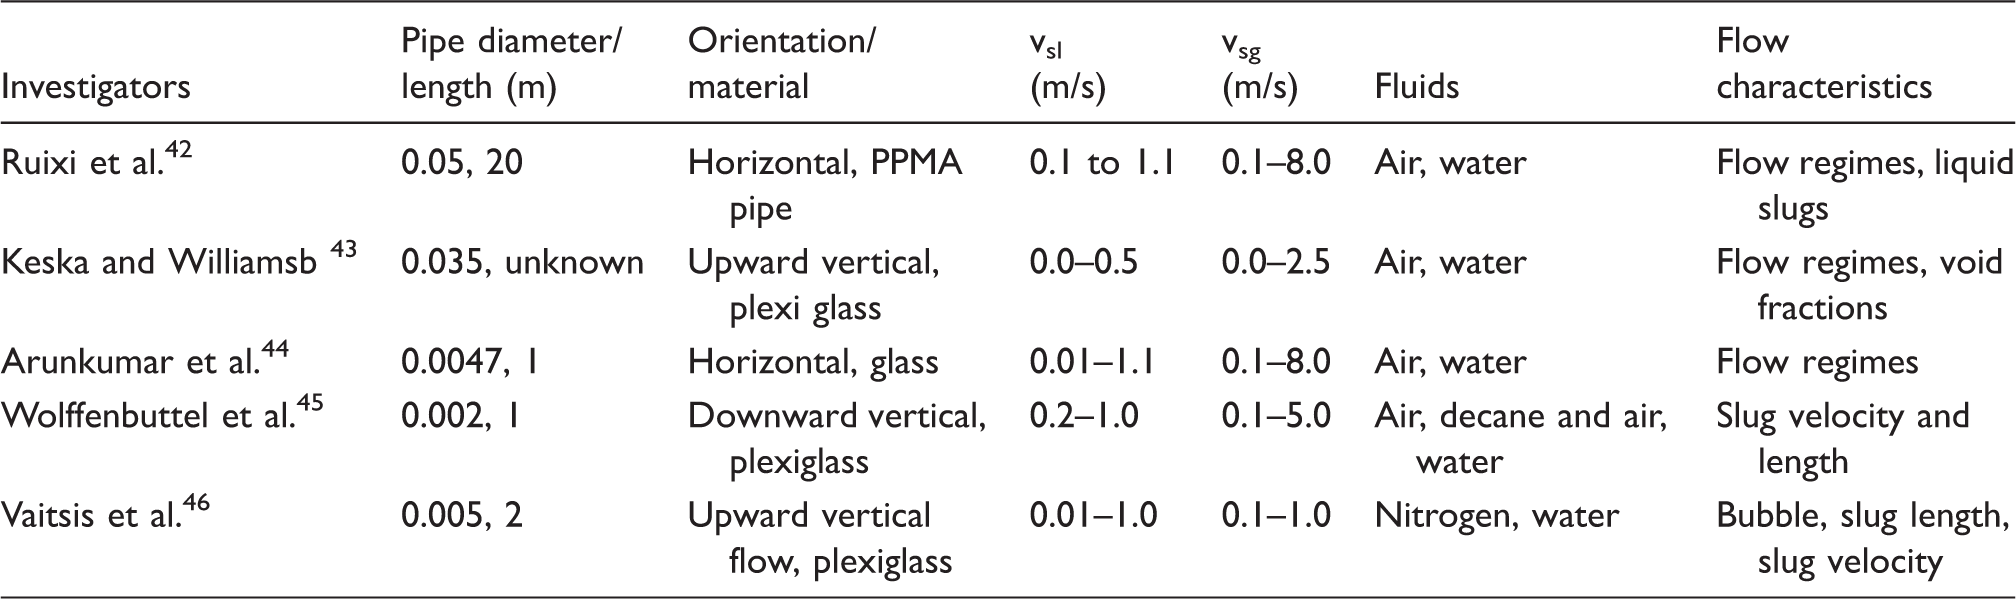
Review of experimental non-intrusive IR sensing techniques for GLF
Summary of research parameters using non-intrusive IR sensing for gas–liquid characterization.
Flow regime identification
Experimental studies have revealed the successful application of IR sensing in the identification of flow regimes for GLF. The generated sensor signals are analysed in most cases via visual observation, probability distribution functions (PDFs), 41 cumulative probability distribution functions (CPDFs), 43 power spectral density function (PSD), 47 artificial neural networks (ANNs),48,49 wavelet analysis 50 or via auto and cross correlations. 51 These techniques present a more objective discrimination of phases.
Keska and Williamsb
43
made use of one IR sensor pair coupled with statistical analysis to identify flow regimes of bubble slug and annular flows for an upward vertical flow. The temporal voltage signal responses were converted into a probability and cumulative probability density which made objective identification of these regimes possible. Based on the changes in skewness of the PDFs and slope of each CPDF, over varied flow velocities, it was possible to discriminate flow regimes. Results were reported to be in good agreement with high-speed video. Figure 6, shows the comparison between two temporal voltage signals, PDFs and CPDFs derived from the IR sensor. Figure 6(a) was reported by the investigator to represent a bubble flow regime which is evident from the increased fluctuation of voltage due to random bubble scattering The PDF illustrates a distribution of high voltage values occurring because of high light intensity reaching the photodetector. This was due to the presence of gas bubbles having a lower absorption coefficient.
Comparison of temporal voltage signal, PDF and CPDFs for (a) bubble flow (b) slug flow identification (modified from Keska and Williamsb
43
). PDF: probability distribution function; CPDFs: cumulative probability distribution functions.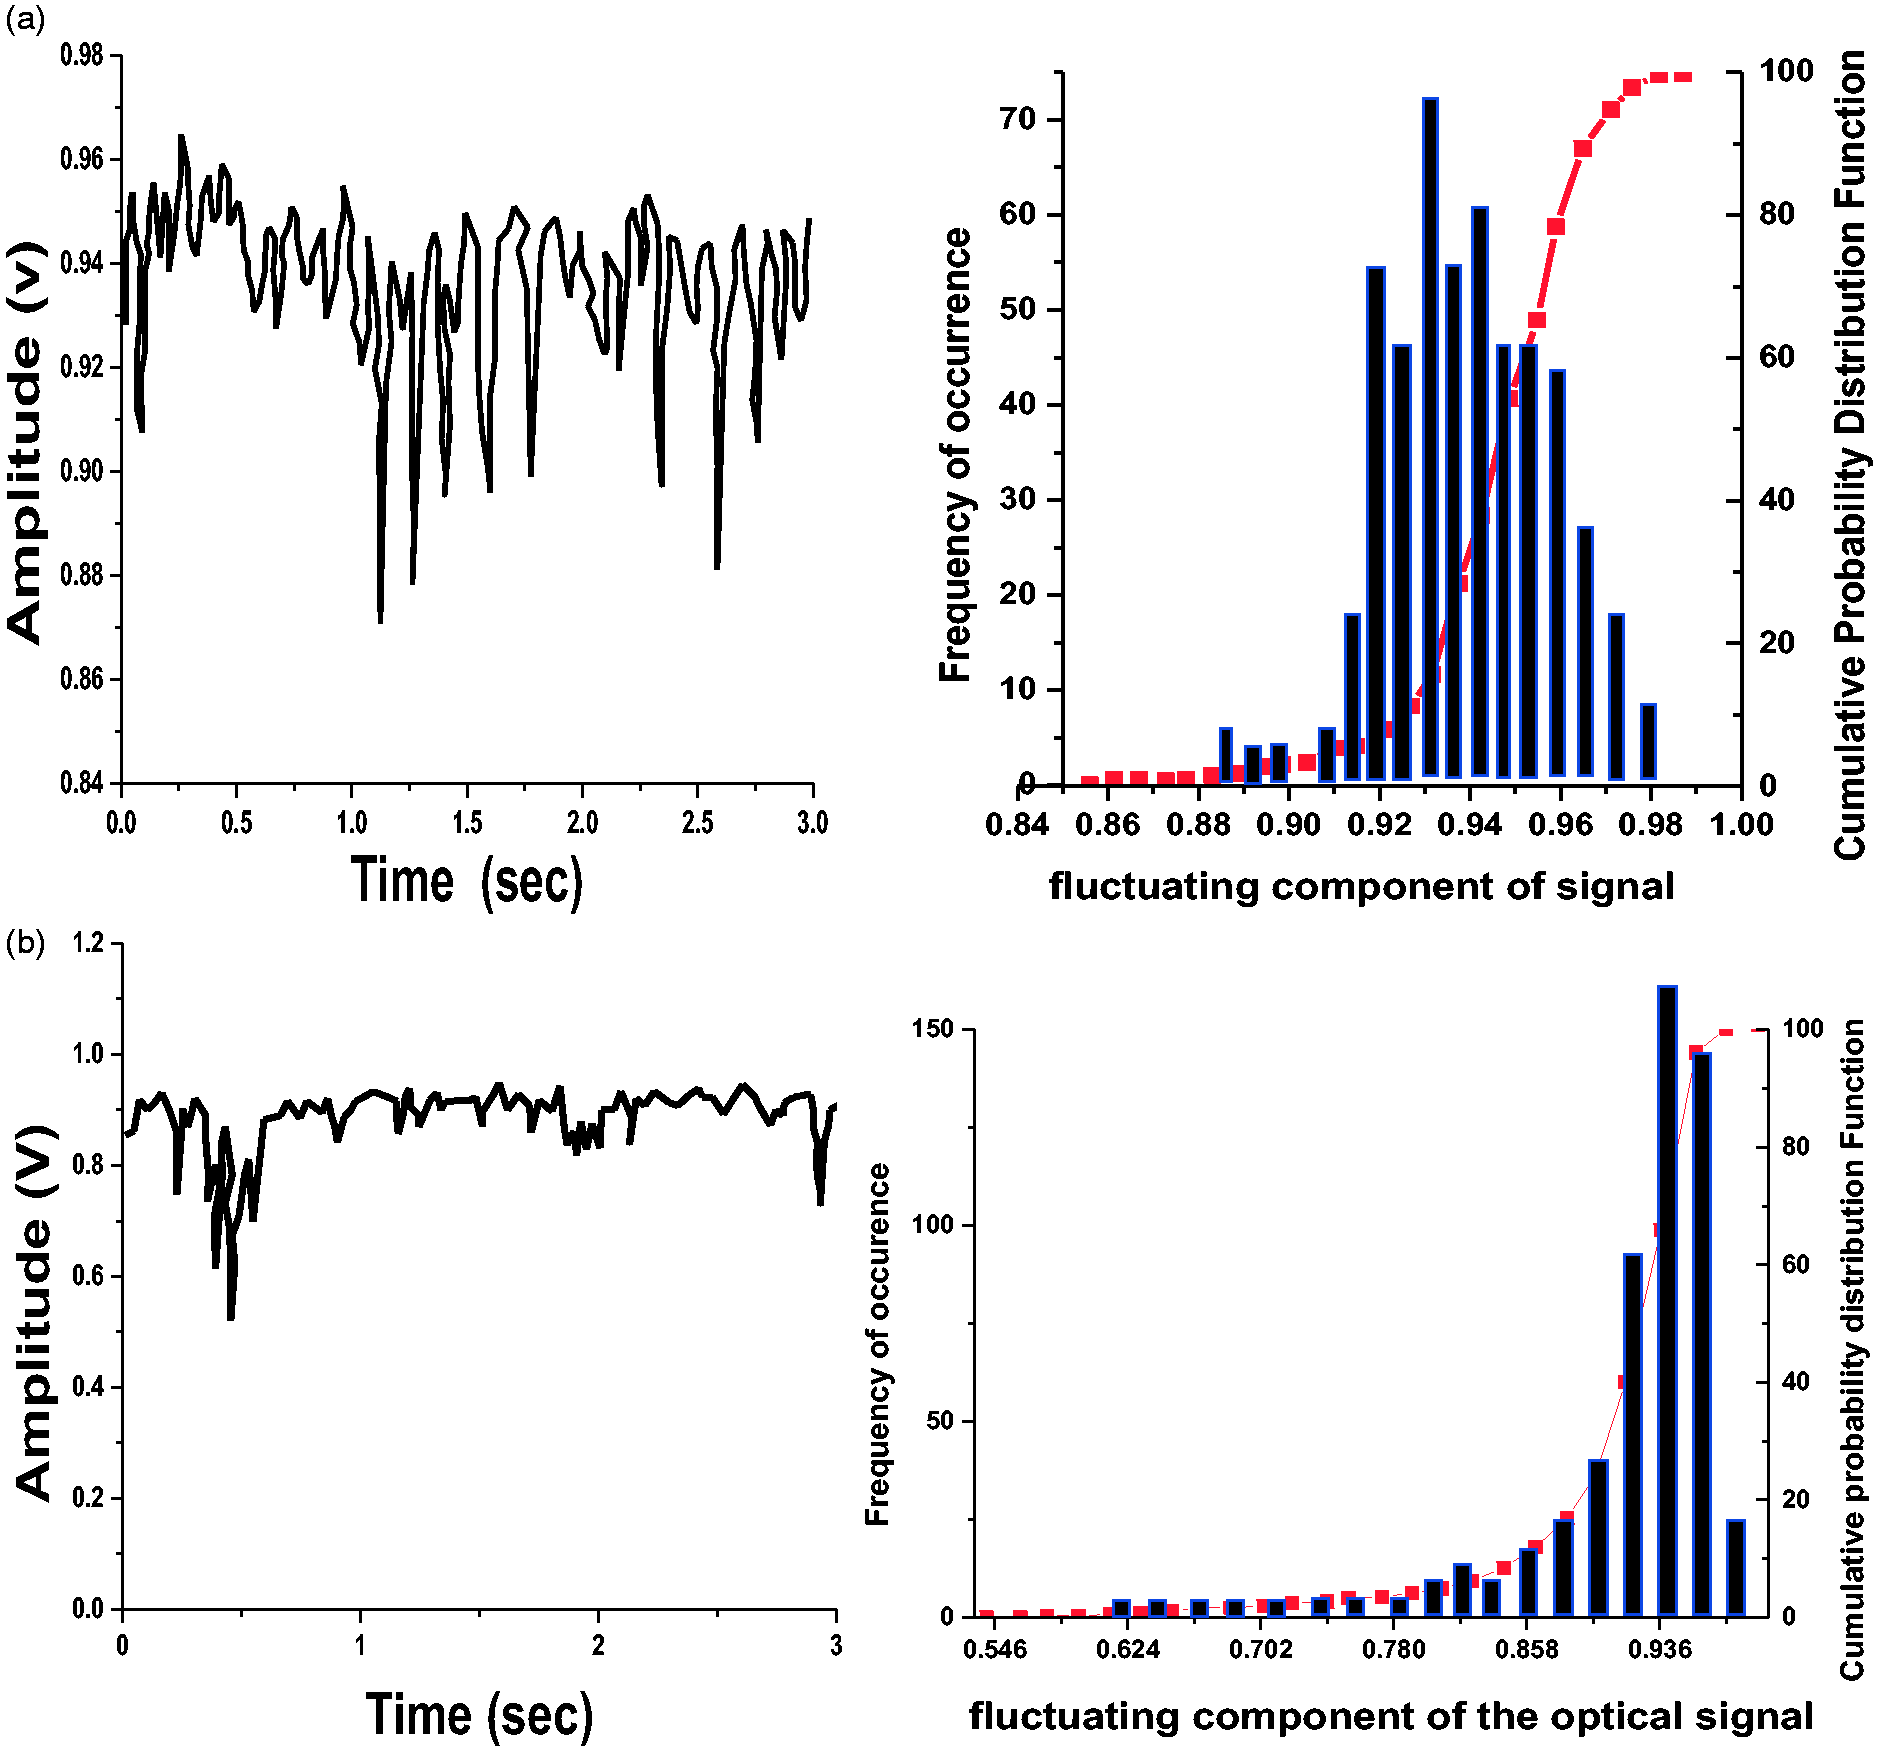
Figure 6(b) shows a reduced fluctuation in temporal voltage signals compared to Figure 6(a). This was reported to be due to a more stable movement of gas–liquid interface characteristic of a slug flow. In addition, the PDF and CPDF were more skewed to the right indicating less fluctuation with a PDF peak representing a high possibility of larger bubbles or slugs in the flow stream.
Ruixi et al.
42
demonstrated that they could detect and characterise the presence of a gas–liquid in a horizontal section of pipe by discriminating each phase via analysis of voltage signals generated from two IR sensor–detector pairs as shown in Figure 7. They explained that the attenuation of the voltage signal was representative of the light intensity absorbed by each phase for the horizontal flow stream.
Coaxial infrared setup (modified from Ruixi et al.
42
).
They used the cumulative probability density function (CPDF) as a tool to discriminate flow regimes for the horizontal flow. CPDF as an extension of PDFs gives a cumulative frequency distribution of the generated voltage signals. As shown in Figure 8, for liquid velocity of 0.5 m/s with 0 m/s of gas, the voltage reading was constant over time and gave a CPDF of 1.0. This inferred a single-phase flow of liquid. Increasing the gas velocity creates variations in the voltage readings and CPDF results from 0 to 1. This increasing gas velocity dictates the transitions of flow regimes and moves the curve from the left to the right from the base CPDF single phase value. The flow regime transitions were reported to be agreeing well with flow maps and photographs.
CPDFs for flow regime identification (Ruixi et al.
42
). CPDFs: cumulative probability distribution functions.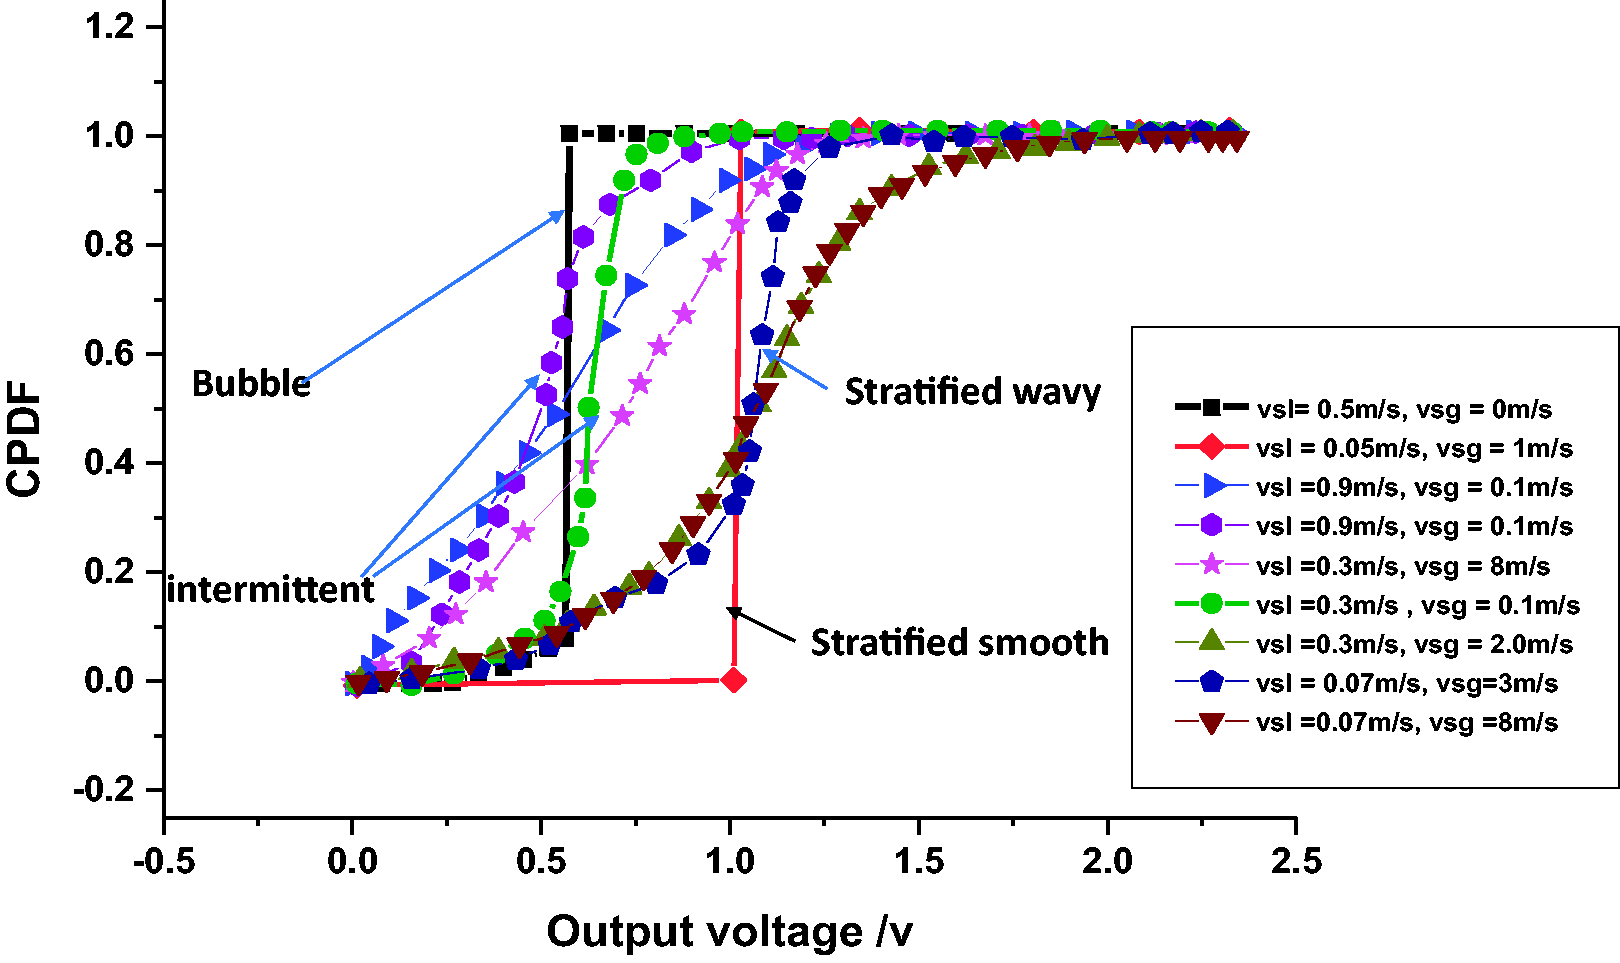
Arunkumar et al.
44
made use of a direct comparison of current signals derived from IR sensing with results from computational fluid dynamics (CFD) and photographs from a high-speed camera as shown in Figure 9. The test section was for a 4.8 mm diameter horizontal flow set-up of water and air. The discriminated flow regimes over varied flow conditions were dispersed bubble flow, slug and stratified flows. These results were also compared to work carried out by Ruixi et al.
42
Their experiments made it clear that flow regimes could be identified via direct observation of the signals generated as compared to Ruixi et al.
42
where the voltage signals showed numerous fluctuations and hence needed the application of statistical techniques to accurately identify the flow regimes.
A comparison of an identified bubble flow regime from (a) current signals ′ from IR sensing with (b) high-speed photographs and (c) CFD simulation (Arunkumar et al.
44
). CFD: computational fluid dynamics.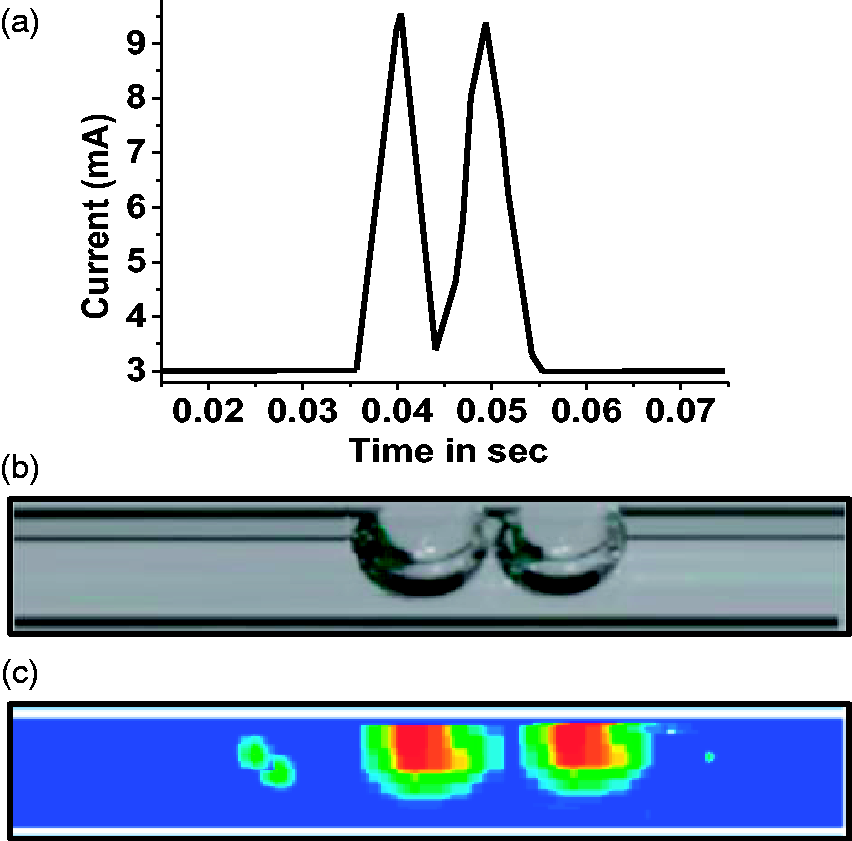
A bubble flow regime was observed for moderate superficial liquid velocity and low superficial gas velocity as shown in Figure 9(a). The obtained flow regimes for the respective fluid velocities were in good agreement with flow maps from Coleman and Garimella. 52 They used a similar pipe size of 5.5 mm. To improve their results further, an optical filter in the form of an opaque covering was used as a covering on the sensor to reduce the interference of ambient light.
Phase fraction determination
The volume, area or length fraction of each phase to the total amount of all phases in the pipe defines the phase fraction. The determination of phase fraction using IR sensing techniques can be done directly or indirectly depending on the pipe size and flow velocity of the phases involved. The direct method is the visual observation of the signal disturbance which captures the presence of each phase that moves in the axis of the light emitted from diode. This method is more accurate and applicable for capillary or micro tubes (less than 10 mm), where the bubbles or slugs can fill the cross section as one flow structure. Persen 53 referred to this method as bubble counting. The passage of flow structure along the pipe gives an almost binary signal where the ratio of the attenuation of single phase to multiple phases gives the desired phase fraction. This method is not very common for most practical flows in industry since they are of high magnitudes and could cause erratic fluctuations in the signal.
The indirect measurement would be preferred by most researchers and is suitable for most flow conditions. It estimates other flow characteristics which are used as input parameters for the phase fraction determination. These characteristics could include phase velocities, phase size distribution/lengths and liquid film thickness. To measure these characteristics, a typical set-up of two or more arrays of IR sensor pairs along the test pipe with known spacing d is installed and cross correlated. The cross correlation Cs1s2 (equation (3)) of signals over a finite time series to be used is
S1 is the signal from an upstream IR sensor over time, S2 is the signal from a downstream IR sensor over time, τ is the time lag between signals and t is the recorded time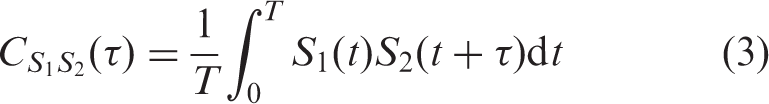
Phase fraction from phase velocities
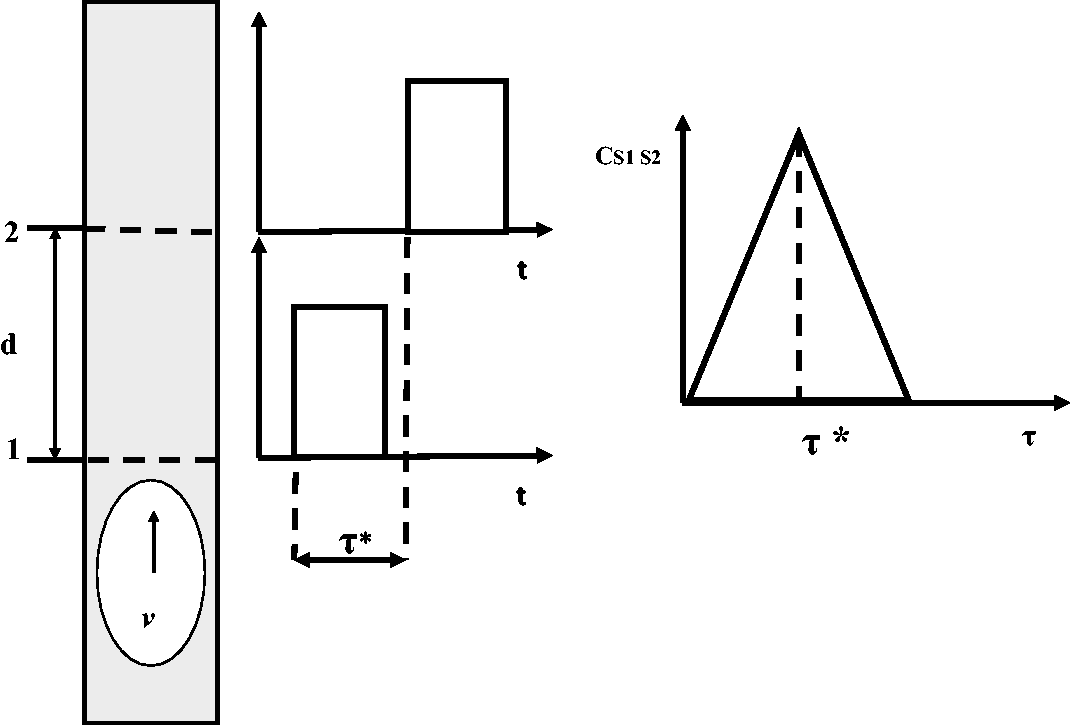
This refers to the actual phase velocity and would be different from the superficial phase velocities when slip exists. To estimate the phase velocity, a cross correlation function comparing the signals from two similar IR sensors pairs enables a lag time τ to be determined. The lag time represents the shift in time where the correlation between the signals is a maximum. Mathematically, the time lag between the two signals is represented by equation (4). With known spacing between sensors 1 and 2, and d representing the distance covered by the flow structure, average velocity (v) of a phase can be calculated simply by equation (5), Figure 10 illustrates the process of cross correlation for a GLF.
Velocity measurement using cross correlation technique (modified from Azzopardi et al.
12
).

Combining appropriate correlations of slip or non-slip conditions, the local phase fraction α can be estimated. The simplest relationship between the derived average velocity v and phase superficial velocity vs is given as
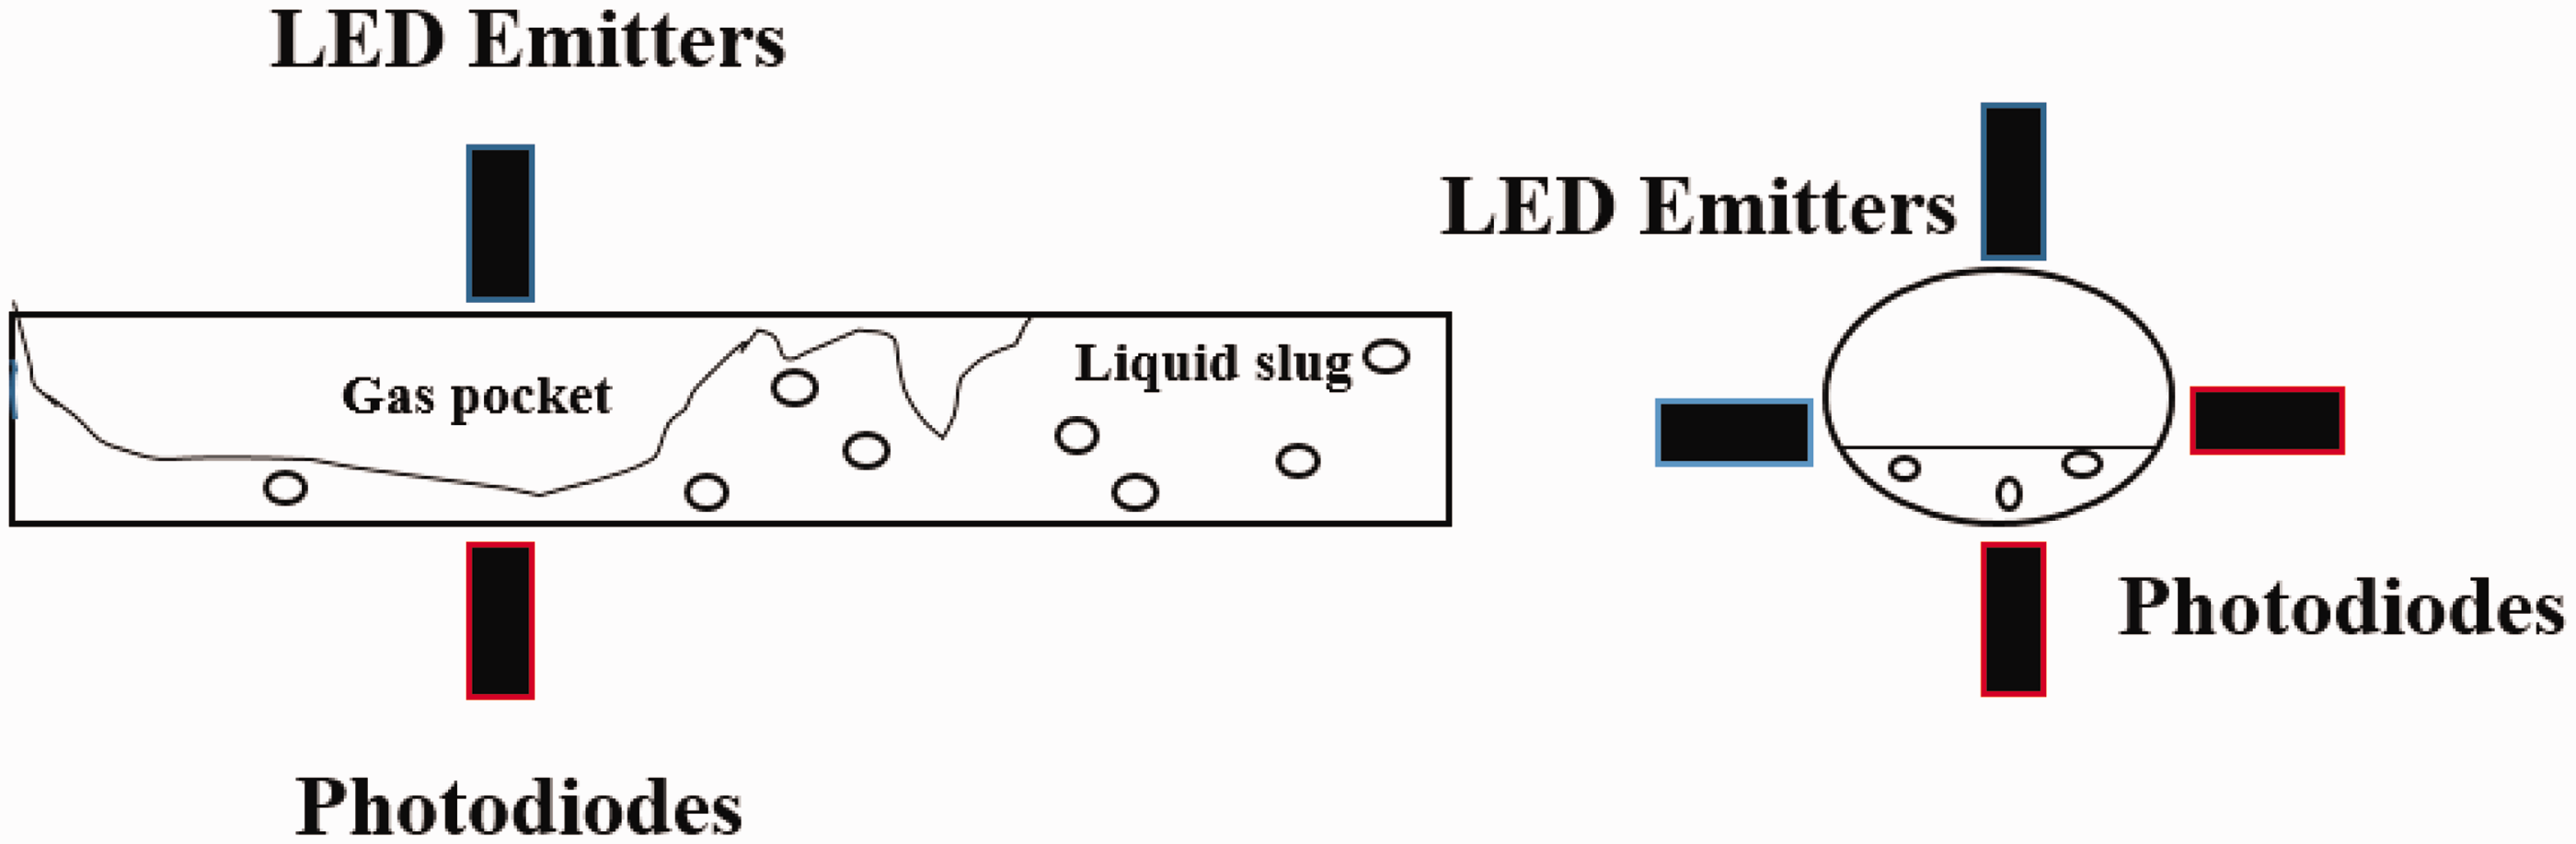
Wolffenbuttel et al.
45
designed a setup with three non-intrusive IR sensor–detector pairs compared with an intrusive impedance electrode as shown in Figure 11. Each sensor pair was optimally spaced and inserted into an opaque pipe to minimize the effect of ambient light on the output signals. The sensors were then mounted on a 2-mm test section. Binary signal responses were analysed based on a cross correlation in estimating interfacial velocities of air-decane slugs and air–water slugs. The derived velocities were used to estimate the phase fractions of each phase in the pipe section. Their results were in exact agreement with measured properties from photographs which used disparity in frame times to validate the measured velocities.
Three IR sensors–detectors pairs compared with intrusive impedance electrode (Wolffenbuttel et al.45).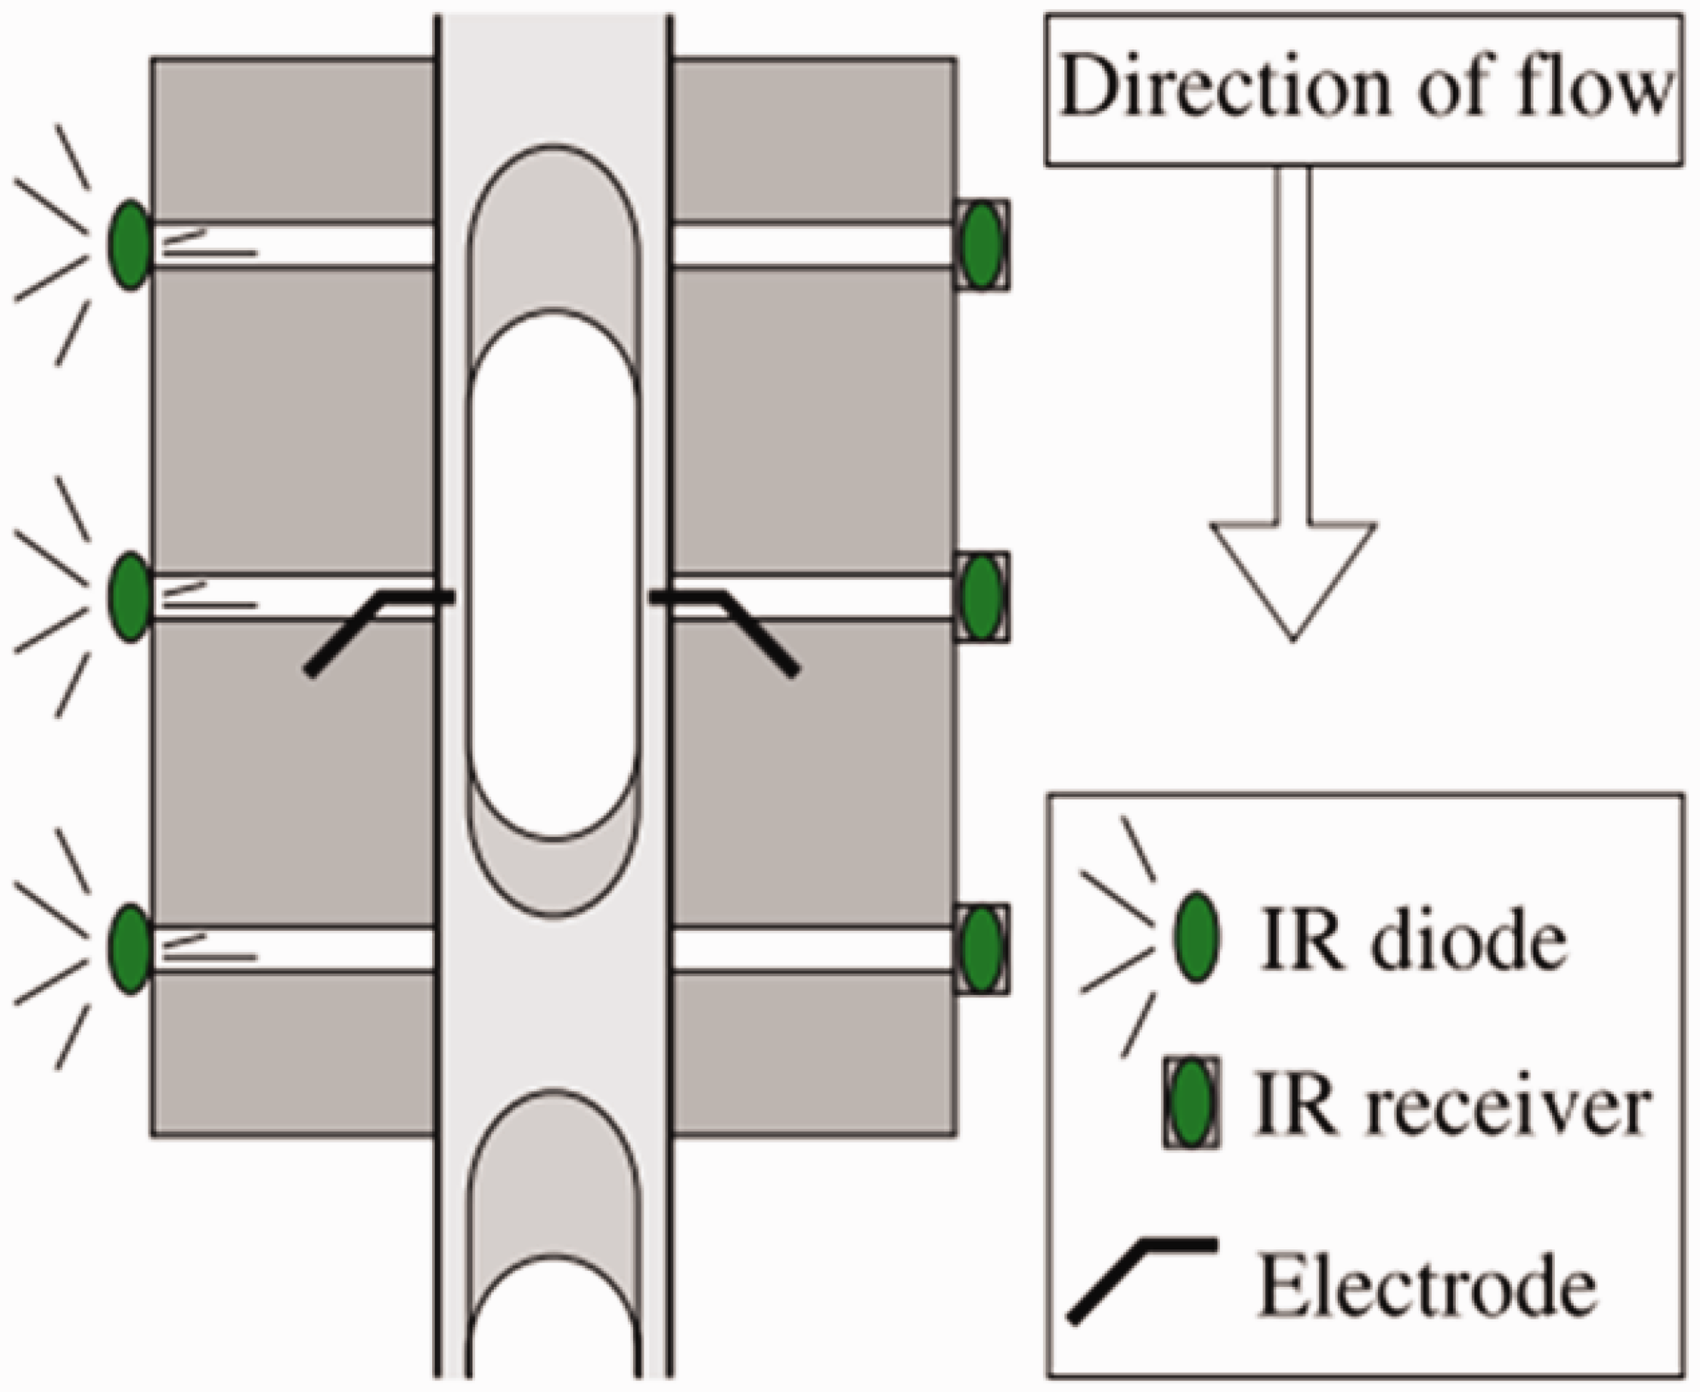
For a non-homogenous flow, the slip ratio S, which is also useful for understanding the mechanism of phase segregation or dispersion in the pipe, is the ratio of the average velocities of the gas and liquid phases derived from the signal analysis as
Phase fraction from phase lengths
Phase lengths could be in the form of liquid or gas slug lengths for a two-phase flow. Phase lengths are important aspects to understand the size distributions and periodicity of the complex flows, respectively. Very few investigators considered phase lengths and frequencies for a GLF using the IR sensing technique, except for the use of direct observation of binary signals by Wolffenbuttel et al.
45
More so, researchers have used auto correlation techniques on the signals generated by other types of sensors to estimate phase lengths.
15
It is therefore only reasonable to propose the use of the same techniques for IR-generated signals. To estimate the length of phase structure Lp, (gas or liquid), the phase average velocity v and average residence times τR1 and τR2 derived from the auto correlation of each sensor signal (upstream and downstream sensors) are required as shown in equation (8).
The average residence time 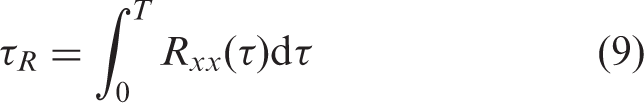
Therefore, the phase fraction α could be estimated from the ratio of the length of phases in the test section L from equation (10) below

The above expression is valid for a constant cross-sectional area of pipe. The results need to be compared with the derived phase velocity methods and cross validated using videos and photographs.
Pressure drop measurements
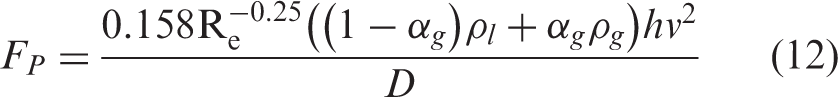
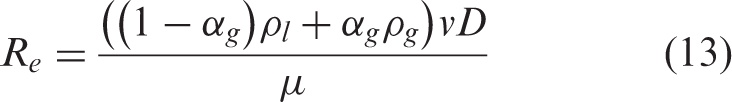
The pressure drop along the pipe is critical for flow performance prediction and needs to be measured. In principle, there is no direct methodology in literature for measuring the pressure drop along the pipe using IR sensing. It is, however, possible to combine flow models with the IR-derived phase velocities (vg, vl) and phase fractions (αg, αl) with known fluid property correlations to make this estimation. This estimation could be compared and validated with direct pressure measurements. As a modification of cancel Bernoulli’s equation by Jia et al.,
54
a relationship for a two-phase pressure drop ( Fp, frictional pressure drop μ, mixture viscosity D, pipe inside diameter h, height of the pipe test section. ρl ρg, liquid and gas densities, respectively.
More work could be done to validate the possibility of using IR-derived measurements for pressure drop calculations over varied flow conditions and pipe geometries
Flow metering capabilities
According to Thorn et al.,
15
the ideal MPF meter is expected to measure phase fractions, phase velocities and densities for the inferential estimation of phase volumetric and mass rates (Figure 12). Non-intrusive IR sensing can therefore be considered as a tool for GLF metering based on its reviewed capabilities of estimating flow characteristics. Phase volumetric rates of gas and liquid Qg, Ql can be determined as shown in equation (14). Based on phase velocities (vg,vl), phase fractions (αg,αl) and cross sectional area of the pipe A
The figure shows inferential multiphase flow applications (adapted from Al-lababidi et al.
29
).
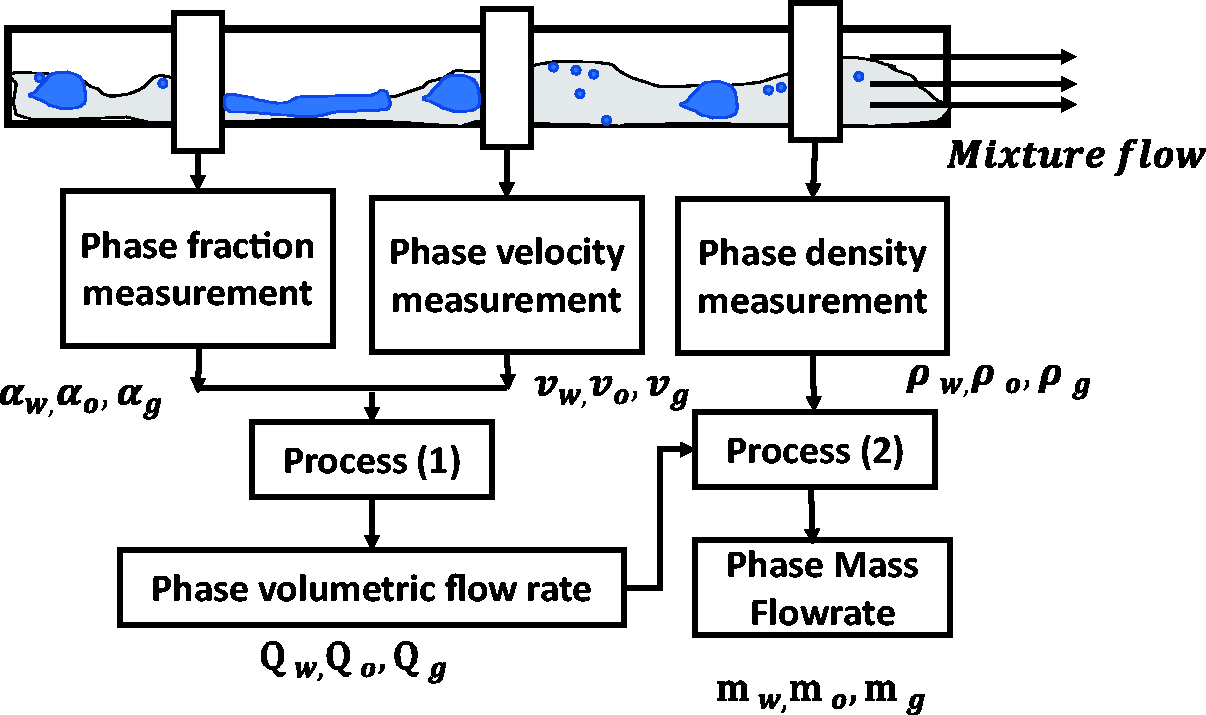
To determine the phase mass rate, phase densities (ρg,ρl) could be estimated using readily available PVT correlations and combined with IR-derived phase velocities and phase fractions as shown in equation (15)

The key limitation is its non-feasibility in opaque pipes. Further investigations on the modifications made in designing transparent to opaque connection for these limiting conditions could be considered by investigators for the future. Figure 13 illustrates a conceptual sketch of proposed modifications could appear to be. IR sensors inserted in an opaque covering, a transparent opaque pipe coupling needed to connect the sensor to an existing pipe. The sensing components are imbedded in the annulus between the outer housing and the clear pipe. The clear pipe enables transmission of IR beams through the MPF. The information is relayed to a data acquisition and interpreted using the various methods already discussed. Such designs should be tested under industrial pressures and flow rates.
A conceptual design of IR sensing for non-transparent pipes for industrial application.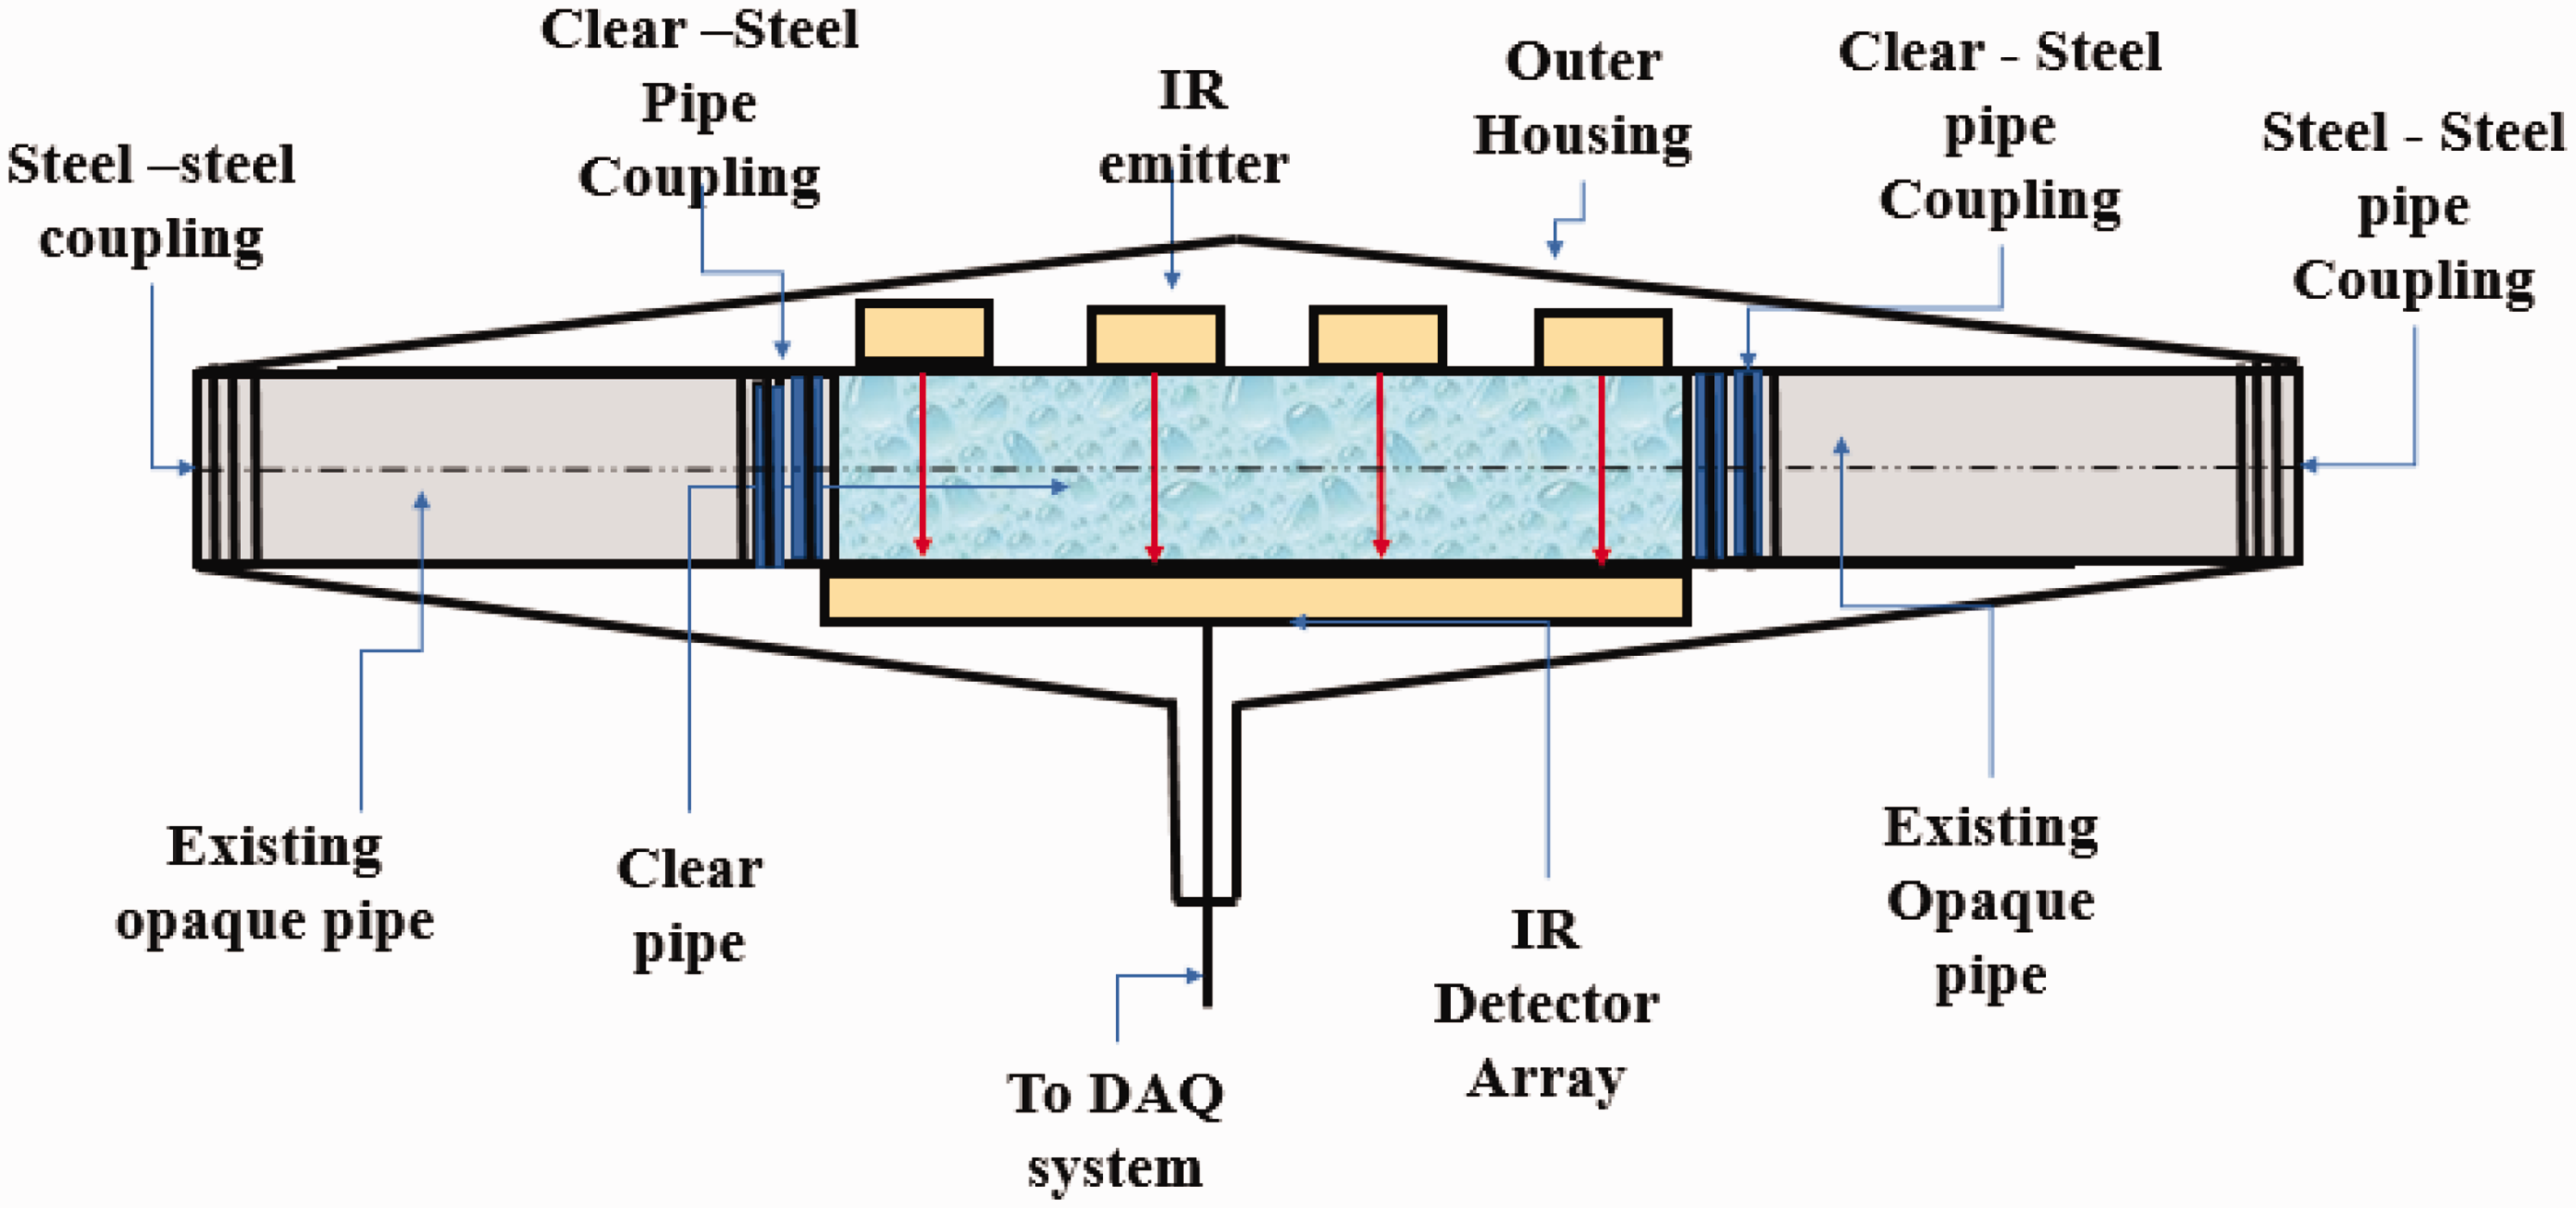
Conclusions
Sensor probe intrusion leading to exposure, corrosion, erosion and flow disruption causes inadequate description of local and global characteristics of GLF in pipes. This has justified the preference for non-intrusive techniques over their intrusive counterparts. Non-intrusive sensing techniques combine sensor-derived signals with signal analysis to provide objective and inferential interpretation to characterise GLF. A summary of non-intrusive techniques for GLF revealed that radioactive, electrical impedance, acoustic and videometry techniques were highlighted as common sensing techniques considered under laboratory and industrial conditions. The choice of each technique is based on a trade-off between cost, safety and technical requirements. The choice of non-intrusive IR sensing for GLF is considered a cheap, safe and viable technique by many investigators. The mode of operation and design considerations for adequate performance of this technique were discussed. A review of experimental work on GLF has proven the use of this IR sensing technique to be feasible for flow regime identification, phase fractions and inferential pressure drop estimation for small pipes (less than 50 mm). Furthermore, it can be suggested that IR sensing could be applied to GLF metering (i.e. measuring of phase flow rates for transparent pipe. The feasibility of this technique requires clear piping and may not be applicable for industrial applications where pipe networks are opaque. However, this limitation could further be investigated with the consideration of a clear to opaque pipe connection to ensure penetration of IR light through pipe of interest.
Footnotes
Acknowledgements
This is to acknowledge the sponsors of this review work, School of engineering London South Bank University, for providing the resources to attend conferences and publish materials.
Declaration of conflicting interests
The author(s) declared no potential conflicts of interest with respect to the research, authorship, and/or publication of this article.
Funding
The author(s) disclosed receipt of the following financial support for the research, authorship, and/or publication of this article: The research work was funded by the school of London South Bank University, School of engineering Scholarship.