
Abstract
Bioaerosol (i.e. biological aerosol) exposures in the office environment are associated with a wide range of health effects. The potential bioaerosol emission from mechanical ventilation and air conditioning (MVAC) systems can endanger the building occupants in office, especially as over 90% of commercial buildings in Hong Kong that are equipped with MVAC systems, due to the microbial growths inside MVAC systems, such as cooling coils and mixing chamber, were reported. This study evaluated the exposure risk of the bioaerosol emission from the MVAC systems to the building occupants. A two-phase flow computational fluid dynamics approach was adopted to simulate the emission, dispersion, deposition, and exhaustion of bioaerosol particles from the MVAC systems in a typical office cubicle by altering the ventilation strategies with four ventilation rates, four emission concentrations, and two microorganism species. The results reported that about 5% contribution of concentration level from the MVAC system including the ventilation rate is sufficient to dilute the biocontainment. This study suggested the importance of the maintenance strategies of MVAC systems for minimizing bioaerosol exposures in offices.
Keywords
Introduction
Bioaerosol (i.e. biological aerosol) exposures in the office environment are associated with a wide range of health effects. 1 The microbial growths inside the mechanical ventilation and air conditioning (MVAC) systems, such as cooling coils, mixing chamber, air filters, air ducts, humidifiers, and heat exchangers, were reported.2–6 For example, the bacterial concentrations were found up to 106 CFU cm−2 on the surfaces of the air-handling cooling coils. 5 The growths of biofilm have also been reported within heat exchangers that have the excess of 47,000 CFU cm−2 within four weeks of operation. 6 MVAC systems are likely to be reservoirs for microorganisms.
The existence of these microorganisms inside the MVAC systems can endanger the building occupants. The high potential of the microorganisms is aerosolized to form bioaerosol particles due to high airflow rate inside the MVAC systems. 4 The bioaerosol particles are then dispersed in the system and eventually into the occupied space through the air distribution system. For example, air samples taken at cooling coils and mixing chamber were recorded at 3880 and 865 CFU m−3 for the fungal and bacterial counts, respectively. 2 The dominant bacterial genera were Micrococcus spp., Staphylococcus spp., and Bacillus spp. For fungi, the dominant genera collected were Aspergillus spp., Cladosporium spp., Penicillium spp., and Fusarium spp. Various respiratory symptoms and health outcomes of the biocontaminated building occupants were reported, often implicated by elevated bioaerosol exposures. 7
Little understanding of the relative influences of bioaerosol exposure from the MVAC systems to the building occupants was found. No study is available yet to assess quantitatively how bioaerosol emission occurs from the MVAC systems and other related factors and on how to evaluate the indoor bioaerosol concentrations in air-conditioned offices. One of the functions of the MVAC systems is to reduce the bioaerosol concentration level. Knowledge concerning the degree of connectivity between indoor and bioaerosol emission from the MVAC system is limited. 8 It is uncertain how the bioaerosol from the MVAC systems affects office workers in Hong Kong, especially with over 90% of commercial buildings in Hong Kong equipped with the MVAC system. 2 Such emissions from an MVAC system may create an impact for infection control in offices.
This study evaluates the exposure concentration of the bioaerosol emission from MVAC systems to the building occupants. The exposure level for building occupants had been investigated under the influence of the bioaerosol emission and ventilation rate (VR), in terms of air change rate per hour (ACH). A two-phase flow computational fluid dynamics (CFD) simulation of a typical office cubicle of Hong Kong was conducted by ANSYS Fluent (i.e. Version 14) with various bioaerosol emission concentrations, VRs, and microorganism species. The findings can be used by the building management to minimize bioaerosol exposure for maintenance strategies of MVAC systems.
Two-phase flow CFD models for bioaerosol particle simulation
Bioaerosol particles in the indoor air are related to spreading of airborne infectious diseases and some pandemic outbreaks such as Severe Acute Respiratory Syndrome (SARS) in 2003 and Middle East Respiratory Syndrome (MERS) in 2015. Several environmental control strategies and parameters for a ventilation system have been suggested to prevent infections in building environments. 9 To design an appropriate ventilation system, some infection risk models were proposed in order to achieve effective infection control such as Wells–Riley and dose–response. 10 CFD simulation is often used to predict the spatial and temporal distributions of bioaerosol particles for the infection risk assessment for indoor airflow (i.e. Rebp < 1). 11
For bioaerosol particle movement simulation, the drift-flux model (DFM) and discrete phase model (DPM) are two commonly used approaches in gas–particle flow CFD simulation. 12 Since the size of the bioaerosol particles is less than 100 µm, it was assumed to be airborne, 13 and the gas–gas two-phase CFD simulation has been used to estimate bioaerosol particle dispersion by a DFM under a Eulerian–Eulerian framework. 14 However, the behavior of bioaerosol particles in air differ from that of gas molecules for the same boundary condition. For example, bioaerosol particles maintain higher momentum (i.e. velocity) along with an airstream when compared with the rapid momentum decay of gas molecules. 15
In addition, the molecular diffusion could be neglected for bioaerosol.15–17 DPM has been proposed to predict bioaerosol particle movement by the force balance of the interactions with the continuum phase in equation (1). This Maxey and Riley equation is derived from the Basset–Boussinesq–Oseen equation without the Faxen term due to the curvature of the velocity field.15,18,19


These equations demonstrated that the Eulerian–Lagrangian framework provides an accurate prediction of the turbulent transport of discrete particles by comparison with direct numerical simulation results and the widely referred wind-tunnel experiments. 25 Stochastic fluctuations are complemented with statistical turbulent dispersions by discrete random walk, although the instantaneous turbulence quantities of the dispersed phase cannot be solved by the Reynolds-averaged Navier–Stokes (RANS) model. 15
In addition, the drag coefficient and the drag constant of bioaerosol particle are suggested to relate its equivalent bioaerosol diameter debd as particle diameter in terms of its shape, surface texture, and elasticity which are different from the aerosol particle in equation (4)
26


Using equations (6) and (7), the equivalent bioaerosol diameter debd and aspect ratio can be determined from electron micrographs by the projected image area, length, and width which are Ab, l1, and l2, respectively.27,28


This model provides a simple and quick tool to simulate the dispersion and deposition of the bioaerosol particles in two-phase flow CFD simulation. The model also suggests a numerical method to understand the spreading process of airborne infectious disease and evaluate the exposure risk assessment for infection control application in workplace environments.
CFD simulation for bioaerosol exposure for a workplace environment
Application of health risk assessment for an office cubicle
In this section, a continuous emission from the MVAC system was suggested to simulate the bioaerosol exposure level in an office cubicle. A numerical bioaerosol transport framework in Figure 1, which is based on the empirical bioaerosol drag coefficient model.
26
It was adopted to simulate the emission, dispersion, deposition, and exhaustion of bioaerosol particles from the MVAC systems in a typical office room (i.e. Office A) by altering the ventilation strategies with four VRs, four emission concentrations, and two microorganism species. The findings of the simulation provided the bioaerosol concentration and exposure levels by bioaerosol emission from an MVAC system. This simulation also suggested the building management to plan the maintenance strategies of the MVAC systems for minimizing bioaerosol exposures in offices.
The numerical bioaerosol particle transport framework for the office cubicle simulation. MVAC: mechanical ventilation and air conditioning.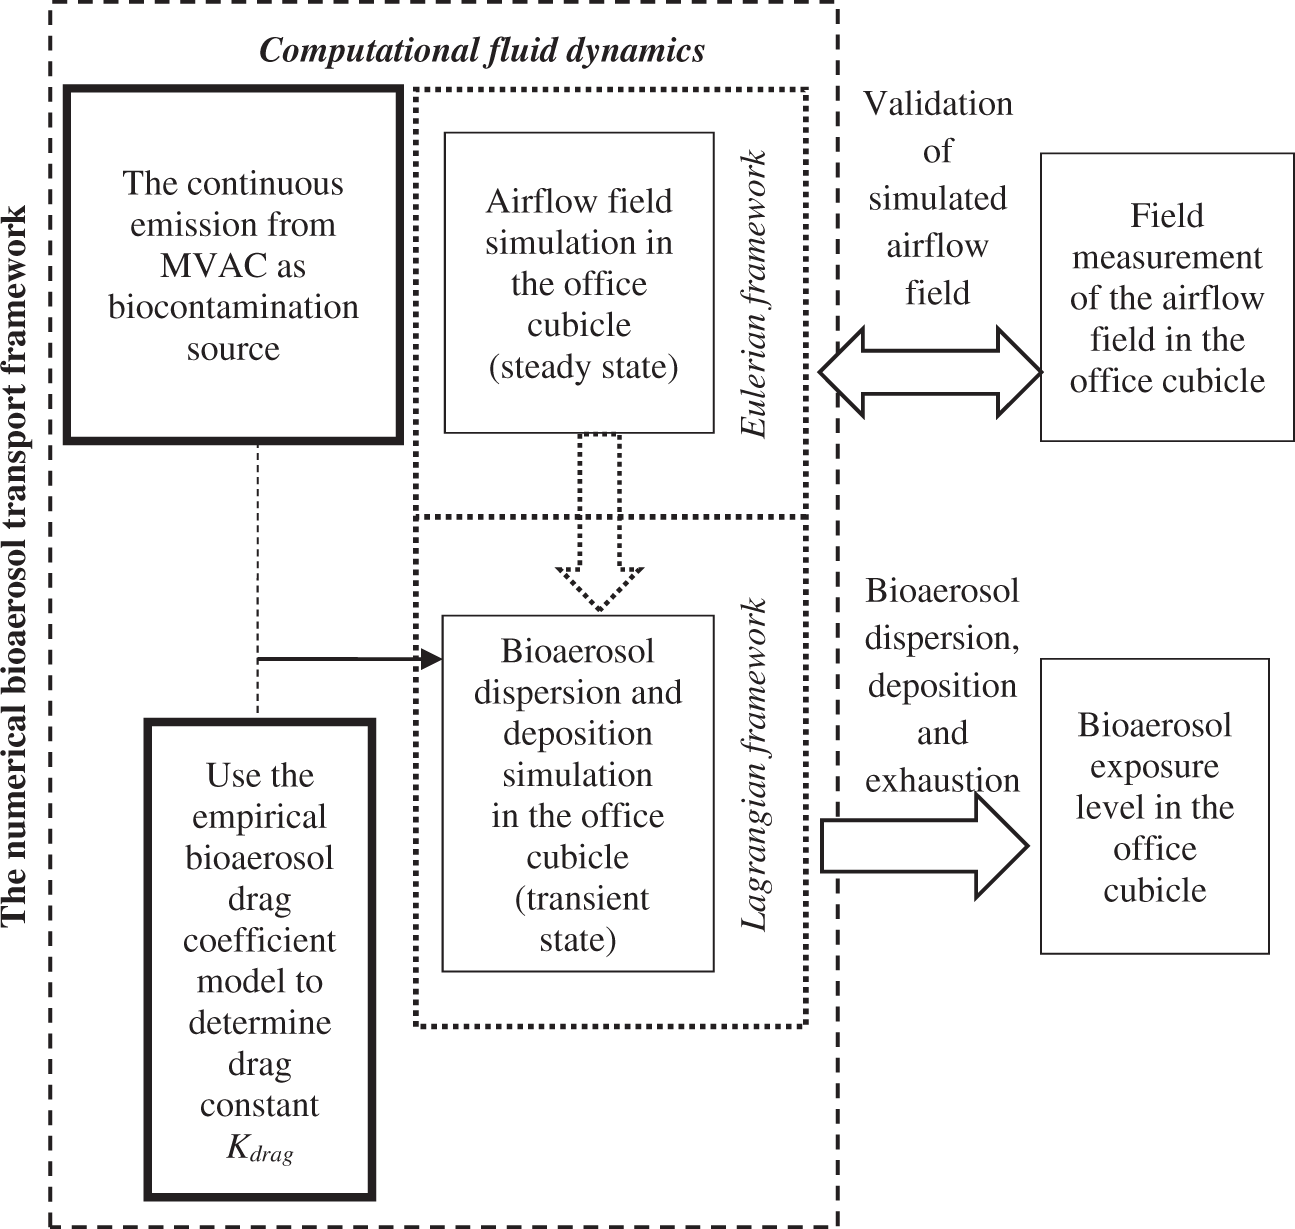
Determination of exposure level from a continuous emission source
Exposure to over a period of time can be represented by a time-variant bioaerosol exposure concentration in concentration–time units in equation (8).

Figure 2 illustrates the typical mixing ventilation of an MVAC system for an office. By mass conservation, the change of bioaerosol particles in the office with time must be equal to the difference between the bioaerosol sources (i.e. from the MVAC system only, no other bioaerosol emission source was assumed inside the office) and sinks (i.e. exhaust to the MVAC and deposition on room surfaces) for a single-zone ventilation model. The concentration (CFU m−3) could be estimated by particle counts and office cubicle volume in equation (9).
Typical mixing ventilation for an office.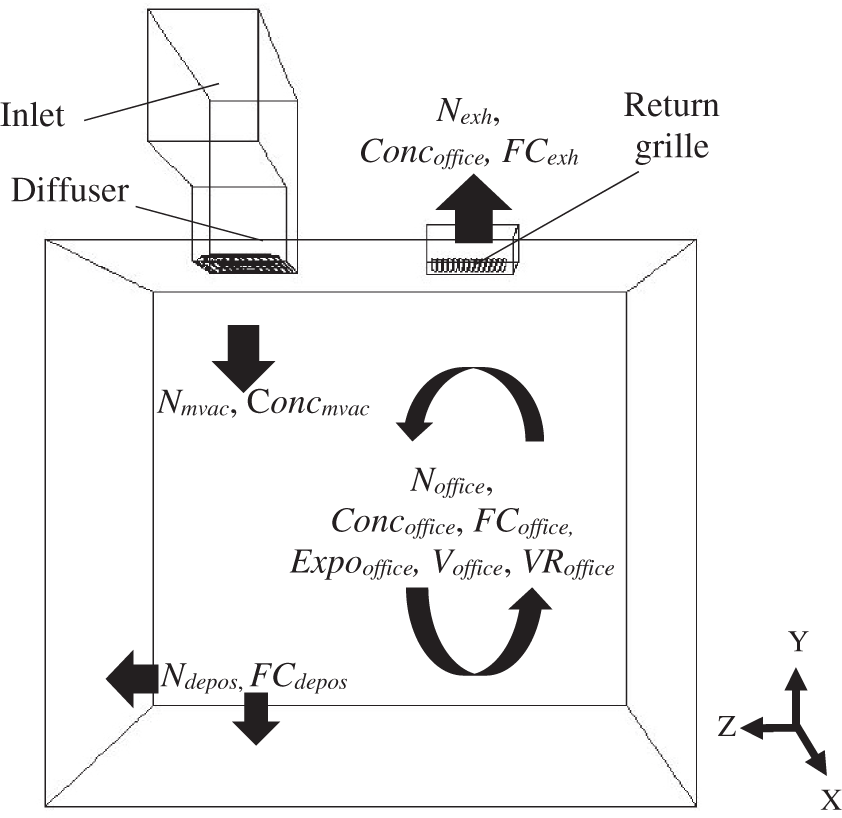


Bioaerosol particles suspended in the office Noffice is equal to the bioaerosol particles generated from an MVAC system Nmvac (in counts) removed by the exhaust Nexh and deposited on room surfaces Ndepos without resuspension. The growth and death of the microorganisms were ignored due to the simulation focused on the contribution of the continuous bioaerosol emission from ventilation system and only lasted for 1 h.
The bioaerosol emission concentration from an MVAC system Concmvac is varied by the MVAC system configuration such as a ratio of fresh air and recirculation air or an outdoor bioaerosol concentration. In this simulation, the bioaerosol concentrations before diffusers and VR were used as the final outcomes from the MVAC system. These variables could be estimated from bioaerosol particle movements by CFD simulations. To understand the bioaerosol removal process, the bioaerosol fractional counts FCoffice, FCexh, and FCdepos are given below in equation (11).
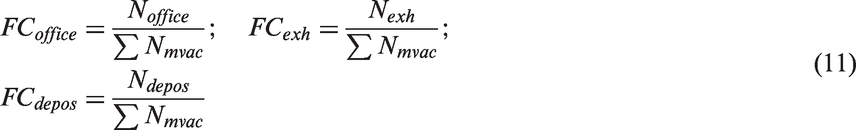
By combining equations (9) and (10), the accumulated emitted number of the particles is equal to the sum of FCoffice and accumulated FCexh and FCdepos due to the continuous injection of the bioaerosol particles from the MVAC system in equation (12).

To confirm the mass balance between the bioaerosol emission and the sum of the exhaust, deposition, and suspension, Figure 3 provides a visual integration of these fractional counts FCoffice, ΣFCexh, ΣFCdepo, and ΣFCmvac in equation (12) for the two-phase CFD simulation.
Description of the bioaerosol removal process. MVAC: mechanical ventilation and air conditioning.
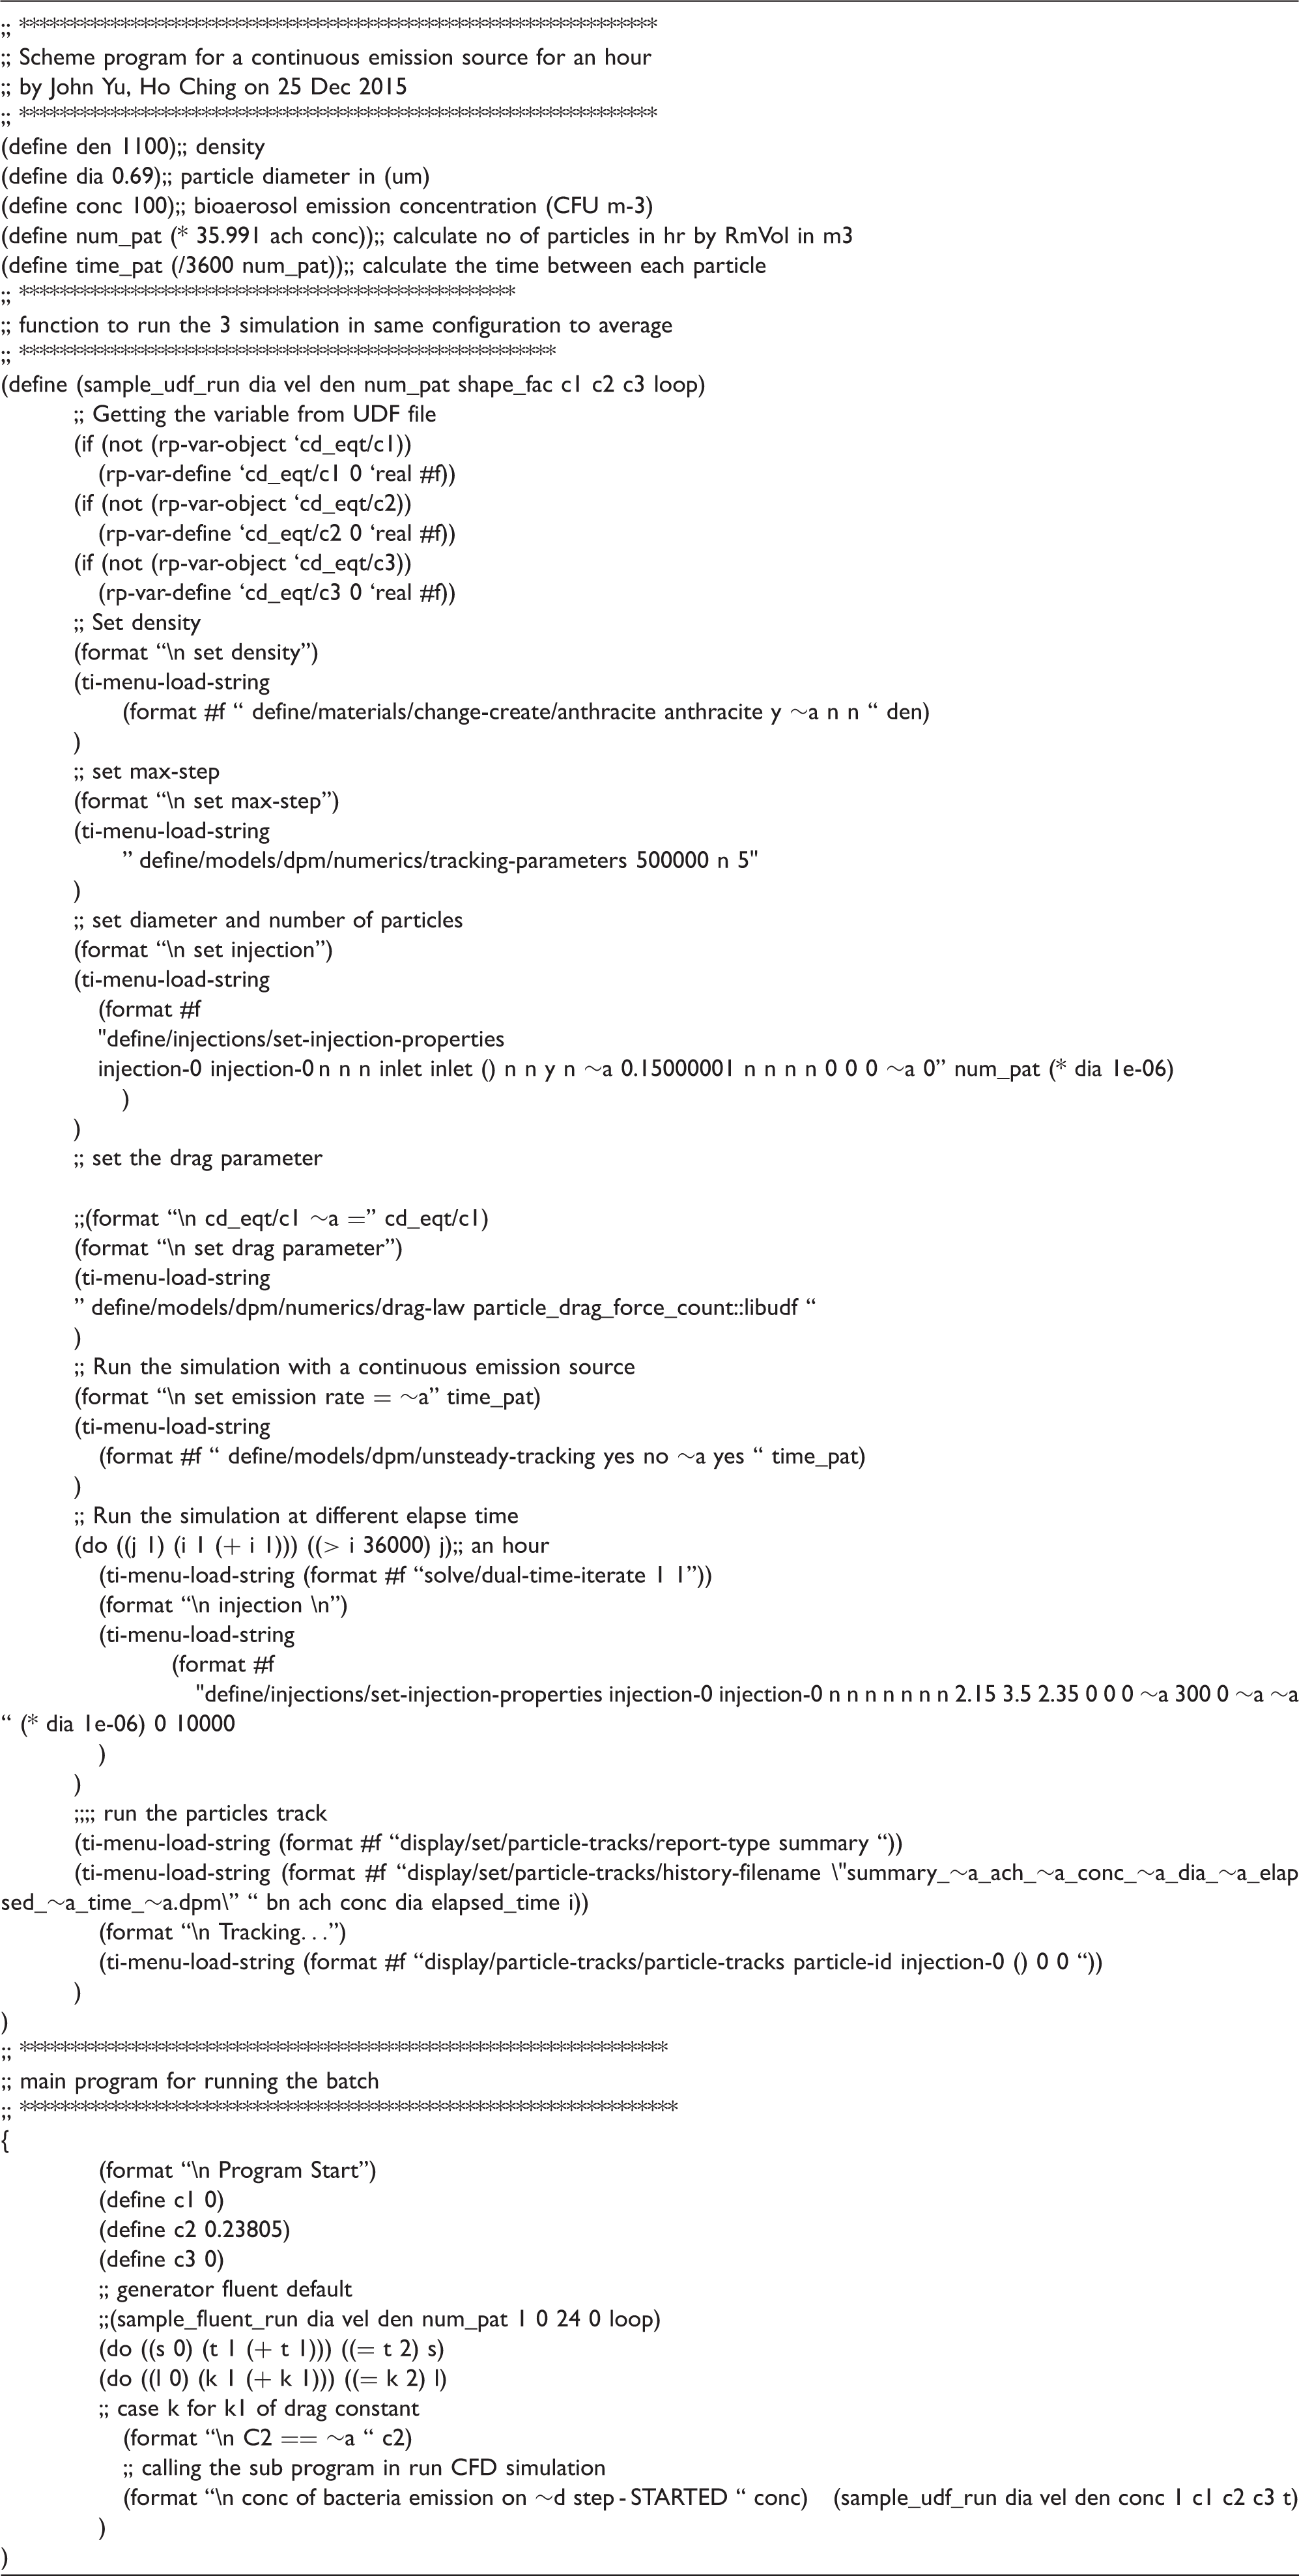
Fluent Scheme program for the continuous emission source.
Numerical simulations of bioaerosol exposure level of an office cubicle of Hong Kong
Information of the bioaerosol species.
Standard errors are shown.
Office A with dimensions of 4.3 m (L) × 3.1 m (W) × 2.7 m (H) is illustrated in Figure 5. There was an air inlet with a ceiling-mounted diffuser in the cubicle and a return grille as an air outlet. The bioaerosol particles were continuously emitted 0.5 m above the diffuser. The distance provided the bioaerosol particles to be initial as if the particles emitted from the MVAC system in terms of velocity and distribution before the diffuser. The particle injection time was calculated from the emission concentration Concmvac and VR VRoffice. After the injection, the positions and velocities of the bioaerosol particles were updated by DPM until deposited on the walls of the office or discharged to the outlet. The walls of the office were insulated well and considered to be adiabatic. The room temperature was assumed to be 22.9℃, which is the average temperature from a survey of 2133 air-conditioned office buildings of Hong Kong.
32
Referenced SEM photos of the bioaerosol species. (a) Cladosporium cladosporioides (ATCC16021), (b) Staphylococcus aureus (ATCC 6538). The layout and CFD configurations in Office A.
CFD simulation settings and boundary conditions.
CFD: computational fluid dynamics.
Results of the bioaerosol exposure in the office cubicle of Hong Kong
Effect of the continuous emission from the MVAC system in an office cubicle
Figure 6 shows the dynamic bioaerosol concentration in the office cubicle Concoffice within an hour with various S. aureus emission concentration Concmvac (i.e. 100, 200, 300, and 400 CFU m−3) and VRoffice (i.e. 1, 5, 9, and 13 ACH) from the MVAC system. Generally, the bioaerosol concentration became steady in condition within first 10 min. The steady concentration levels Concoffice were found similar at the same emission concentrations Concmvac, even at different VRs. For example, around 5 CFU m−3 of steady concentration levels Concoffice were observed in all 100 CFU m−3 emission concentration Concmvac with the four VRoffice (i.e. 1, 5, 9, and 13 ACH). Around 5% of the emission concentration from the MVAC system Concmvac contributes to the bioaerosol concentration inside the cubicle. The VRoffice seem less sensitive to the bioaerosol concentration level in room Concoffice instead of the bioaerosol emission concentration Concmvac. Only the high fluctuation of the bioaerosol concentrations in room Concoffice was associated with the high VRoffice (i.e. 9 and 13 ACH) that demonstrates the dynamic equilibrium on the steady concentration levels.
Staphylococcus aureus concentration level for ventilation rates and emission concentrations. ACH: air change rate per hour; CFU: colony-forming unit.
In Figure 7, the similar results of C. cladosporioides were found, except VRoffice at 1 ACH. The non-steady state conditions of the C. cladosporioides concentration level indicate the VRoffice (i.e. 1 ACH) was insufficient to balance the concentration level to the equilibrium state. The VR was not enough to dilute the larger bioaerosol particles (3.4 µm) in Office A since the higher gravity force and inertia are proportional to the particle mass (i.e. debd3).
26
Cladosporium cladosporioides concentration level for ventilation rates and emission concentrations. ACH: air change rate per hour; CFU: colony-forming unit.
The insufficient VRoffice (i.e. 1 ACH) of C. cladosporioides and S. aureus were also demonstrated in the bioaerosol fractional count FC in Figure 8. Larger elapsed fractional counts FCdepos of C. cladosporioides and S. aureus were found at 1 ACH of VRoffice by comparing with other VRs. In addition, the elapsed fractional counts FCoffice doubled between S. aureus and C. cladosporioides. Due to C. cladosporioides particles were accumulated in Office A in a higher number and stayed longer than S. aureus particles. The maximum elapsed time tmax_office of C. cladosporioides (i.e. 14 min) was almost twice than that of S. aureus (i.e. 7 min) by a single-shot of 11,500 bioaerosol particles emission in Figure 9. Both findings reported that the insufficient VRs VRoffice leads to non-steady concentration levels Concoffice and larger elapse fraction counts FCdepos from the MVAC system.
Fractional count of bioaerosol particles for concentration distributions and deposition patterns for S. aureus and C. cladosporioides. ACH: air change rate per hour; CFU: colony-forming unit. Fractional count of bioaerosol particles for single-shot emission at 1 ACH of VRoffice. (a) S. aureus and (b) C. cladosporioides.
Large deposited fractional count FCdepos (i.e. >0.8) also shows the large portions of bioaerosol particles deposited in the office surfaces (i.e. Wall2, Wall3, and Wall4) instead of those exhausted to the return grille (i.e. outlet) in Figure 8. These depositions may cause high infection risk via surface contact. For bacterial species, S. aureus are expected to decay in air and office surfaces in the office environments. However, C. cladosporioides may grow to form mould on the office’s walls or ceilings as fungal species.
Exposure level with the bioaerosol emission concentration from the MVAC system
The correlation of the bioaerosol exposure level Expooffice and emission concentration from the MVAC system is indicated in Figure 10. Linear correlations of all the VRs were reported. The exposure levels of the non-steady states (i.e. 1 ACH of VRoffice for C. cladosporioides) are doubled from the steady state conditions of concentration levels that suggested the sufficient level of the VR that can contribute to dilute the bioaerosol particles in the room. There is a great difference when the VR is insufficient to achieve the steady state conditions of concentration level and reduce the exposure level. The critical VR is varied with the bioaerosol species in terms of the equivalent bioaerosol diameter debd; however, the value should be the minimum requirement for the MVAC system to avoid the accumulation of bioaerosol particles and infection risk. Over this critical VR, the exposure level has only 5% contribution from the emission concentration from the MVAC system.
Bioaerosol exposure level with different emission concentrations. (a) S. aureus and (b) C. cladosporioides. ACH: air change rate per hour; CFU: colony-forming unit; MVAC: mechanical ventilation and air conditioning.
The findings remind us of the importance of maintaining the cleanliness of the ventilation system (i.e. filter cleaning) instead of just considering the ventilation system design process or infection control. In addition, the installation of ultraviolet germicidal irradiation devices inside the MVAC system is also recommended for the disinfection of microorganisms. The provision of the fresh air could also help to dilute the emission concentration by mixing with the recirculation air. However, the VR is not associated with the recirculation ratio of the ventilation system instead of airflow dominated. The balance of infection control and energy efficiency have to be further investigated. The two-phase flow CFD application for bioaerosol particle simulated an exposure risk assessment of the office cubicle with ventilation system parameters in terms of VR, emission concentration, and emission species. The results provide the useful information to the building management to minimize bioaerosol exposure for maintenance strategies of an MVAC system for public health.
Conclusion
The study indicates the bioaerosol emission concentration is a major factor for the concentration and exposure level in an office environment. The cleanliness and maintenance of an MVAC system are important to reduce the bioaerosol emission from an MVAC system. In addition, UVGI lamps are recommended to install inside MVAC systems for microorganisms disinfection. For VR, it is critical to maintain a steady state of concentration level. The bioaerosol emission concentration level contributes only 5% to the concentration level in an office environment if the VR is sufficient to balance the emission. However, the balance of infection control and energy efficiency could be further investigated on the recirculation ratio of the ventilation system instead of fresh air. The two-phase flow simulation provides an exposure risk assessment application to study the interaction between the bioaerosol particle and airflow inside a typical Hong Kong office environment.
Footnotes
Declaration of conflicting interests
The author(s) declared no potential conflicts of interest with respect to the research, authorship, and/or publication of this article.
Funding
The author(s) disclosed receipt of the following financial support for the research, authorship, and/or publication of this article: The work described in this paper was partially supported by the grants from The Hong Kong Polytechnic University (Project account number G-YBA7).