
Abstract
Enabling turbulence dispersion in a computational fluid dynamics simulation of a developing liquid–solid pipe flow leads to a focus of low-Stokes number particles around the pipe axis. This phenomenon is found to concentrate their impacts on a centrally located target surface such that a local erosion spot develops. This result is counter-intuitive as low-Stokes particles are deemed to follow the carrier average streamlines going around the body, which diminishes their probability of impact. This is nevertheless a fact reported experimentally too. Analysis of the simulations reveals that turbulence tends to drive preferentially tiny particles from areas of high to low agitation. This phenomenon is sometimes named as turbophoresis. Long straight piping systems are typical candidates for turbulent pipe flows hosting an annular zone of turbulence that tends to disperse and concentrate fines towards the axis. At the approach of a body, like a cross-flow cylinder, particles may be somewhat re-scattered away by the carrier dragging them around. As such, this turbulence dispersion effect on fines concerns various industrial solid transport systems. Fine impacts concentration is likely to create unexpected, local wear zone.
Keywords
Introduction
Erosion and wear are major concerns in modern industrial economies. They impact in value for overall 5% of the domestic product. 1 This is a non-negligible share of the wealth created.
Processing and resources industries are particularly exposed to the transport of abrasive particles as well as components of oil and gas wells. The physical properties of the carrier fluid in the case of slurries and the filtering systems retaining the biggest particles in general lead to a mechanism of transport for the dispersed material in which the drag of the carrier closely drives the trajectories. For this reason, it has been often stated that the flow features have a mitigating effect on erosion by deviating the small particles from impact as the carrier fluid goes around the wall. 2
To quantify the amplitude of the response of a particle to drag by its carrier, a non-dimensional group, weighting the balance between the particle inertia and the drag it is subject to – when assumed spherical and in the Stokes regime – has been created and named the Stokes number (St):

Literature review
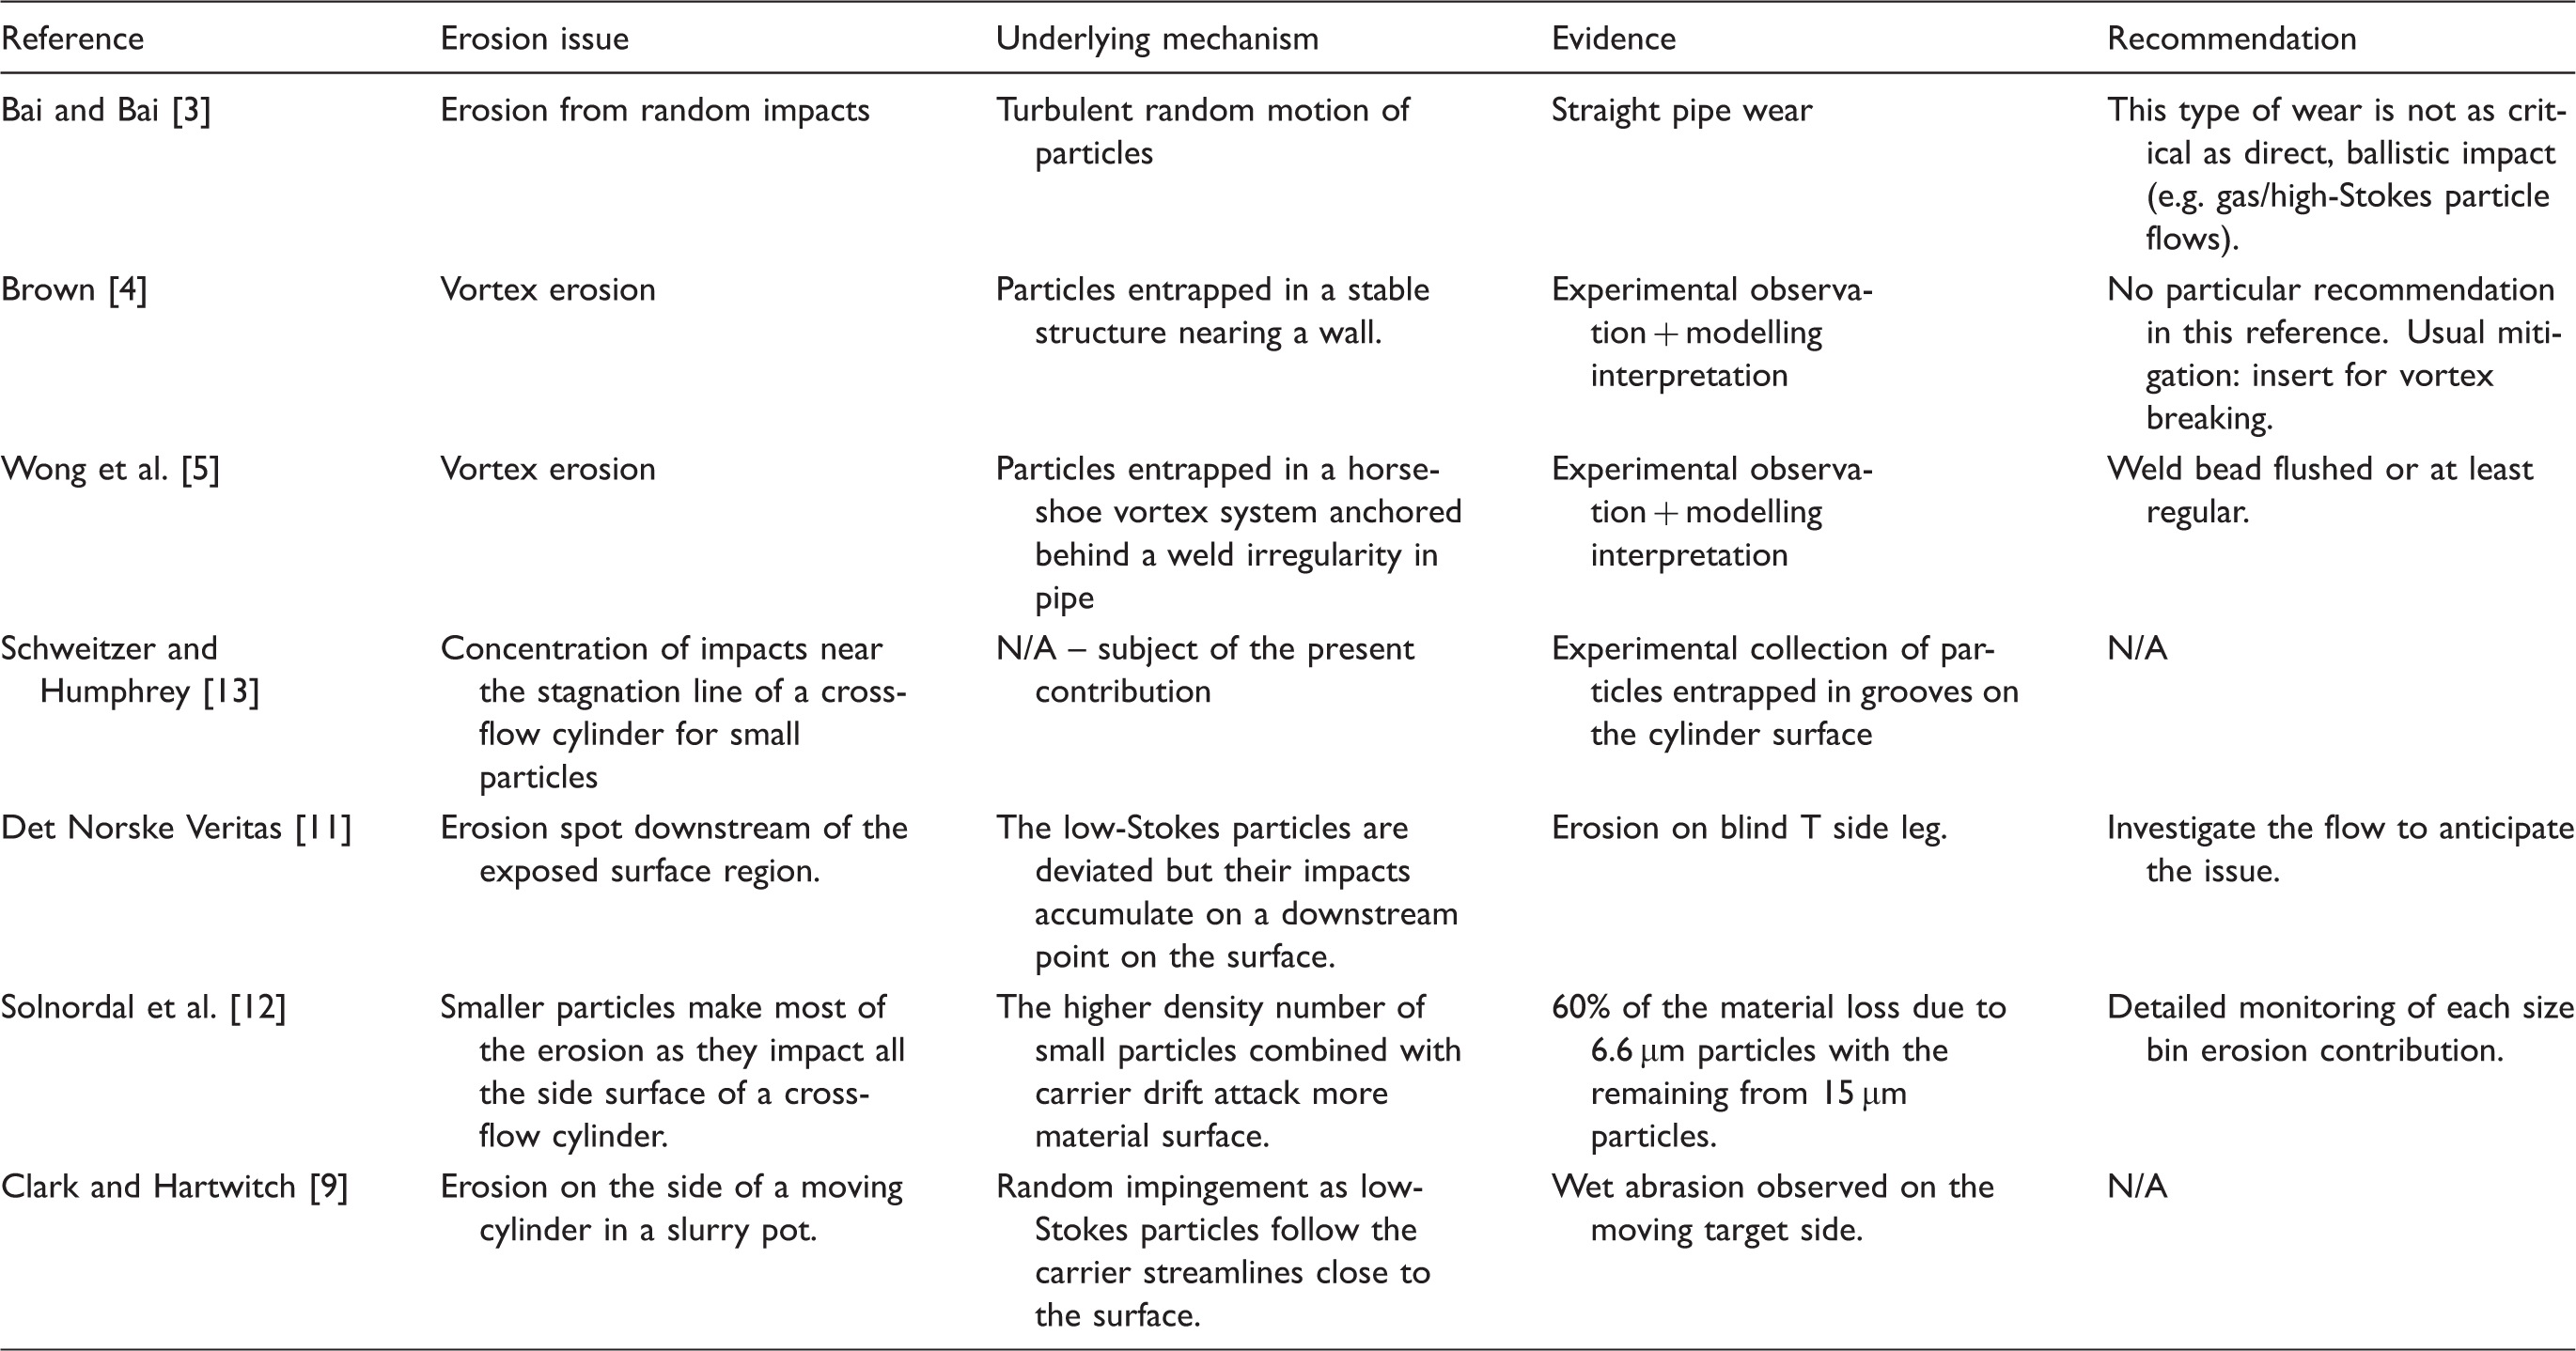
Mechanisms of erosion by transported abrasive particles are split into two categories: direct and random impingements. 3 Direct impingement happens when particles have sufficient momentum to traverse the streamlines at a flow re-direction location. This is concerned with high-Stokes particles on which insufficient drag can be applied by the carrier to redirect them due to their high inertia. Random impingement on the contrary addresses low-Stokes dispersed material in a turbulent flow. The particles are here sufficiently reactive to the drag of the carrier to respond to turbulence random motions. Near a wall, these slight turbulence-induced excursions away from the average trajectory cause the particles to hit randomly although the carrier streamlines on an averaged basis would not lead to impact. This is an example of a counter-intuitive effect of the turbulence on fines erosion: low-Stokes particles generate erosion from a random motion while high-Stokes particles in line with the flow axis do not.
Another counter-intuitive effect on erosion from low-Stokes particles combined with particular flow structures is the vortex erosion phenomenon. A vortex entraps low-Stokes particles and, if close enough to a wall, generates erosion spots in unsuspected areas.4,5
From an engineering practice viewpoint, the phenomenon essentially reckoned for carrier/particle interaction is the fluid effect.
The so-called fluid effect is the deviation imposed by the drag of the average carrying flow on the small particles at the wall approach. It has been proposed as an explanation for erosion impact velocity dependency that differs from the kinetic energy concept (i.e. a velocity exponent differing from the response of erosion to impact kinetic energy). 6 An instance of such a dependency is discussed in Wong et al. 7 Vacuum experiments also exhibit this kind of velocity dependency. 8 The interpretation in this latter reference is an enhanced erosion from secondary impacts of large-then-fractured particles.
The fluid effect has also been proposed as an explanation for an apparent size threshold between two types of erosion mechanisms: 9 from direct impact for large particles to wet abrasion when small particles are trapped by the streamlines bathing the target. 10 This resonates with the direct versus random types of erosion introduced earlier.
In any case, the carrier average drag is the only interaction considered in the fluid effect. Other known particle–carrier interactions such as turbulence dispersion may also impact erosion following different and specific scales that remain to be elucidated.
If the fluid effect is generally considered to mitigate erosion occurrence, it may also be responsible for enhanced erosion on specific hot spots. This may happen for instance when an insufficient drag of the flow average streamlines cannot make the particles completely avoid the wall but rather focus them at a specific impact location (plug tee, Det Norske Veritas, 11 cross-flow cylinder, Solnordal et al. 12 ).
The empirical evidence
The paths of low-Stokes particles are thus expected to deviate away from solid surfaces from the action of the carrier average drag – the fluid effect. Some experimental results however suggest that the scenario may not be so simple. The experiments of Schweitzer and Humphrey 13 using glass beads suspended in air show that particles of small size tend to impact towards the centre of a cross-flow cylinder in a straight wind tunnel. This is a phenomenon that the present authors have also observed experimentally. These observations are presented below for slurry flows as well as multiphase flows.
Slurry flow
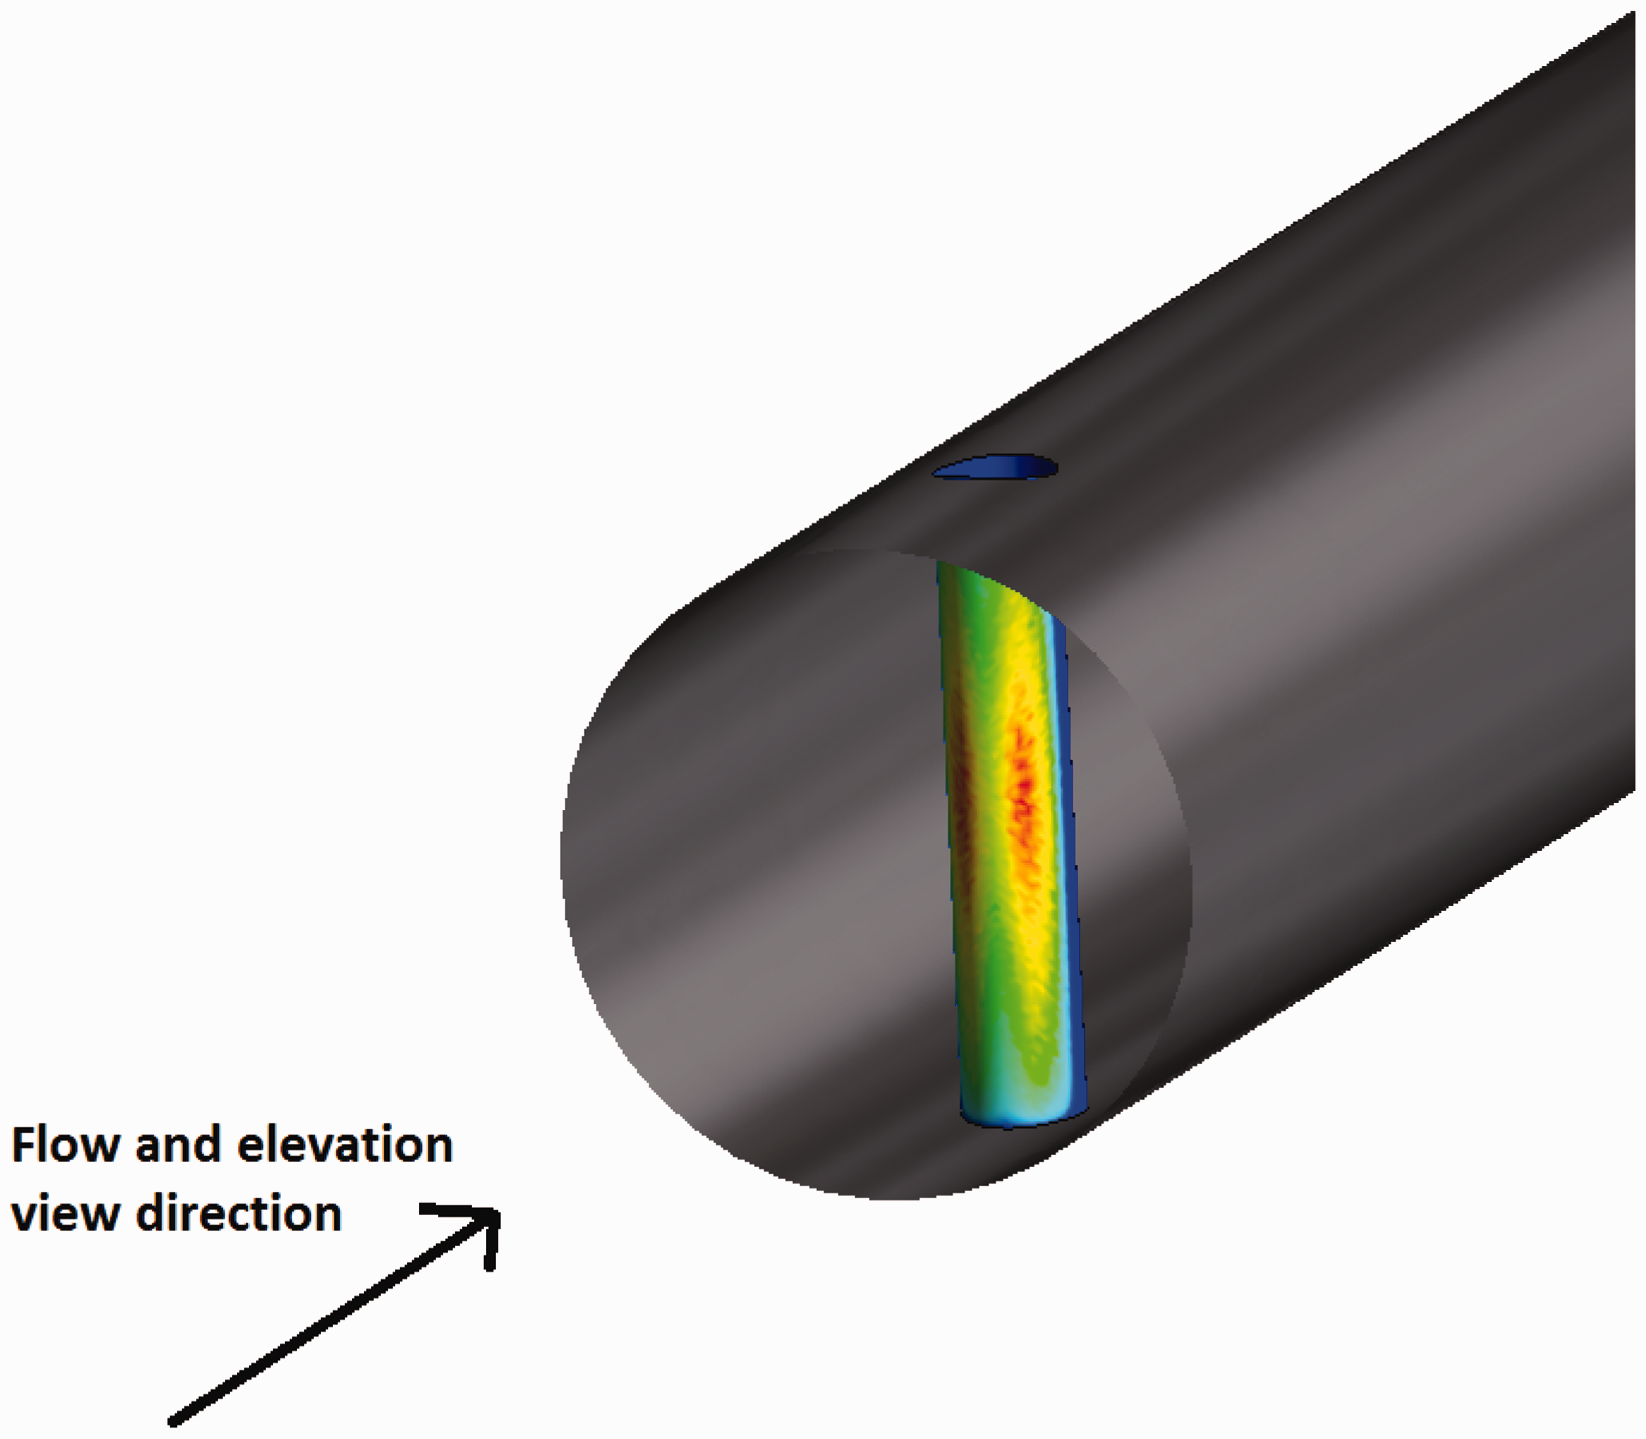
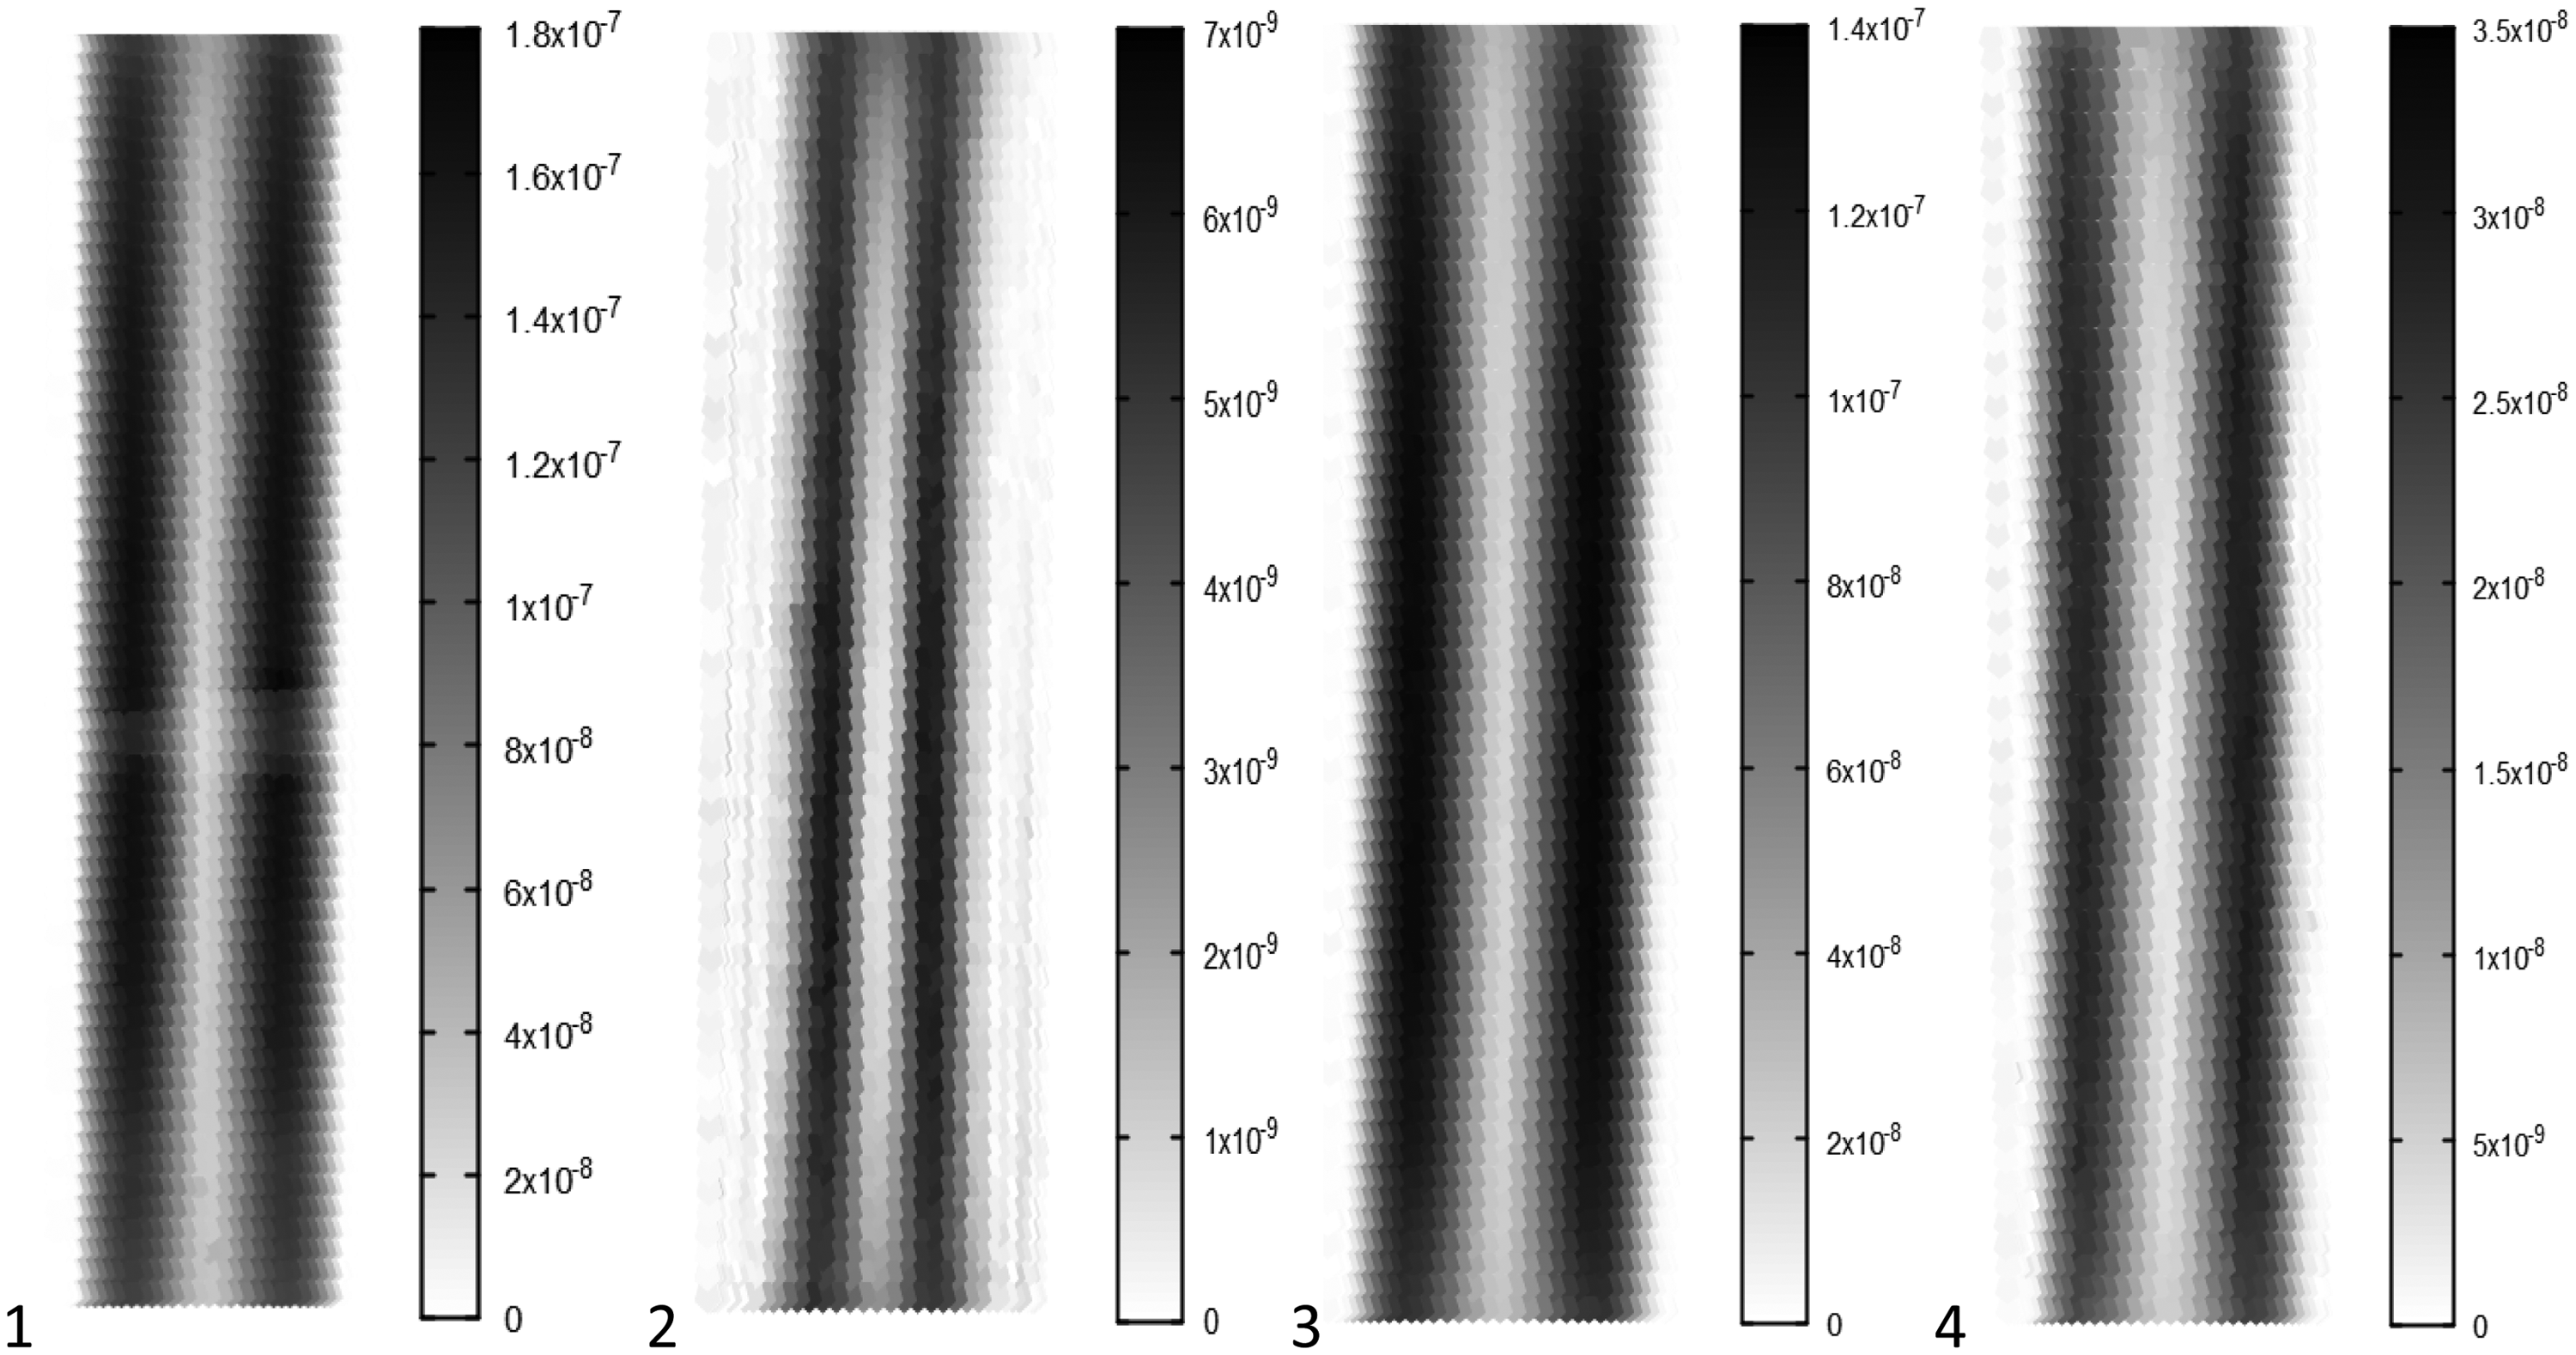
Slurry erosion experiments were conducted in a straight 50.8 mm (2″) diameter pipe with a cross-flow cylinder (10 mm in diameter) as a target. Figure 1 presents the measured specific erosion rate on the target exposed face. The specific erosion rate ‘er’ is defined as: Elevation view of cross-flow cylinder exposed face. Specific erosion rate contours. Slurry experiments. Refer to Table 1. Schematic explaining how the elevation view of cross-flow cylinder exposed surface is defined. Elevation view of cross-flow cylinder exposed face. Specific erosion rate contours. Air-slurry experiments. Refer to Table 2.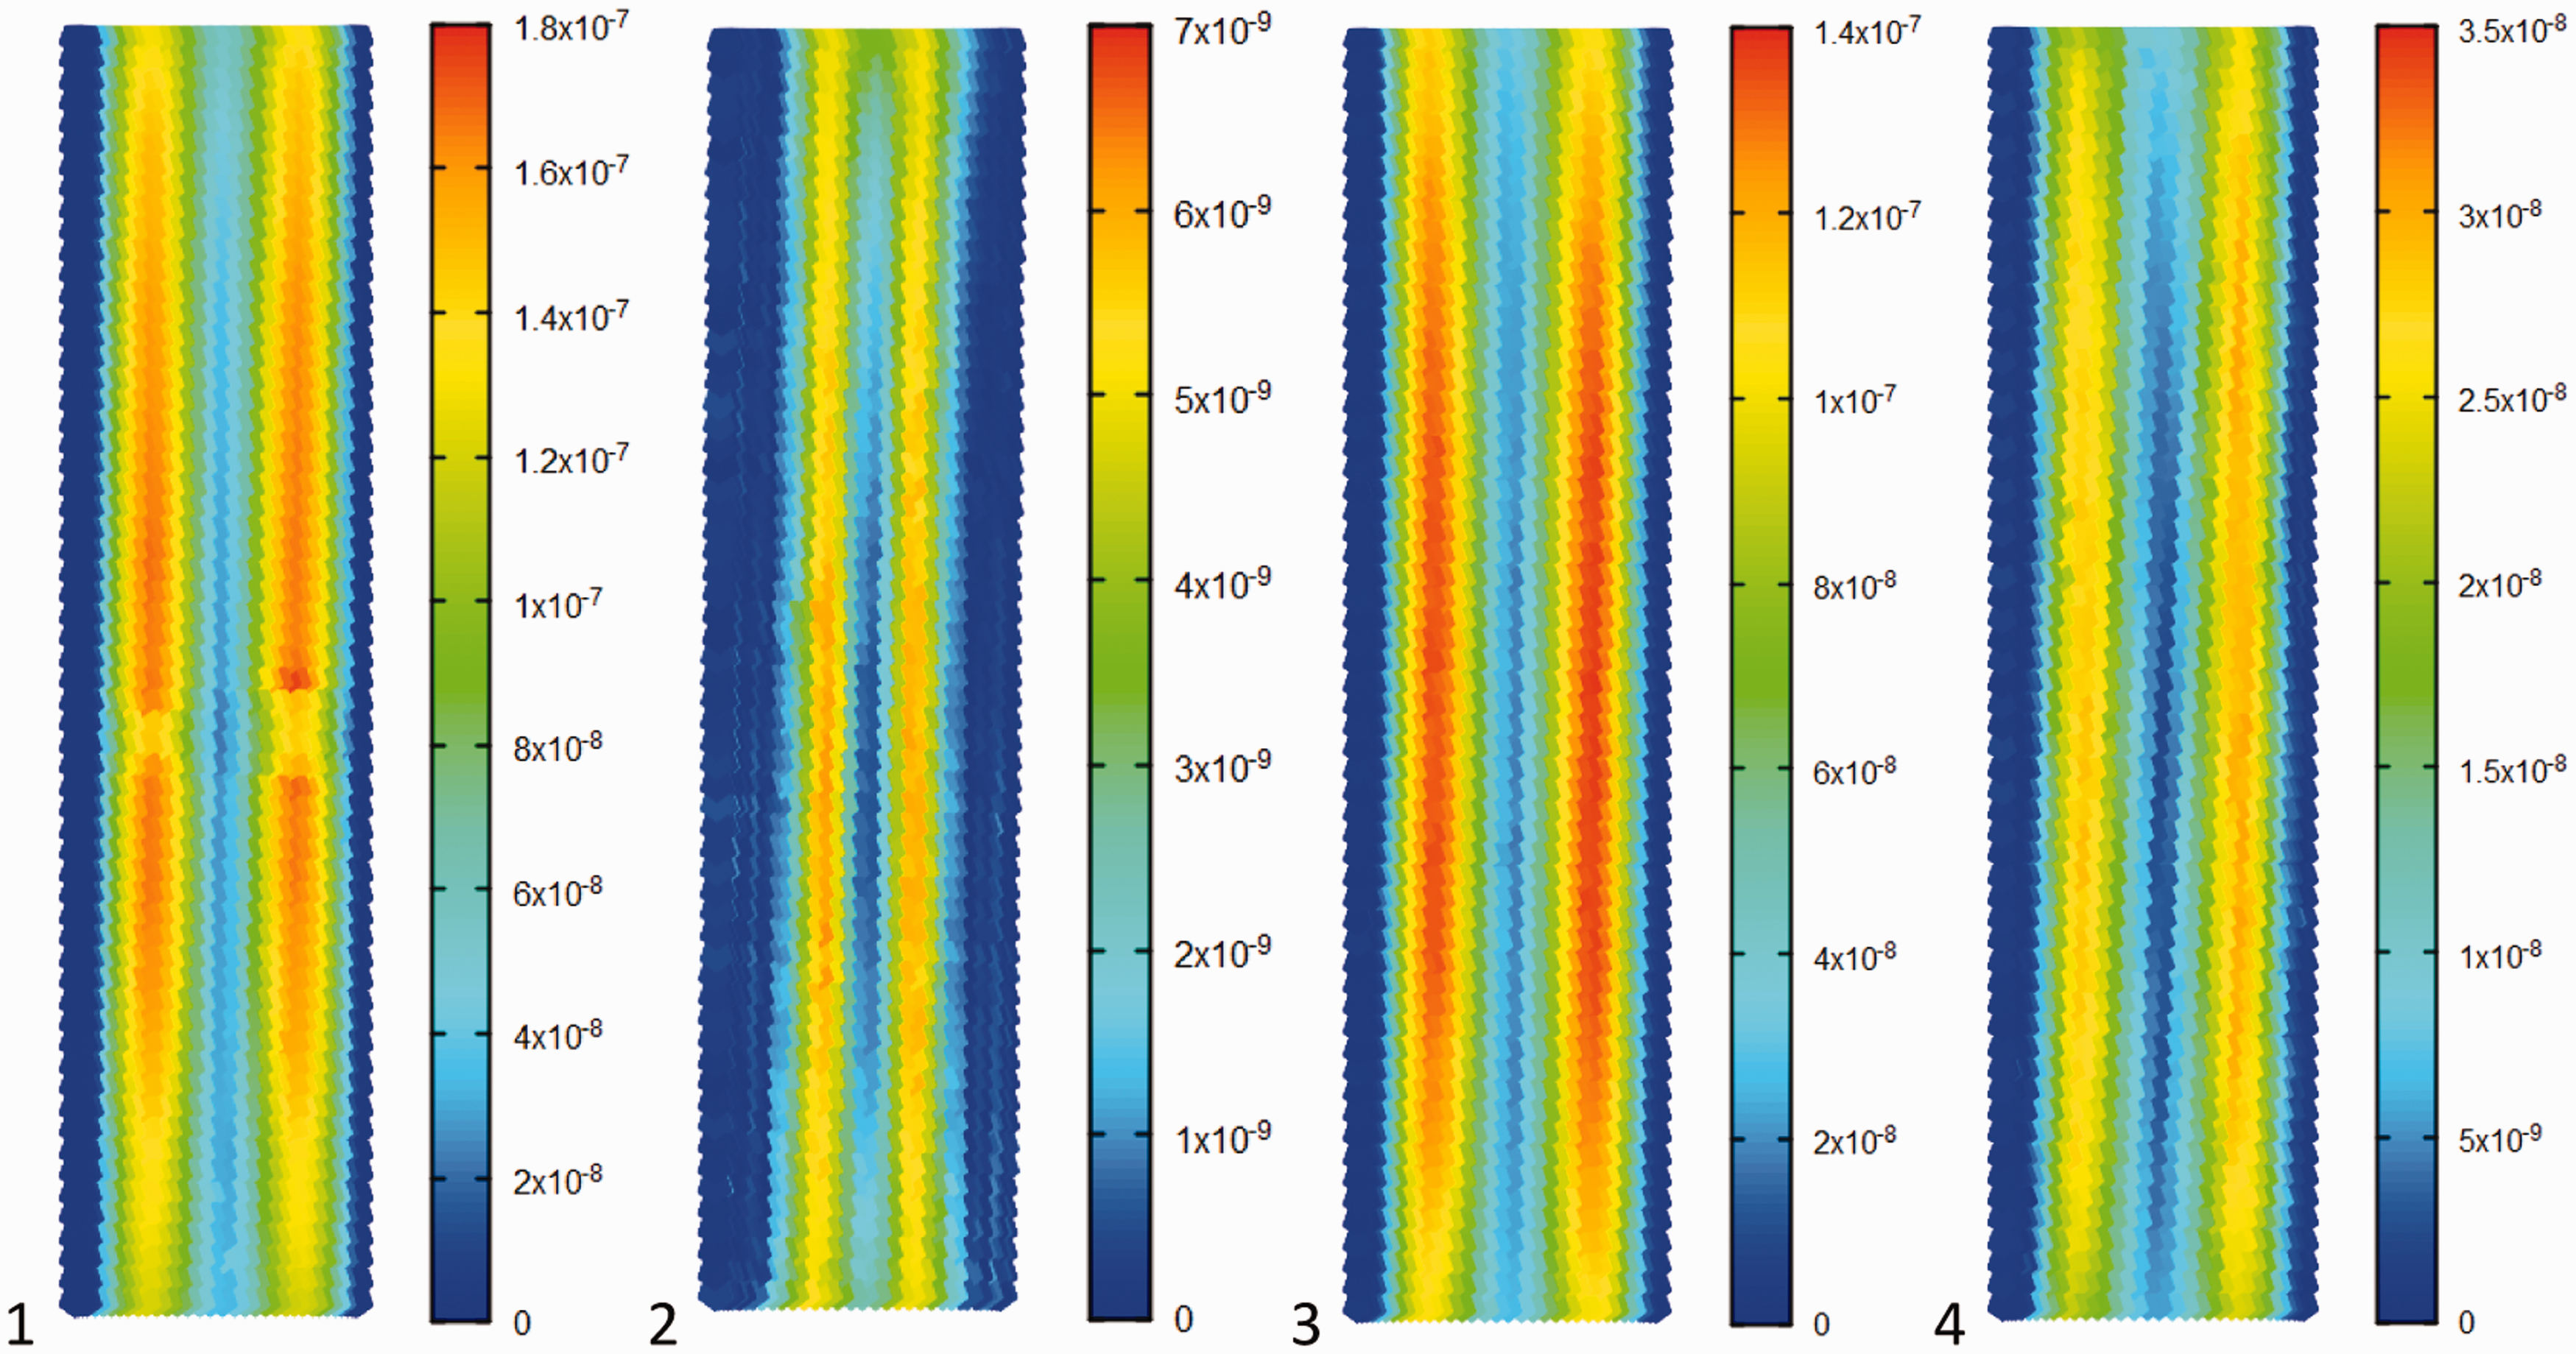
Gas-slurry multiphase flow
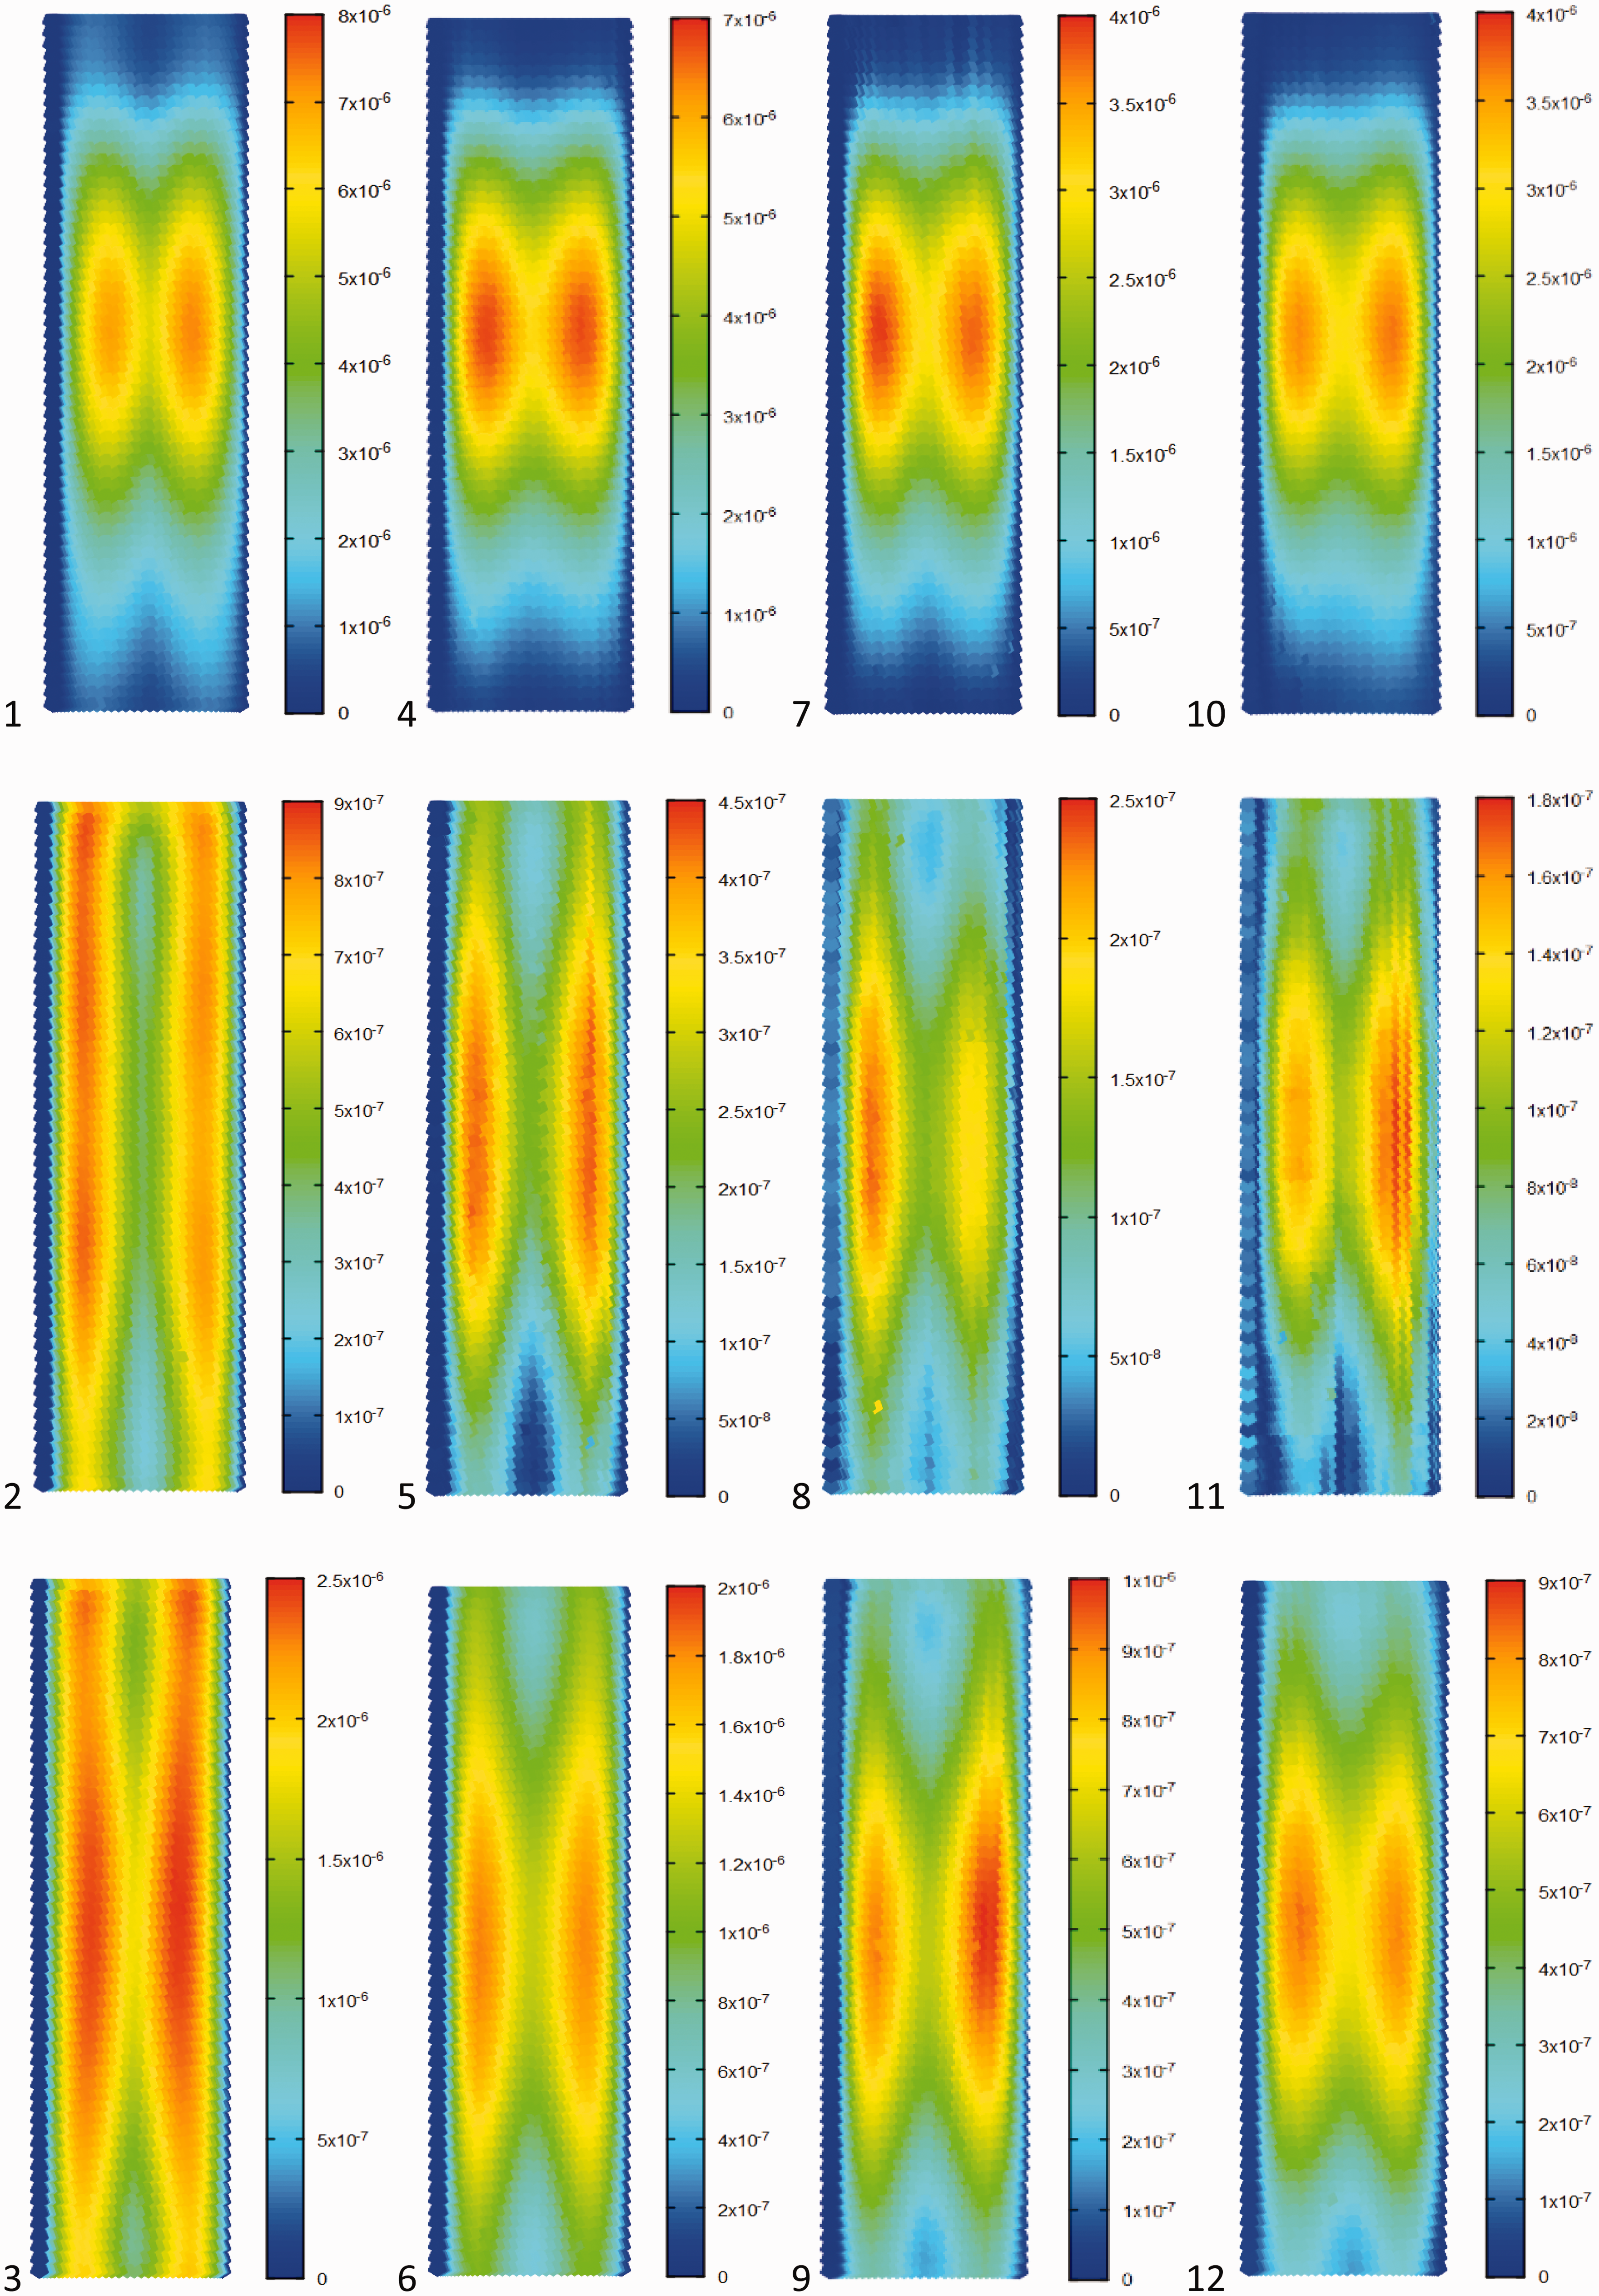
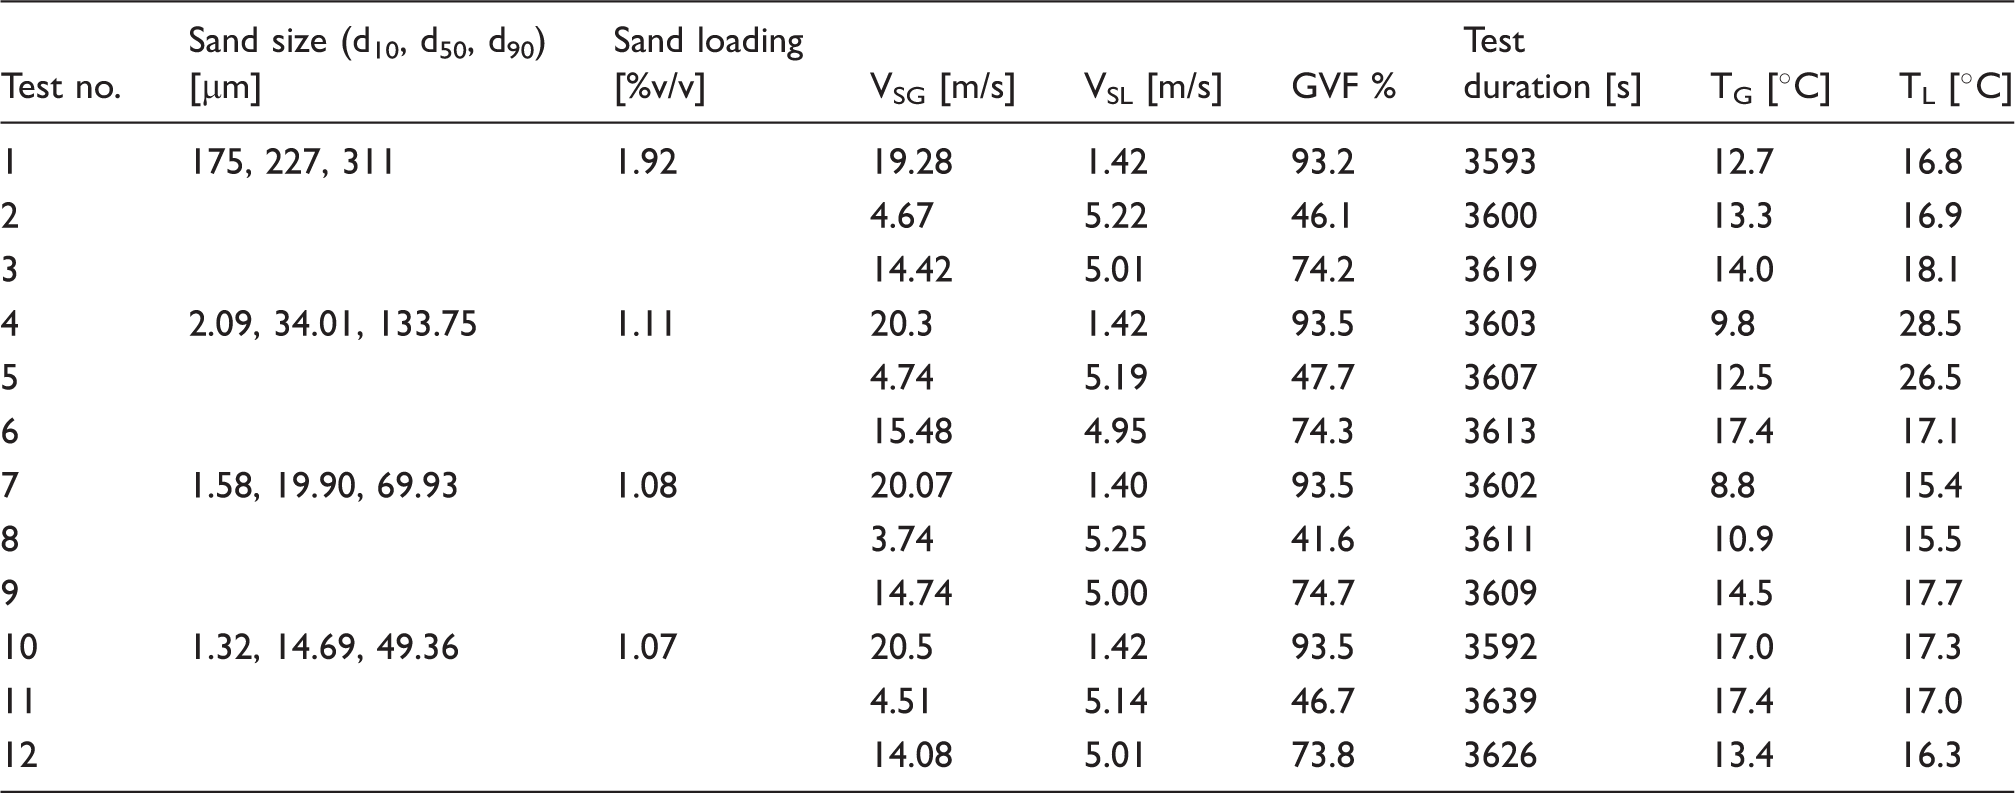
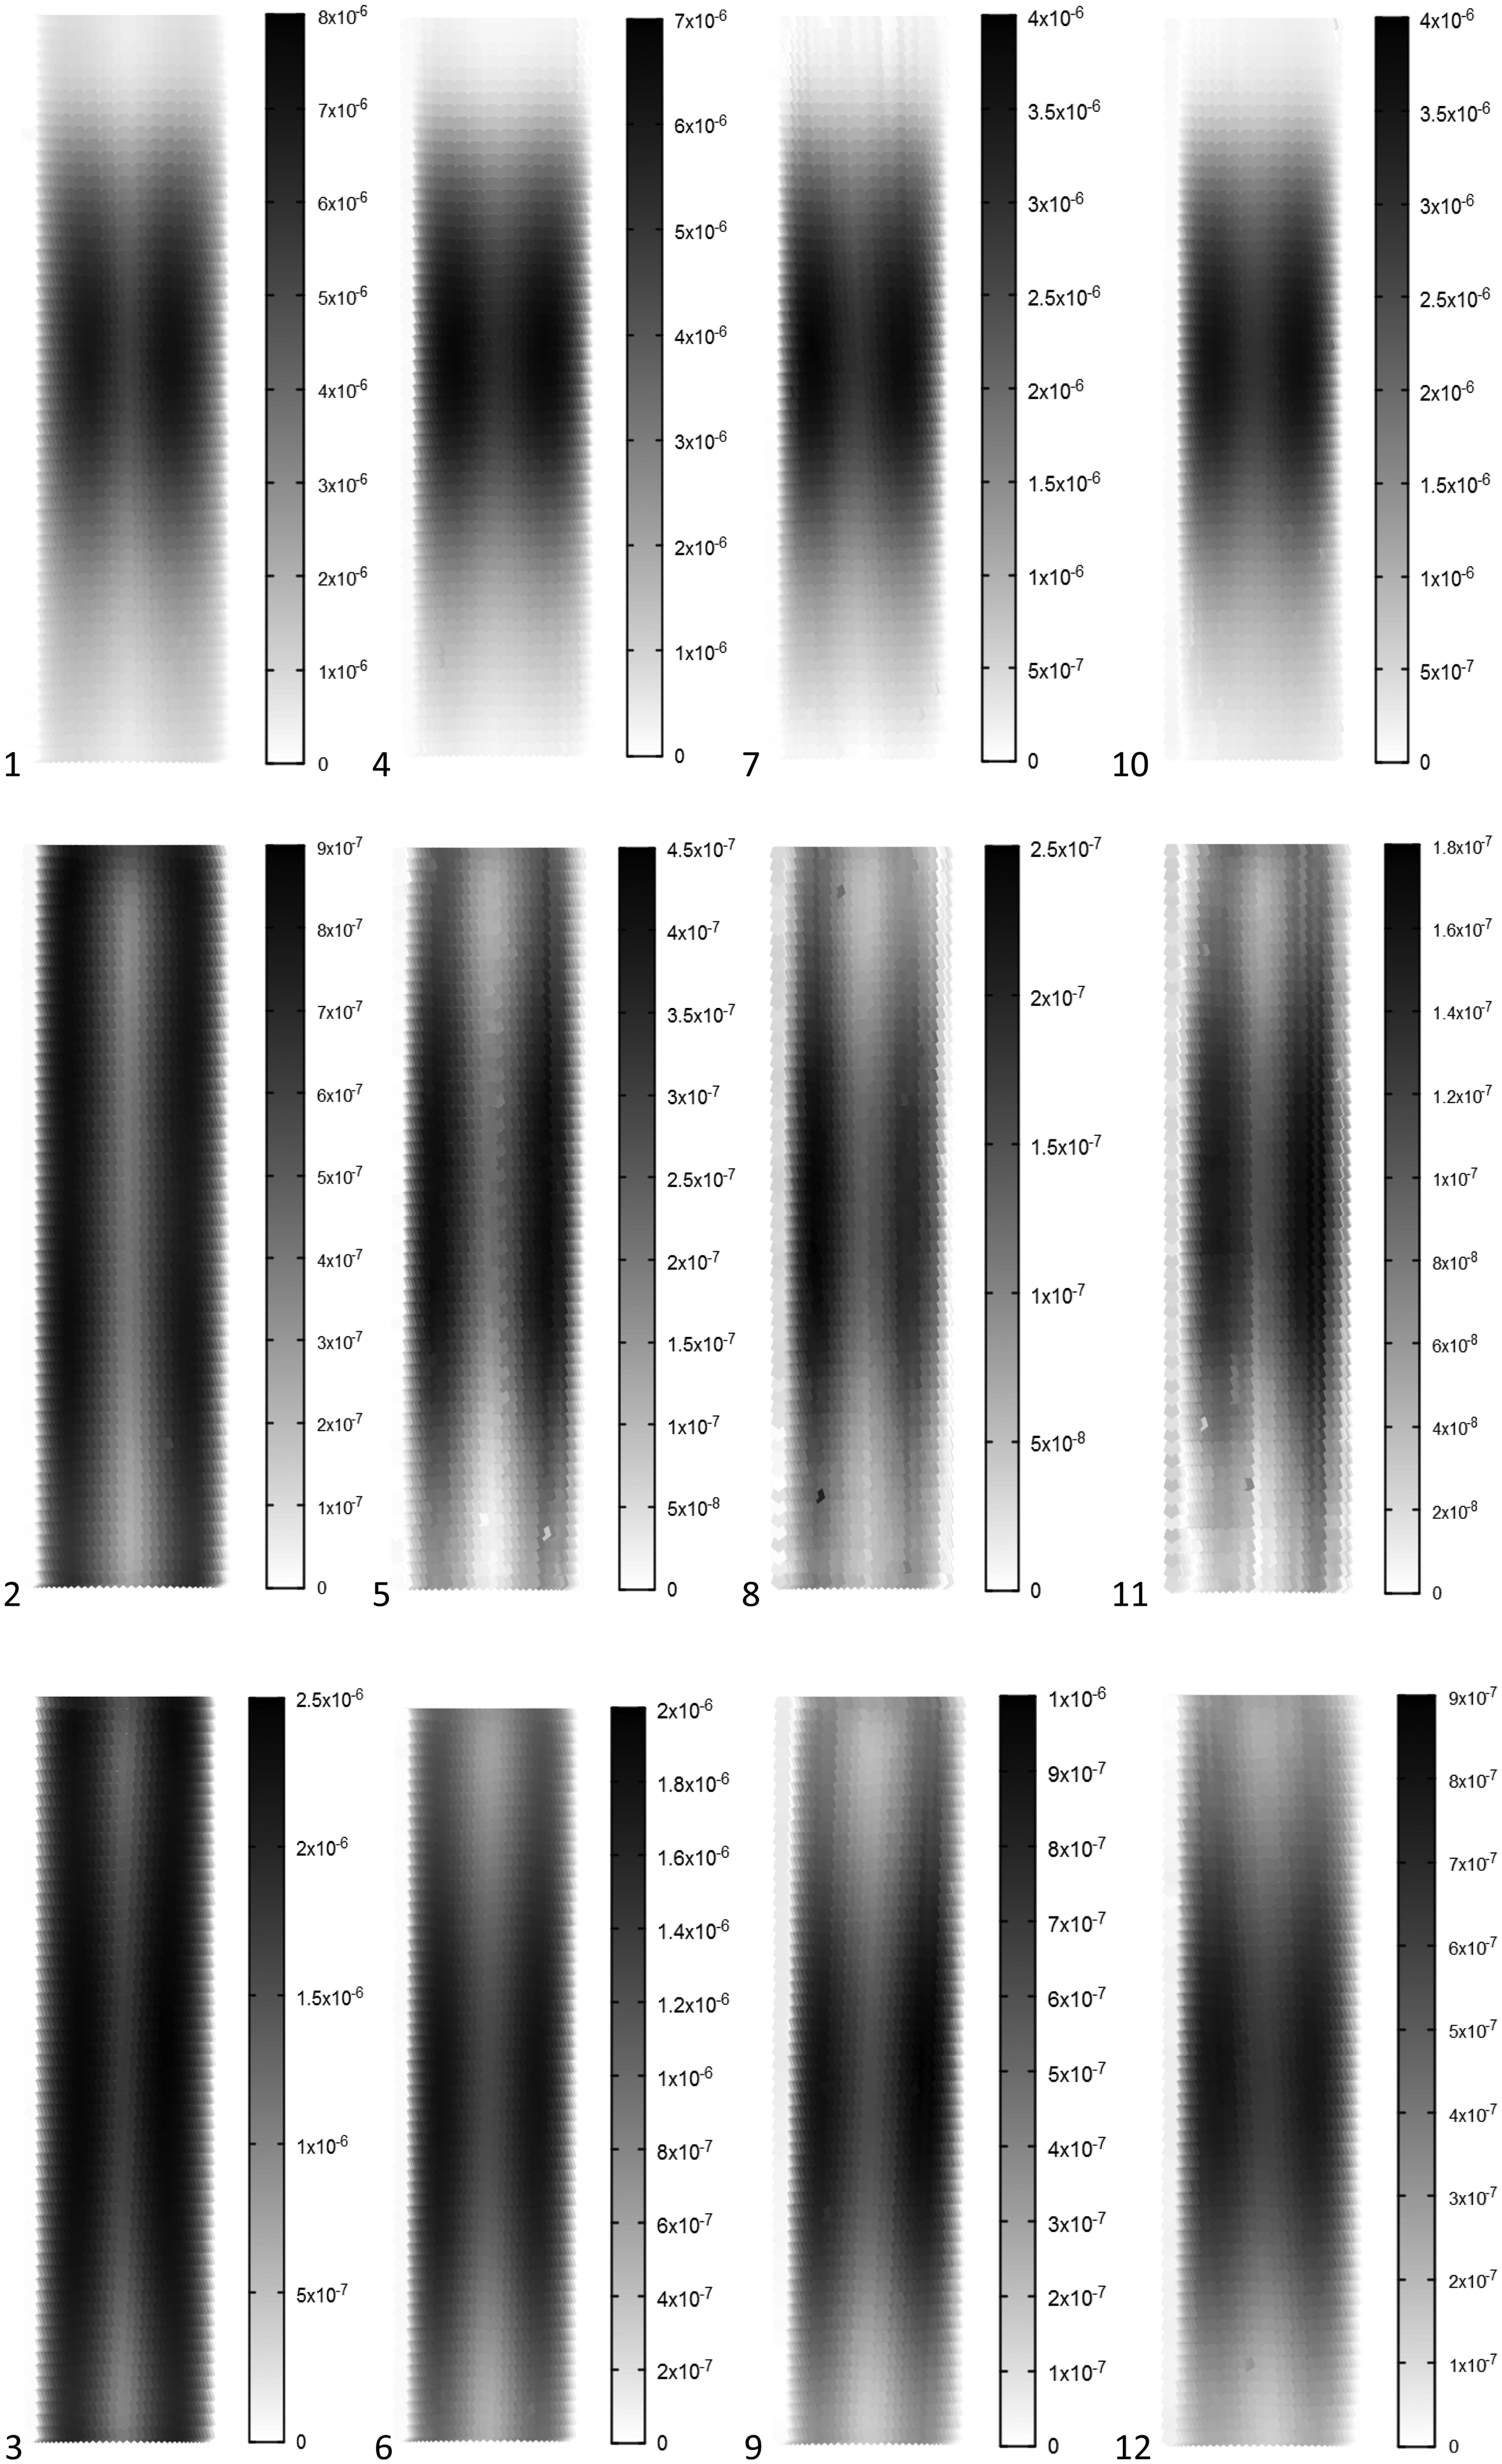
Erosion experiments were also conducted in the context of air/slurry multi-phase pipe flow. Figure 2 presents the measured specific erosion ratio on the exposed face of the target. By varying the gas/liquid ratio, bubbly, slug and annular multi-phase regimes were visited. For each regime, the slurry was loaded with sands of different size such that particle diameter effect could be investigated. Figure 2 is organised such that each rank corresponds to a given flow regime with decreasing particle size from left to right.
Slurry as well as multi-phase flow experiments reveal a consistent phenomenon. As the Stokes number decreases, either through reduction of particle size or carrier velocity (everything else remaining equal), the erosion damage focuses towards the stagnation point of the cylinder, around the mid-point of its front face.
Rationale
All these experimental observations cannot be easily explained by the general understanding of the fluid effect based on average carrier streamlines. This fluid effect is rather interpreted as scattering fines and impacts on the contrary. This fact warrants a thorough investigation of the phenomenon. Beyond the scientific novelty, the practical impact of such exotic erosion wear on expensive and sensitive facilities like deep-water completions is of importance. These are instances where transported sand size (and therefore Stokes number) is typically limited by retention systems 14 and are primarily made of flows in pipe sections. They are typical candidates to exhibit this type of wear. We endeavour to develop a first understanding of this phenomenon in particle/single phase flow.
Objective
The present study aims at exploring the turbulence impact on the transport of fines by a carrier fluid that can contribute to their focus towards the centre of a cross-flow cylinder in a straight pipe. The goal is to exemplify the potential of turbulence-induced particle diffusion to cause erosion damage in standard piping configurations.
Scope
This contribution addresses a generic set-up to emphasise the phenomenon. A straight circular pipe conveying a particle flow homogeneously prepared is considered. The target is a cross-flow cylinder made of aluminium, located at a distance from the inlet point allowing progressive establishment of the flow. Series of CFD simulations are carried out for a parametric sensitivity study. Particles and fluid properties are varied to cover a range of behaviours in the particles transport mode in order to explore the effects of turbulence. This simulation matrix does not attempt to contain the experimental cases introduced in the above section ‘The empirical evidence’. It is primarily designed to qualitatively emphasise a plausible yet unfamiliar root cause of the phenomenon. These turbulence dispersion effects on particles are assessed using the predicted erosion distribution on the target and the trajectory patterns of the particles.
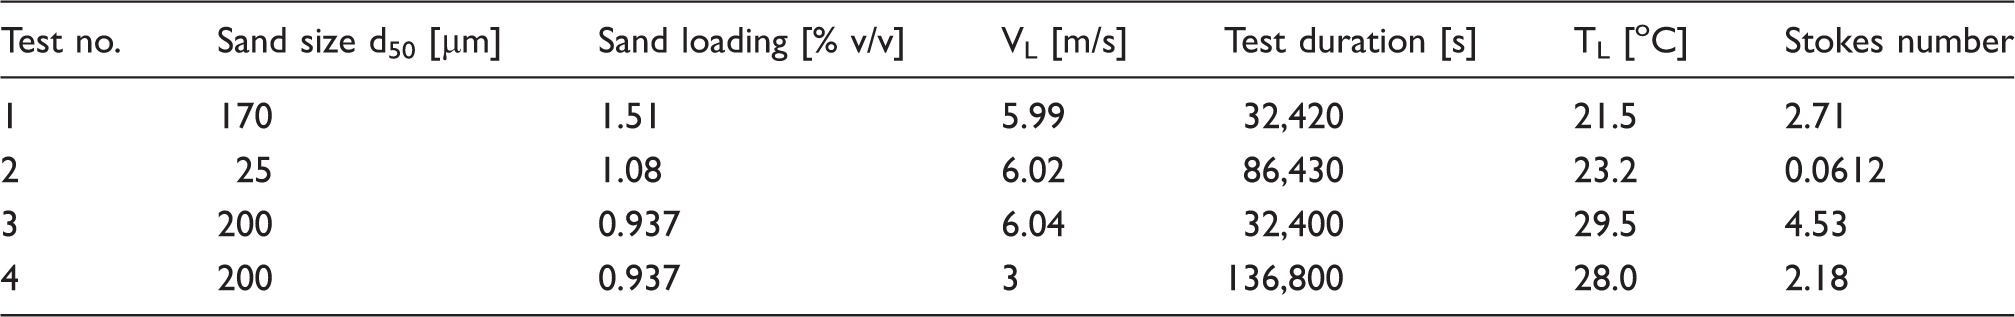
Slurry erosion experimental matrix. Refer to Notation section for symbol definition.
Multiphase erosion experimental matrix. Refer to Notation section for symbol definition.
Sub-set of key references.
Overview
The configuration investigated and the set-up of the simulations are firstly presented. A detailed analysis of the interactions imposed by the carrier on the dispersed phase is subsequently performed. By varying the fluid and particle properties, a range of Stokes numbers are reached where particles are not only sensitive to the average flow but also to the carrier turbulence. The latter is then able to organise and concentrate the trajectories and therefore the erosion location and intensity.
Method
Configuration
A numerical erosion pipe rig was made of a straight pipe 52.6 mm in diameter. The erosion target was a cross-flow cylinder, 10 mm in diameter. The cross-flow cylinder was positioned about 40 pipe diameters downstream of the inlet. Figure 4 provides a sketch of the geometry simulated.
Schematic of the pipe rig. Flow and particles are injected from the bottom. Inset: details of the rig pipe test section hosting the cross-flow cylinder target.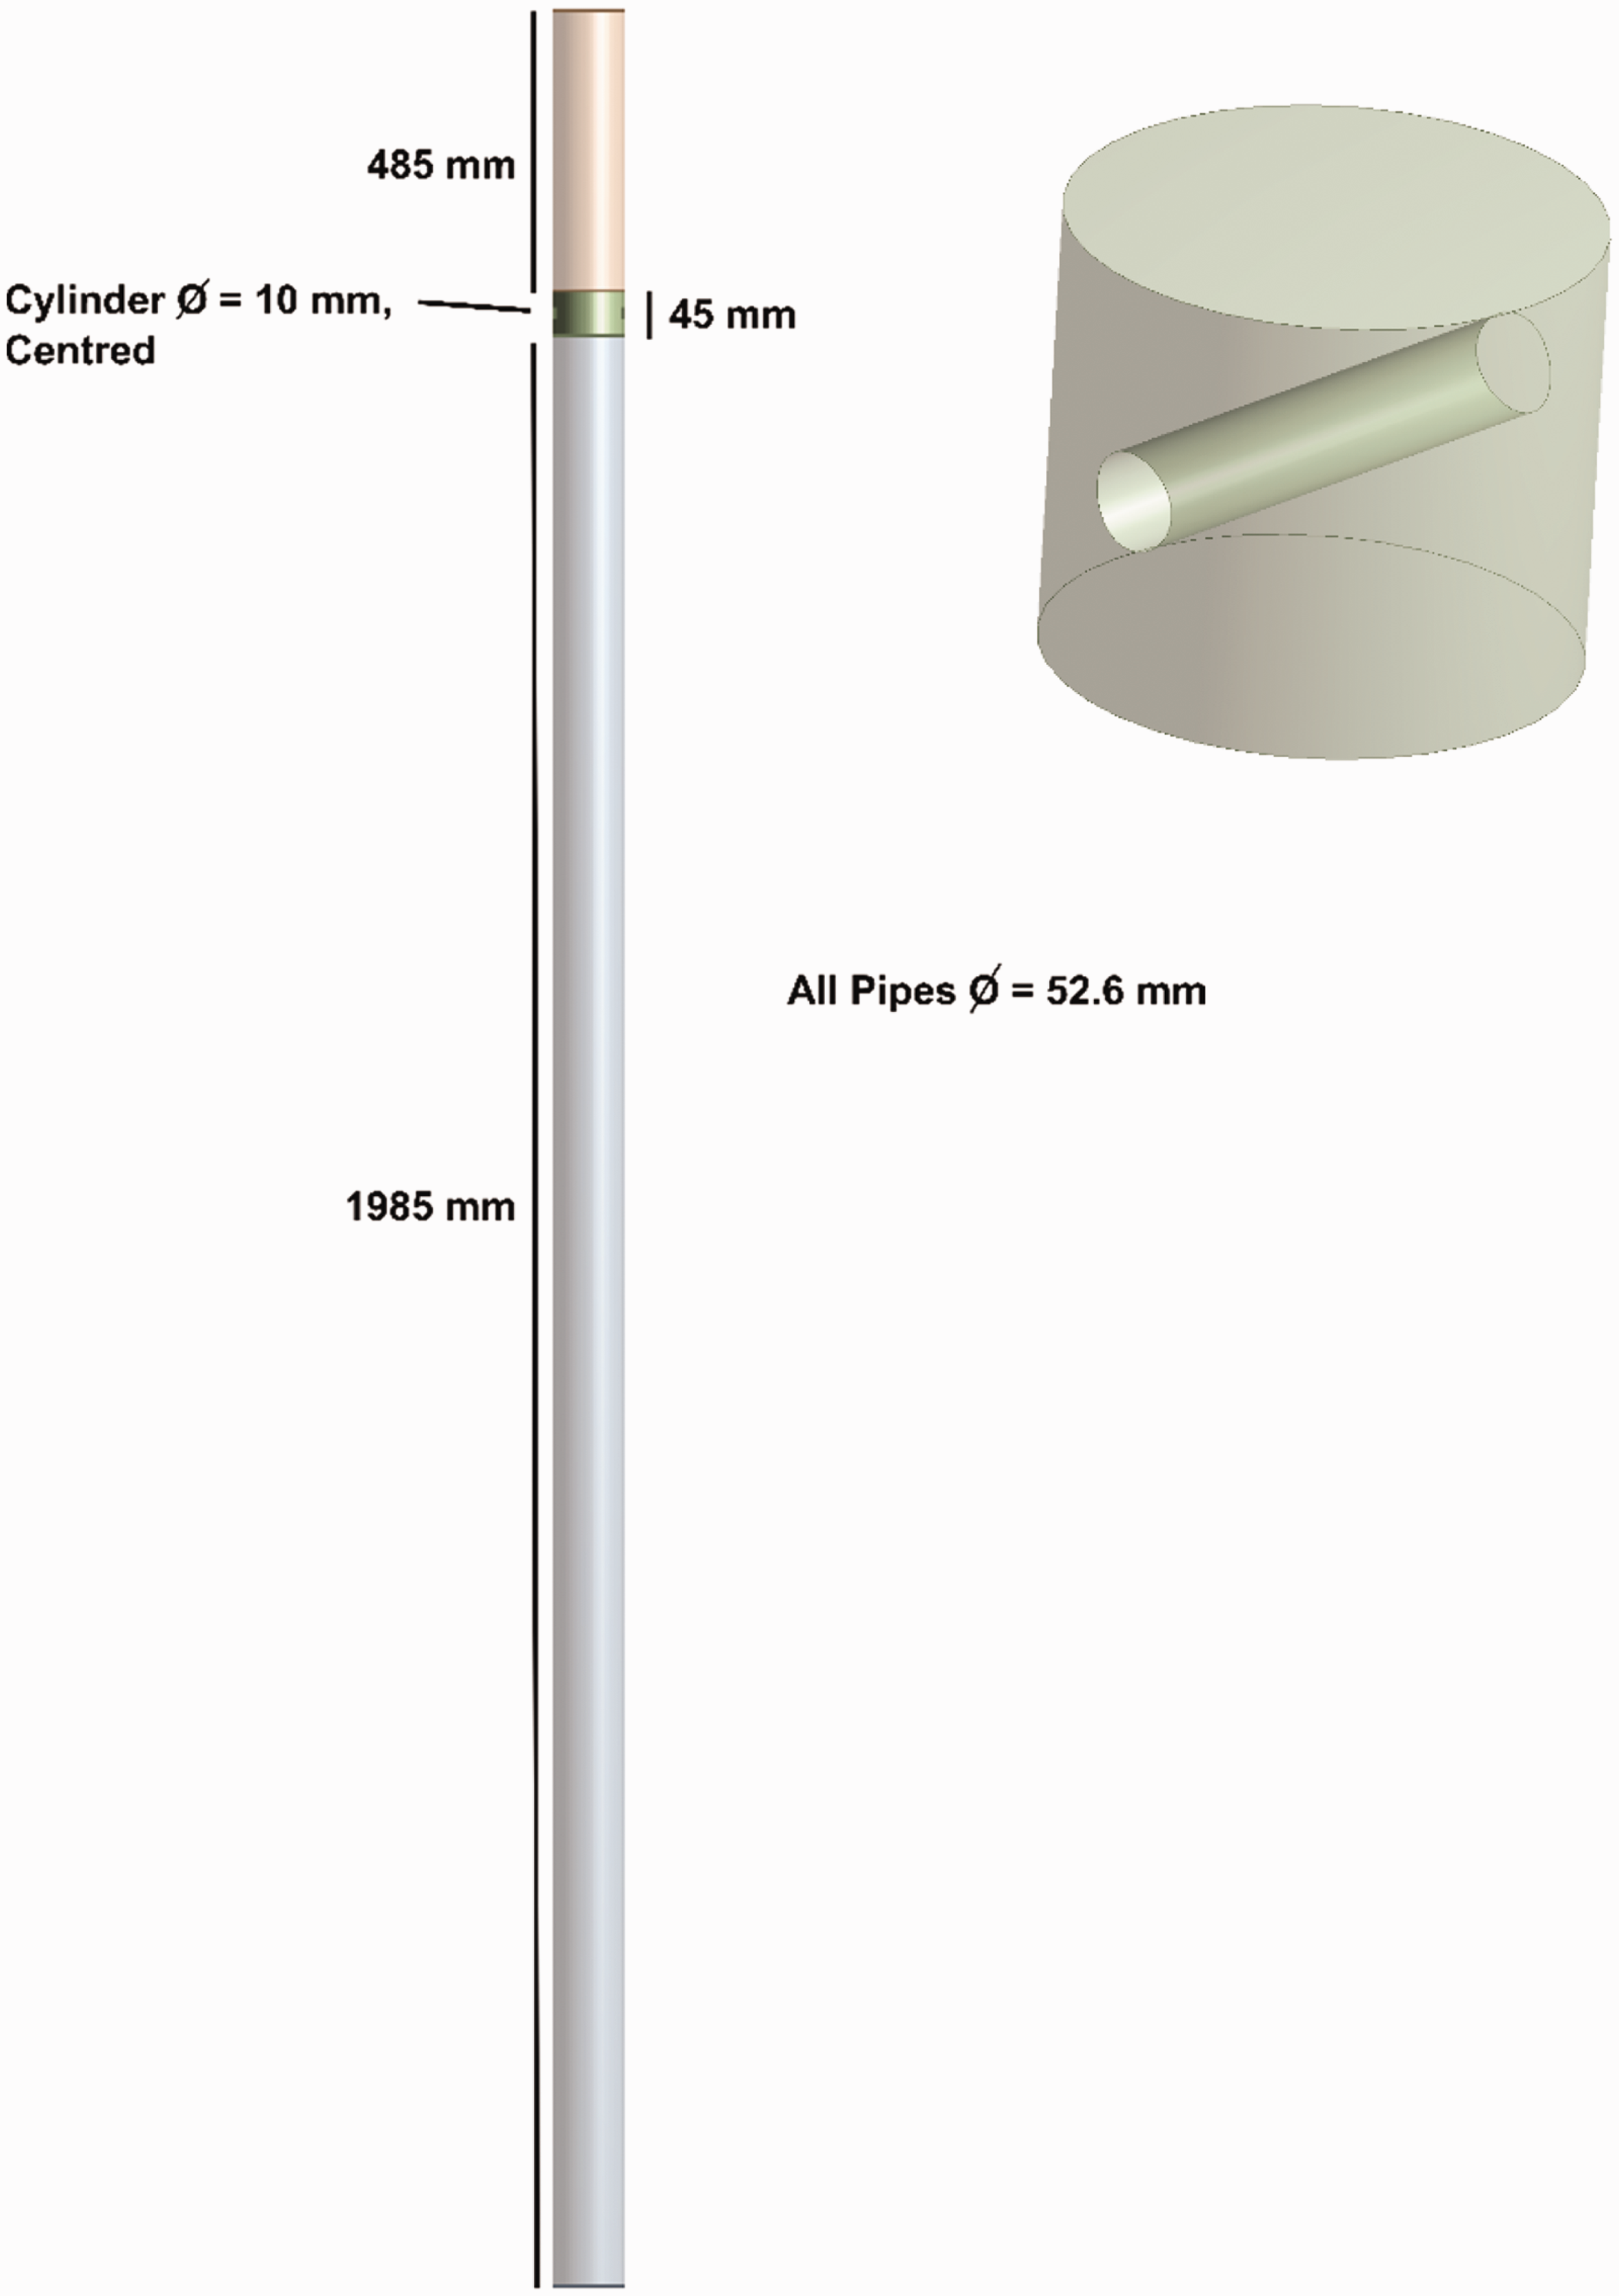
Simulations allowing for variation in bulk flow velocities, fluid properties and particle diameters were explored to cover a range of Stokes numbers and associated behaviours.
Mesh
The flow domain mesh was comprised of structured, unstructured and prismatic regions to capture the salient flow features with optimised computational efficiency and accuracy. Skewness was below 0.7 and orthogonality larger than 0.5. The mesh independency was assessed based on the pressure drop across the rig. The final mesh size selected had a Grid Convergence Index
15
<10% and a pressure drop value differing from its Richardson extrapolation by less than 10%. Near wall regions were appropriately solved with a y+ interval mostly comprised between 20 and 200 and a peak of eddy viscosity away from any wall by a minimum of five mesh elements. The mesh was carefully refined in the vicinity of the target to accurately resolve the carrier flow features driving the particles and erosion field. As the fluid effect investigated acts on scales comparable to the cross-flow cylinder diameter, the refinement of the mesh near the target did not need to fully resolve the boundary layer though. The mesh structure is detailed in Figure 5.
Mesh structure.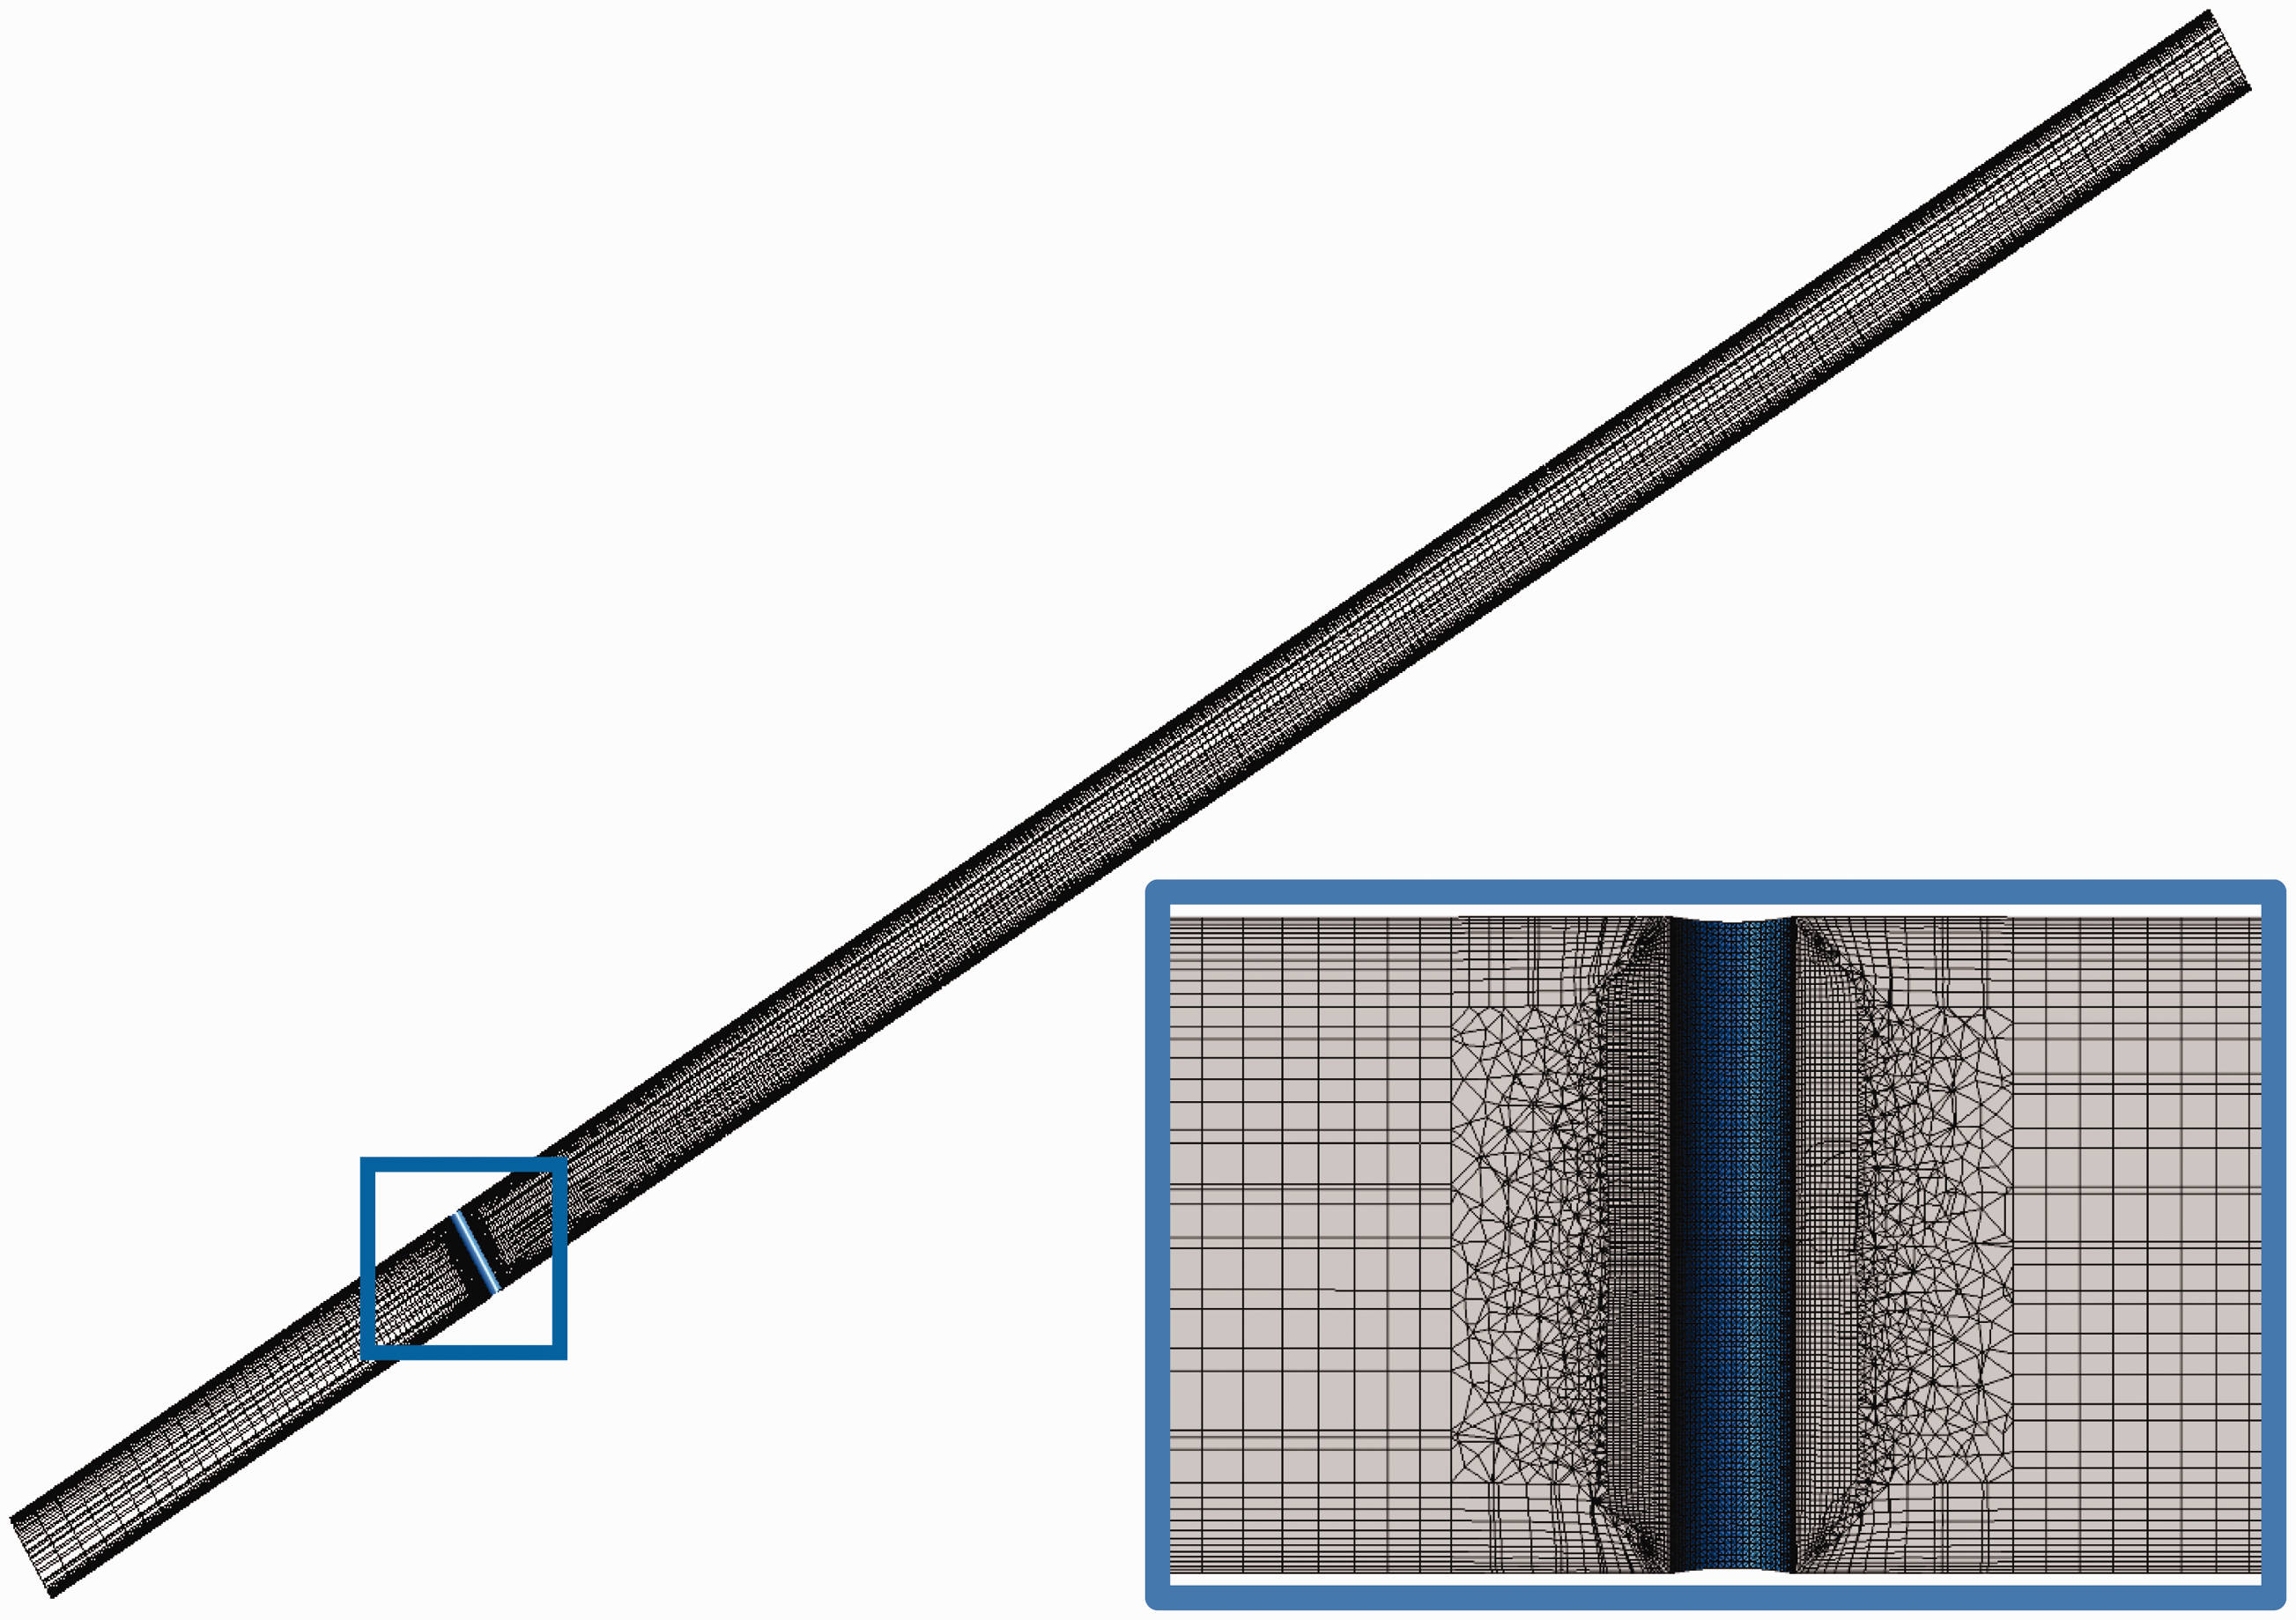
Simulations
The simulations were carried out in double precision using version 15 of ANSYS-CFX and the ANSYS Workbench tools for pre- and post-processing. The SST turbulence model with curvature correction was selected to provide turbulence closure. The flexibility and accuracy of the SST model to solve near wall regions was deemed necessary given the internal flow with bluff-body configuration. Particles were tracked as Lagrangian spherical parcels. They interacted with the fluid through Schiller–Naumann drag, turbulent dispersion (except when explicitly disabled), virtual-mass, and pressure gradient forces. The inlet was of the Dirichlet type with a velocity prescribed as a ‘1/7’ turbulent profile. 16 Particles were injected in equilibrium with the flow and uniformly across the inlet face. The turbulence intensity and eddy viscosity ratio at the inlet were taken at 5% and 10, respectively. The walls were numerically smooth with a particle restitution factor of 0.8. 17 The outlet was of Neumann type. All transport equations were solved with second-order accurate schemes.
The carrier flow was converged first. Particles were injected as a post-processing step to perform erosion prediction calculation. The erosion distribution on the target surface was predicted by a CSIRO in-house model fed with the particle impact characteristics. The details about the model and its development are reported in Wong et al. 18 Validation evidences of this simulation approach are found in Wong et al. 7
The iteration convergence was checked. A residual tolerance reduction of one order of magnitude did not significantly change the pressure drop across the rig. Conservation imbalances, including the parcels flux, were checked as virtually nil. Lagrangian solver statistical independency was reached using one million parcels released and with ten integration steps per cell element.
These CFD and mesh quality tests were performed on representative cases of the carrier/dispersed properties matrix visited.
Output
Different combinations of dispersed size, carrier bulk velocity, viscosity, and density were investigated in order to visit a wide range of drag imposed to particles and therefore of Stokes behaviour. Erosion fields as predicted on the cross-flow cylinder and particle trajectories were analysed.
Results
In a vacuum experiment, particles travel ballistically. The angle of maximum erosion on the cylinder mid-line profile is therefore determined by the angular dependency to erosion material and the geometrical projection of the dispersed flux density. This angle is analytically found and chosen as reference for the following discussion. It is named Coordinate system chosen along the cross-flow cylinder mid-line.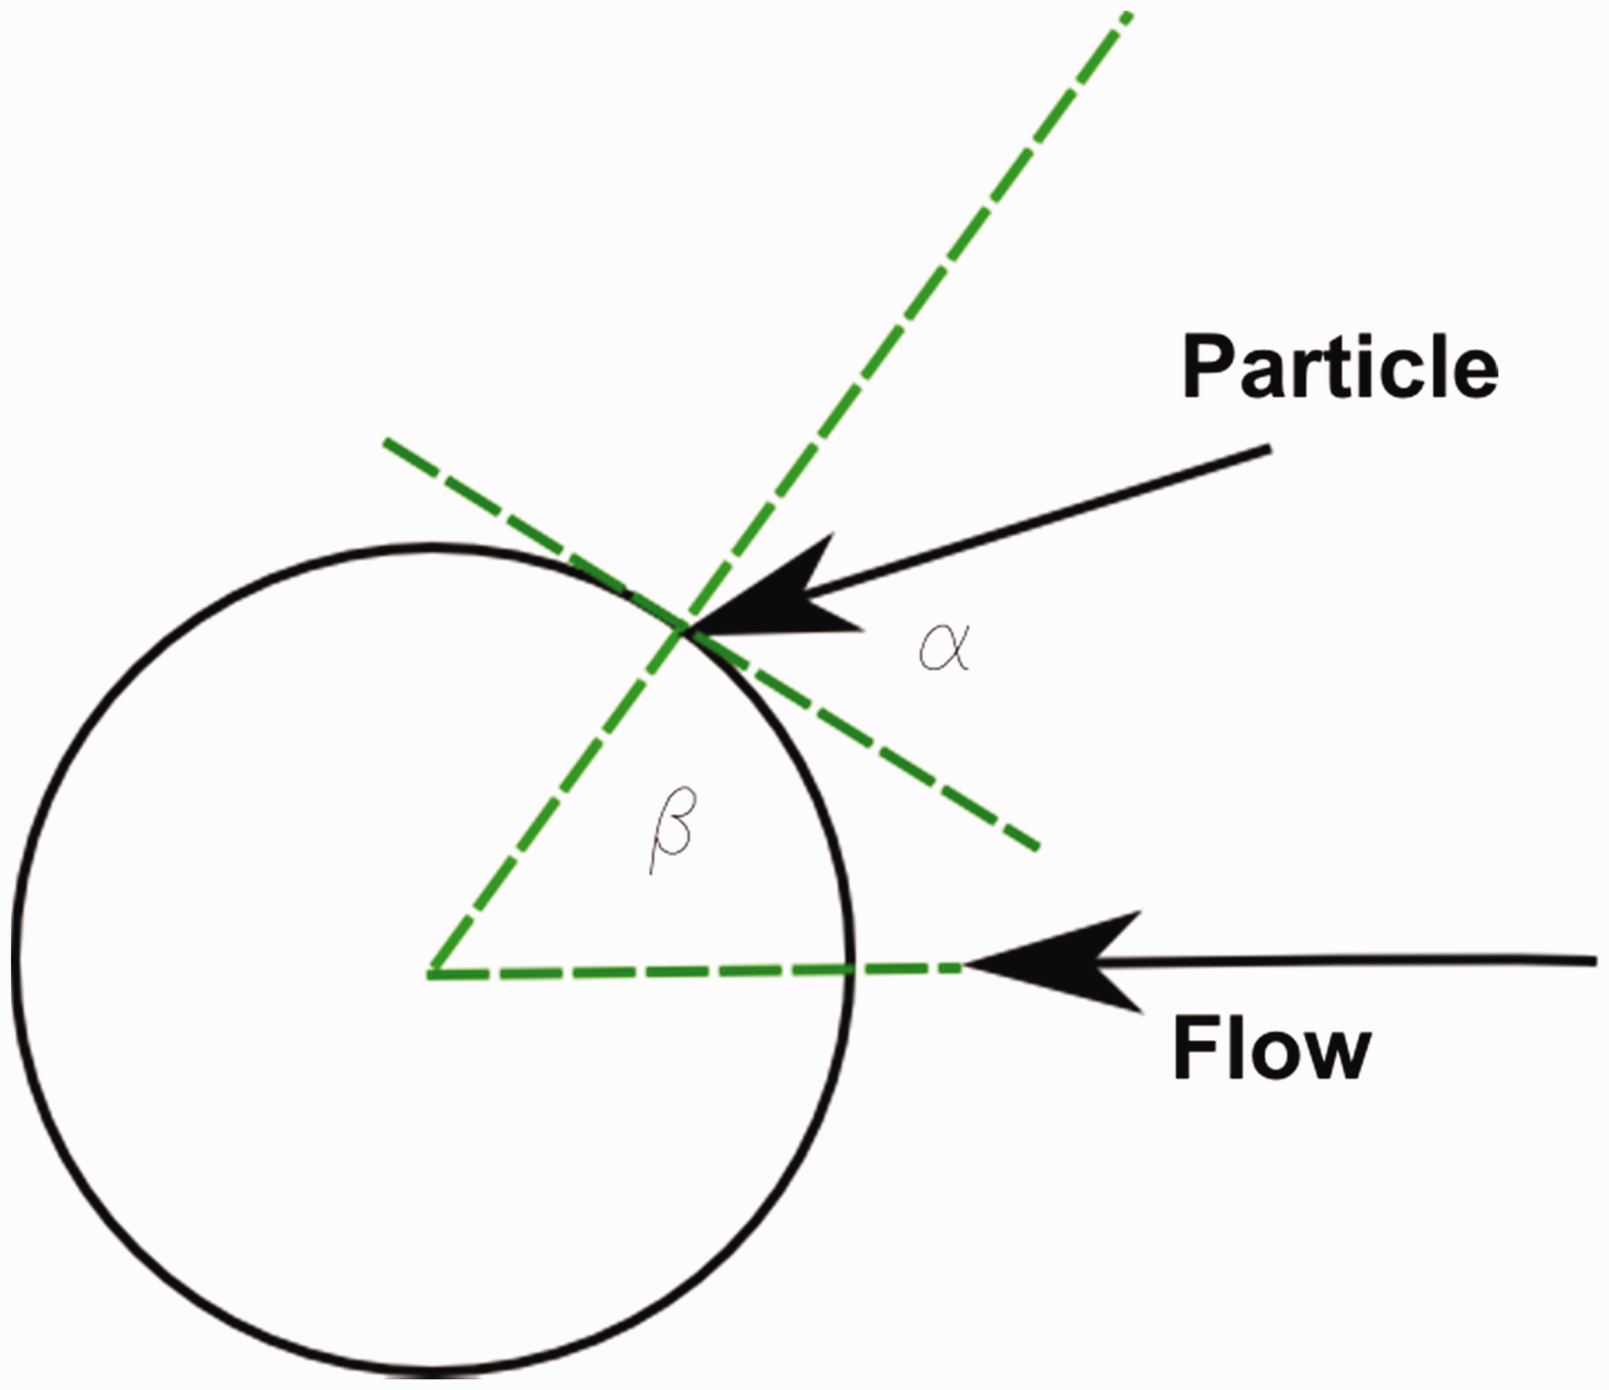
When particles are carried by a fluid, the inter-play with the average streamlines going around the cylinder – the fluid effect – may change the location of the maximum erosion on the mid-line profile. Δβ is defined as the difference in cylinder angle β between the location of maximum erosion observed for a given flow and
Figure 7(a) displays such angle shift for different cases of flow velocity, particle size and fluid properties translating into different Stokes numbers. The angle shift is observed as a non-monotonic function of the Stokes number. On the right end of Figure 7(a), Δβ is close to zero. This agrees with the fact that large-Stokes-number particles are insensitive to fluid drag and hence behave ballistically. Their impact characteristics are therefore identical to that of a vacuum experiment. With a decreasing Stokes number, Δβ drifts towards a positive value. This is the standard fluid effect. These particles are responsive to the average drag of the fluid as it goes around the bluff body and do not impact in line with their far-field trajectory but somewhat downstream. However, by further decreasing the Stokes number of the impacting particles, Δβ drops again and eventually becomes negative. This signifies that the corresponding impacts are happening closer to the centre of the target. This is consistent with the experimental facts reported earlier. Other interactions than the traditional fluid effect based on the drag of the average flow can only explain this. Figure 7(b) summarises these interpretations of the trends seen in the scatter of points of Figure 7(a).
(a) Angular shift Δβ of the maximum erosion location vs Stokes number. Particle/carrier density ratio = 53. (b) Interpretation of the trends.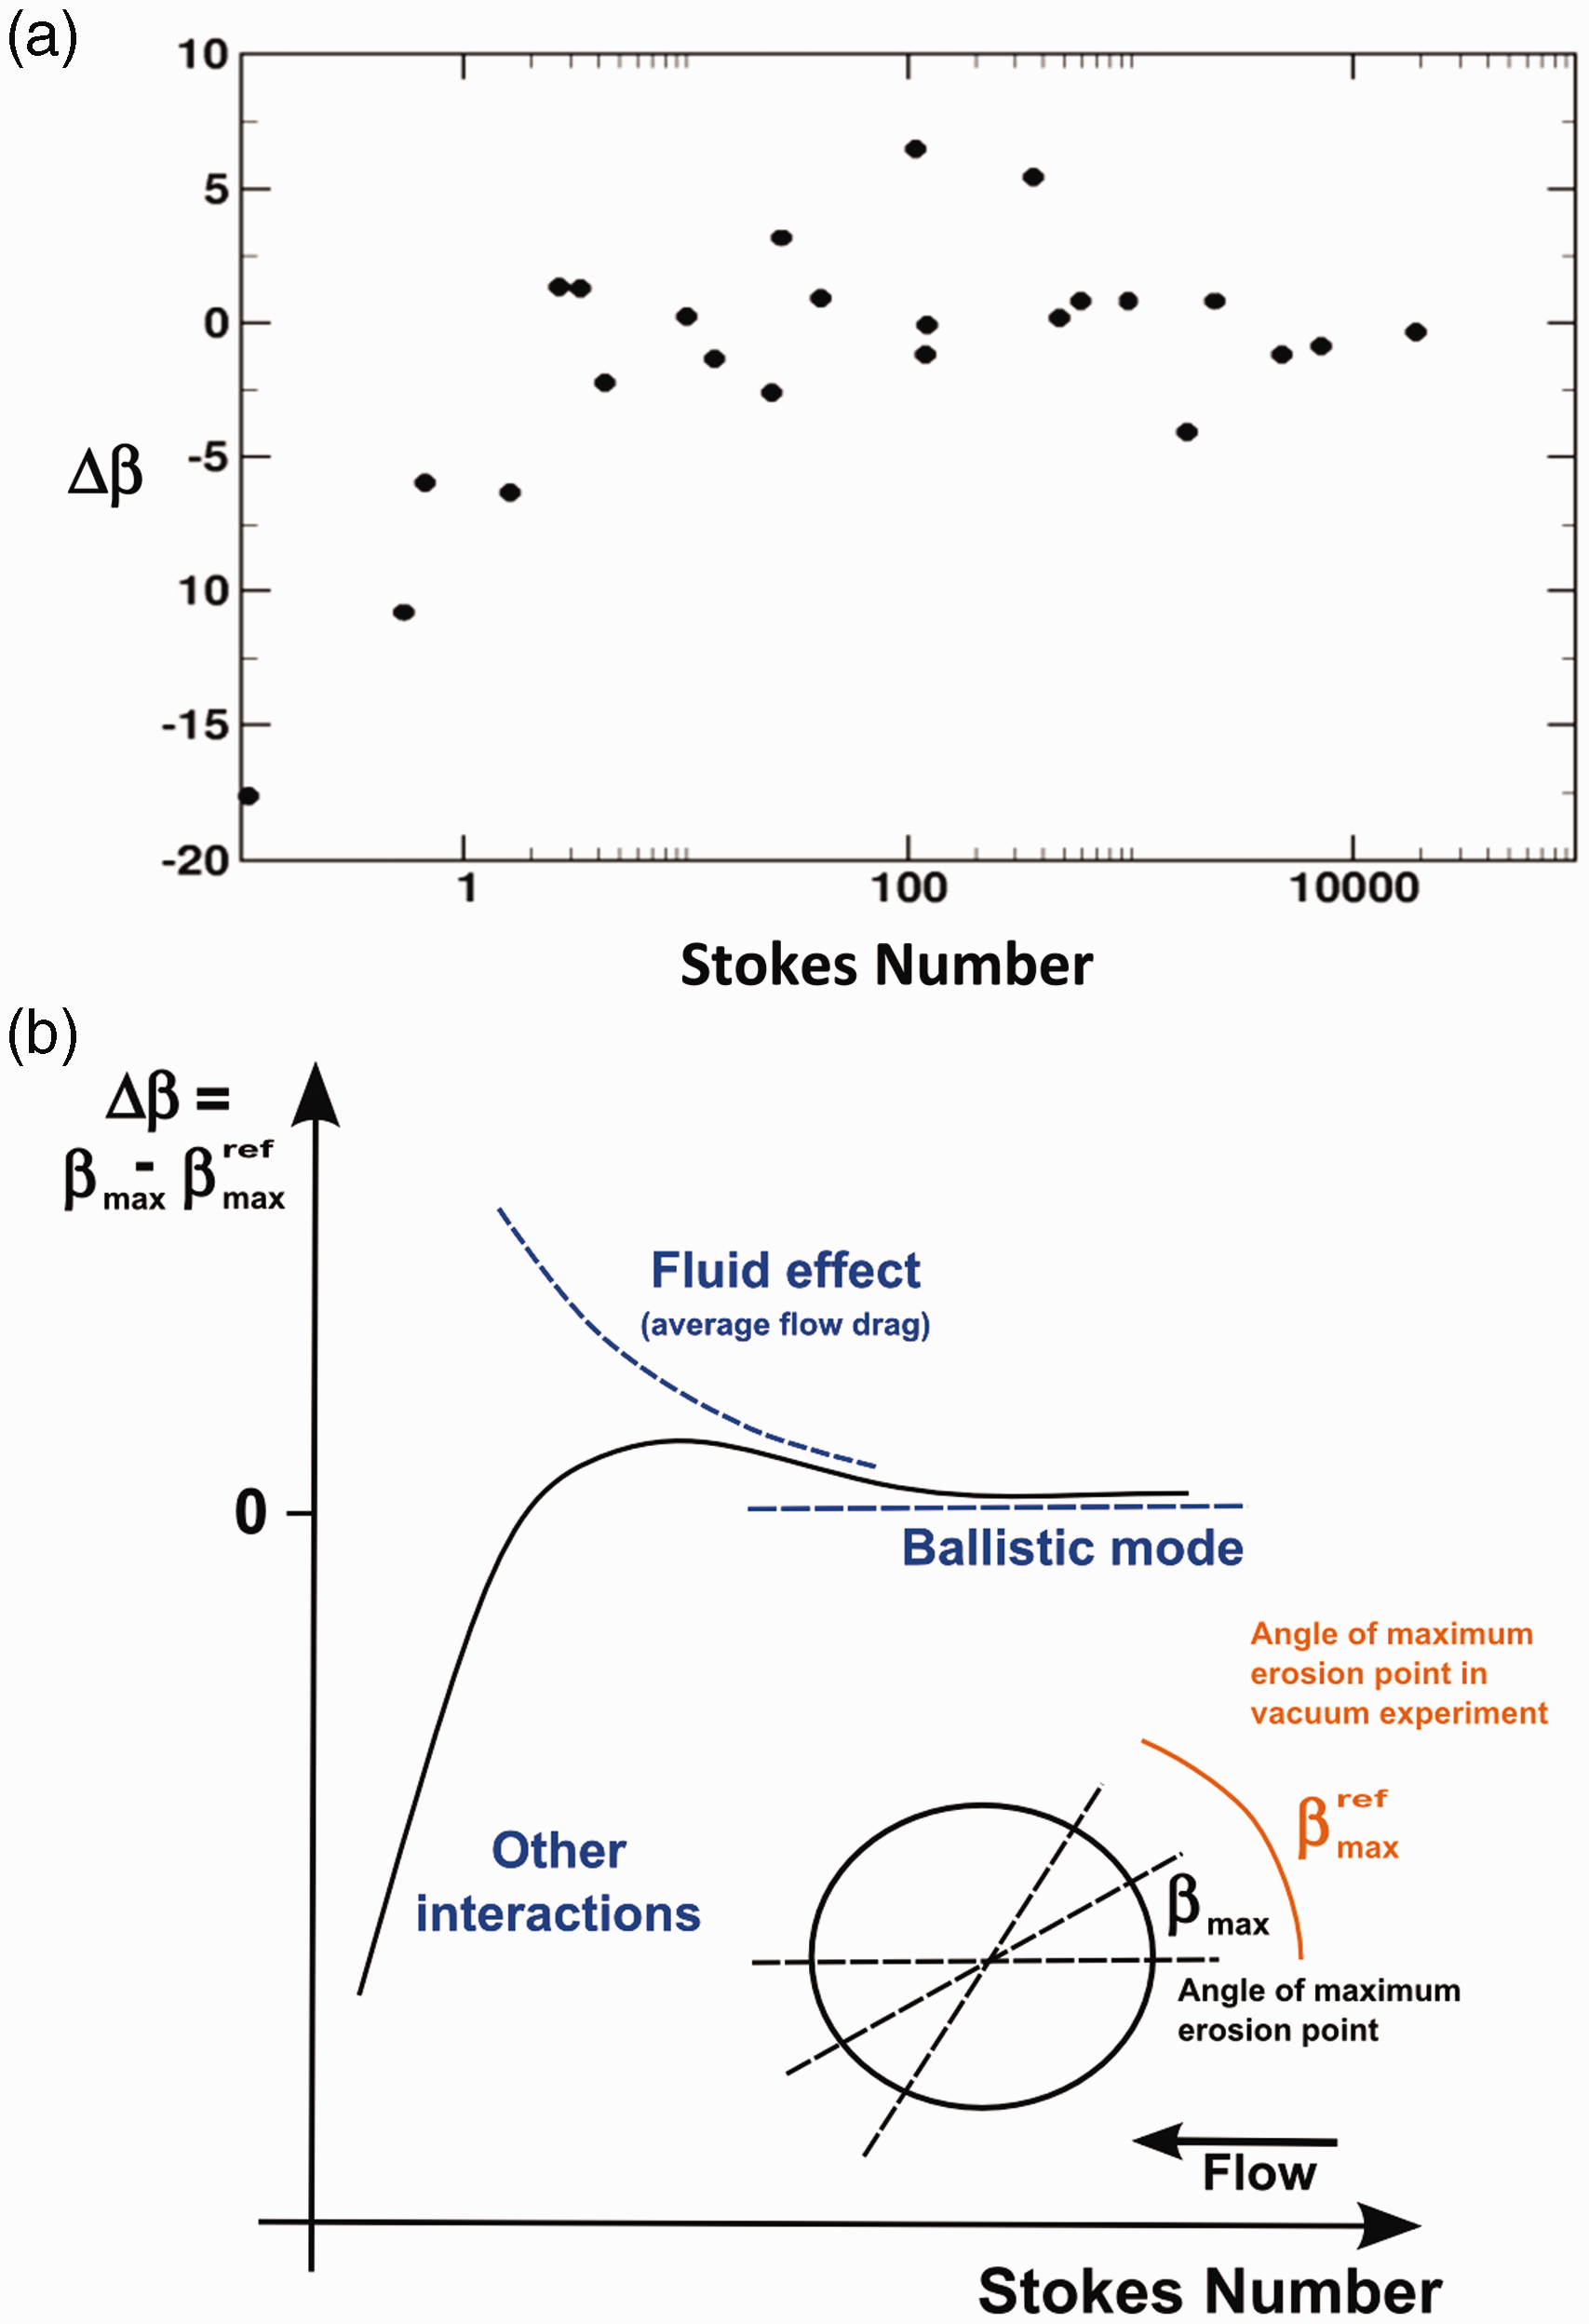
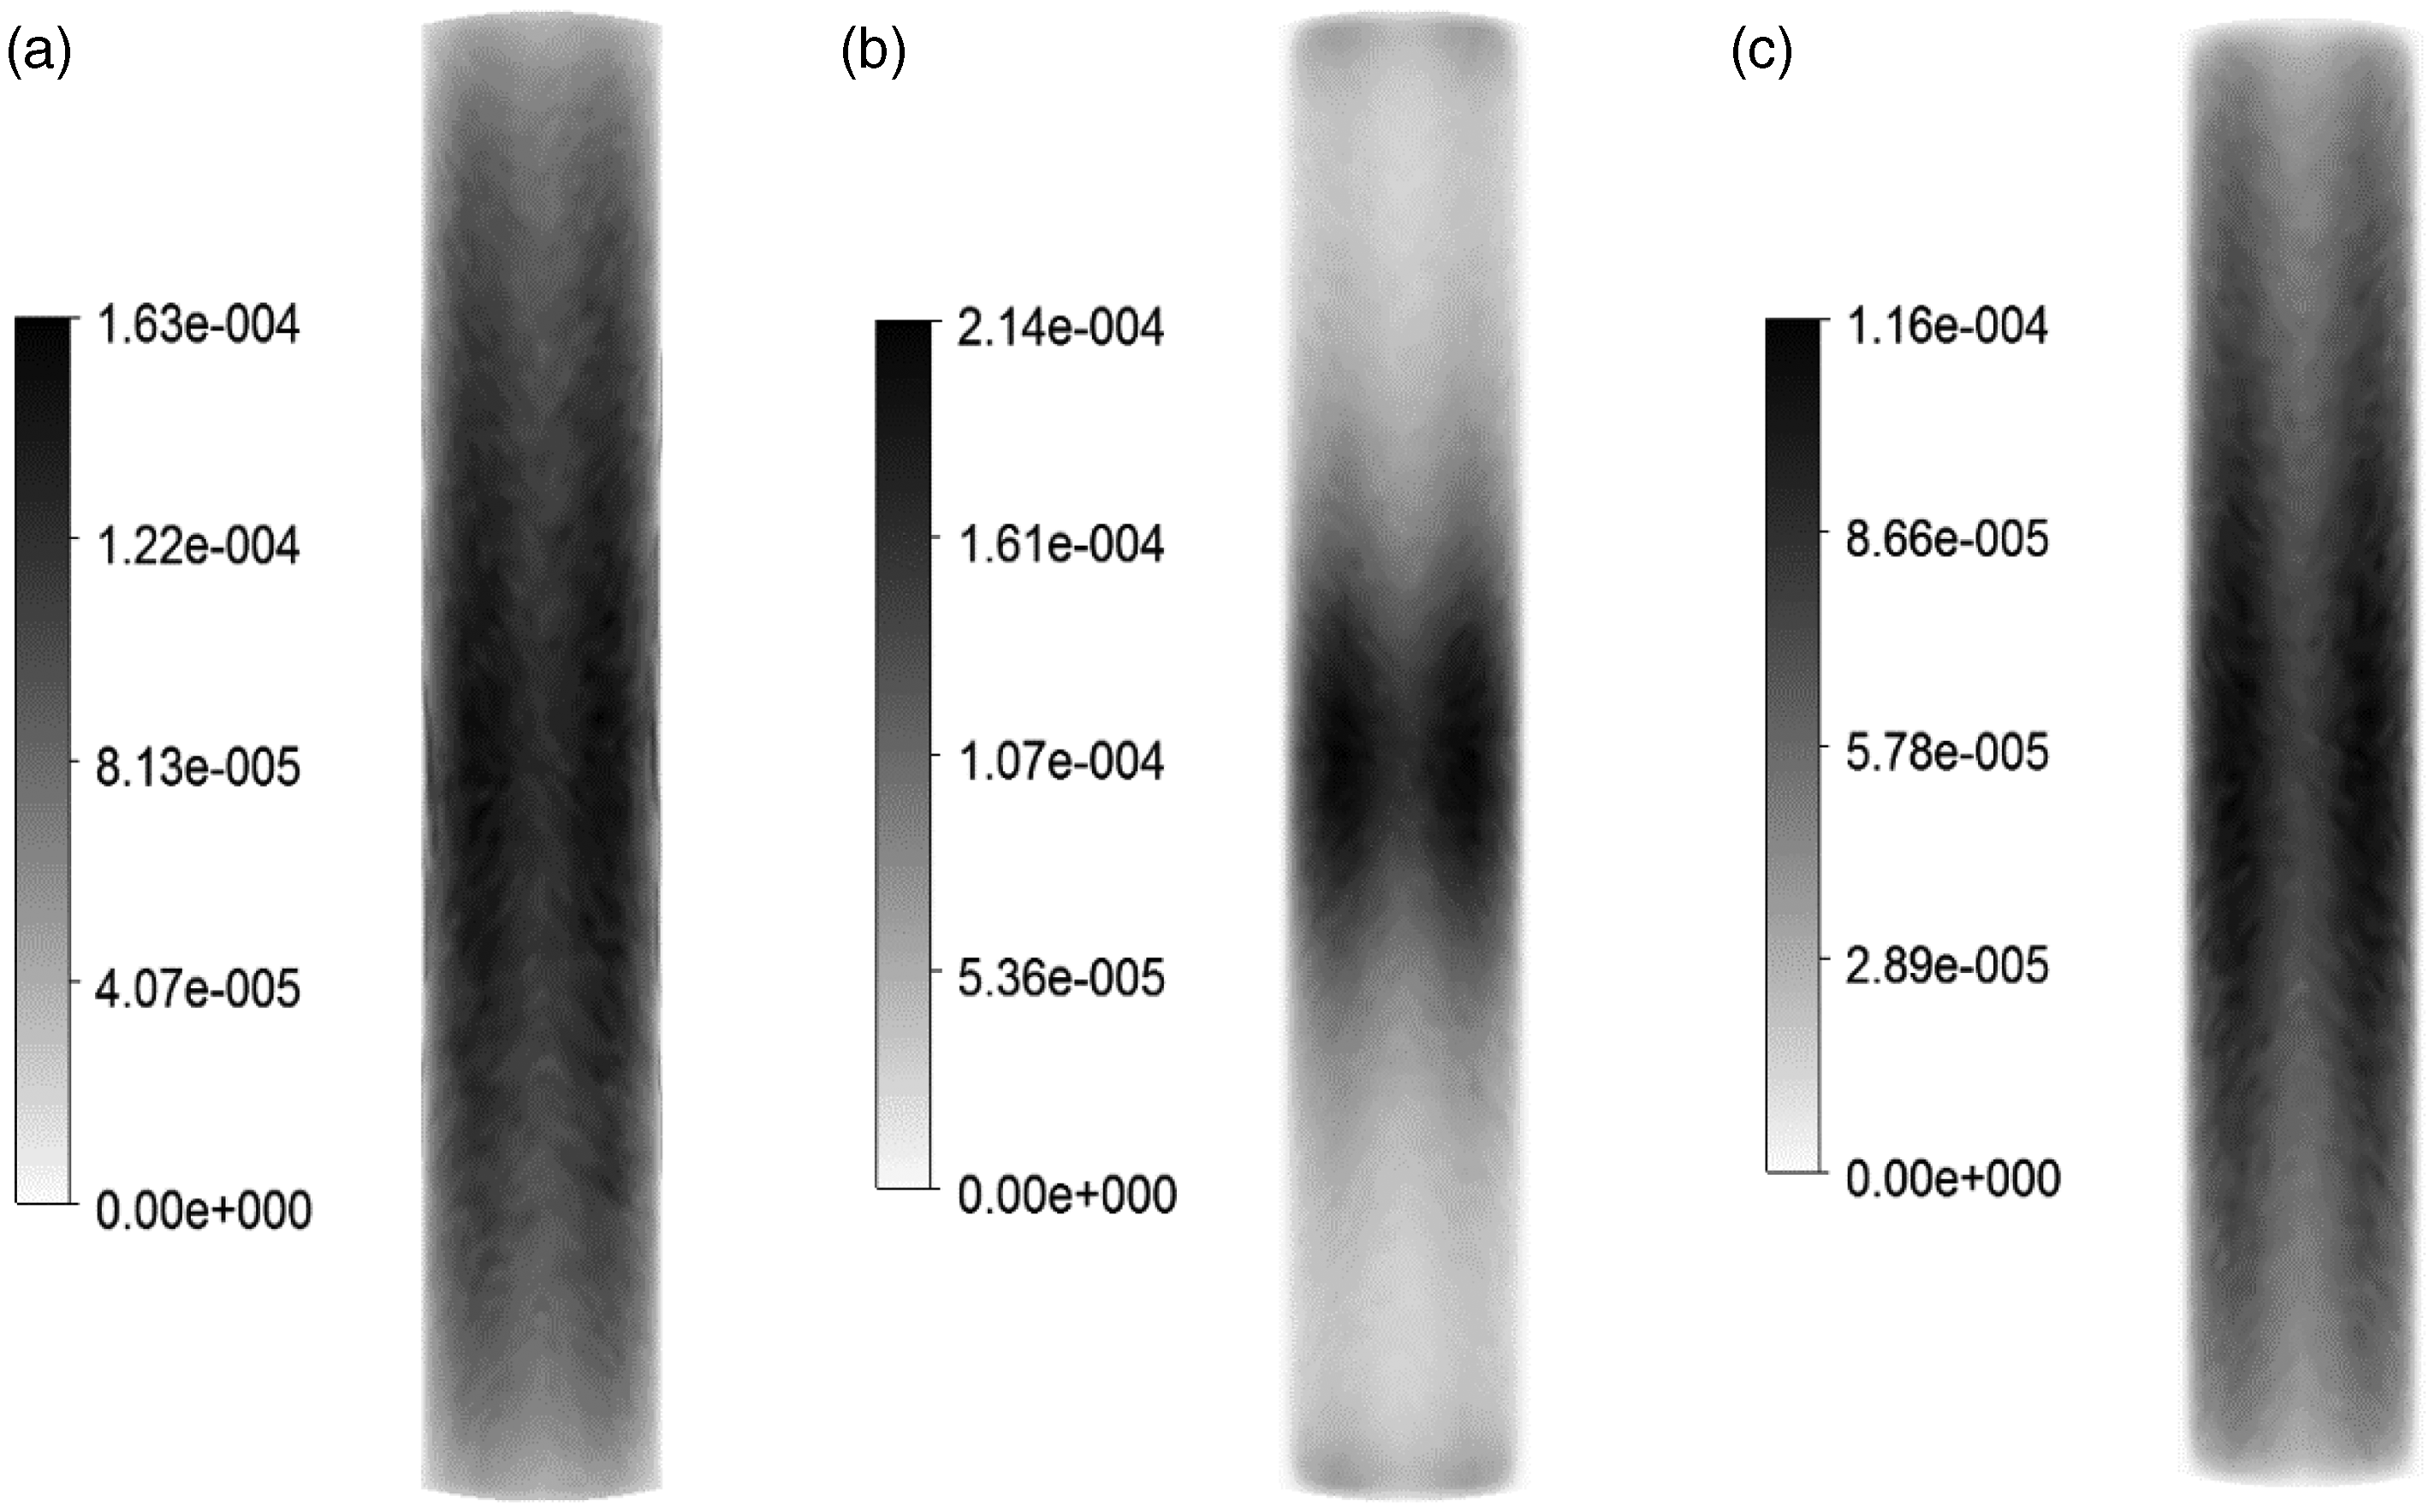
Figure 8 shows an elevation view of the predicted cylinder exposed face specific erosion ratio. Two kinds of erosion fields are displayed for large and small particle Stokes numbers of 18,800 and 4.24, respectively. Consistently with the angular shift of the maximum erosion location (Figure 7), the erosion of low-Stokes particles is local, at the centre of the target compared to the high-Stokes configuration. If we compare with the general trends observed experimentally (Figures 1 and 2), we recover qualitatively the narrowing of the erosion spot as particle Stokes number decreases. Importantly, this is not the case when the turbulence particle dispersion force is switched off. The level of the erosion peak is also in this case more in accordance with the fluid effect interpretation that anticipates a lower material loss for small particles that tend to be moved away from the target by the carrier fluid.
Specific erosion ratio. (a) St = 18,800. (b) St = 4.24. (c) St = 4.24, turbulence dispersion disabled. Particle/carrier density ratio = 2210.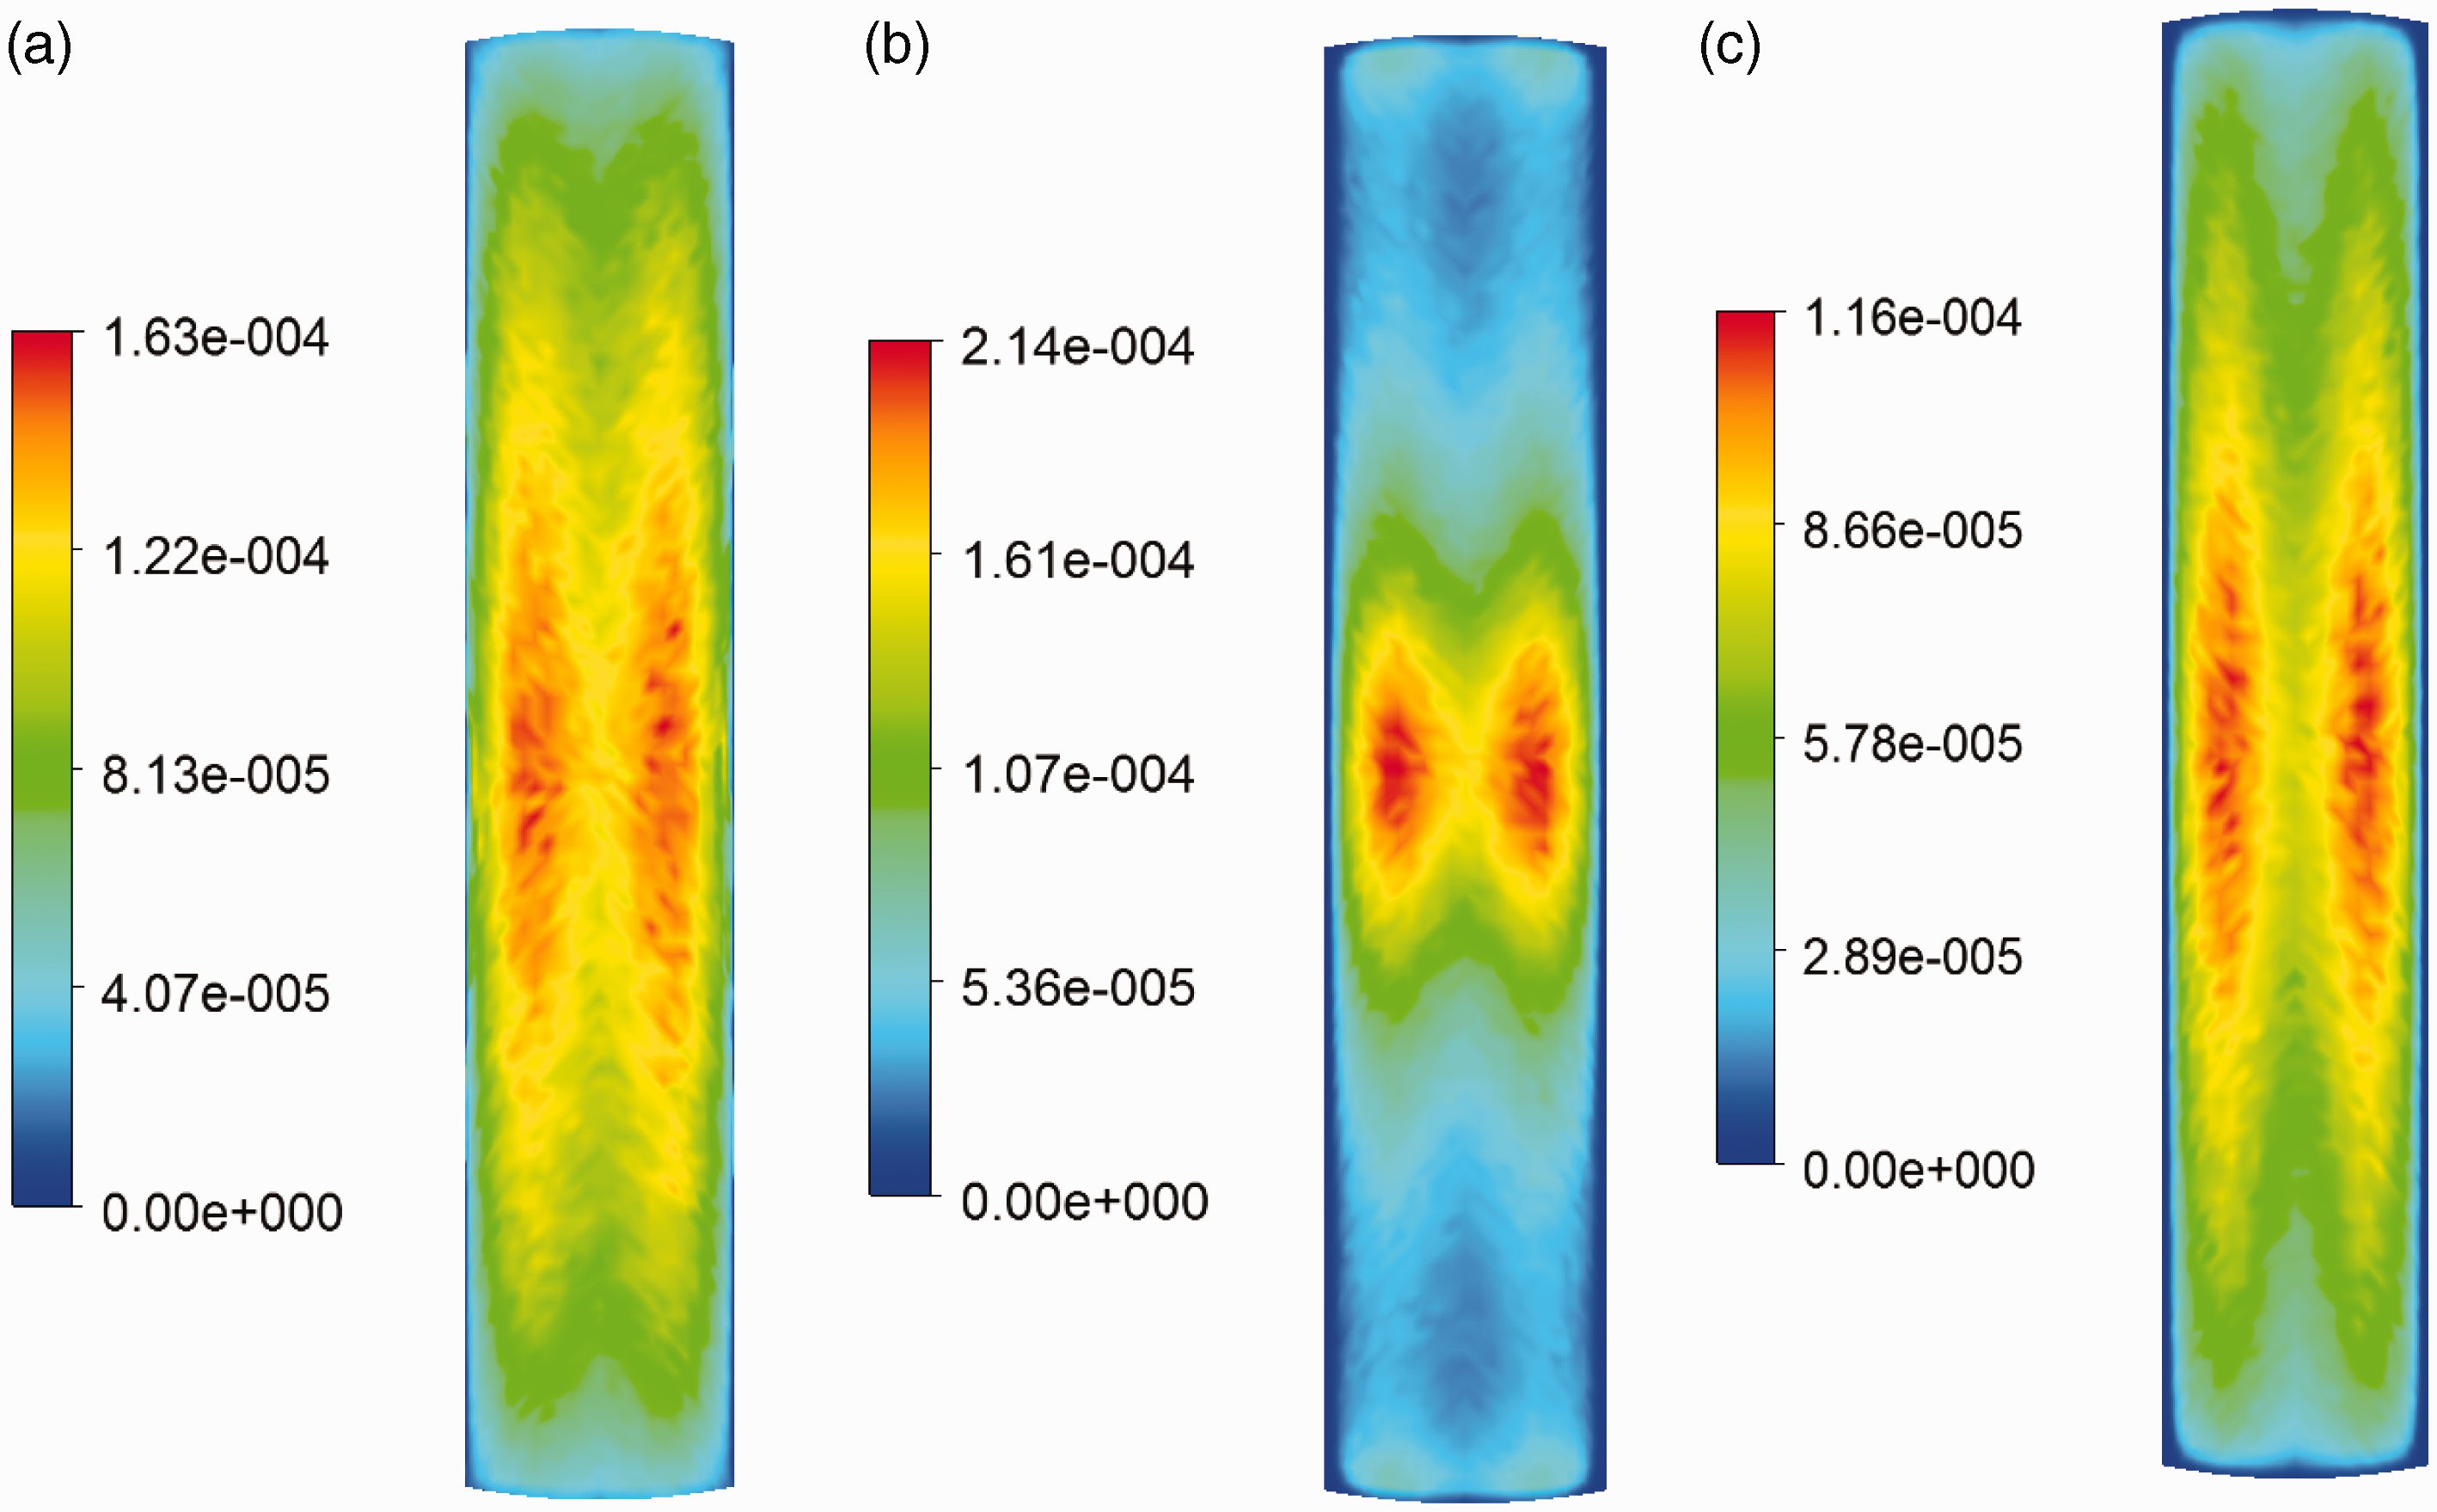
A sample of low-Stokes particle trajectories as they travel from their injection points is provided in Figure 9. Particle paths tend to concentrate in a narrow volume around the pipe axis as they approach the erosion target consistently with the previous findings. The ‘turbulence noise’ is perceptible in the induced snaking patterns.
Low-Stokes (4.24) particle tracks clustering in the neighbourhood of the pipe axis. Particle/carrier density ratio = 13.3.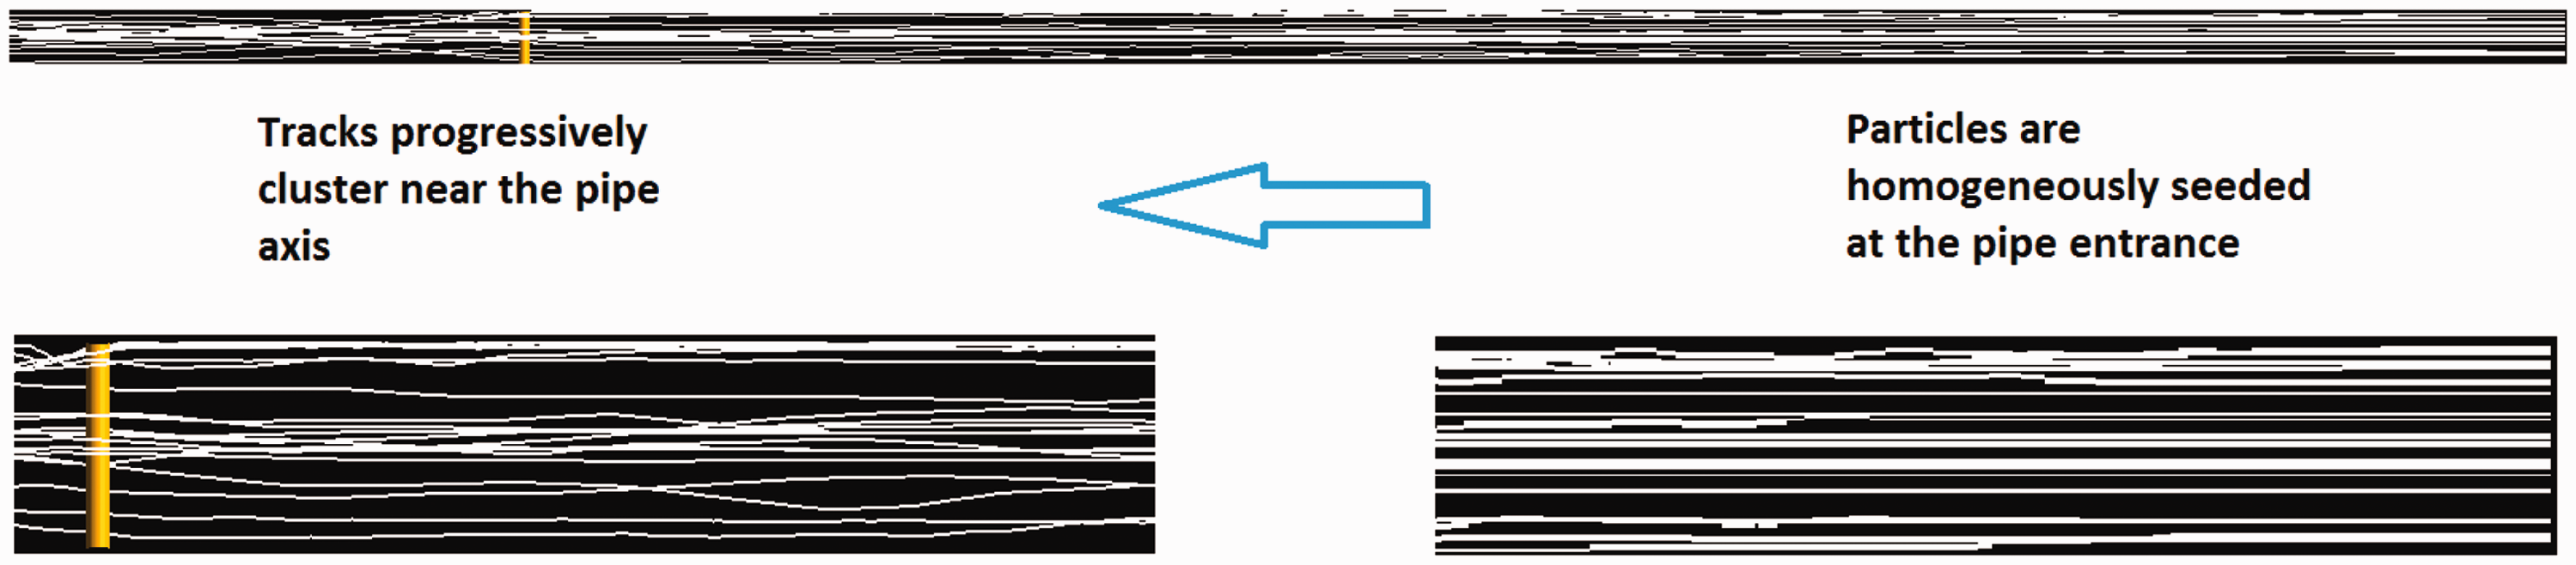
As a matter of comparison, large-Stokes particles or low-Stokes particles but not submitted to turbulence dispersion do not exhibit this concentrating effect (Figure 10).
Particle tracks, particle/carrier density ratio = 13.3. (a) Low-Stokes (4.24) and disabled turbulence dispersion. (b) Zoom of (a) at the target approach. (c) Large-Stokes (18,800). (d) Zoom of (c) at the target approach.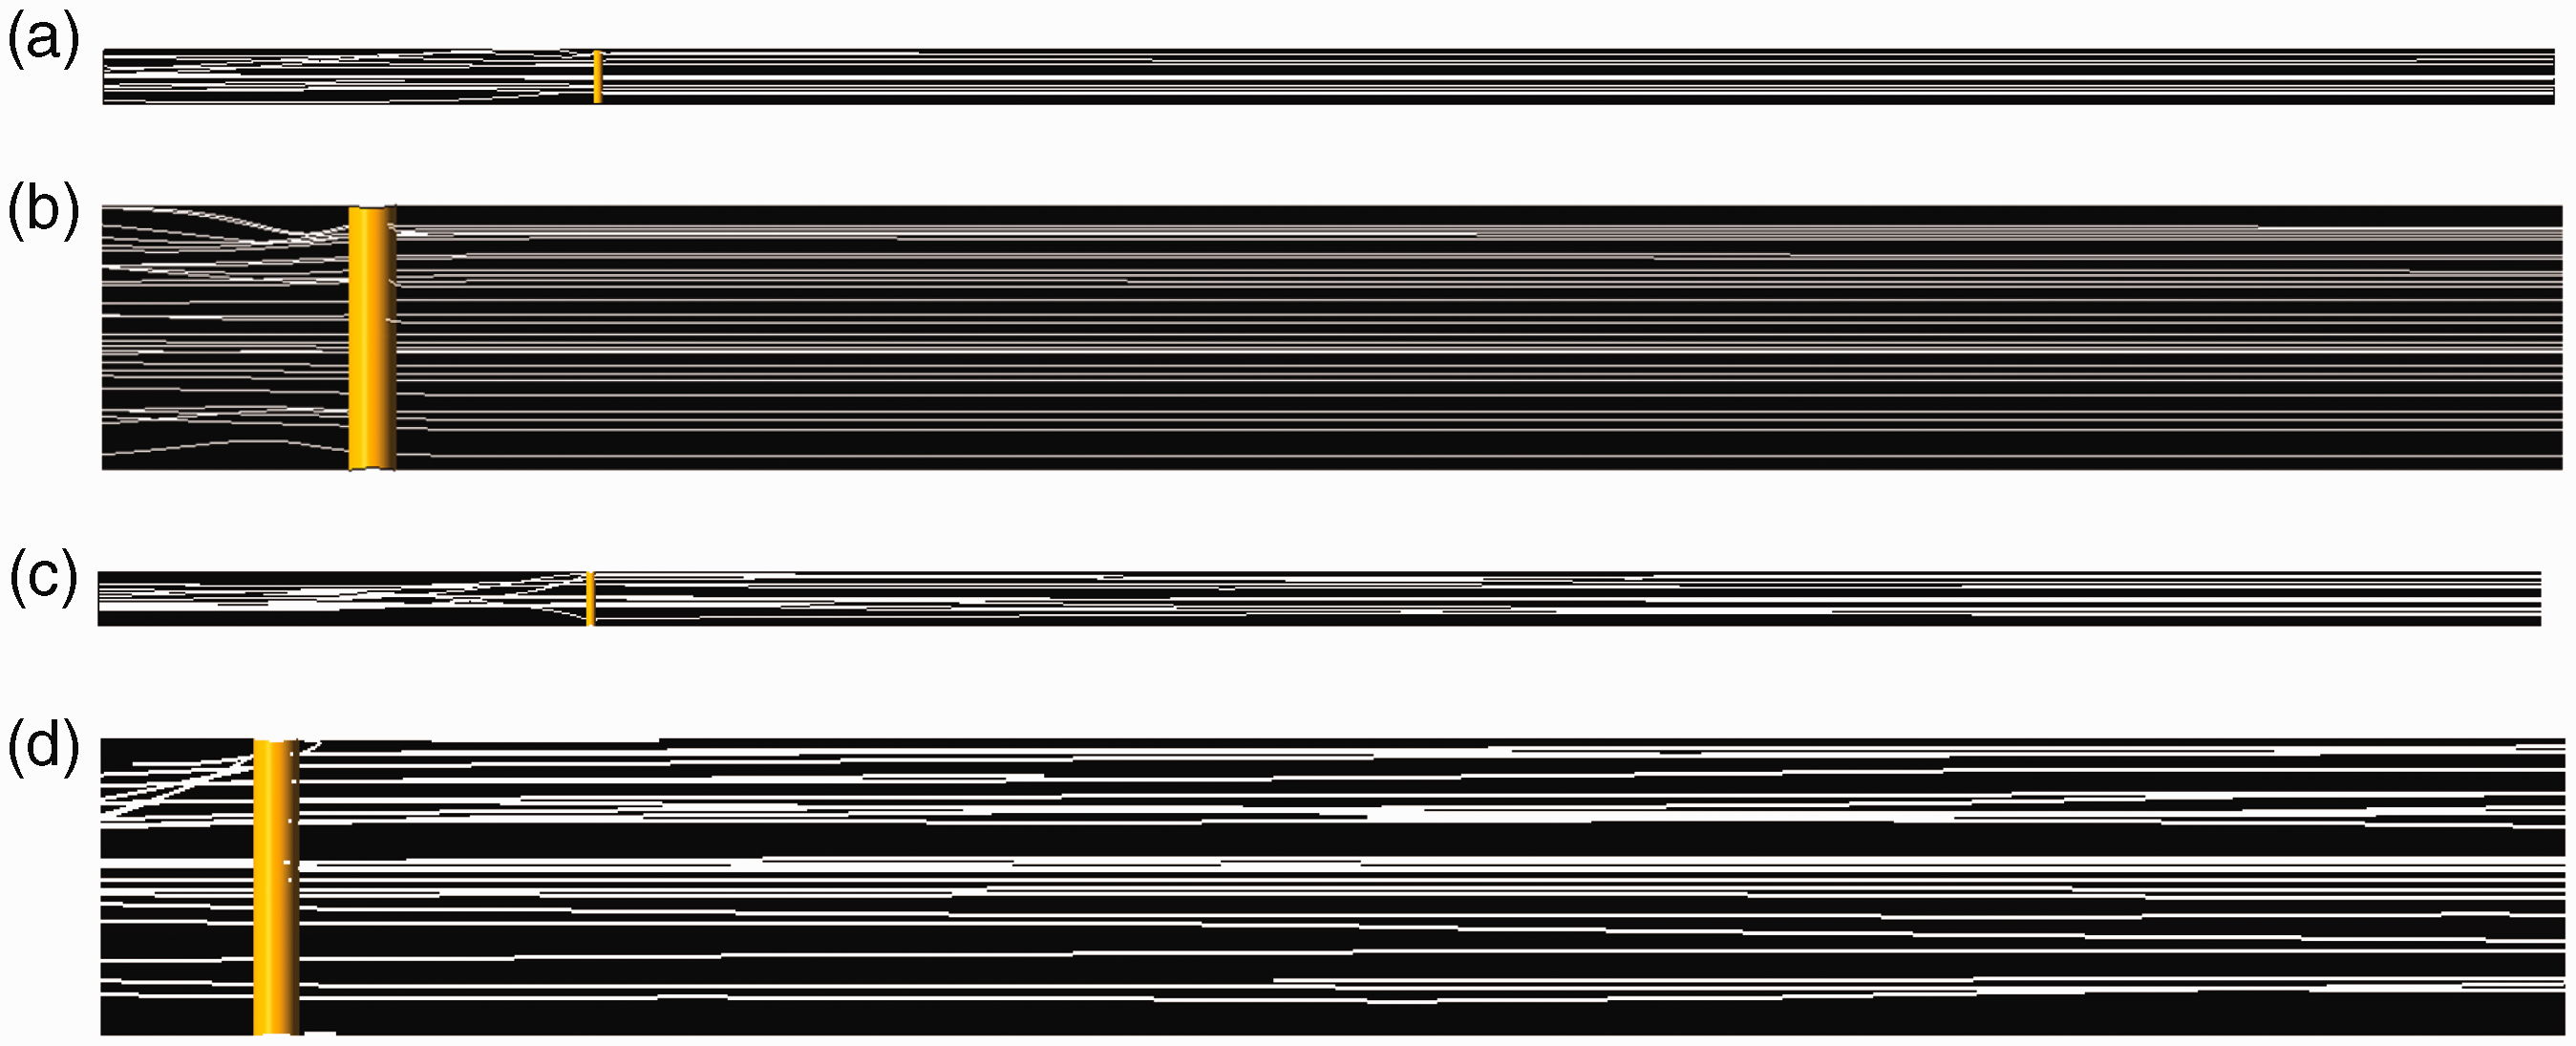
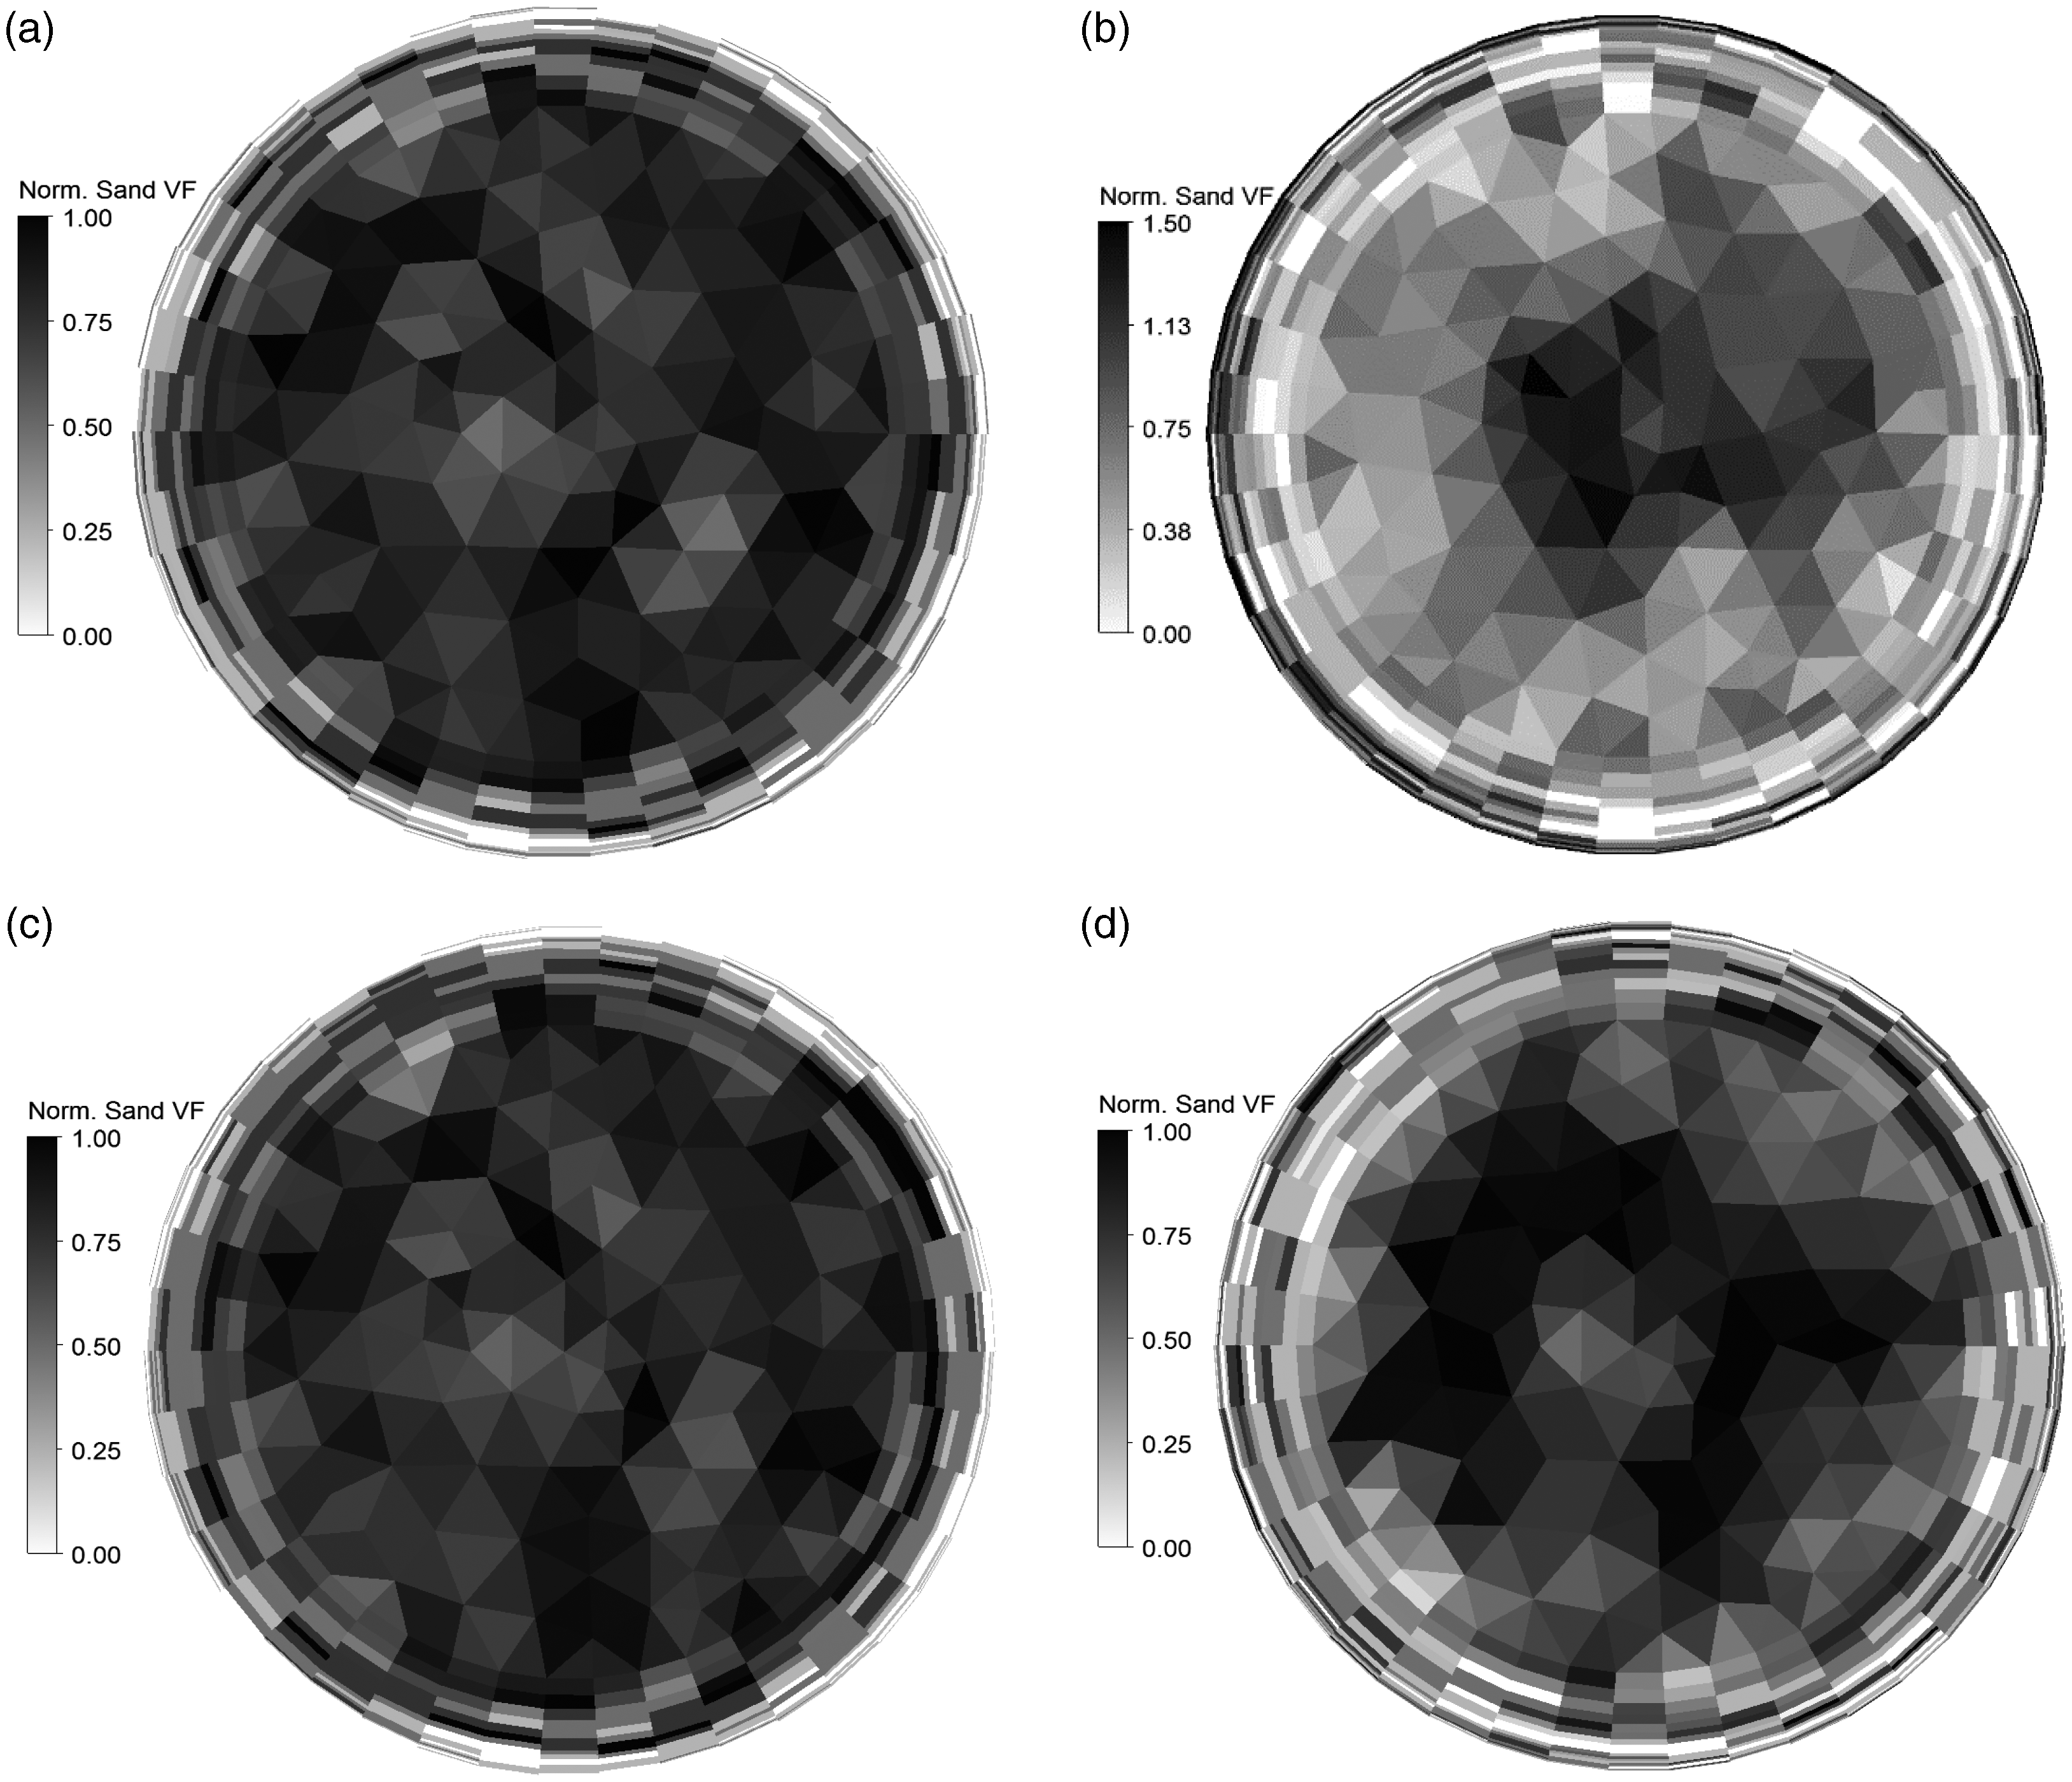
Another visualisation of this phenomenon is the solid volume fraction, projected on the Eulerian mesh (Figure 11). This figure provides the solid volume fraction contours on pipe cross-section planes near the inlet and 37 pipe diameters downstream. The concentration of the solid on the pipe centreline after a journey of almost 40 rig pipe diameters is clearly visible when low-Stokes particles are subject to turbulence dispersion. The concentration is, on the contrary, not perceptible when the turbulence dispersion is disabled. Low-Stokes particle behave then similarly to large-Stokes particles whose inertia make them insensitive to turbulence.
Projection on the Eulerian mesh of the sand volume fraction normalised on the injection condition at the inlet, particle/carrier density ratio = 13.3, rig pipe normal cross-section. (a) Low-Stokes (4.24), one pipe diameter from the inlet. (b) Low-Stokes (4.24), 37 pipe diameters downstream. (c) Low-Stokes (4.24), 37 pipe diameters downstream, disabled turbulence dispersion. (d) Large-Stokes (18,800), 37 pipe diameters downstream.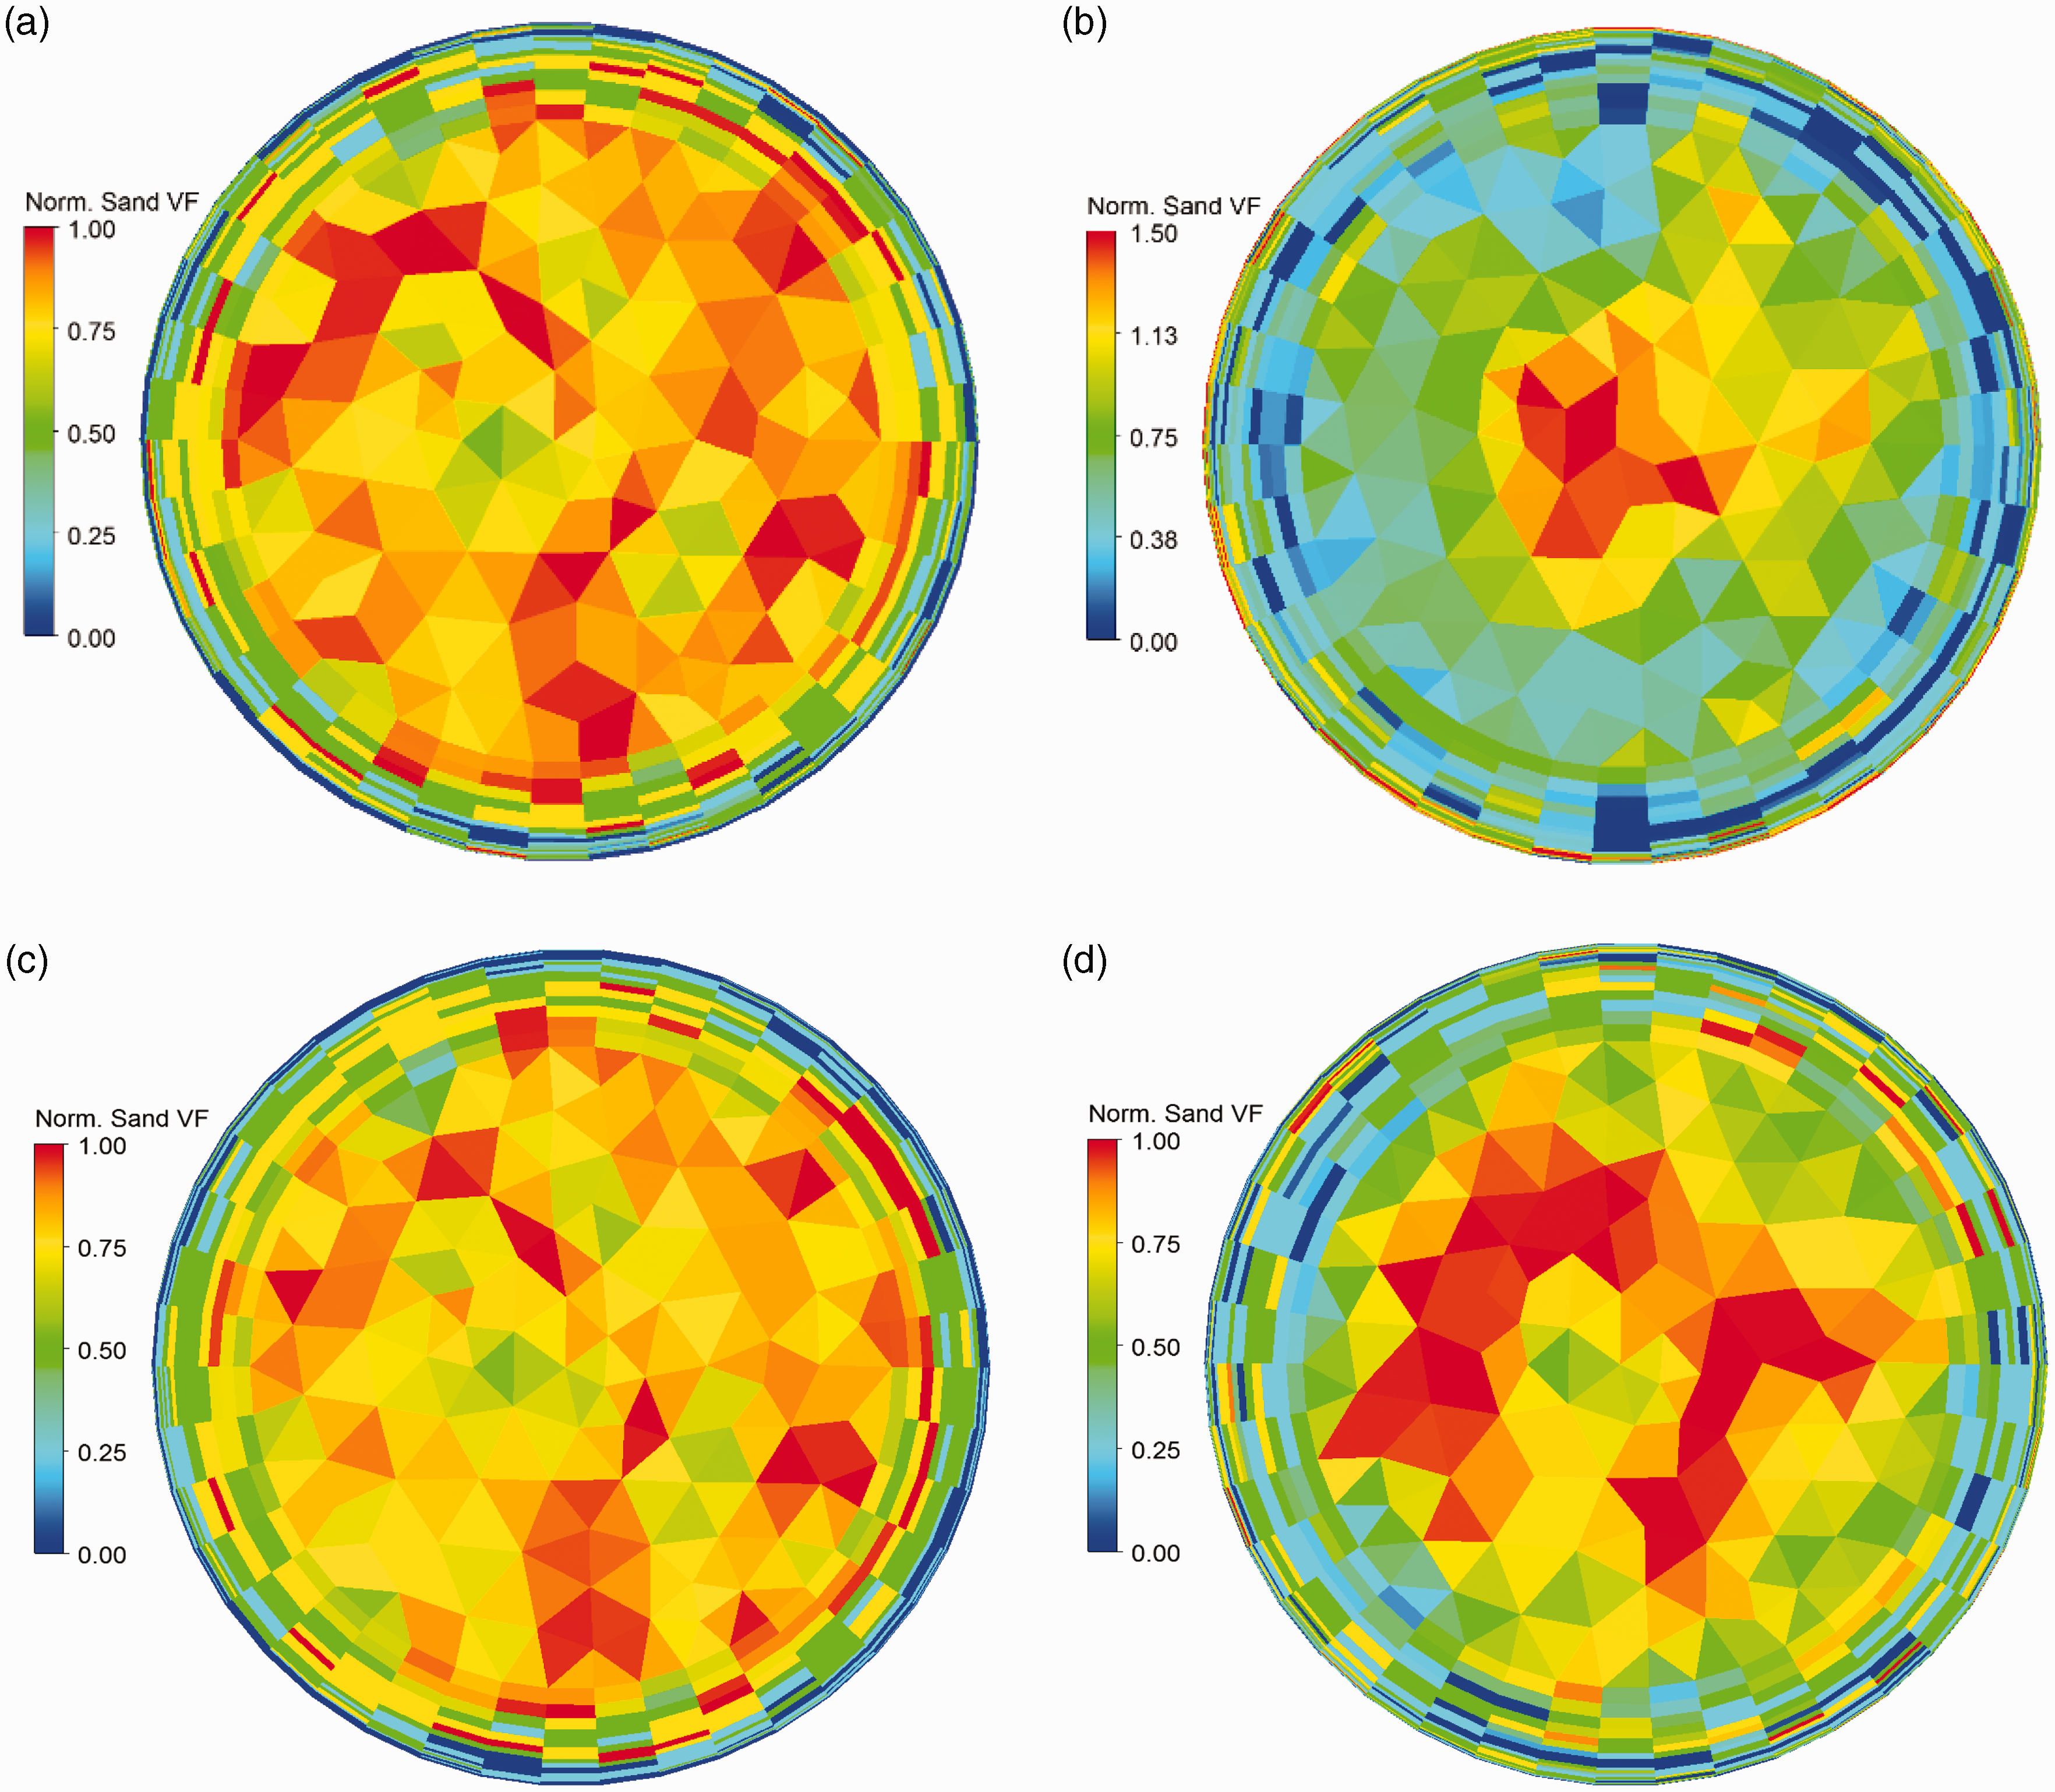
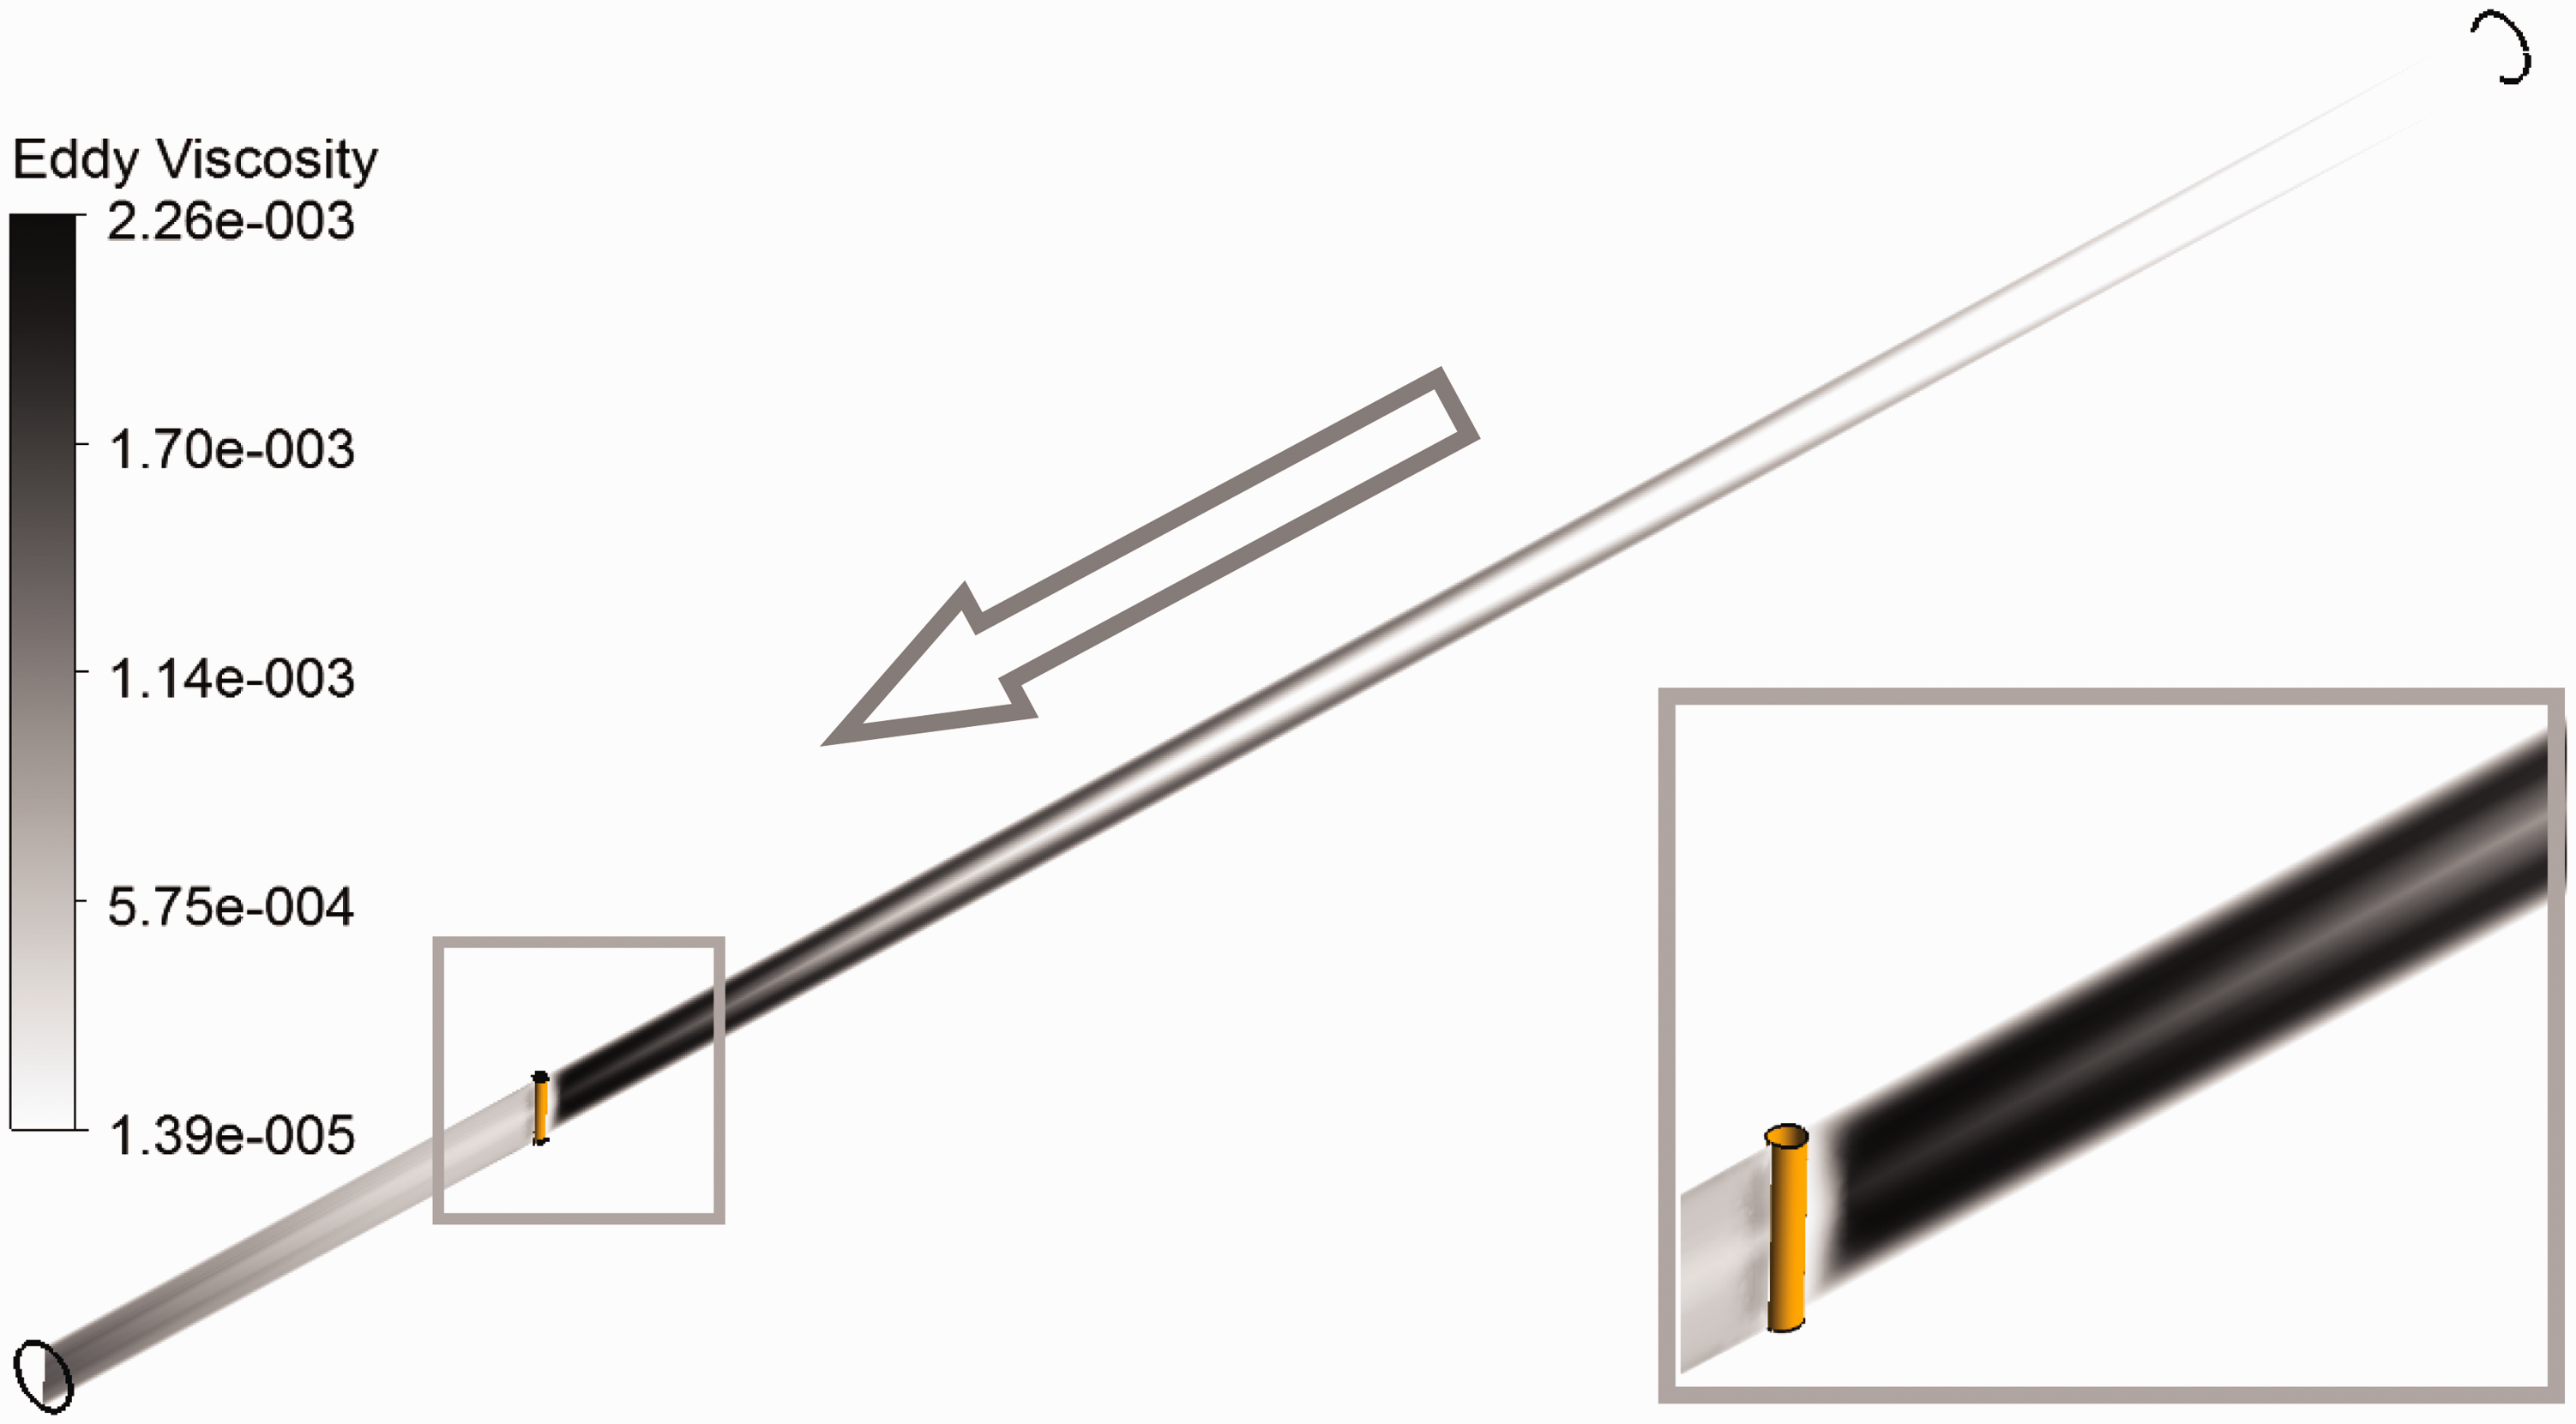
A distribution of the turbulence activity in the pipe rig is visible in the form of a median plane cross section of the eddy viscosity field in Figure 12. The eddy viscosity has an annular distribution following the axis of the pipe. It is made non-dimensional using, respectively, the carrier density and bulk velocity, and pipe rig diameter according to μt/(ρVD), with μt the eddy dynamic viscosity, and ρ the carrier density.
Eddy viscosity distribution in the rig. Rig Reynolds number = 505,000.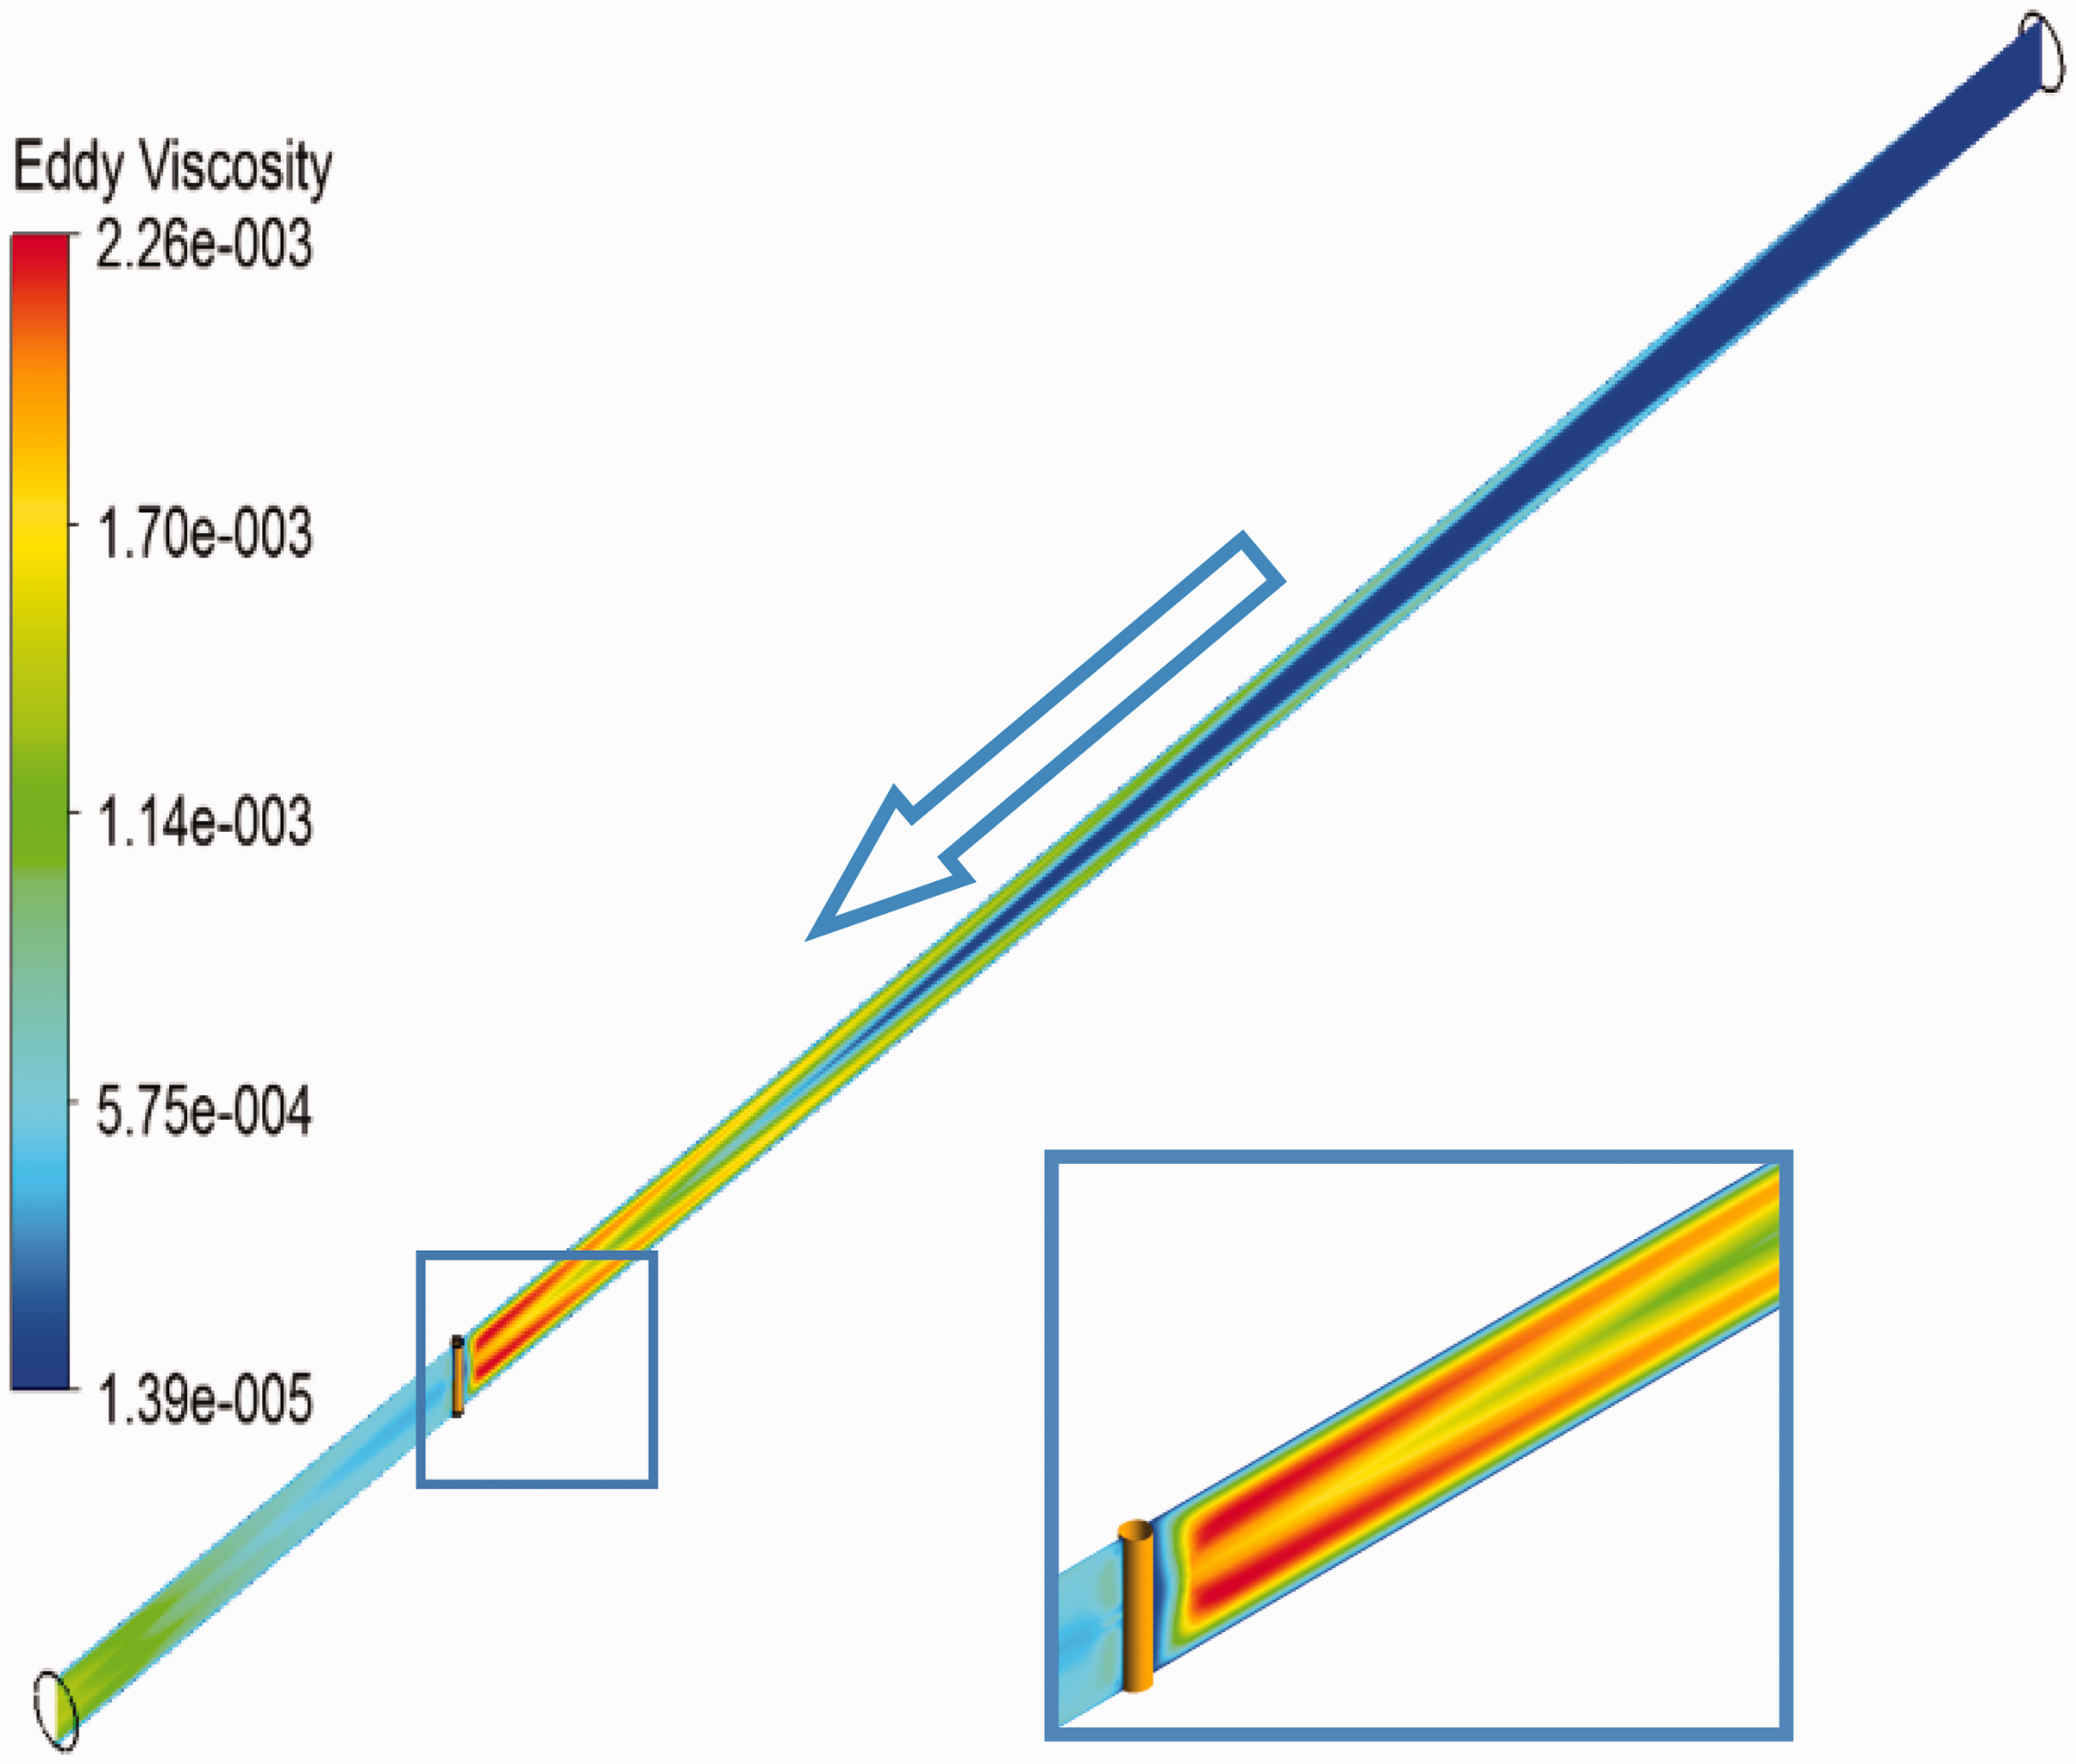
Locally averaged impact angles of low- and high-Stokes particles are provided in Figure 13 for different cylinder angles β on the cylinder median. While the high-Stokes particles verify the expected relationship (α + | β|/π = 0.5 that pertains to ballistic trajectories following the pipe axis,
19
the impact angle α for lower-Stokes particles drops quickly away from the stagnation line. This is the classical effect of the fluid mechanics, preferentially deviating low-Stokes particles.
Average angle of impact at different azimuthal locations on the cylinder mid-line. Particle/carrier density ratio = 13.3.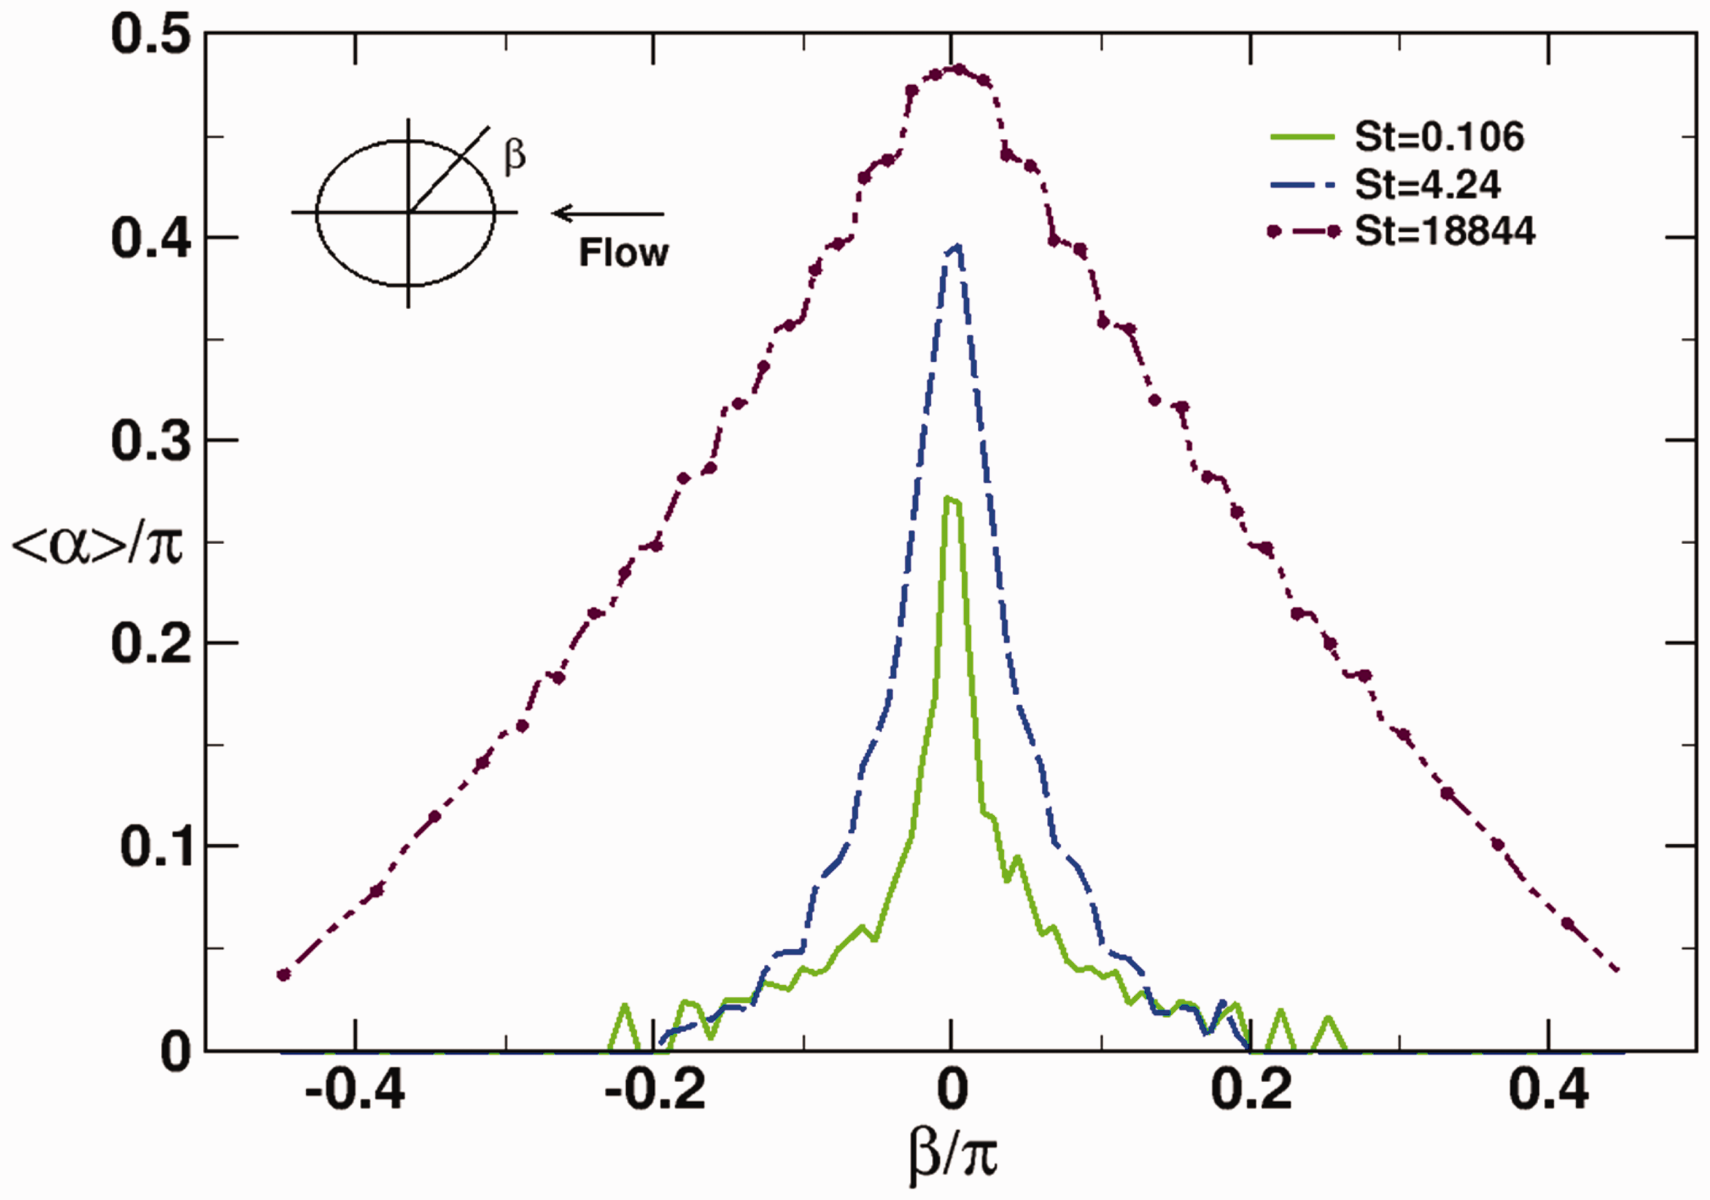
Discussion
The current understanding of the fluid effect on fine particles approaching a target is that the latter are decelerated and deviated due to the action of the carrier going around the obstruction. This is explained by the important drag characteristic of low-Stokes particles that forces them to follow the carrier average streamlines.
As a consequence, the impact number and velocity are expected to decrease near the stagnation region while the deviated particles impact further downstream if not at all. Hence, for particles with decreasing Stokes number, the maximum erosion location tends to drift downstream on the cylinder. Figure 7 effectively exhibits this behaviour but only for a range of Stokes number.
Below this range (about 100 in the configurations visited in this graph), the maximum erosion location tends to move back closer to the stagnation point as the particle Stokes number further decreases. This is a break-down of the interpretations of the fluid mechanics effect on small particles. This suggests the action of other carrier/particles interactions.
Interestingly, the target exposed surface erosion distribution for low Stokes number (Figure 8) reveals that the erosion field concentrates on the centre of the target in both directions and not only from an angular point of view along the cylinder mid-line. This is likely explained by a focus of the particle trajectories and subsequent impacts. Hence, the apparent angular shift of the maximum erosion spot backs towards the stagnation region of the cylinder in the lower range of the Stokes number as shown in Figure 7 and is in fact the consequence of this general focus of the erosion damage. Furthermore, this focusing effect disappears when the turbulence dispersion model is switched off (Figure 8b and c).
This focusing effect with decreasing particle Stokes number is also reported experimentally, as explained in section ‘Introduction’. This happens in simple slurry flows as well as for various multi-phase gas/slurry flow regimes. Similarities between experimental and modelling findings are obvious.
Investigations of the history of low-Stokes particles in Figures 9 and 11 reporting their trajectory along the pipe show that the particle paths slowly drift towards the pipe centre. The flux of particles which was initially injected homogeneously on the cross-section of the pipe rig becomes denser near the pipe axis. This phenomenon does not happen when the turbulence dispersion effect is not accounted for (by disabling the model in the simulation set-up) and/or particle Stokes number is large enough to make them insensitive to turbulence dispersion (Figures 10 and 11).
It is admitted 17 that particles transported in a turbulent flow are subject to something analogous to positive thermophoresis. They are dispersed by turbulence from regions of high agitation towards more quiescent ones. It is sometimes named as turbophoresis by analogy. 20 The pipe rig mid-plane cut view of turbulent viscosity in Figure 12 shows that the pipe developing flow structure typically organises an annular volume of turbulence. According to the turbophoresis mechanism, this tends to disperse particles towards the pipe axis. Preferentially low-Stokes particles are responsive enough to lend themselves significantly to this turbulence re-organisation of their path. This is effectively what is seen in Figures 9 to 11. From an engineering viewpoint, it is then important to remark that this is the overall design of the facility upstream of the target that offers the opportunity for the turbulence to progressively focus the particle paths and create a localised, dense erosion spot.
Turbophoresis and ‘classical’ fluid effect co-exist. The turbulent dispersion first pushes the fines towards the axis during their journey in the upstream pipe but, then, the fluid effect deviates them when close to the target. Figure 13, providing the average impact angle with respect to the location on the mid-line of the cylinder, reveals this by showing that, away from the stagnation point, the typical average angle of impact falls sharply for low-Stokes particles.
Figure 14 illustrates the combination of both turbophoresis and traditional fluid mechanics effects on low-Stokes particles carried in a straight pipe section and impacting a cross-flow cylinder.
Interpretation of the turbulence dispersion and fluid mechanics effect on fines carried in a straight pipe developing flow towards a cross-flow cylinder. Elevation view of cross-flow cylinder exposed face. Specific erosion ratio contours. Slurry experiments. Refer to Table 1. Cross-flow cylinder exposed face elevation view. Specific erosion ratio contours. Air-slurry experiments. Refer to Table 2. Specific erosion ratio. (a) St = 18,800. (b) St = 4.24. (c) St = 4.24, turbulence dispersion disabled. Particle/carrier density ratio = 2210. Projection on the Eulerian mesh of the sand volume fraction normalised on the injection condition at the inlet, particle/carrier density ratio = 13.3, rig pipe normal cross-section. (a) Low-Stokes (4.24), one pipe diameter from the inlet. (b) Low-Stokes (4.24), 37 pipe diameters downstream. (c) Low-Stokes (4.24), 37 pipe diameters downstream, disabled turbulence dispersion. (d) Large-Stokes (18,800), 37 pipe diameters downstream. Eddy viscosity distribution in the rig. Rig Reynolds number = 505,000.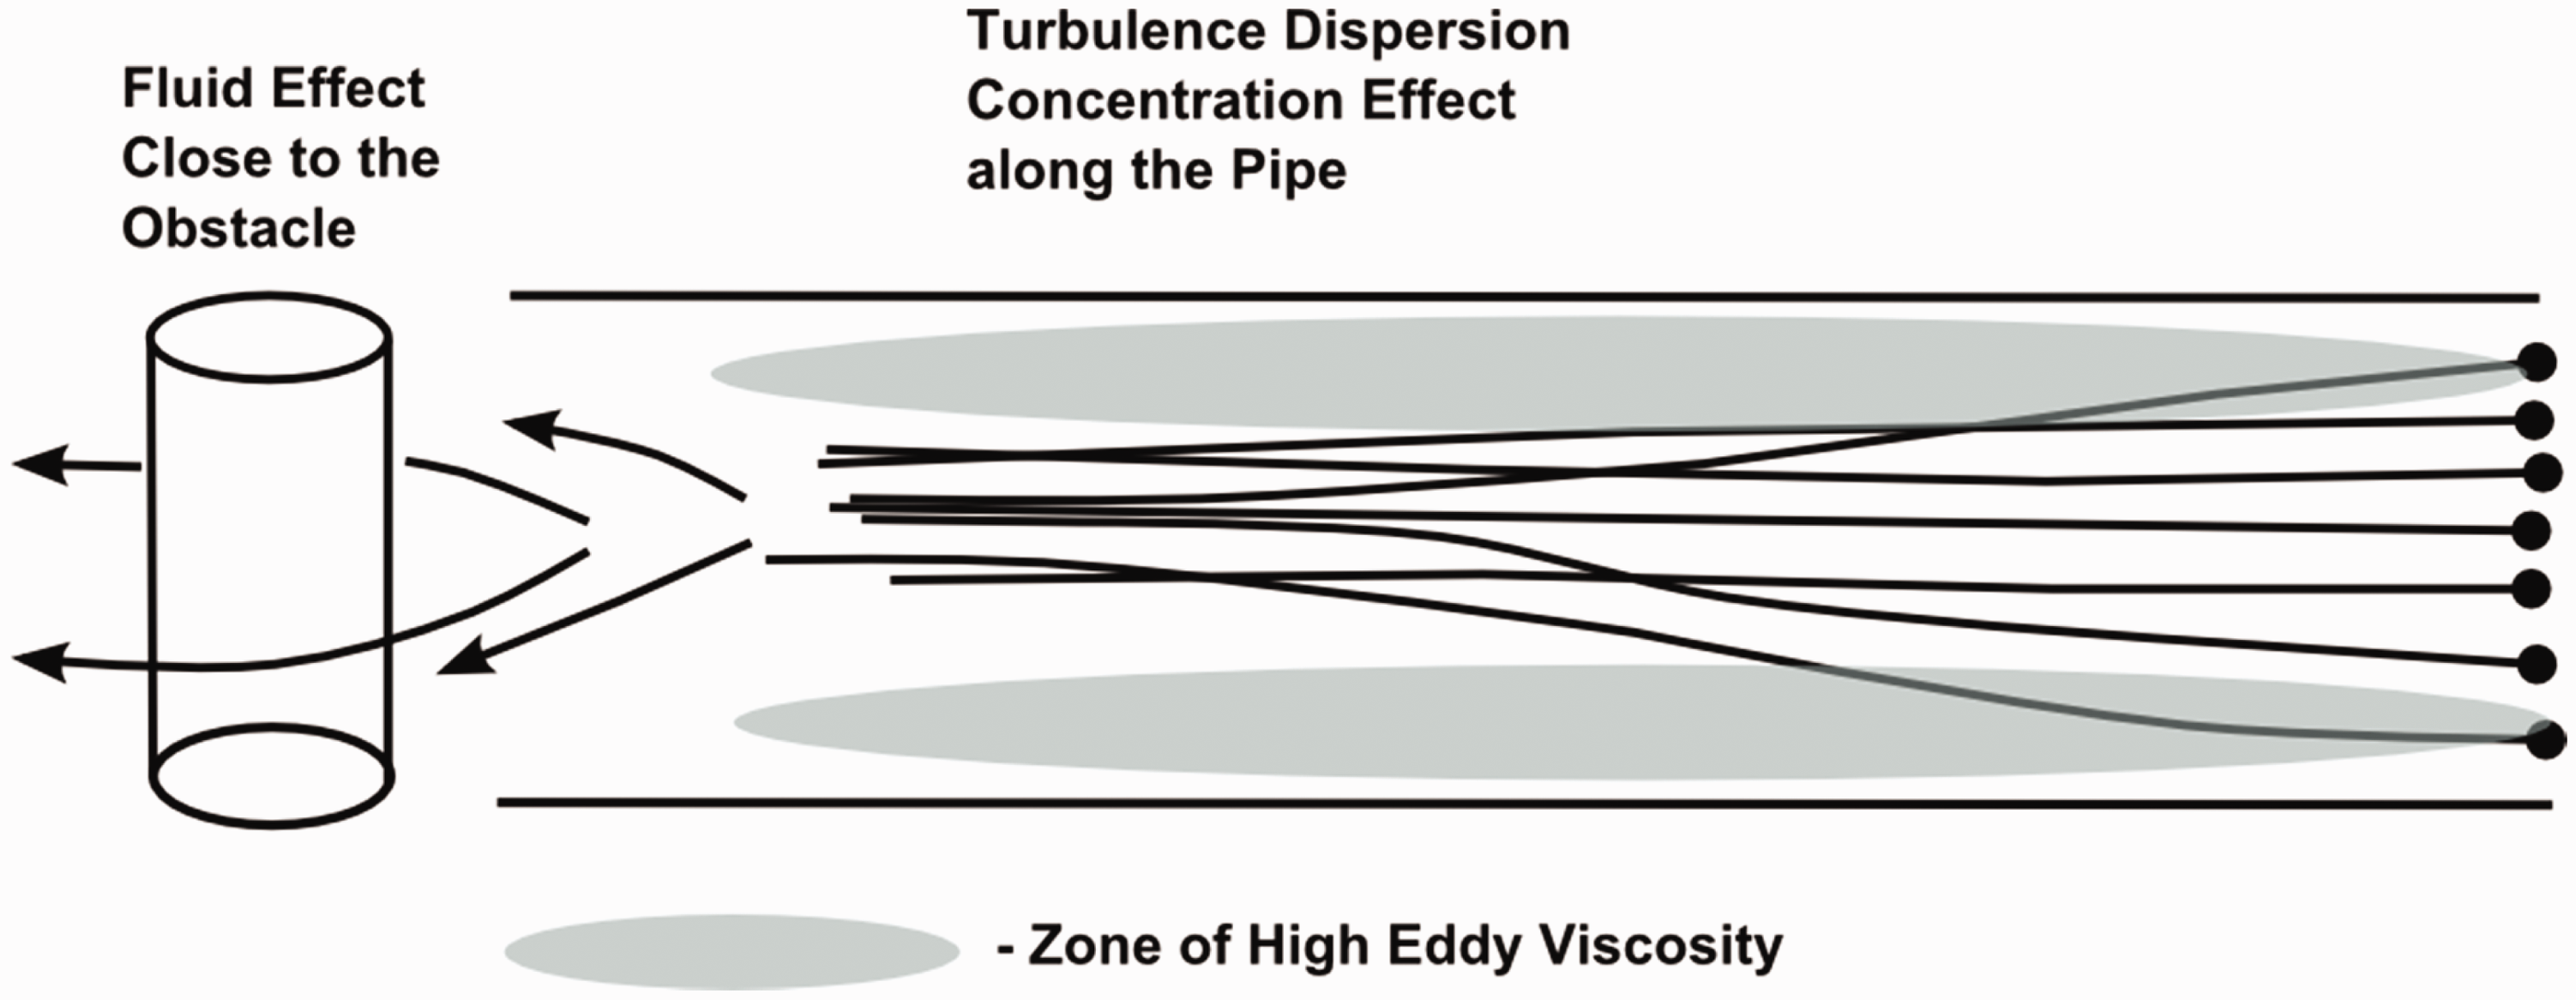
This study exemplifies the fact that the fluid effect traditionally attached to the average flow drag of the flow is not acting alone on fines. Other interactions at stake between the particle and the carrier like turbulence dispersion can impact erosion occurrence as well. The action of the fluid on low-Stokes particles through the turbulence dispersion interaction does not take place on the same scale as for the average drag. It is likely that other known particle–carrier interactions (lift, pressure gradient, etc.) have also their associated effect, with their own specific characteristics. Hence, some configurations may increase their significance with an effect on erosion that can be different from the one expected from the average drag only (the ‘pure’ fluid effect).
Conclusion
In a fluid able to occasion significant drag on the carried abrasive particles, the latter tend to be deviated by the average streamlines when approaching a wall. They follow the fluid going around and avoid the impact. This is the traditional fluid effect. This effect is driven by the average flow structures. Such a fluid is able, once again through its enhanced drag, to transfer the turbulence to the cloud of particles. Following a dispersion process similar to positive thermophoresis, these latter tend to depart from an area of high turbulence level and cluster into low-turbulence volumes. In the case of a flow in long straight pipe sections in which the turbulence agitation is preferentially located in an annular zone, this turbulent dispersion process focuses the particle streams on the centreline. At the impact on a bluff-body, this tends to create local erosion spots. This is an unexpected issue in standard management of fines erosion as they are always supposed to be scattered by the flow before impact by the ‘traditional’ fluid effect. Both the fluid effect and this turbulence dispersion effect combine. They nevertheless act at different scales. The classical fluid effect is mostly governed by the fluid spatial scales immediately around the target. The turbulence dispersion effect is a more progressive process, acting, for instance, along long straight pipe flows as studied here. Other carrier–particle interactions may have their own scale of action as well such that various facility designs may enable various fines erosion issues, possibly not all anticipated by current engineering practices. Similar phenomena appear in gas/slurry flows, whatever the regime (bubbly, slug). Because those regimes are more complicated than steady-state binary flows, the exact scenario of particles concentration remains to be elucidated. These are the subject of further research.
The understanding developed in this study will benefit to the correct anticipation of fines erosion in pipe systems.
Footnotes
Acknowledgements
The authors acknowledge permission from PETRONAS Carigali Sdn. Bhd. to publish some of the results of this contribution. The authors are grateful to CSIRO reviewers for their suggestions.
This paper is an extension of a conference paper, titled ‘Fines Erosion, the Counter-Intuitive Effect of Turbulence’, that was presented at the Eleventh International Conference on CFD in the Minerals and Process Industries (CFD2015), and was nominated for invitation into the CFD2015 Special Issue of Journal of Computational Multiphase Flows based on its designation as having very good scope of extension into a high-quality paper of relevance to multiphase flows.
The authors appreciate the time and effort invested by the Journal of Computational Multiphase Flows reviewers. Their comments have contributed much to enhance the value of the authors’ initial contribution.
Highlights
Turbulence can concentrate fine particle trajectories in narrow pencils. This contributes to the focus of erosion spots on bluff bodies in straight pipe flows.
Declaration of conflicting interests
The author(s) declared no potential conflicts of interest with respect to the research, authorship, and/or publication of this article.
Funding
The author(s) disclosed receipt of the following financial support for the research, authorship, and/or publication of this article: The authors acknowledge financial support from PETRONAS Carigali Sdn. Bhd. to publish some of the results of this contribution. The authors also acknowledge the appropriation funding from CSIRO for the generation of additional results and the manuscript preparation.