
Abstract
Vehicular toxic emissions can easily contaminate the air quality of the enclosed tunnel environment, especially during rush hours with traffic jam events or low vehicle speeds, which poses serious health hazards to road utilizers. The piston effect generated by moving vehicles was normally considered adequate to discharge vitiated air out of short tunnel based on a typical driving speed. However, complex traffic conditions may yield unexpected consequences on in-tunnel air quality levels. This study numerically investigated the CO2 concentration to identify the in-tunnel pollutant dispersion under three traffic conditions including severe traffic congestion and traffic flow with low vehicle speeds. Fan conditions were considered to model the influence of mechanical winds on pollutant dispersion and comparison with vehicular piston effect was also performed. The results revealed elevated pollutant concentration regions were found at the vicinity of near-ground region and tunnel downstream. The vehicular piston effect can sufficiently remove the in-tunnel vehicular emissions when vehicles travel at relatively higher speed. However, pollutant accumulation occurs when vehicles are idling or moving at slow speed. Compared with traffic piston effect at high travelling speed, the mechanical ventilation of ceiling mounted fans only generate a limited contribution to the removal of emissions.
Introduction
Roadway tunnels are increasingly being constructed worldwide as an alternative way to reduce commute time and alleviating traffic congestion. However, vehicular toxic emissions, such as CO, NOx, and smoke, can easily contaminate the air quality of the enclosed tunnel environment and bring hazardous respiration issues to drivers and commuters, especially during severe traffic events. The pollutant concentration within road tunnels depends on factors that determine vehicle emissions (e.g. traffic volume, speed, fuel quality and tunnel length) and the rate of dilution (affected by the tunnel ventilation system, traffic volume and speed). For short roadway tunnels, the piston effect induced by the moving vehicles can drive fresh air in and discharge vitiated air out of tunnels sufficiently. While for relatively long roadway tunnels, mechanical ventilation approaches such as jet fans are needed in addition to the piston effect to remove vehicular emissions, especially during peak time events with traffic jams.
Studies of the piston effect and mechanical jet fans have received extensive research attention for decades. Chen et al. 1 experimentally studied the piston effect and jet fan effect based on a rotating-belt model vehicle tunnel. Their results demonstrate that the vehicle speed plays a more important role on the flow velocities distribution inside the tunnel than the vehicle spacing and vehicle size. Although a larger fan velocity can generate a higher flow velocity inside the tunnel, pollutant accumulation may occur in the downstream of the tunnel. Chung et al. 2 numerically modelled the turbulent flow and pollutant dispersion in a road tunnel. Their results reveal that cross-sectional concentrations of air pollutants are non-uniformly distributed and the concentrations rise in proportion with downstream distance. Bari et al. 3 built a computational model based on a real tunnel case to study the air flow and pollutant levels under traffic congestion and fan power failure conditions, and a detrimental condition of in-tunnel air quality was captured. Ashrafi et al. 4 simulated the air pollution dispersion inside tunnels and obtained the spatial distribution of air pollutants for evaluating the ventilation efficiency, and obtained a good agreement between modelling and measurement data. Meanwhile, the air pollution near road tunnel portals also generates potential health hazards to residents living nearby. Matsumoto et al. 5 developed an air quality simulation model combining the effect of the jet stream from the tunnel portal and the ambient wind field, and good conformity was obtained between the numerical results and the air tracer experimental data. Eftekharian et al. 6 conduced a numerical investigation on the performance of jet fans in an urban tunnel under severe congested traffic condition. Their results show that the average CO concentration under traffic jam condition was higher than the permissible level in the vicinity of human breathing zone. Eftekharian et al. 7 also obtained a correlation for pressure drop due to stopped cars inside the tunnel as a function of tunnel average air velocity and tunnel length from CFD simulation results, to optimize the estimation of pressure drop due to vehicles. With the advantage of visualization to provide details that is hard to obtain from on-site measurement, and cost-less than running scaled models, CFD techniques have been widely used to study pollutant transport and distribution in the tunnel under severe traffic jam conditions.
Most researches focused on the effects on severe traffic congestions that vehicles were idling, while in reality, vehicles are often moving at a slow speed, which may affect the airflow and pollutant dispersion dynamically. Solazzo et al. 8 simulated the flow and turbulence induced by atmospheric wind and vehicle motion within an idealised street canyon. Moving wall conditions were set at the street facets to generate the relative motion. They proposed a simplified methodology to analyse the transport and dilution of pollutant emitted by vehicles at street level. López González et al. 9 numerically analysed the influence of the piston effect in the longitudinal ventilation system of subway tunnels using a dynamic mesh technique. They quantified different parameters influencing the subway ventilation system and addressed the impact of the piston effect on the global ventilation performance.
The vehicular piston effect is complex, three-dimensional and unsteady. Currently, studies regarding on airflow patterns and in-tunnel pollutant dispersion associated with the piston effect at different traffic speeds are still very limited. This study aims to investigate the influence of vehicular piston effect on the in-tunnel and adjacent regions of tunnel portals pollutant distributions. The interaction between vehicular piston effect and mechanical ventilation was also considered. Numerical simulations using dynamic mesh method were performed on three traffic condition (i.e. idling, 10 km/h and 40 km/h), with fan on and off conditions respectively. CO2 concentration was used to represent vehicular emissions.
Numerical modelling
Governing equations
For a three-dimensional time-dependent turbulent and buoyant flow of an incompressible fluid, the Reynolds-average Navier-Stokes equations (RANS) are solved for the fluid phase, using the commercial CFD package ANSYS Fluent. The vehicle motion in the computational domain is achieved by the layering dynamic mesh methods. For a general scalar φ on an arbitrary control volume V with a moving boundary, the integral form of the conservation equation is given as equation (1)
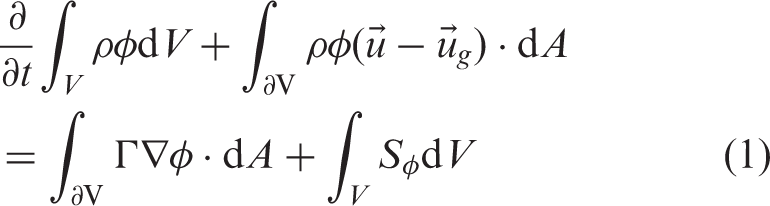
The CO2 is calculated by enabling the species transfer model to solve the conservation equations for species. Fluent predicts the local mass fraction of each species through the solution of a convection–diffusion equation for the ith species. This conservation equation takes the general form as equation (2)
Model geometry and boundary conditions
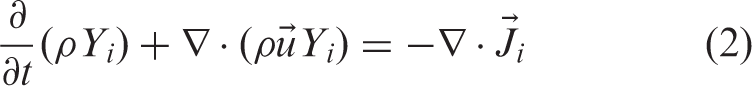
The fluid domain of the current numerical model consisted of a one-way tunnel, upstream and downstream open roadway extensions, and atmosphere sections at the tunnel entry and exit where hillsides were assumed (Figure 1(a)). The tunnel had a radius of 5 m and a length of 120 m, so as the length of each open road extensions. The open roadway sections were modelled as a half cylindrical shape with a radius of 10 times of the road tunnel’s radius. The whole system was split from the mid-plane where symmetric flow features were assumed.
(a) The computational domain, (b) the mesh generation for the moving and fixed part and (c) the location of the fan.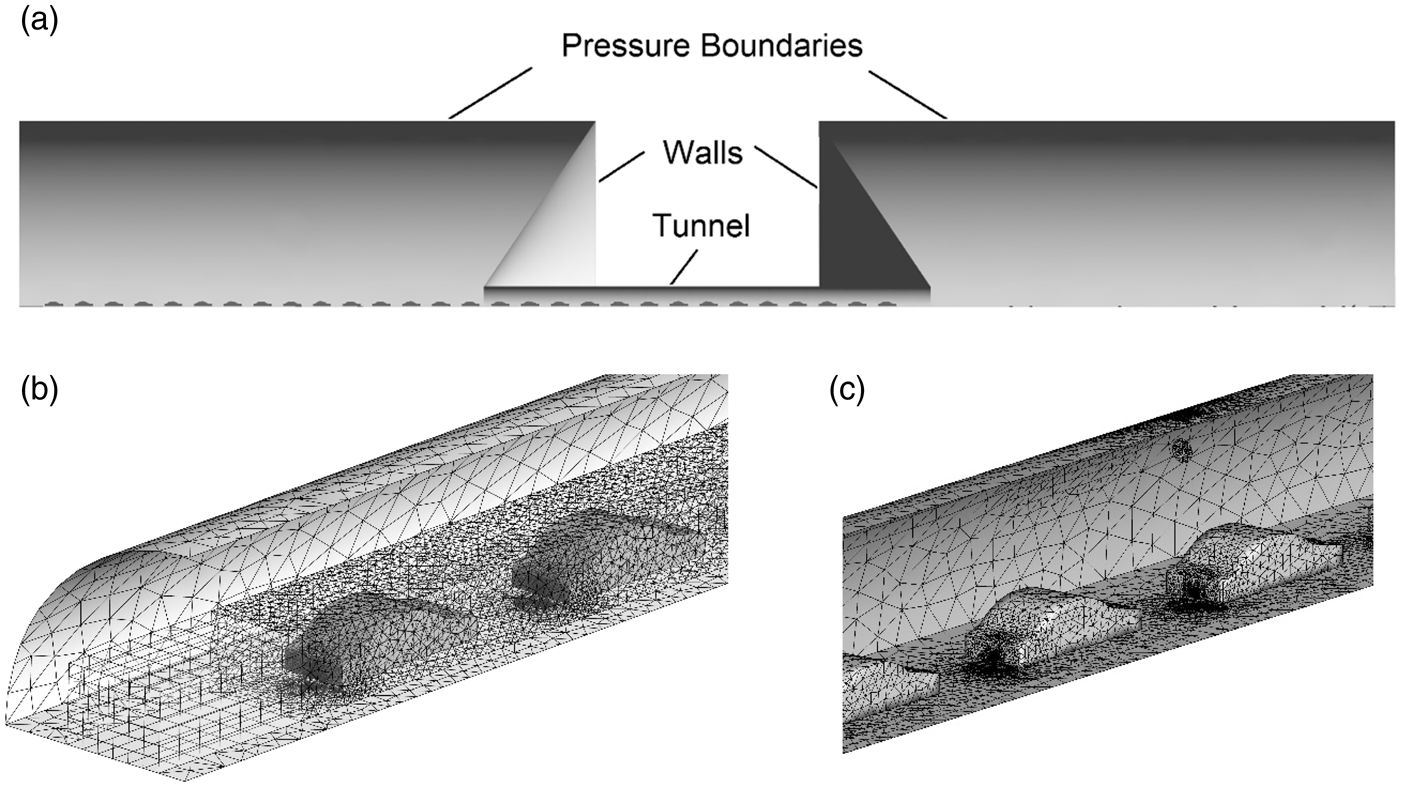
The whole computational domain includes moving meshes and fixed meshes which are matched at interfaces in the model. The moving part was meshed into hybrid mesh, where tetrahedral volumes were imposed around moving vehicles and hexahedral control volumes were imposed at the rest regions of the moving part to enable the layering mesh method, which split and collapse at the boundary of hexahedral control volumes (Figure 1(b)). The fixed part including the top portion of the tunnel and the ambient part of the system was meshed into tetrahedral volumes. The final mesh elements being used in the current study were 2.8 million.
No slip wall boundary condition was used for the tunnel walls and car bodies. Three different traffic conditions under vehicle velocities of 0 km/h (car idling), 10 km/h (low speed) and 40 km/h (medium speed) were considered to simulate possible scenarios when traffic congestion happened. Distances between vehicles were calculated according to the safe following distance that allowed 2 s for vehicles to stop, thus 6 m for 0 km/h and 10 km/h and 12 m for 40 km/h. Symmetric boundary was set at the mid-plane for the whole system. Despite that for short tunnels the airflow driven by the movement of vehicles (the piston effect) is normally adequate to manage in-tunnel air quality; the fan condition was designed in this study to generate an in-tunnel wind velocity to interact with the piston effect. The fan was located 0.5 m to the ceiling of the tunnel (Figure 1(c)), horizontally 40 m to the entrance and 80 m to the outlet, met the requirement of fan installation in long tunnels. A pressure jump of 150 Pa in the driving direction was prescribed for the fan boundary, which generated a fan outlet velocity of 10 m/s and an average in-tunnel wind velocity of 1.47 m/s according to the simulation results. Opening boundary conditions were imposed on the atmosphere region as pressure-inlet and pressure-outlet. In order to control the flowing direction for all the cases, a slight pressure value of 0.1 Pa was imposed on the pressure-inlet for all the cases, to generate a negligible velocity of around 0.3 m/s according to our simulation results.
The exhausts were released at the outlet vent with a diameter of 0.06 m at the back of every vehicle. In the real condition, the tailpipe was located at the left, the right or both sides of the car. For simplicity, our study assumed the locations of tailpipes were in the middle for all the vehicles, set as a velocity inlet with a speed of 3 m/s under all traffic conditions. CO2 was chosen as the indication of in-tunnel air quality. The mass fraction of air components released from gasoline engines were: O2 = 0.02, CO2 = 0.17, CO = 0.005, and the other component was regarded as N2, with an air temperature of 30℃. The air intake of the tunnel had a CO2 mass fraction of 0.006, corresponding to an approximate concentration of 400 ppm, with a temperature of 20℃.
The severe traffic jam with no vehicle motion was calculated under the steady state. While for the vehicle motion, given the process of exhaust dispersion from running vehicles was time-dependent, we regarded the vehicles running through a tunnel length (120 m) as a baseline cycle during which vehicles were still fully occupying the tunnel. Once the vehicles finished a cycle, the results of the whole flow domain were interpolated as the initial condition for the original case to run again. In that way the continuous running was approximated. The area-averaged CO2 concentration at tunnel outlet was monitored to find the time for the whole system to reach equilibrium. The time for different traffic conditions to become nearly steady are shown in Figure 2. Vehicle speeds of 10 km/h and 40 km/h with fan-on and fan-off conditions achieved nearly steady state at the fifth cycle. Therefore, the results after running for five cycles were used for the comparisons (results were obtained at the time of 200 s for 10 km/h run and 50 s for 40 km/h).
The area-weighted CO2 mass fraction variation at the tunnel portal with calculation cycles. One cycle equals to the duration for vehicles to run through 120 m under corresponding vehicle speeds.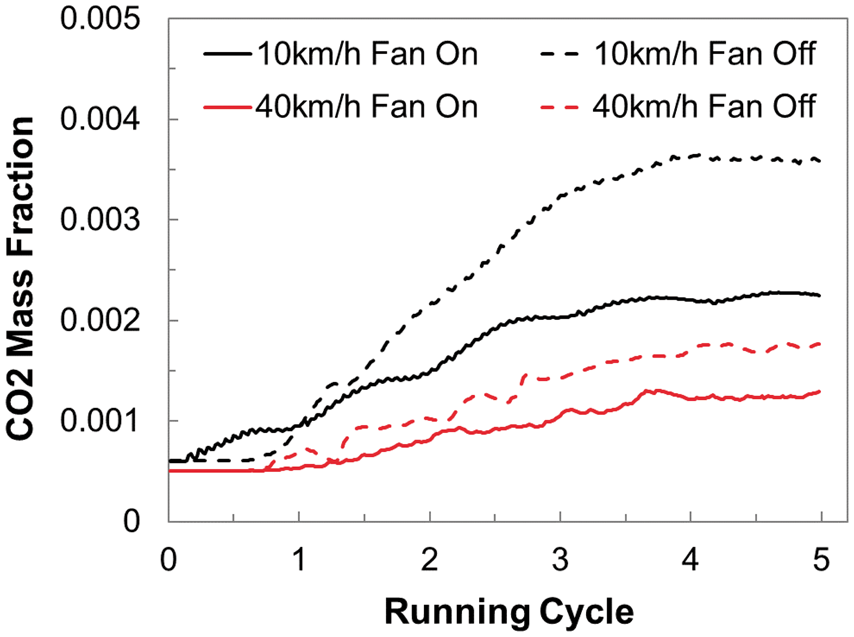
Results and discussion
Influences of the vehicle speed
The average CO2 concentration at the height of 1.0 m under three traffic conditions with the fan turned off are plotted in Figure 3. Under the severe traffic congestion (0 km/h), the average CO2 concentration increased notably along the tunnel length since no piston effect or mechanical ventilation was introduced into the tunnel. The highest CO2 concentration went up to 3000 ppm at the location about 40 m downstream, and reached the highest level of 6000 ppm inside the tunnel near the tunnel exit. As vehicles occupying the tunnel increased blockages to the in-tunnel airflow and led to more vitiated air accumulate inside the tunnel at the lower height (1.0 m) downstream the tunnel. Coming out of the tunnel exit (120 m), the CO2 concentration gradually diminished due to the diffusion of the ambient air on the open roadway.
The area-weighted CO2 concentration (ppm) at the height of 1 m under three traffic conditions.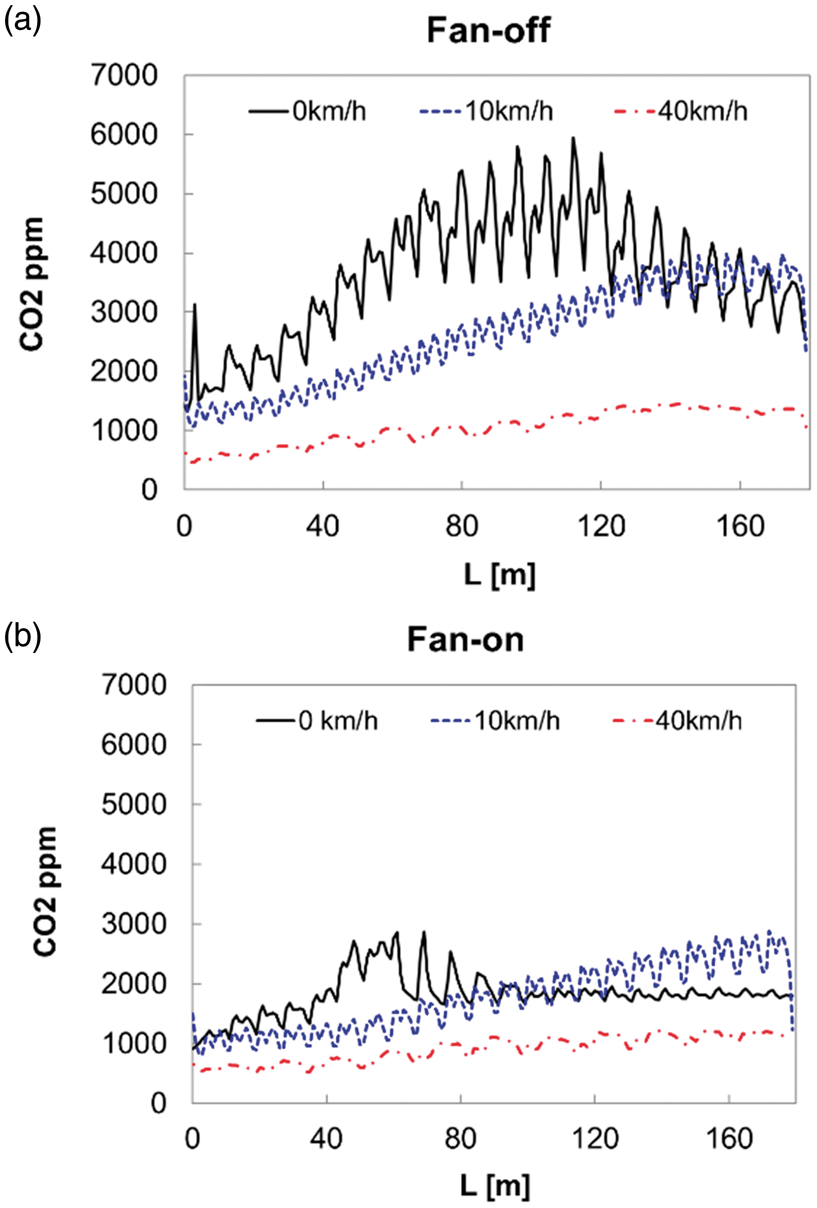
When vehicles started to travel along the tunnel, the in-tunnel airflow was pushed to flow which was referred to as the piston effect. The average velocities at the tunnel exit were 1.37 m/s and 4.49 m/s under vehicle speed of 10 km/h and 40 km/h, respectively, at the nearly steady state (t = 200 s) discussed above. With the piston effect, the in-tunnel concentration notably decreased. The vehicle speed of 10 km/h pushed contaminants to move downstream rather than to accumulate inside the tunnel that idling cars yielded. Under this low vehicle speed, the CO2 concentration at the height of 1.0 m reached about 3000 ppm at the exit, which were also a hazardous level for the environment. Air flow induced by vehicle speed of 40 km/h showed a higher capability to discharge emissions due to higher in-tunnel wind speed induced by higher vehicle speed, and also due to the halved number of vehicles running thus reduced the total emissions under the higher vehicle speed. Generally, the pollutant discharging under vehicle moving conditions showed an increasing trend along the downstream distance, even kept the same concentration level of CO2 after coming out of the portal. The piston effects obviously produced the jet stream from the tunnel exit portal into the ambient, for which the CO2 concentration continued the emission level out of the portal rather than a dilution as the idling cars experienced. By running the vehicles vitiated air emitted to the open roads might bring issues to the surroundings.
When the fan was turned on, an additional wind velocity alleviated the CO2 concentration level. At the exit portal of the tunnel, the CO2 concentration reduced by 53%, 34% and 16% when the vehicles were running at 0 km/h, 10 km/h and 40 km/h speed, respectively. Under severe congestion, the average velocity at the tunnel outlet was 0.30 m/s under the fan-off condition and 1.47 m/s under the fan-on condition. The mechanical ventilation kept the CO2 concentration around 3000 ppm comparing to the highest 6000 ppm under the severe traffic condition. But high emission concentrations still accumulated in the downstream part of the tunnel. Outside the portal the concentration was maintained at a lower level. This was related to the different airflow features induced by vehicle motion and mechanical fans, where fans induced airflow in the upper part of the tunnel while vehicles pushed the airflow at the lower height near the vehicles.
Velocity distribution and CO2 concentration
The velocity and concentration distribution through the middle plane of the cars (X = −2.1 m) under vehicle moving conditions are shown in Figure 4. The natural wind pushed by moving vehicles showed high velocities around the bodies, while the wind at the upper part of the tunnel were relatively stagnant. With an outlet velocity of 10 m/s, the fan-induced airflow generated confined jet-like airflow with high wind velocities at the ceiling but the velocities were lower around the vehicles. While the vehicle speed increased, the fan-induced airflow showed minor effects on the whole tunnel’s velocity distribution.
Velocity contours at the centre plane (X = −2.1 m) under vehicle speeds of (a) 10 km/h and (b) 40 km/h at fan-off and fan-on conditions.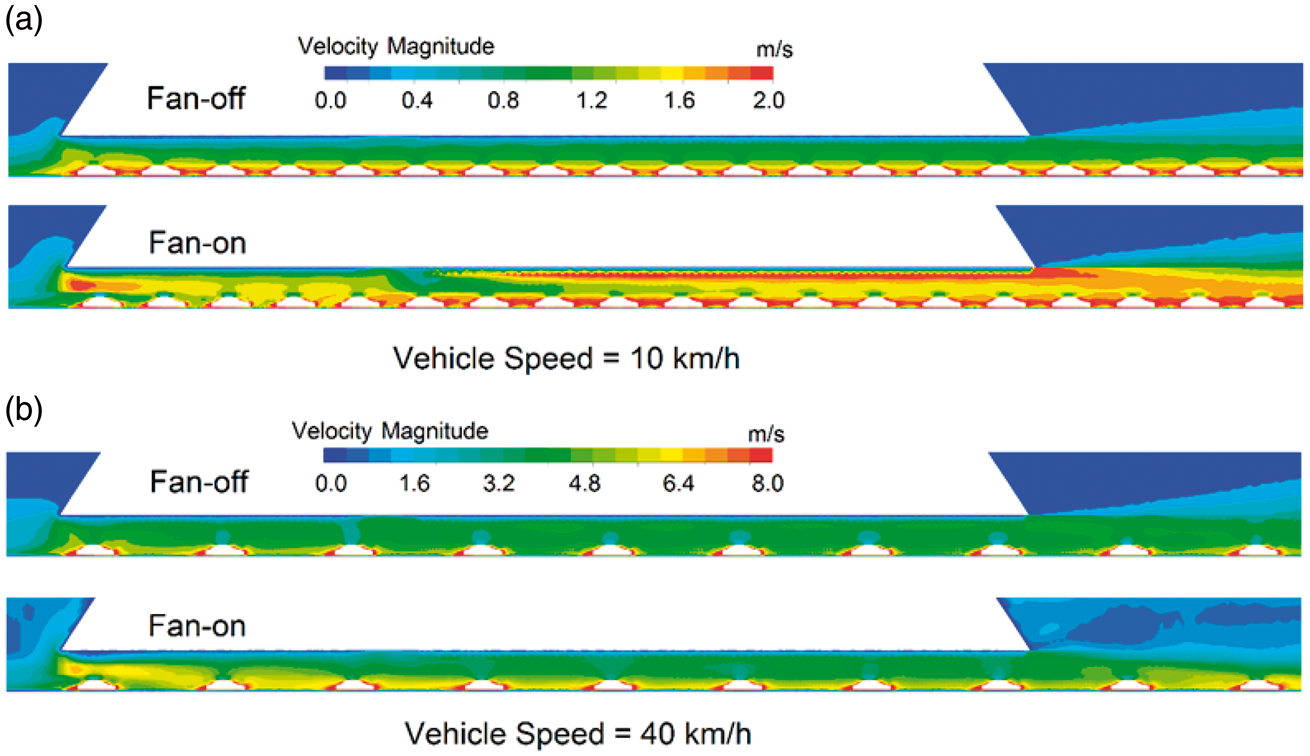
The CO2 distribution at the plane X = −2.1 m is shown in Figure 5. When the vehicle emissions depended merely on the piston effect (Figure 5(a)), the higher velocities around the moving vehicles pushed the exhausts to flow downstream the tunnel. However, vitiated air gradually accumulated at the downstream ceiling due to the thermal buoyancy and the low wind speed at the upper part of the tunnel. A high-speed vehicle (40 km/h) also faced the same problem that high concentration of CO2 gathered at the outlet, but it discharged the contaminants considerably well and only small regions with high CO2 concentration were found at the portal.
CO2 concentration at the centre plane (X = −2.1 m) under vehicle speeds of (a) 10 km/h and (b) 40 km/h at fan-off and fan-on conditions.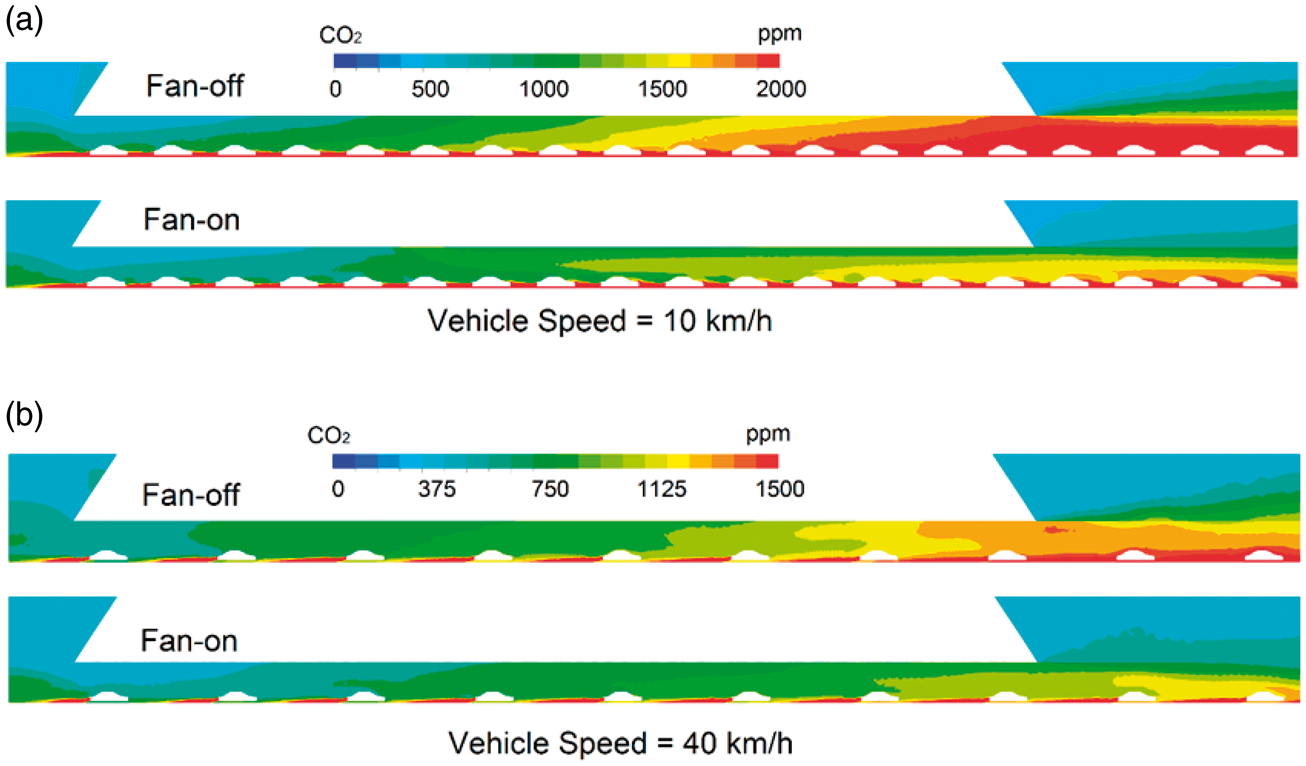
With the fan turned on and generation of higher wind velocities near the roof, the high level of CO2 concentration at the ceiling was discharged and the ascending due to buoyancy effect was overwhelmed. Finally, the contaminants were controlled within a lower concentration at the exit portal and the surrounding environment. Under a higher vehicle speed of 40 km/h that the fan-induced airflow was comparatively weak compared to the motion-induced wind, the piston effect was already adequate for keeping the in-tunnel CO2 concentration within an acceptable range. The mechanical ventilation effects showed significance in assisting the discharge when it was comparable to the average piston wind generated by the vehicle motion. While once the piston wind became larger (at 40 km/h), the mechanical ventilation became dispensable.
Conclusions
For short tunnels encountering traffic congestion, the CO2 concentration was numerically investigated under conditions of car idling and moving under low speeds. Under the idling condition with no traffic piston effect and mechanical ventilation, risky high CO2 concentration levels were found in the downstream region of the tunnel. The piston effect can discharge emissions adequately under a vehicle speed of 40 km/h, but a slower vehicle speed of 10 km/h encounters high CO2 concentration levels at the tunnel downstream and exit portal. With the additional mechanical ventilation, the CO2 level under idling condition was controlled at a lower level. For traffic speeds over 40 km/h, the ventilation effect of roof mounted fan was dispensable. Despite additional mechanical ventilation is not required for short tunnels, the results show a great need of electrical fan ventilation when vehicular piston effect is not sufficient under sluggish traffic conditions.
This study enables a better understanding of the vehicular emissions dispersion characteristics in roadway tunnels. The presented numerical approach can contribute to an improved design for the tunnel ventilation system with a minimized ventilation energy cost, and may assist health and safety regulators to advance the current in-tunnel pollution control policies.
Footnotes
Declaration of conflicting interests
The author(s) declared no potential conflicts of interest with respect to the research, authorship, and/or publication of this article.
Funding
The author(s) disclosed receipt of the following financial support for the research, authorship, and/or publication of this article: the Fundamental Research Funds for the Central Universities (Project ID: 106112016CDJCR211221), Natural Science Foundation of China (Grant No. 21277080), and Chongqing Postdoctoral Research Project (Project ID: Xm201331). Yao Tao also especially thank the scholarship provided by the China Scholarship Council.