
Abstract
Solid particle erosion is a micro-mechanical process that removes material from a surface by repeated impact of entrained particles in the flow. Erosion is a leading cause of failure in fluid handling equipment such as pumps, pipes, valves, and fittings. The S-bend geometry is used to redirect flows in automotive, chemical processing, oil, gas, and food handling industries. An investigation was conducted using both computational fluid dynamics analysis and experimental methods to identify the location of maximum erosion. Three S-bend geometries with 12.7 mm inside diameter, r/D ratio of 1.5, three different air velocities and six different particle sizes were used in the current study. The experimental test section was of 12.7 mm inside diameter, r/D ratio of 1.5, and used 150 and 300 µm particle sizes.
Introduction
Solid particle erosion is a complex, micro-mechanical process that gradually removes material from the impacting surface by continuously repeated impact of small solid particles entrained in the flow. Erosive wear damages in particulate gas–solid flows have been observed in industries such as oil and gas pipe lines, aircraft, cyclone separators, boilers, fluidized beds, gas turbines and coal gasification processes. Particle impact induces erosion and has been recognized as one of the leading causes of premature and unpredicted failure modes in oil and gas pipelines. 1
A number of factors contribute to the severity of erosion. These factors include impact velocity, particle size, particle shape, and mechanical properties of both the target material surface and the flow velocity. 1 Solid particle impact velocities were found as the most significant factor influencing erosion by a number of investigators and industries. Several investigations revealed that the erosion rate is proportional to the exponent of the solid particle velocity or the fluid velocity surrounding the particles. 2 The synergistic influences of the abovementioned factors magnify the complexities in accurate prediction of magnitude and locations of maximum erosion. A recent transformative development of computational fluid dynamics (CFD) analysis methods provides an effective approach to analyze the effects of these parameters in complex flow conditions. CFD models are based on Navier-Stokes equations which include the first principles of mass, momentum, and energy conservation along with user-defined functions for specific applications. 3
The most general model for multiphase flow is the Eulerian-Eulerian model, which is based on the principle of interpenetrating continua. It also has continuous-dispersed and continuous-continuous systems capabilities. Each phase is controlled by the Navier-Stokes equations. The current investigation is based on CFD analysis of maximum erosion locations with experimental validation to provide a better understanding of maximum erosion locations in an S-bend.
Literature review
Several investigations have previously been attempted in order to address the failure modes and effects caused by erosion in particle laden flows using analytical, computational, experimental and mechanistic modeling approaches. One investigation of interest, performed by Wang and Shirazi, 4 showed that a long radius bend with an r/D>1.5 (where r is the elbow curvature radius and D is the diameter of pipe) has smaller impingement angles than in a short radius bend. Additionally, their results showed that a long radius elbow had lower erosion than the standard elbow ratio with r/D = 1.5. Another important outcome of previous investigations is the development of a mechanistic model that predicts erosion in elbows with multiphase flow (gas–liquid–solid). 5
When the bend was less than 90°, the erosion loss was smaller, but the surface roughness increased due to vertical particle impact. 6 Several investigations used by CFD to predict erosion behavior at different geometries, with different solid particles, and in different fluids, showed effective methods for erosion study.1,7 A previous CFD analysis of U-bend geometry showed a location of maximum erosion at 182° from the inlet at 15.24 m/s air velocity and sand of 50 µm in size. 1
The bend’s radius of curvature and the Reynolds number are the lead parameters in determining the strength of swirling flow. 8 The flow in multiple bends is more complex than in single bends due to the interaction of flow dynamics within the two bends. The great effect of a bend sweep angle and Reynolds number was studied by Niazmand and Jaghargh 9 , and their results showed that the Reynolds number is generally based on the diameter of the pipe, but in S-bend or some other multiphase bend, the sweep angles also have a large influence on flow. Small sweep angles were found to suppress the swirling structure in the second bend while large angles could result in strong vortices in the second bend that potentially diminish the intensity of vortices in the first bend. Additionally, an adverse pressure gradient always occurs upstream from the outer wall of the first bend in an S-bend. Whether it occurs at the transition of two bends along the second bend outer wall or not depends on the Reynolds number, sweep angle, and curvature ratio. The effect of the ratio of curvature on erosion in a bend was shown in many previous research endeavors. 10 The maximum mass transfer enhancement is found to increase as the bend radius to diameter ratio (r/D) is decreased due to the increase in turbulence levels. Experimental investigation of erosion in an S-bend elbow at standard ratio (r/D = 1.5) shows the location and magnitude of maximum erosion at different velocities and particle sizes. In addition, analysis of erosion in an S-bend elbow was compared with experimental results showing good agreement. 10 Wong et al. 11 conducted long-term erosion of a flat plate with 80 m/s air velocity with 150–300 µm sand at 0.030 kg/s sand rate. Chen et al. 12 performed CFD simulations and experimental validation on elbows and plugged tees with a curvature ratio 1.5 and relative plugged length of 1.5, respectively. Erosion predictions and experiments performed at three different air velocities (50,100, and 150 ft/s) using an aluminum specimen showed that a plugged tee had less erosion than a standard elbow with r/D = 1.5. Mills and Mason 13 reported the process of erosion and location of maximum erosion in a bend for 70 and 230 µm sands. No significant difference in magnitude and location of erosion was observed for the above two particle sizes. Fan et al. 14 reported the importance of maintaining erosion test conditions to reduce measurement uncertainties associated with mass loss measurements when measuring erosion rates. Horii et al. 15 designed a new bend by expanding the diameter fivefold in a 90° bend to investigate the effects of erosion. The investigation results showed 42 times less erosion in the new bend when compared to a conventional bend for same air velocity and flow conditions. Their results added to the generally accepted understanding of particle velocity being the most significant factor for erosion.
Present work
Previous investigations in the area of solid particle erosion were focused on the effect of particle size on the magnitude of maximum erosion. A limited number of studies reported the location of maximum erosion for S-bend geometry. Therefore, the current work reported in this paper focused on evaluating the location of the maximum erosion in S-bend geometry with different air velocities and particle sizes. The current work included both computational and experimental investigation of erosion. The limited CFD results and experimental results showed reasonably good agreement with the available literature data.
CFD approach and analysis
Recently, due to the rapid development and increasing number of computational resources, the CFDs technique has proven to be a powerful and effective method to predict and analyze the result of fluid flow through a structure. The full set of fluid dynamic balance equations, usually in Navier-Stokes formulation for momentum balance, can be solved by CFD codes. A commercial CFD code, FLUENT
16
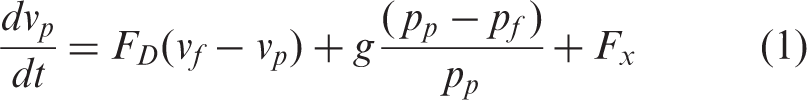
, was used in the current study to solve the balance equation set via domain discretization. The code used a control volume approach to convert the balance partial differential equations into algebraic equations and solved numerically. The equation of motion for a discrete phase dispersed in the continuous phase is solved by the discrete phase model (DPM) option. This option adopts a Lagrangian frame of coordinates and leads to the computation of particle trajectories. The force balance equation on the particle is solved using the local continuous phase conditions as described by the following equation
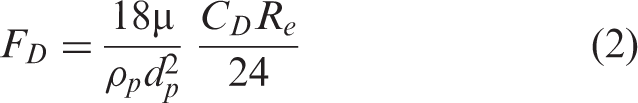
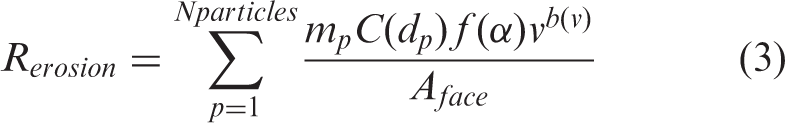
The solid particle erosion rates at wall boundaries were determined by the following equation17
S-bend geometry
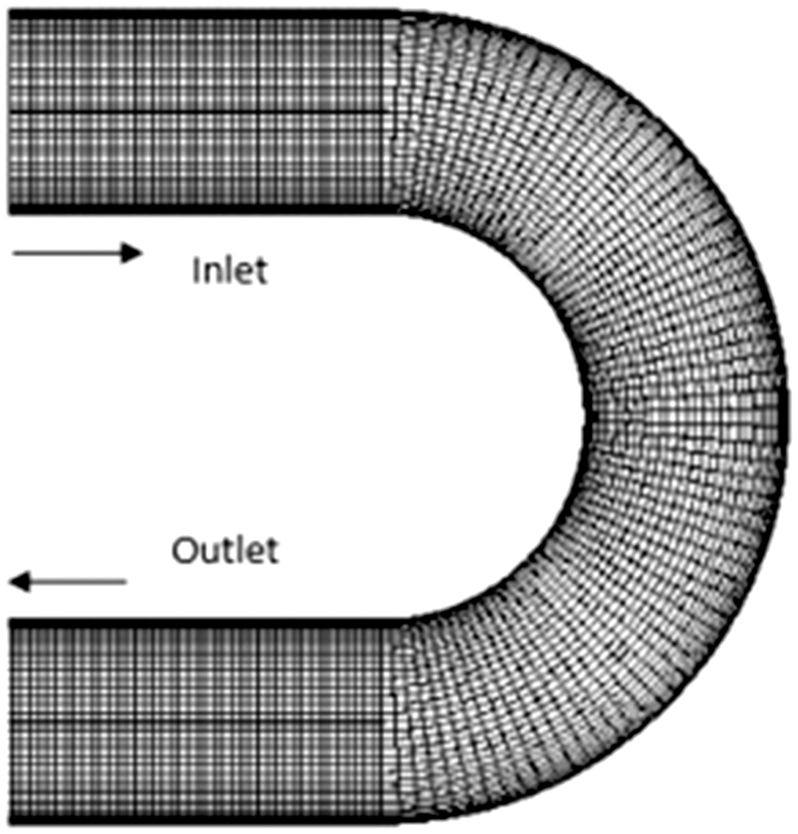
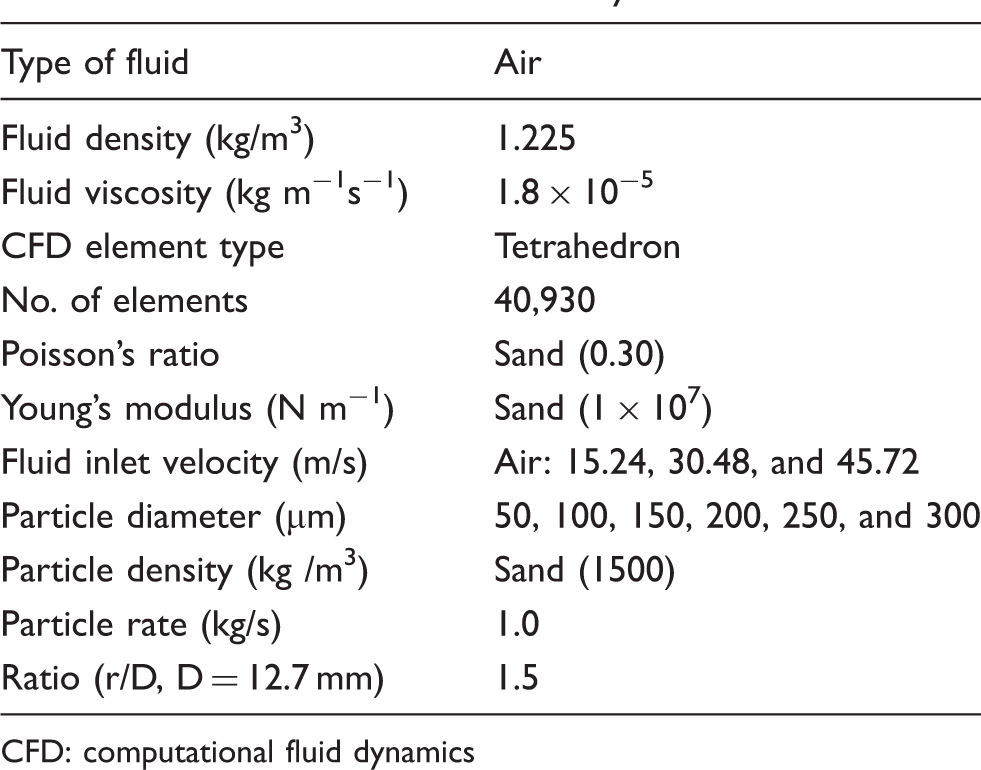
Three S-bends with 12.7 mm pipe diameter, r/D=1.5 were arranged with 50.8 mm of straight pipe sections upstream and downstream of the bends. The ratio (r/D) of 1.5 is shown in Figure 1. Due to the fact that the core of the turbulent pipe flow was reasonably uniform, the grid size in this region was relatively coarse. For efficient discretization, the geometry of the fluid’s flow area was divided into three parts: upstream, downstream, and central parts. The meshed S-bend with ratio of 1.5 is shown in Figure 2. The parameters used in the CFD analysis are listed in Table 1.
Schematic diagram of S-bend geometry. Meshed S-bend geometry with flow directions. Parameters used in CFD analysis. CFD: computational fluid dynamics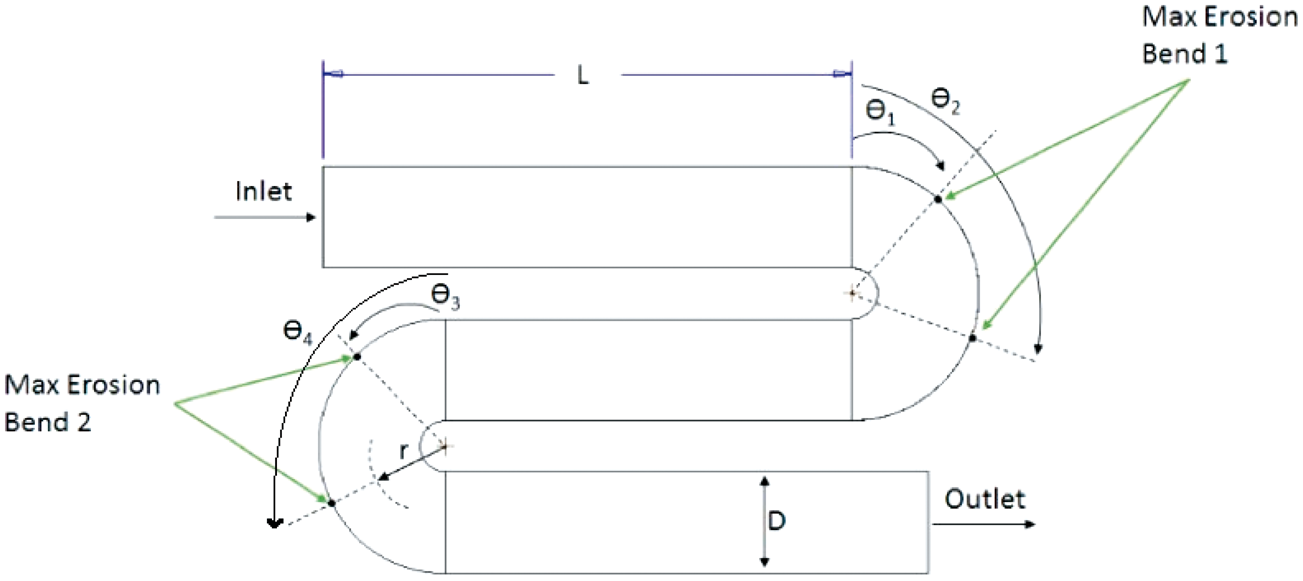
CFD analysis
CFD analyses were performed for the conditions listed in Table 1 to determine the magnitude and location of maximum erosion of the S-bend. As Figure 1 showed, the bend near the inlet was defined as bend 1 and the bend near the outlet was defined as bend 2. The location of maximum erosion is shown as angles measured from the start of the bend at the end of the straight pipe section.
A CFD output plot of the location of maximum erosion with 45.72 m/s air velocity, 300 µm particle size and ratio of 1.5 is presented in Figure 3. Erosion was observed in both bend 1 and bend 2. Furthermore, erosion was observed in two locations in bend 1 and two locations in bend 2. The location of maximum erosion for this condition was 34.8° and 157° in bend 1 and 46.5 and 150.1° in bend 2.
Contours of DPM erosion (kg/m2/s) at 45.72 m/s air velocity, 300 µ particle r/D=1.5.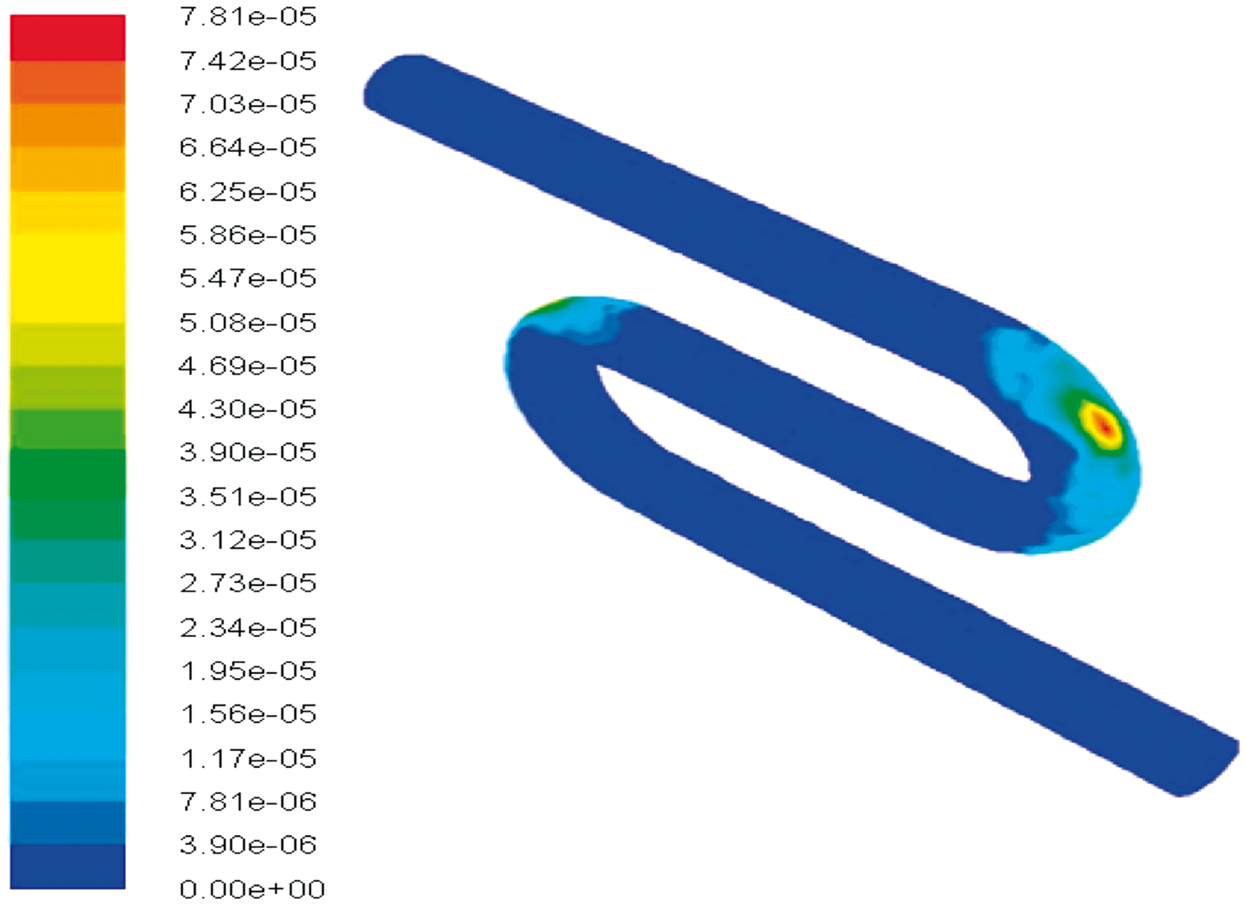
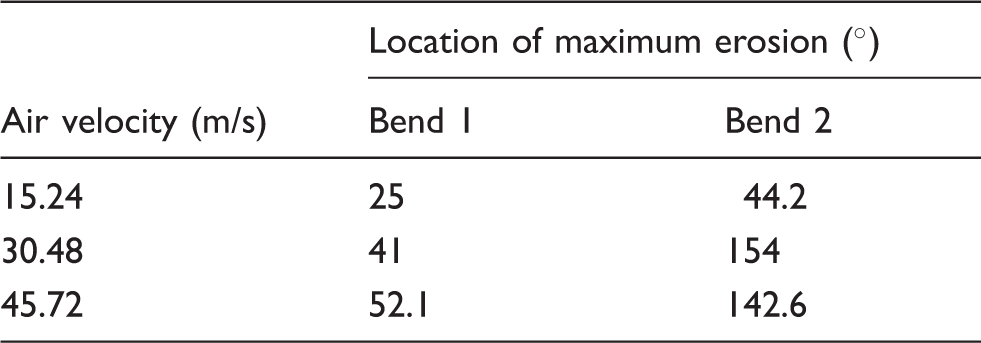
The effect of air velocities and particle sizes on erosion is presented in Figure 4(a) and (b). The analysis results showed maximum erosion at 15.24 m/s with 100 µm sand size. The lowest erosion at 15.24 m/s with 50 µm particles was observed in the same locations as in previously tested conditions. There were no significant differences in erosion patterns with particle sizes between 150 and 300 µm at all three air velocities. The erosion locations identified were those closer to the inlet of the bend. Maximum erosions were observed in two different locations in each bend of the S-bend at all air velocities with r/D=1.5. The locations were found at 20–73° for different particle sizes and velocities. For 200 -µm particle size, the location of maximum erosion identified is listed in Table 2. Figure 4(a) shows higher magnitude of erosion at higher fluid velocities with all particle sizes except 100 µm. The possible reason may be different particle-to-particle and fluid-to-particle interactions at 100 µm particle sizes that resulted in different impact characteristics of particles that causes erosion. The locations of maximum erosion were random with no trends observed with different particle sizes and fluid velocities. This will be further investigated using a particle image velocimetry system in the future.
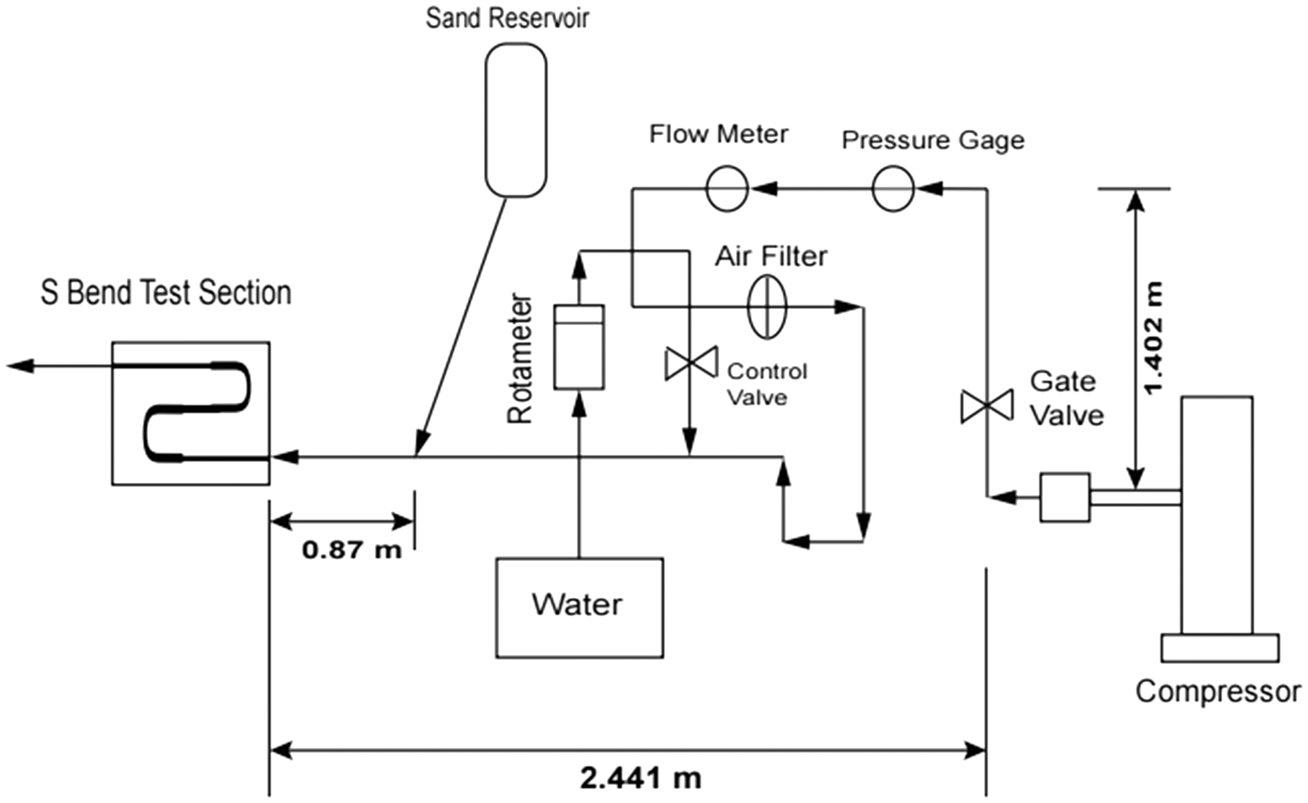
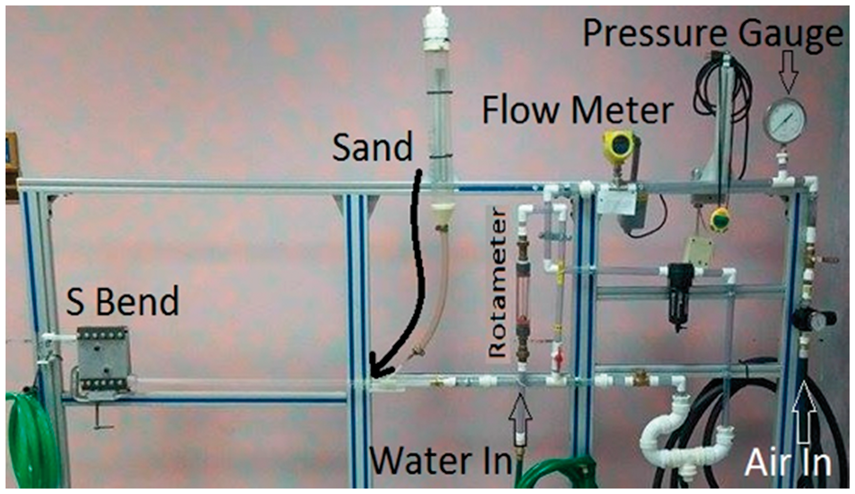
(a and b). Effect of particle size and velocity on magnitude and location of erosion in S-bend geometry. Schematic of S-bend multiphase test loop. Picture of S-bend multiphase test loop. Location of maximum erosion for 200 -µm particle.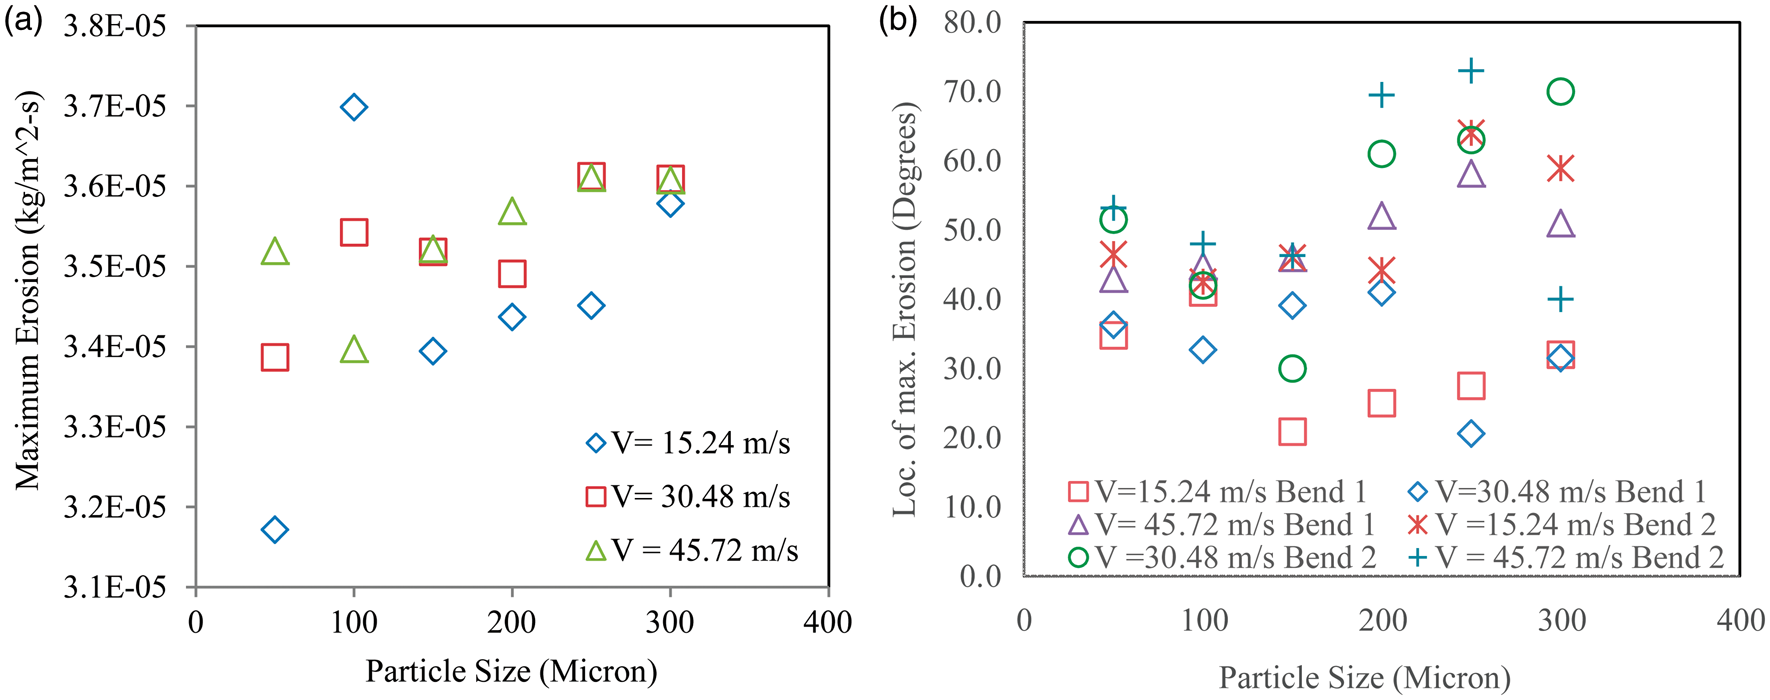
Experimental investigation
Air velocities of 15.24 m/s, 30.48 m/s, and 45.72 m/s were used with 150 and 300 µm sands during the experiment. The test loop was designed to enable conducting experiments with air–water–sand mixtures and different r/D ratios in the future. The location of maximum erosion was determined by measuring the location of paint removal in the specimen. The schematic and picture of the s-bend multiphase test loop is shown in Figures 5 and 6.
Experimental procedure
A multiphase test loop was designed and constructed using clear plastic pipe with an inside diameter of 12.7 mm for flow visualization during the experiments. Air was supplied from an 18 SCFM compressor with a pressure gauge, an ST75-2AEBH00 gas flow meter, an FL-73 series water flow meter, an air filter model F74G-4AN-QPB, and a flow regulator model R-130-15. The S-bend test section was designed using two aluminum plates with half-pipe sections in each plate. The two s-bend test section halves were bolted together to resemble a 12.7 mm diameter S-bend pipe section. Before the experiment, the internal surfaces of the S-bend test sections were painted using three layers of epoxy paint with approximately 1.5 mm thickness of each layer. The location of maximum erosion was determined by measuring the location of paint removal in the specimen.
For this experiment, silica sand was sieved in order to be separated into 150 and 300 µm sizes using multiple metal strainers. Sand was injected from a reservoir to the test section through a 1.0 cm nozzle by applying positive pressure above the reservoir. The positive pressure at the top of the sand reservoir was necessary in order to ensure continuous flow of sand at a controlled rate and to avoid backflow of sand to the reservoir. The concentration of sand particles in the flow was approximately 2%. The gas flow rate was monitored and carefully controlled using a valve and flow regulator. The sand rate was monitored using a stopwatch and visual observation of sand levels in the clear plastic sand reservoir. The sand injected into a 12.7 mm pipe was carried by the flowing gas as a gas–sand mixture to the specimen impacting wall of the internal S-bend pipe configuration.
After flowing through the S-bend test section, the gas–sand mixture was discharged to the atmosphere and collected in a container for disposal. The sand was not reused in the experiment because particle sizes may change after impact. The distance between the sand injection point and the S-bend test section was 67 mm and is equivalent to 5.5 times the pipe diameter.
Experimental results
Each experiment was repeated three to four times to reduce measurement uncertainties and ensure repeatability of the test. After each experiment, the S-bend specimen was removed from the test section, disassembled for observation and the location or locations of paint removal were measured.
Figure 7(a) to (c) shows the location of maximum erosion at different air velocities with 300 µm sand sizes. Figure 7(a) shows the location of maximum erosion at 20–34° from inlet in bend 1 with an air velocity of 15.24 m/s. With an air velocity of 30.48 m/s, two different erosion locations were detected at 15–49° and 110–136° in bend 1. With an air velocity of 45.72 m/s, two different locations of erosion were observed at 19–69° and 106–159° in bend 1 and one additional location of erosion was observed at 18.5–55° in bend 2. Figure 7(d) to (f) shows the location of maximum erosion at different air velocities with a 150 µm sand size. Figure 7(d) presents the location of maximum erosion to be 14–40° in both bends 1 and 2. With a 30.48 m/s air velocity, the maximum erosion locations were observed at 21–64° in bend 1 and 21–41° in bend 2. At 45.72 m/s, the maximum erosion locations were observed at 21–61° in bend 1 and 12–41° in bend 2, respectively.
Experimental results of location of maximum erosion: (a) microns sand air velocity 15.24 m/s, (b) microns sand air velocity 30.48 m/s, (c) microns sand air velocity 45.72 m/s, (d) microns sand air velocity 15.24 m/s, (e) microns sand air velocity 30.48 m/s and (f) microns sand air velocity 45.72 m/s.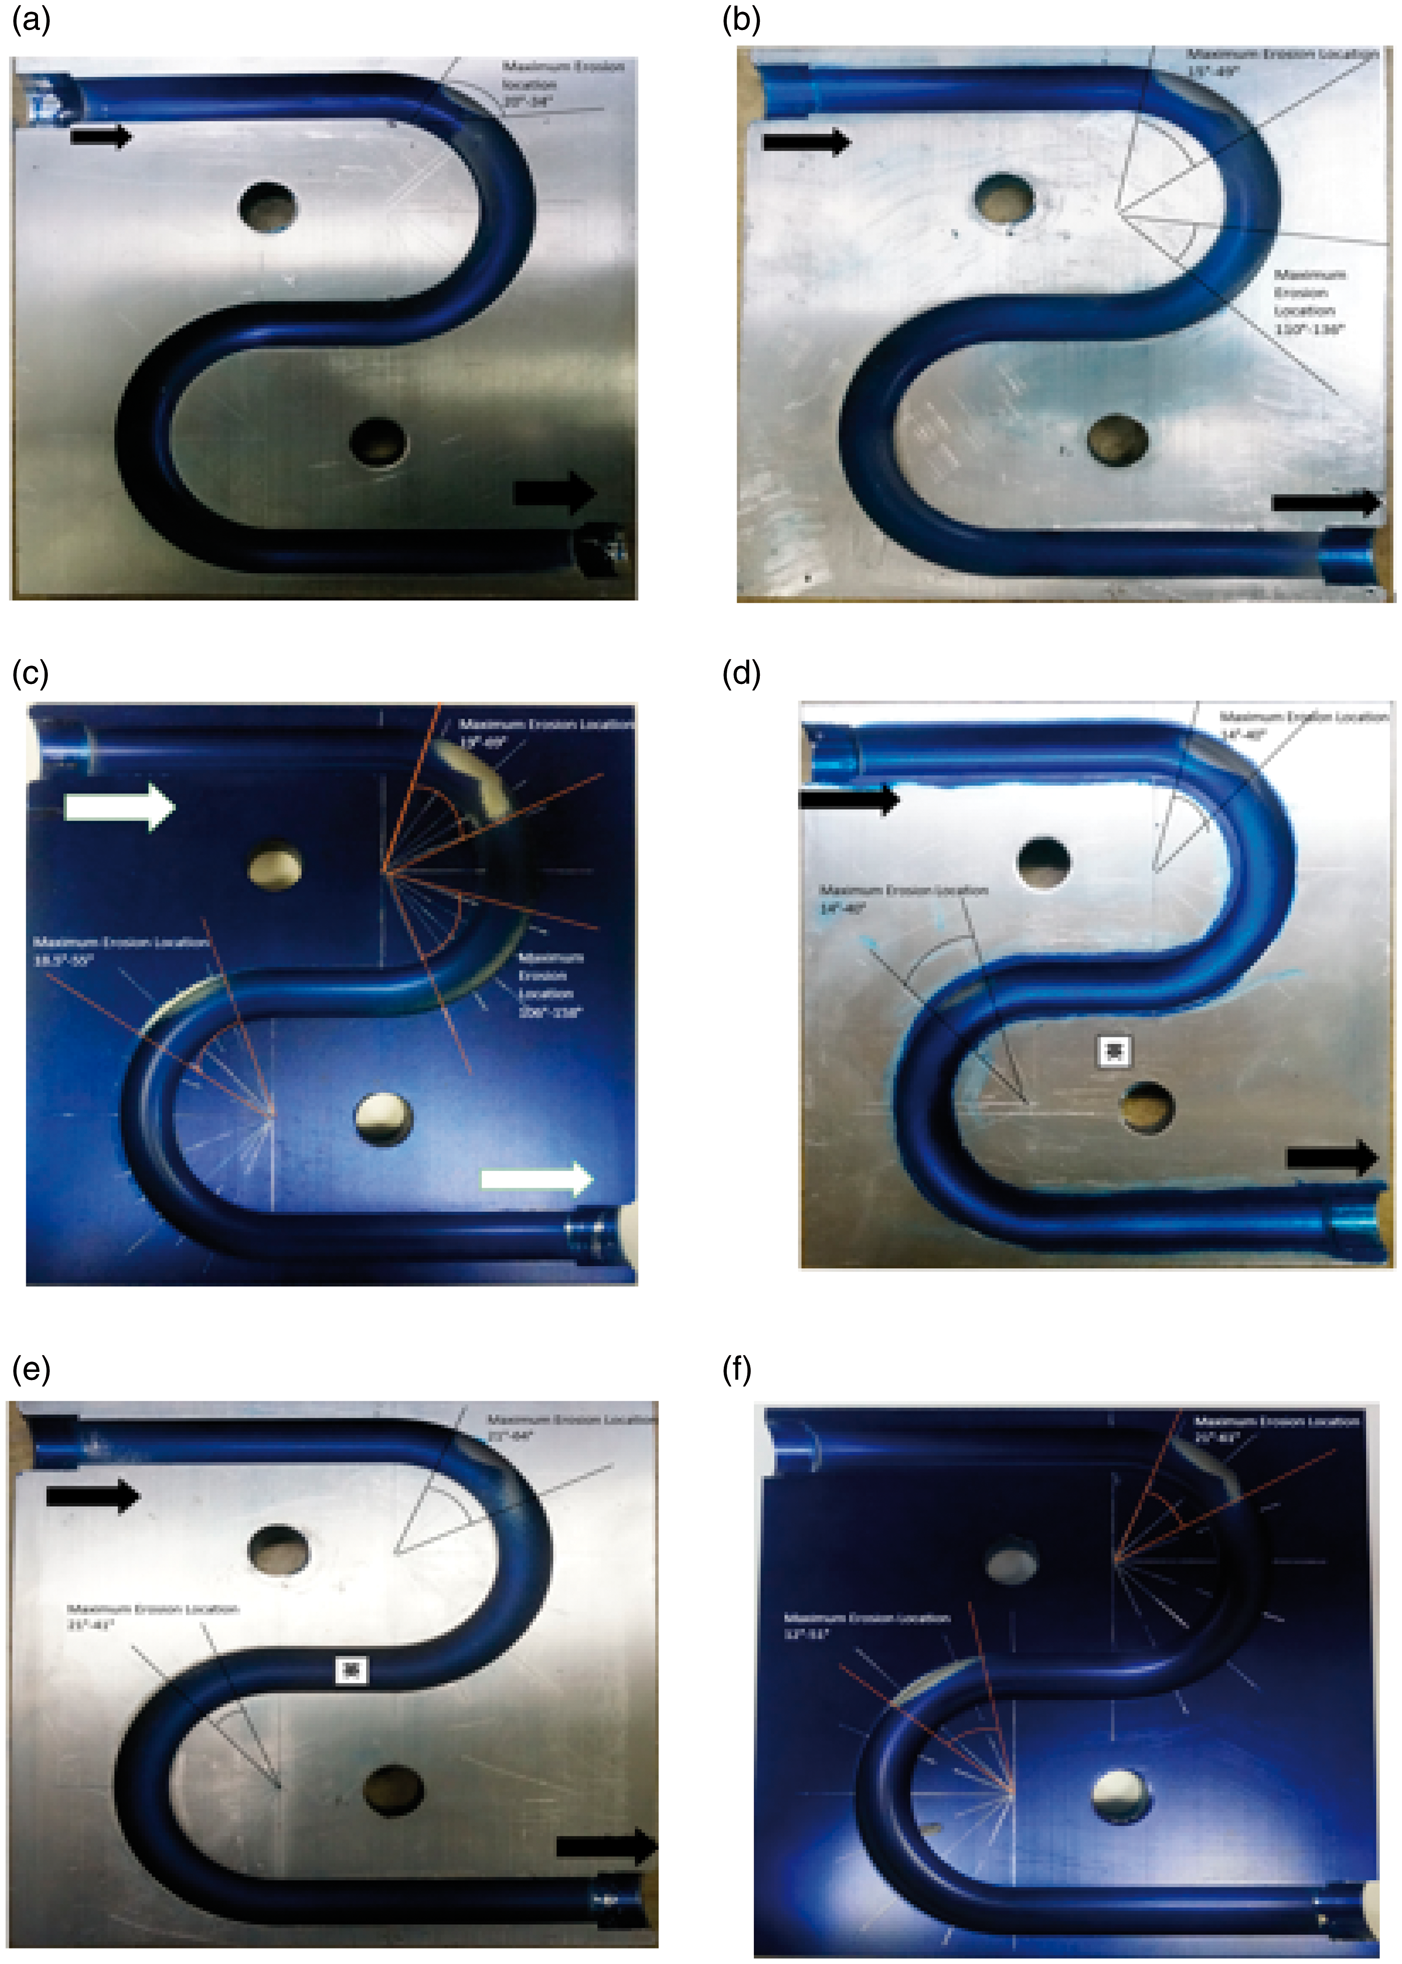
Comparison with literature data
Comparison of available literature data.
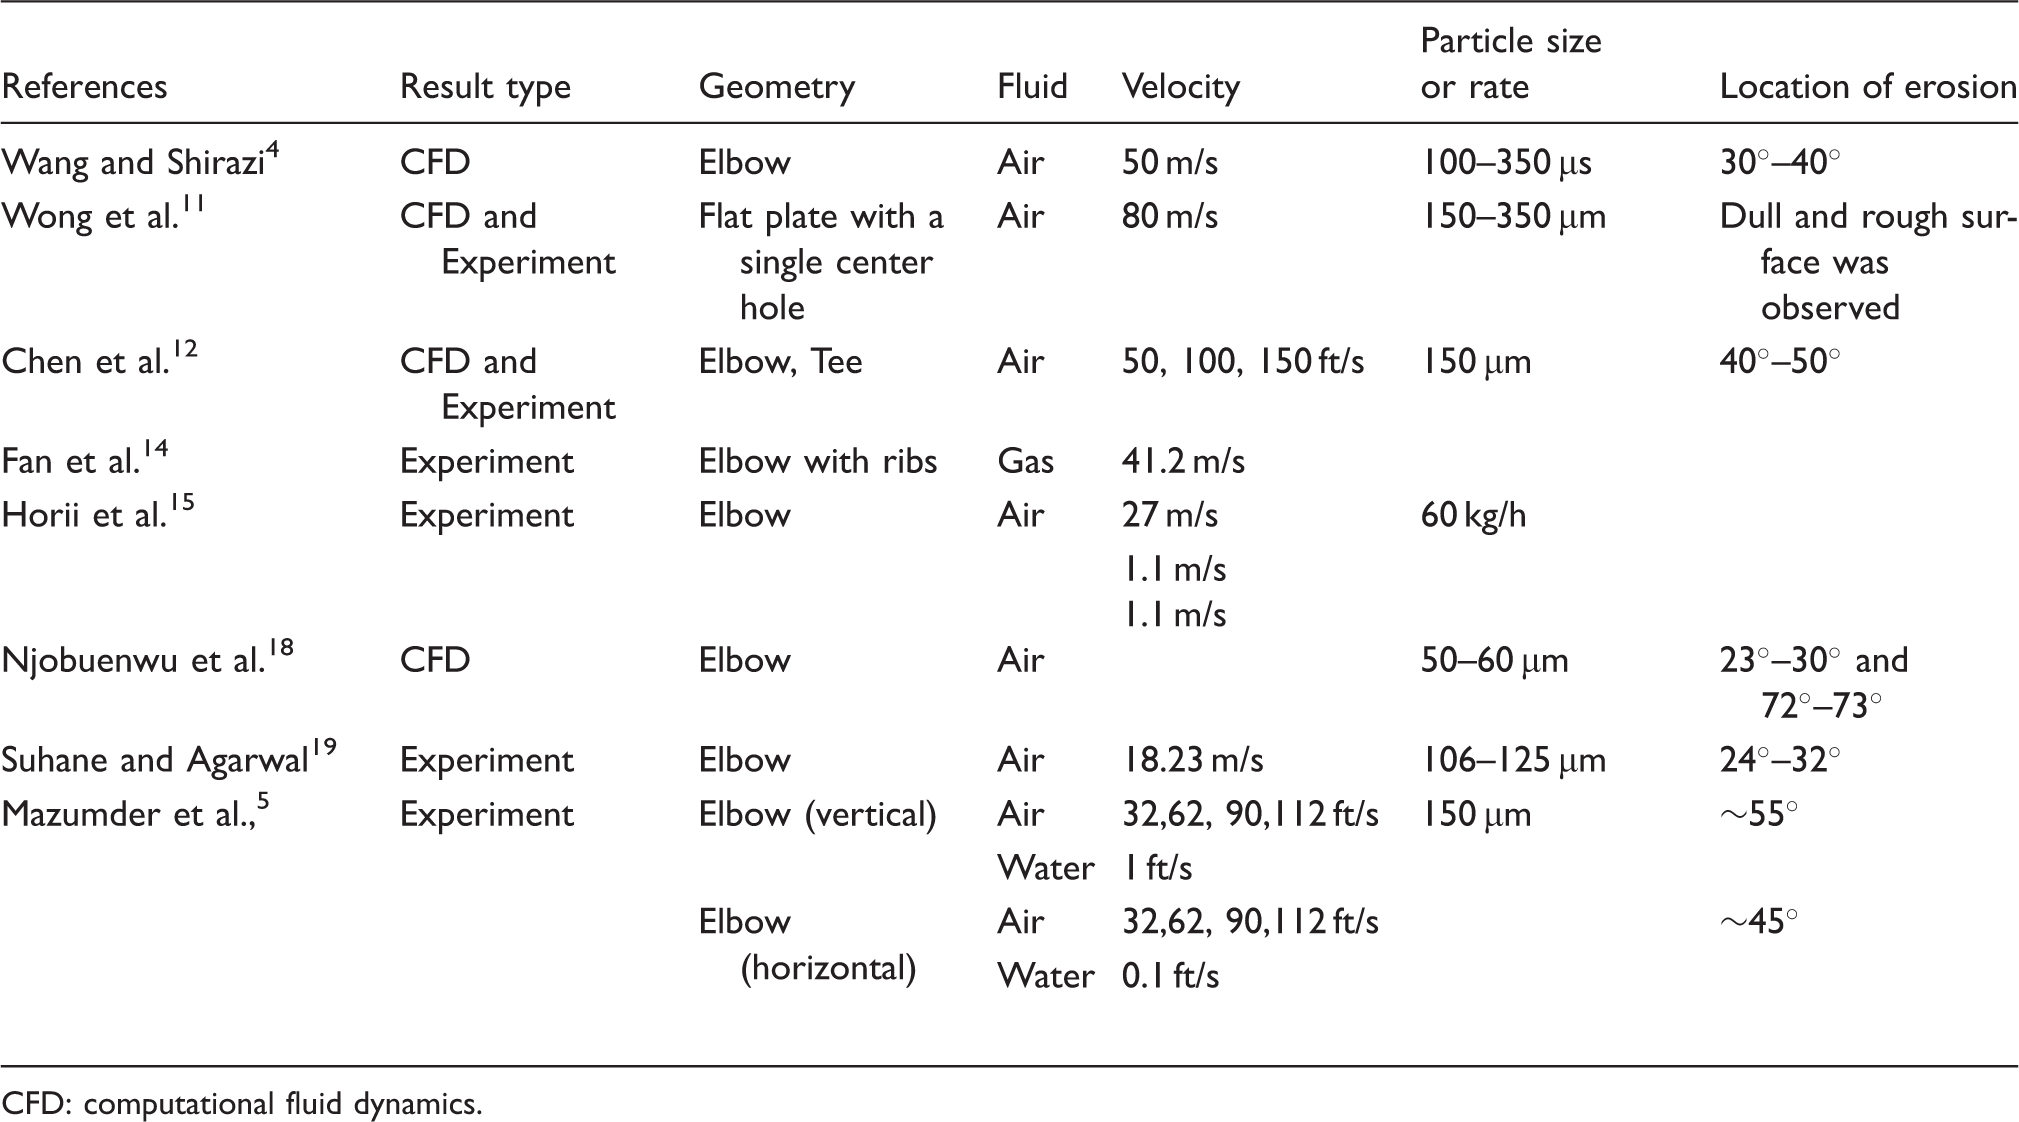
CFD: computational fluid dynamics.
Comparison of current CFD and experimental results.
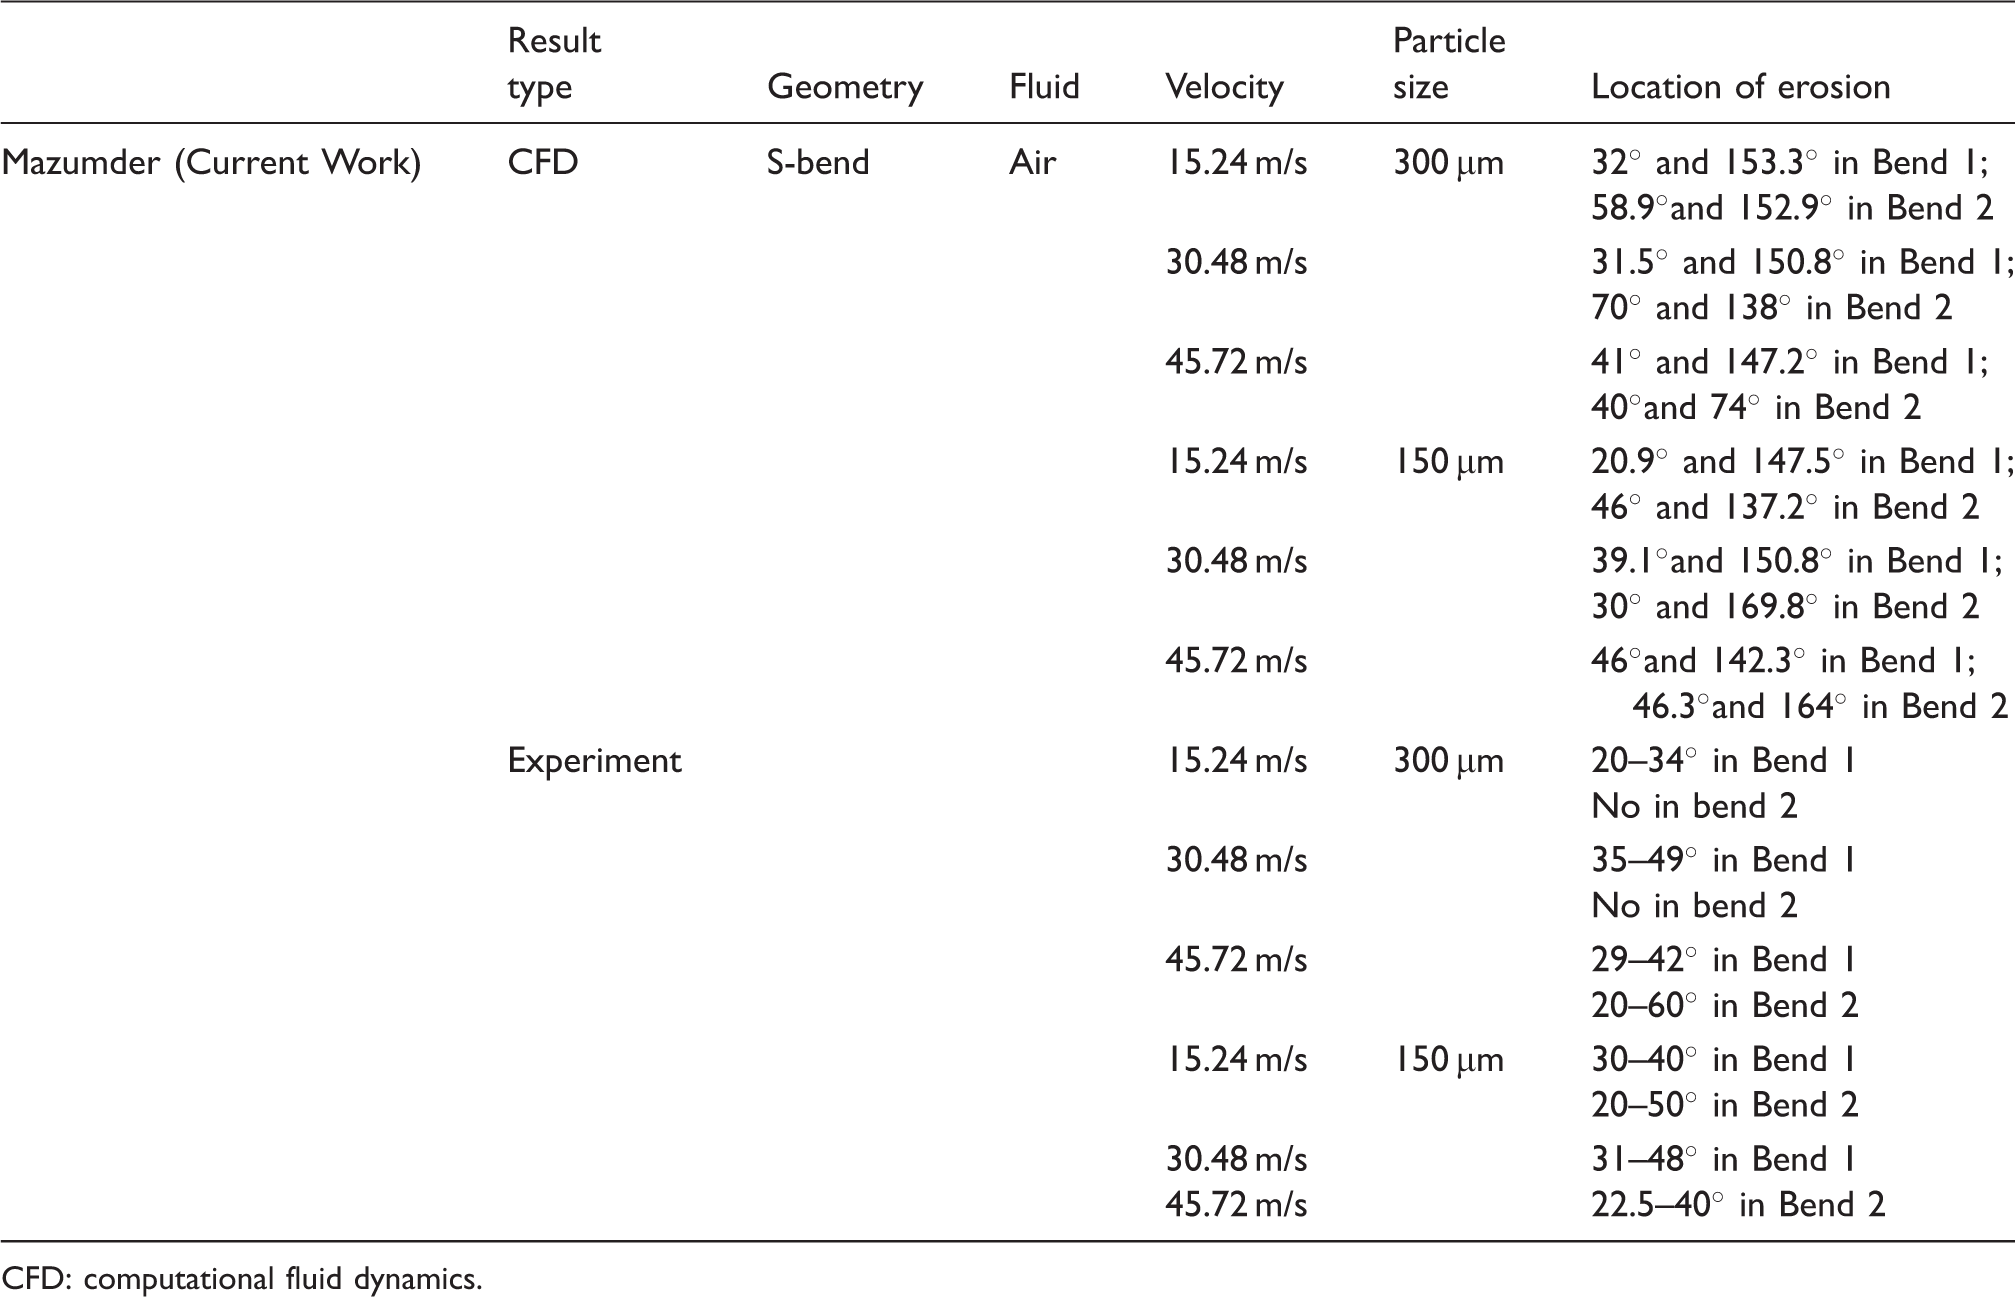
CFD: computational fluid dynamics.
The results of CFD and experimental investigations are presented in Table 4 and show reasonably good agreement. The agreements are due to considerations of several factors in the numerical model such as interactions between the discrete particle phase and the fluid phase, particle impact velocity that causes erosion, mesh sensitivity analyses, etc. Uncertainty analysis of instruments, data acquisition and repeatability of the experiments were conducted to assure higher level of reliability of the experimental results. For example, at 15.24 m/s air velocity and 300 µm sand size, CFD analysis showed maximum erosion at 32° as compared to the 20–34° observed in the experimental results. Similarly, at 30.48 m/s air velocity, the CFD result was 39.1° and the experimental result was 30–40°. Comparison of all other conditions can be found in Table 3.
Summary and conclusion
An investigation was conducted to determine the location of maximum erosion in S-bend geometry. CFD analyses were performed for three different S-bend geometries with r/D ratios of 1.5. A CFD simulation was performed using a comprehensive procedure that included flow simulation, particle tracking and erosion calculation. To validate the CFD results, an experimental investigation was performed by designing and developing a test section with a 12.7 mm diameter pipe and an S-bend test section with r/D ratio of 1.5. CFD analysis and experimental investigations were conducted at 15.24 m/s, 30.48 m/s and 45.72 m/s air velocities with 150 and 300 µm sand particles.
The CFD results were compared with the experimental results, showing good agreement. The results were also compared to available literature, showing a wide range of results. The dispersion of literature results can be explained by different geometries, different experimental conditions and several other factors that were not defined in previously published research results.
In spite of the limitations associated with the current study, the present work will be able to shed light on variations of maximum erosion locations in S-bend and other similar geometries. This will enable research and design engineers to recognize that the location of maximum erosion is equally important as the magnitude of erosion in designing fluid handling equipment with a particulated multiphase flow.
Footnotes
Acknowledgements
The authors would like to acknowledge the work performed by mechanical engineering students, Kawshik Ahmed and Siwen Zhao.
Declaration of conflicting interests
The author(s) declared no potential conflicts of interest with respect to the research, authorship, and/or publication of this article.
Funding
The author(s) disclosed receipt of the following financial support for the research, authorship, and/or publication of this article: The work presented in this paper was supported by an RCAC grant, U042784 from the office of research, University of Michigan-Flint, USA.