
Abstract
This paper investigates the impact of structural flexibility on the thermal soaring performance of a mini-UAV wing. Three optimization problems are formulated to identify the optimal set of structural parameters that maximize energy extraction in both steady and unsteady soaring scenarios. The ASWING aeroelastic simulation tool is first validated experimentally and then employed to solve these optimization problems. Results suggest that increased structural flexibility yields significant benefits only in unsteady soaring (dolphin-kick strategy), but not in steady thermal soaring. For the latter, the apparent performance gains from structural optimization stem more from an effective change in the rigid geometry than from actual aeroelastic advantages. Furthermore, it is shown that active pitch control can yield equal or superior benefits compared to passive structural adaptations. These findings highlight the limitations of flexible wing designs for general-purpose soaring UAVs and suggest that robust aerodynamic geometry coupled with smart control may be a more practical design direction.
Introduction
The UAV market has seen a remarkable surge over the past two decades, largely due to the shrinking size of internal electronics. Drone manufacturers prioritize two key elements—extended flight duration and maximum payload—to stay competitive. Enhancing a UAV’s range and efficiency involves various methods and technologies. By leveraging a multidisciplinary optimization tool that integrates different devices and approaches, manufacturers can craft an ideal design.1–5 To mitigate payload penalties and reduce mass, using fewer materials in the aircraft’s structure becomes crucial. Additionally, aerodynamic efficiency often favors high aspect ratio wing configurations, especially for long-endurance UAVs that require flexibility in their design to accommodate significant deformations.
Even after achieving optimal design, there’s potential to further extend a UAV’s endurance by tapping into the surrounding environment for additional energy sources. Techniques like thermal soaring hold promise in significantly expanding both the range and endurance of existing drones.
Recent advances in autonomous soaring have explored various methods to exploit atmospheric energy, particularly thermal updrafts, to extend UAV endurance. Studies by Anderson et al. 6 and Raymer et al. 7 demonstrated the feasibility of long-endurance flight through autonomous thermal tracking and optimization algorithms. These works established the foundation for integrating thermal models into UAV guidance systems. However, these approaches primarily focus on flight control and thermal exploitation rather than on how the UAV’s structural flexibility influences energy harvesting. Some earlier works, like Mai, 8 have suggested that aeroelastic effects could aid energy capture, yet a comprehensive, optimization-based analysis of flexible UAV structures in the context of thermal soaring remains underexplored. This paper addresses that gap by proposing and solving structural optimization problems tailored to both steady and unsteady soaring conditions.
Thermal soaring has gained considerable attention as a technique to extend the endurance and range of UAVs. 9 This method involves utilizing rising columns of warm air, known as thermals, to gain altitude and sustain flight without expending onboard power.
Researchers have explored the application of thermal soaring in UAV operations. Studies by Raymer et al. 7 and Anderson et al. 6 delve into the principles of thermals and their suitability for autonomous soaring. They emphasise the potential for improved endurance and expanded mission capabilities in UAVs through efficient exploitation of these atmospheric phenomena.
Moreover, advancements in sensor technologies and onboard systems have enhanced UAVs’ ability to detect and utilise thermals effectively.
Despite its promising potential, challenges remain in optimising the utilisation of thermal soaring in various environmental conditions. Research efforts by Smith et al. 10 and Johnson et al. focus on developing adaptive control strategies and modelling techniques to navigate and exploit thermals efficiently under changing atmospheric conditions.
In conclusion, thermal soaring stands as a promising technique to extend the endurance and range of UAVs, with ongoing research aiming to refine strategies, algorithms, and control systems for effective implementation in diverse operational scenarios.
The contribution of this paper is to provide an insight on the benefits or drawbacks brought by the flexibility of a UAV on its thermal soaring performances. The article is built as follows. In the first section, the two different ways to harvest energy from a thermal are explained. From them, 3 optimization problems are introduced. The latter are defined to find the best set of structural parameters that maximize the thermal soaring performances. Follow a section dedicated to the experimental validation of the numerical framework (ASWING, Drela 11 ) retained to solve the optimization problems. Finally, the last section is dedicated to the optimization results and a discussion on the question raised by the article. Comments are also provided regarding the impact of the structural parameters on the UAV flight envelope to be sure that the solutions are feasible or not.
Application example: Aeronaut Triple Thermic Neo
To present this new methodology, the Aeronaut Triple Thermic Neo is used. The latter has been chosen and bought by the author to perform numerical and further experimental analysis. It was chosen as it is relatively cheap and spare wings can be bought separately in case of a crash. The first model was crafted by the author and is depicted in Figure 1 in flight condition.

Application example: Aeronaut triple thermic (in flight).
The mass, wing span, wetted area, and aspect ratio are respectively 2.55 meters, 0.49 m
The model was also picked up as its geometry fits in the Mini UAV category which is of interest in this article. So the Aeonaut Triple thermic seems to be a good candidate to highlight or not the benefit of the flexibility in thermal soaring.
Once crafted, wrapped and equipped, some mandatory parameters could be experimentally estimated. For example, the wings were detached from the main body to measure their mass and the centre of gravity position. Then from their knowledge, a pendulum bench was crafted to measure the moment of inertia about the spanwise axis of the wing. That being done, the wings were fixed again to the body. The aircraft’s centre of gravity position about the wing trailing edge could be estimated using techniques. From its position, a similar pendulum system was crafted to compute the longitudinal moments of inertia of the aircraft. Here it was held from the tail, and nose down using a friction-less attachment. The test consists of measuring the pendulum (fuselage) small oscillations period over 5 to 10 periods. From it, the longitudinal moment of inertia about the aircraft’s centre of gravity could be computed.
Some flight tests (cf Figure 1) were performed, from which observations could be drawn. For example, in high banked (ie high load factor) turn, we have figured out that mainly the wing was subject to major deformations and small flutter. In high-speed level flight, we haven’t witnessed any loss of elevator or rudder effectiveness, or V-Tail shape deformation. Thus in the next sections, the fuselage and V-tail are considered stiffer than the wing. And so for simplicity, all their stiffness parameters have been set to infinite. The fuselage and V-tail masses distributions are thus lumped in the total mass and moment of inertia of the aircraft.
The UAV numerical model was built in a few steps. First of all XFOIL analysis of the wing and V-tail airfoils has been performed to get the aerodynamic mandatory ASWING parameters. From a visual inspection of the wing profile, the SD7037 airfoil seemed to be the best fit. For the V-Tail, a NACA0008 has been chosen. Note that in reality, the V-Tail airfoil is closer to a flat plate, however, the NACA0008 was retained as it could be easily crafted from a 3D printed mould and carbon fiber. The ailerons, rudder and elevator derivatives have been computed also using XFOIL and are summed up in Appendix B of this article (cf Figure 19). Note that for the wing and V-Tail, the XFOIL analysis was performed at 2 Reynolds number to take into account the chord variation (ie Reynolds number). The Reynolds number has been picked up to be close to the stall speed of the aircraft as the lower speed region of the speed polar is of interest. Secondly, the mass and inertia of the fuselage and V-Tail were lumped into a “concentrated mass”. The moment of inertia has been recovered using a punctual mass dipole. They have been equally spaced from the fuselage/Vtail centre of gravity (the distance is obtained from the radius of gyration recovering the moment of inertia). Thirdly, not as effort was put into the estimation of the wing structure parameters as they aim at varying into a reasonable set in the following analysis. However, their spanwise distribution is assumed to be elliptical as the wing is. Finally, 1 sensor has been implemented and placed at the aircraft’s center of gravity to provide the aircraft with inertial and air-relative speed.
Steady thermal soaring
In this section, the performances of the Aeronaut Triple Thermic Neo in static soaring are discussed. Static soaring can be performed in Thermals, Lee waves, or mountain ridges. Thermals are the phenomena of interest in this paper. A thermal is a rising column of warm air generated by uneven heating of the Earth’s surface, typically caused by solar radiation. As the ground heats up, pockets of air near the surface become warmer and less dense than the surrounding air, causing them to rise through buoyancy. This rising air can create sustained vertical updrafts, often reaching altitudes of several thousand meters. As the vertical updraft is relatively constant in the thermal and in comparison to the UAV size, the wind field is considered as steady.
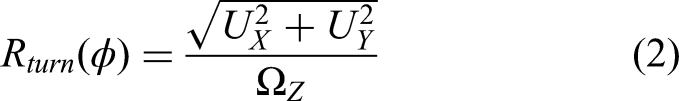
The turning polar provides information on how the glider is sinking at a given turn radius and airspeed. The glider pilot can thus optimally choose his speed and turn radius to maximize the energy extracted in a thermal of a given size for example. The turning polar is built from the speed polar that is constructed from steady banked glide trimming computations.
Static soaring performance metric
It is important to note that the thermal profile is not needed to assess the static soaring performances of a UAV, 13 (refer to chapter 2). Indeed as the latter are considered as much wider than the aircraft size their speed profile varies spatially slowly and can be considered constant along the wing span. Thus only the speed and turning polar are enough to evaluate the UAV performances. In this section, static soaring performance metrics are introduced to define optimization problems. Their goal is to find the optimal set of structural parameters that maximize the energy harvested in this specific strategy. As mentioned above, the speed and turning polar are very useful metrics of performance. The turning polar is built from the speed one. To build it, the following trimming problem must be numerically solved.

Optimal glide ratio
The second performance metric useful in static soaring is the glide ratio. Indeed, thermals, lee-waves, ridges etc are bounded in space and time, so they eventually vanish. The glide ratio gives information on how far the glider will travel from one exploitable phenomenon to another. In consequence, the bigger it is, better is the range. Calculating the glide ratio is mandatory to appreciate the performances of a glider in static soaring. Thus, a heuristic algorithm has been implemented in order to detect the optimal travel speed where the glide ratio is maximum. For each airspeed considered the trimmed glide problem is solved at

Optimal problem definitions : OP1 and OP2
From the introduced metrics of performance, it is possible to set up optimization problems. In this work, the objective is to status if flexibility can increase the performance of a given UAV in thermal soaring. Thus in this work, the optimization variables are the wing stiffness and tailoring parameters that are,

A second optimization problem has been defined in order to maximize the glide ratio of the UAV

Unsteady thermal soaring: the dolphin kick
As with every glider, the Aeronaut Triple Thermic has a minimum steady glide turn radius. In consequence, it cannot harvest energy from a thermal having a lower one using a “static” soaring technique. However, the UAV can still benefit from smaller thermals. The idea is just to fly or glide through it and get this small up-wash pump, providing a small increase in the aircraft’s altitude. This technique, also known as “dolphin kick” can be used to improve slightly the UAV gliding slope by successively flying through small thermals and having those small jumps. In theory, this technique allows us to extend the gliding range of the aircraft as depicted in Figure 2. From the size of the thermal and the gliding speed, unsteady aerodynamic is involved and so a pur unsteady analysis is mandatory to status on the performances of the aircraft. In this section, a third optimization problem is presented.

Glidding slope improvement using unsteady thermal soaring (dolphin kick).
Thermal model
As it has been seen, for this strategy it is not possible to rely on steady analysis. Thus the wind field must be taken into account for a complete time marching computation. Here a thermal model with sink edges is proposed with the vertical speed profile defined as:
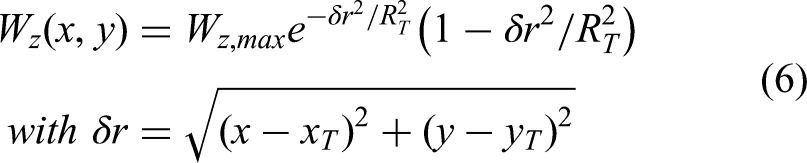

Thermal model illustration (
Corrected climbing/gliding slope
To measure, the UAV dolphin-kick performances, a single fixed problem has been defined. Let


Corrected slope illustration.
where
Optimal problem definition: OP3
From the previous section, the third optimization problem can be defined as follows

Numerical framework evaluation
The above optimization problems raise a number of numerical needs. For steady thermal soaring, it is mandatory to capture well, the aerodynamic performances of a given flexible UAV in steady trimmed glide. Thus the numerical framework chosen that is ASWING11,23,24 must be able to accurately trim a given UAV for a given speed

Steady glide in turn trimming problem illustration. (a) Lateral trimming; (b) Longitudinal trimming.
The longitudinal balance of an aircraft is affected by the wing and the horizontal stab. Thus capturing the lift they produce is important to assess the trimming problem correctly. Also, the horizontal stabilizer is downstream of the wing and thus strongly affected by the wing wake. To make sure that ASWING captures well those effects, the “higher fidelity data of Cheng and Wang 25 have been used. A tandem aircraft was considered in their work (cf Figure 6). This layout was chosen as tandem is strongly sensitive to wake interaction and the authors have provided the lift measurements of each lifting surface. Figure 6(a) and (b) present a comparison between the ASWING lift predictions and the “higher fidelity” data. Note that no matter the lifting surfaces, the forecast is in good agreement with experiments, with a linear slope error below 5%. Thus ASWING captures well the downwash effect on the lift of the backward wing. Moreover, ASWING captures the pre-stall effect of both the lifting surfaces especially highlighted by Figure 6(a).

Tandem aircraft lift coefficient predictions against higher fidelity data from Cheng and Wang. 25 (a) Forward wing; (b) Backward wing.
Another element that contributes to the longitudinal balance of the UAVs (and also to the lateral one) is the fuselage. Indeed fuselage for a positive angle of attack generates a pitching up moment that tends to fight the pitching down moment of the wing. Its effect is important to take into account as it will drastically change the amount of lift that must be generated by the elevator to trim the UAV. To do so, the experimental results of Von Karman 26 have been used. The worst airship (fuselage) has been used (lower aspect ratio). Experimental data in comparison with the ASWING predictions are presented in Figure 7. The local lift coefficient against the spanwise coordinate is in good agreement with the experiments except at the rear part. This discrepancy is due to the boundary layer thickness effect that is not taken into account in the ASWING model. However, if the local lift is integrated, the pitching moment induced by the fuselage is well captured by ASWING.

Lift distribution over a fuselage. Aswing predictions against experimental data from Von Karman. 26
Ailerons are used to counter the induced roll in a steady turn because of the difference in azimuthal speed inducing an unbalanced lift distribution (cf Figure 5a). Thus capturing their effect is very important. To evaluate this feature, the experimental data of Heald and Strother 27 is used. A rectangular flat wing (cf Figure 8a) was placed into a wind tunnel, with various ailerons configurations (spanwise and chordwise length varying). Induced rolling and yawing moment measurements were performed for various aileron deflections and angle of attack at the air-speed of the Mini-UAV category. Figure 8(a) presents the comparison between the ASWING predictions and the experiments for the rolling moment. Linear slopes have been computed on what Heald and Strother 27 called the first linear range. No matter the aileron configuration, ASWING shows excellent agreement with the experiments. For high deflection, however, the linear slope error increases. Figure 8(b) present a similar comparison but for the yawing moment. This time ASWING shows bad agreements. However, the yawing moment induced by a deflected aileron is an order of magnitude smaller than the rolling moment. Thus when solving the trimming problem, the rudder effect on the yaw will be dominant. Finally, the rolling moment is a pur translation of the lift distribution over the wing, and thus the effect of the aileron on the local lift. In consequence, this evaluation comparison can be invoked for the remaining control surfaces of the UAVs, such as the rudder and the elevator. ASWING is thus able to capture accurately the primary effect of control surfaces.

Various ailerons configuration effect on the rolling and yawing moment of a straight wing. ASWING predictions against experimental data from Heald and Strother. 27 (a) Rolling moment; (b) Yawing moment.
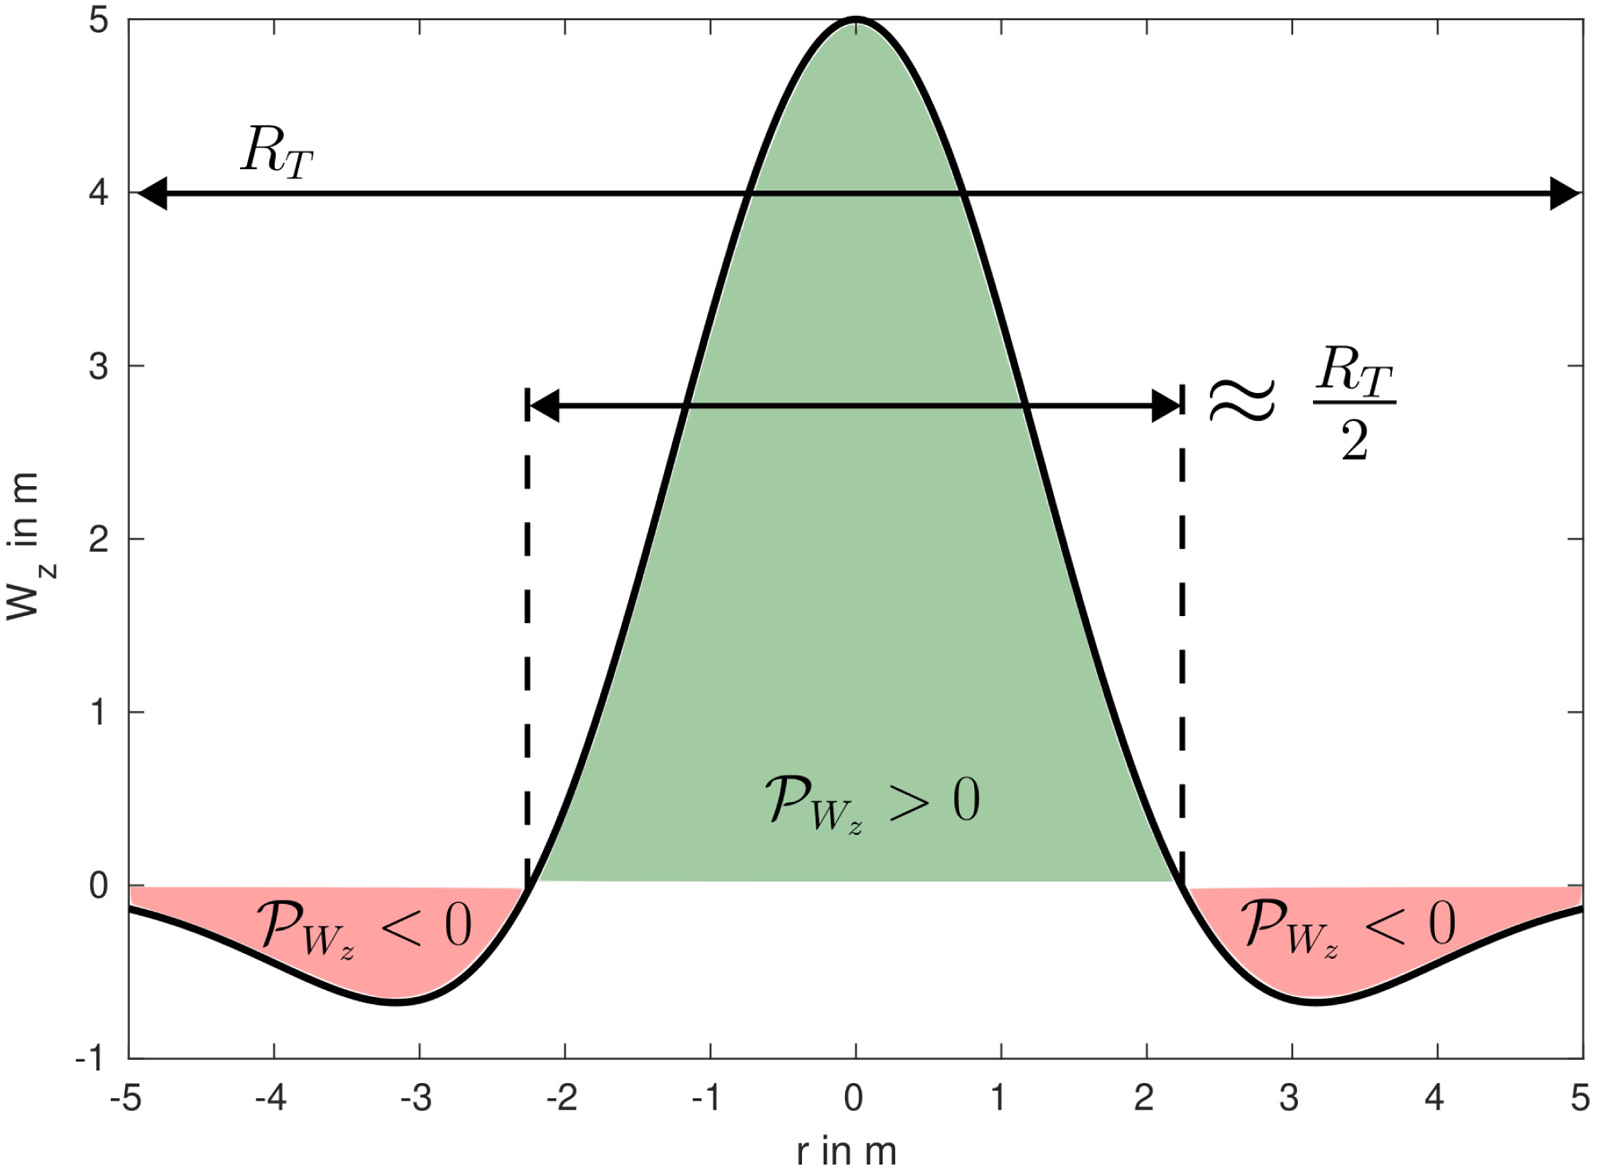
When a UAV is flexible, it can be subject to aileron reversal because of local twist. The reversal behaviour is not sudden, indeed the aileron effectiveness linearly decreases with the dynamic pressure as reported by Cole 28 . As in this article, the trimming problem is solved at various speeds (ie dynamic pressure), and ASWING must be able to capture well the loss of effectiveness. To do so, the experimental data of Cole 28 have been used. Here a trapezoidal wing with various ailerons configuration (length as a % of the half span) was anchored into a wing tunnel. The structure stiffness of the wing was chosen so that the reversal behavior appears in the wing tunnel speed range. Rolling moment measurements were performed at each airspeed tested. The comparisons with ASWING predictions are presented in Figure 9. No matter the aileron configuration, ASWING is in good agreement with the experiments. The loss of effectiveness and the reversal behavior are well captured. Note this phenomenon is not restricted only to ailerons but to every control surface. Thus this evaluation conclusion can be accounted for the remaining control surfaces of the UAV.
Loss of rolling effectiveness with dynamic pressure of a trapezoidal wing. ASWING predictions against experimental data from Cole 28 . Various ailerons length (as a % of the half span).
The more the radius of turn reduces, the greater the load factor is on the wing, because of the higher bank turn. Thus along the turning polar, the structure will deform modifying the aerodynamic performances of the aircraft. In particular, it will modify the shape of the wake and thus the lift-induced drag. Capturing its change is thus mandatory. To do so, the experimental data from Avin et al. 29 have been used. The Pazy wing (moderate aspect ratio) was placed in Tennion’s wind tunnel. The tip deflection and twist have been measured at various angles of attack and speed. Figure 10(a) and (b) present the ASWING predictions against the experiments. Tip deflections are in good agreement with a prediction error below 10% for large deformations. The prediction error for the twist is greater but ASWING follows well the twist trend and is satisfactory for this paper’s application.

ASWING prediction of the Pazy wing steady tip deflection and twist at
ASWING captures well the change of a wing shape due to the aerodynamic loads. Its capacity to predict the drag of deformed shapes must be assessed. To do so, 2 planform are used. First a planar straight wing as a reference case for comparison and the same wing but with a

ASWING drag prediction of 2 different planform. Comparison against experiments from Applin
30
and StarCCM+ data. (a) Straight wing; (b)
For unsteady thermal soaring, the size of the thermal and the UAV speed can be such that unsteady aerodynamics can be involved. Change in the lift and phase lag can be witnessed in a given configuration. Capturing them is thus mandatory to assess correctly the third optimization problem OP3. To do so, the experimental data of Chiereghin et al.
31
have been used. A straight wing (low aspect ratio) has been placed into a wing tunnel. Various reduced plunging amplitudes and frequencies were tested. Also, the root wing angle was changed. Here only the pre-stall configuration is presented (

ASWING unsteady lift amplitude and phase lag of a plunging wing. ASWING predictions in comparison with experiments from Chiereghin et al. 31 (a) Lift coefficient first harmonic amplitude; (b) Lift coefficient first harmonic phase lag.
Even if a thermal can be a steady wind field, when the UAV is flying through it (unsteady thermal soaring), a transient response is witnessed. The latter can easily excite the dynamic of the UAV and especially its flexible modes. Moreover, if the glider is flying near its flutter speed, the sudden increase in speed and angle of attack can lead to self-excited behavior. The latter would make unsteady thermal soaring unfeasible. Thus, capturing the flutter speed and frequency of a flexible UAV at various angles of attack is mandatory to assess the optimization problem OP3. The Pazy wing has been used again to evaluate ASWING’s capacity to predict the above phenomena. Drachinsky et al. 32 provided the experimental flutter analysis of the Pazy wing. The wing was placed into the Tennion’s wind tunnel. At each angle of attack, different speed sweeps (up = increase, down = decrease) were performed as different self-exited behaviors have been witnessed depending on the sweep sign. They provided the flutter speed and frequency at each of the test conditions. Figure 13 presents the ASWING predictions’ comparisons with the experiments for the flutter speed. No matter the angle of attack, ASWING captures well the flutter boundaries, with a prediction error is below 5%. Drachinsky et al. 32 have witnessed that the Pazy wing was not diverging between the flutter boundaries (green zone in Figure 13) because of non-linear stabilizing effect (Limit cycle oscillations). This behavior cannot be captured by the modal analysis function of ASWING as it predicts an unstable flutter mode between the boundaries. However, when a full-time marching simulation is performed, ASWING simulates the full non-linear effects and captures the limit cycle oscillations identified by Drachinsky et al. 32 Table 1 also presents the comparison of the ASWING prediction and the experiments for the flutter frequency. Again, ASWING is in excellent agreement with the experiments. In addition, the vacuum modal analysis of the Pazy wing is also compared to the ASWING predictions. Table 2 presents the results in comparison to the experimental measurements of Avin et al. 29 Modes are presented in un-deformed and deformed conditions. This simply means that the Pazy wing was anchored vertically or horizontally to the vibrating device. Overall, ASWING predicts well the first 3 out of the plane bending modes as well as the first torsion mode. Regarding the first In-the-plane bending mode, the accuracy of prediction is bad. However, this mode was reported to be difficult to measure. Also, this type is very unlikely to be excited as the in-plane bending stiffness of wings is usually an order of magnitude greater than the out-of-plane one. Also, only the drag is susceptible to excite it but its magnitude is usually much lower than the lift one that excites both the out-of-the-plane and torsion modes. The transient response of the wing is thus mostly dominated by the latter modes. In consequence, ASWING is adapted to unsteady thermal soaring analysis as it predicts well all the phenomena that are expected in such techniques.

Pazy wing flutter boundaries ASWING predictions against experiments from Drachinsky et al. 32
Pazy wing : flutter boundarie, ASWING flutter frequency predictions.
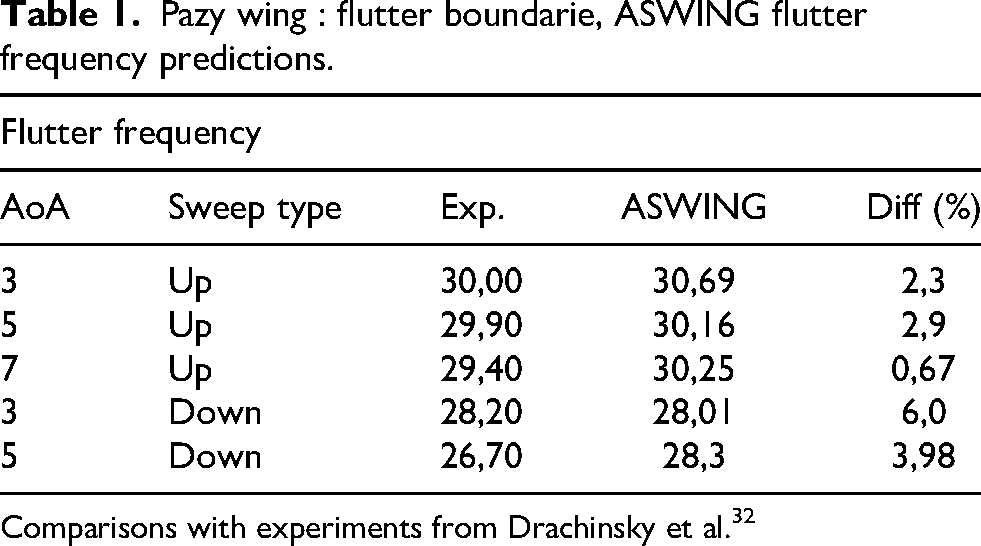
Comparisons with experiments from Drachinsky et al. 32
Pazy wing modal response in undeformed and deformed condition
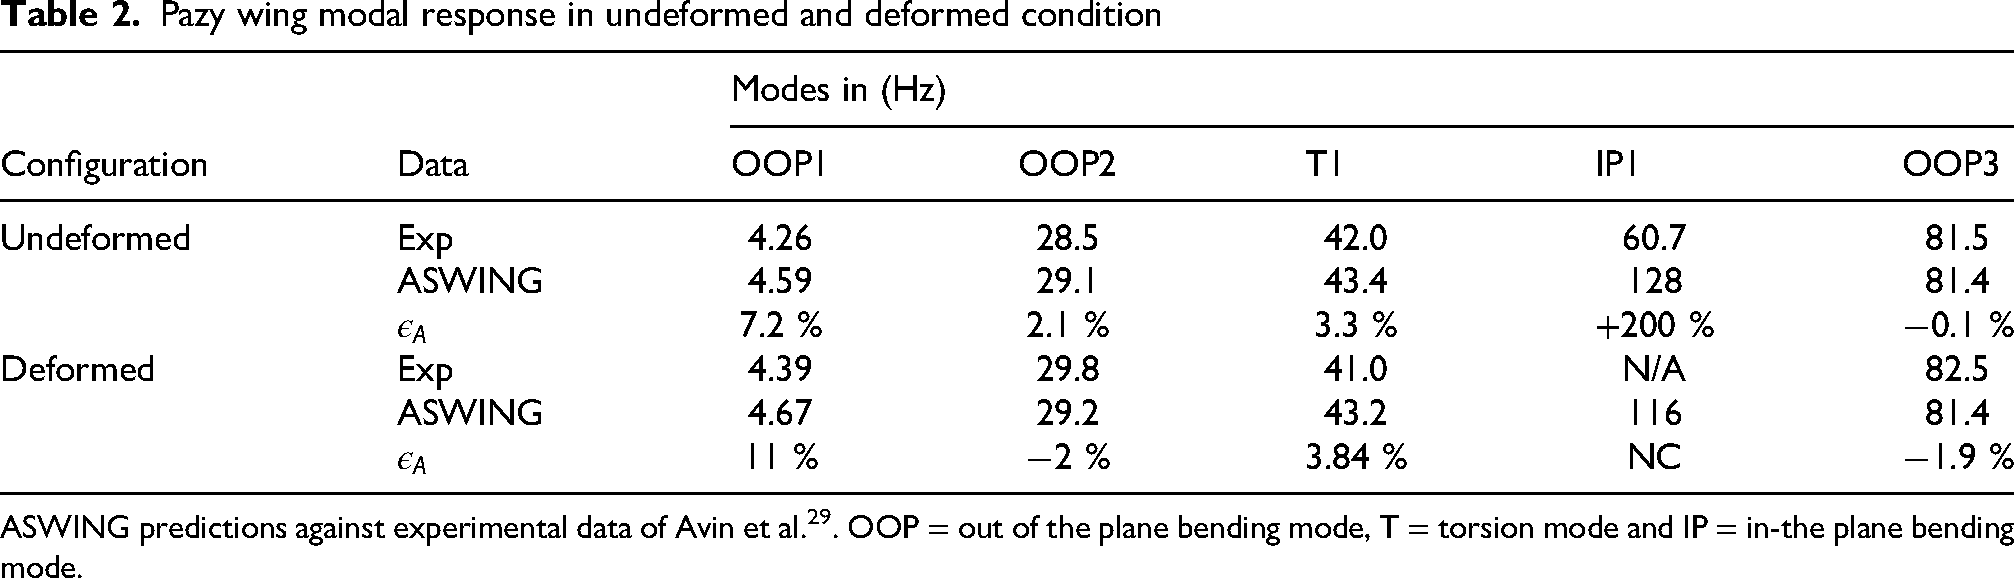
ASWING predictions against experimental data of Avin et al. 29 . OOP = out of the plane bending mode, T = torsion mode and IP = in-the plane bending mode.
Optimal configuration comparison
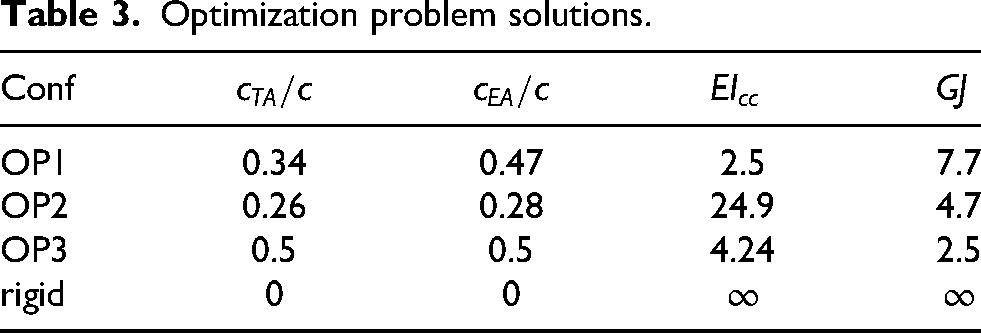
In this section, a comparison of the optimal solutions is proposed. To solve OP1, 2 and 3 a genetic algorithm implemented in MATLAB has been used. As the same number of optimal variables were chosen, the same optimizer parameters were used. The population size was fixed to 20 with a max number of generations fixed to 50. The first optimization problem has converged in 20 generations with a total computation time of 6 hours. The second one has converged approximately in 25 generations with a computational time of 2 hours. Finally, the last problem converged in 15 generations with a computational time of approximately 3 hours. The structural parameters of each optimal problem solution are given in the Table 3.
Optimization problem solutions.
Static thermal soaring performances
The first and second optimization problems solution do not show significant improvements in performances. The Figure 14(a) to (c) present the turning polar and the control effort of each optimal solution and rigid version. Figure 14(a) highlight how the OP1 solution outperformed the other one for the radius of turn above 13 meters. However the gain in performance is not that significant, a maximum of 7% of the sink speed reduction is achieved at the optimization problem turn radius definition (R = 13 m). Also from the control effort plots (cf Figure 14c), the gain in performance can be discussed. Indeed at a radius of turn of 13 meters, the aileron deflection angle of the OP1 solution is greater than the one needed on the OP2 solution (best glide). In this problem, the viscous and pressure drag increments due to deflected flap have not been taken into account. Thus the sink speed gain could be lower than as presented.

Turning polar comparison of the optimal solutions. (a) optimization solutions comparisons; (b)optimized rigid geometry; (c) flaps effort.
Can we really talk about the benefit of the flexibility in this case? When a look is taken a bit deeper into why this set of structural parameters has been chosen, we figure out that the rigid geometry was not optimal from an aerodynamic point of view. The optimizer has converged to this set of parameters so that when the glider is in steady banked flight, the geometry deforms and converges to a more aerodynamic efficient configuration. The lift distribution is favorably changed to reduce the lift-induced drag of the wing. Also on UAV, flying at a high bank angle while minimizing the sink speed becomes very quickly limited because of the poor low Reynolds number aerodynamic performances. Thus, for the range of interesting bank angles, the load factor is quite low and so the geometry is deforming reasonably. In consequence, using structural parameters as an optimization variable was another way to optimize a given geometry shape instead of using for example; polynomial local dihedral and twist angle functions. From a physical point of view, a rigid wing with the equivalent deformed geometry provides the same turning polar. This is highlighted by Figure 14(b) where the turning polar of the above configurations are presented. In consequence, the gain in performance of OP1 to rigid can not be attributed to the flexibility itself.
Regarding the OP2 problem (summarized in Table 4),no change has been witnessed from the rigid. The change is so tiny that it might be drowned in either the numerical noise or the prediction errors. So basically no conclusion can be drawn from it, and there is a chance that the optimizer has converged to an irrelevant set of structural set of parameters due to the cascade of numerical discrepancies introduced in the heuristic algorithm.
best glide ratio comparison of the different optimal solutions.

The OP1 and OP2 mostly have highlighted the limitation of the genetic optimization approach to maximize the performances of physical systems. When there is an improvement, the set of parameters found has been shown to not have real physical meaning. Thus care must taken on the results interpretations.
Dolphin kicks performances discussion
The dolphin kicks performances of each optimal solution are compared in Table 5. For the chosen thermal, every flexible solution has better performance than the rigid configuration. The OP3 solution outperforms the rigid one by 17%. Also, it is better in comparison to the OP1 by 14%. The local twist allowed by every optimal solution raises the local angle of attack and so lifts during the gust encounter. From the OP3 structural parameters, the chord-wise location of the torsion and elastic axis upper bound have been reached as they maximize the torsion twist. Moreover, the torsion stiffness lower bound is reached. When the UAV encounters the thermal there is a sudden change in the aerodynamic loads. The wing bends and twists up. When the bending stiffness is too low, the deformations will lead to an increase in the local dihedral angle. The lift contribution to the vertical axis is thus reduced by the latter angle cosinus (cf Figure 15).

Aeronaut Triple Thermic Neo flexible change of the geometry with the load factor.
dolphin kicks comparison of the different optimal configurations.

At the same time, the chordwise bending deformation tends to slightly increase the local angle of attack inducing the same benefit as for the torsion. The lower bound of the bending stiffness has not been reached; the optimizer has thus converged to a trade-off between the loss of lift mentioned earlier and the small gain in the geometric local twist. In consequence, a very flexible geometry tends to maximize the energy gain during a dauphin kick. Note that the performances found are quite consistent with the results presented by Mai. 8
A flexible structure tends to passively increase the dolphin kick performances. Now a question arises from those observations, it seems that the positive change in the local twist tends to increase the energy harvested from the thermal. What if instead of gaining passively a local twist on the geometry, the aircraft pith angle is optimally changed? Of course, the passive property is lost but stiffer UAVs could show the same performances as the very flexible solution of OP3. This proposition is motivated by the fact that the OP3 solution is degrading a lot of the UAV flight envelope performances as described in the next section. In consequence, a sinusoidal pitching command law has been implemented on the UAV elevator. A 1.5-degree elevator deflection has been randomly chosen. The half period was chosen to fit the thermal length and the command was delayed so that the UAV pitched up when flying through the gust and then pitched down to go back to its trimmed condition after. The elevator deflection angle was so negative (up) in the thermal and positive (down) after. Overall just with this random set of command parameters, the corrected climbing rate was equal to 0.065 which is 45% better than the best OP3 value of Table 5. The time response of the UAV altitude in both configurations is depicted in Figure 16. It is clear that optimal control of the pitching angle of the aircraft performs better than the passive behaviour of the structure deformations. It was actually demonstrated by Gavrilović et al.33–35 for gust soaring techniques. Also using a control law is much more convenient to recover rapidly the trimmed state of the aircraft. Indeed during the optimization process, the post vertical excursion was not taken into account but the more the aircraft is flexible the more hazardous its response is as its flexible modes are very close to the one of the flight dynamics. A slow transfer of energy can occur, with a very low-damped response.

Daulphin kicks performances with and without control. Comparison with OP3 configuration.
Aerodynamic performances
In this subsection, a comparison of the drag polar of the OP1 and OP2 is proposed. As those configurations are flexible, the drag polar is not expected to be similar to the rigid version, as the geometry deforms with the aerodynamic loads changing the performances. To build the drag polar of each version, several airspeeds and angles of attack have been tested. Then from the lift and drag coefficient and the airspeed, the drag polar could be built with a colour map that is a function of the load factor. Also during the ASWING simulations, a subroutine has been implemented to return a convergence flag to sort the data. The drag polar of the OP1 and OP2 solutions are presented in Figure 17(a) and (b). They highlight quite well how quickly the aerodynamic performances of the OP1 solutions degrade with the load factor rising. Indeed when the aerodynamic load increase the wing tends to bend up (Figure 15). This has the effect of creating a local dihedral angle that reduces the projected lift contribution to the vertical axis. In other words, the wing loses lift capability. Thus to provide the same lift coefficient as a less deformed geometry, the angle of attack of the wing must be raised and so the drag increases with it. Also from Figure 17(a), it can be seen that the stall of the wing decreases with the load factor. For example, at a load factor of 1, the maximum lift coefficient of the OP1 solutions is 1.3 while at a load factor of 2, it is close to 1.1. This loss of performance was also witnessed on the turning polar when the bank angle was reaching

drag polars comparison. (a) OP1 : drag polars; (b) OP2 : drag polars.
Additionnal discussion
In the previous sections, it has been seen that some optimal structural parameters can be found to maximize some specific energy harvesting strategies such as static and unsteady thermal soaring. However, it seems that the parameters tend to not be really optimal when they are evaluated on the flight envelope of the aircraft. In this section, a discussion is proposed on what drawbacks should be brought by choosing them anyway. First, both optimal solutions OP1 and OP3 propose low bending and torsion stiffness. This leads to high deflections of the wing. The structure is more likely to break than the OP2 solutions for example. The UAV will be limited to low G maneuvers in consequence. Secondly reducing the torsion stiffness has an effect on aero-elastic divergence phenomena. The flutter speed will appear much earlier. Also, the aileron’s loss of effectiveness up to the reversal behavior will be witnessed at a lower speed. The variability of the aircraft controllability on its rolling axis is expected to be high which is not very convenient for control law synthesis. Moreover during the time marching computation, after the gust vertical excursion, the flexible version OP3 was slowly stabilizing its trajectory with an important oscillatory behavior. It seems that after a modal analysis of this aircraft, the phugoïd mode was much less damped than the one of OP2. Finally, the UAV is expected to fly into a very gusty and turbulent environment, and having such low bending and torsion stiffness will cause a lot of fatigue on the materials composing the wing. The life expectancy should be much lower than a stiffer UAV. Active control systems could be used to alleviate those effects but they would drastically reduce the aerodynamic performances as they are usually using the control surfaces creating a lot of drag when highly deflected.

Appendix A - Aeronaut Triple Thermic main parameters and ASWING geometry.

Appendix B - Aeronaut triple thermic wing and V-tail airfoils XFOIL analysis. (a) SD7037 lift slope; (b) NACA0008 lift slope; (c) SD7037 zero lift angle of attack shift; (d) NACA0008 zero lift angle of attack shift; (e) SD7037 zero lift pitch moment shift; (f) NACA0008 zero lift pitch moment shift.
Conclusion and perspectives
In this article, 3 optimization problems have been proposed in order to find the optimal set of structural parameters of a UAV wing, maximizing the energy harvested in thermals. ASWING has been used as an in-the-loop analysis tool to solve the above problems. The findings can be summarized as follows
From an experimental evaluation, ASWING is adapted to the analysis of UAV performance in thermal soaring. It seems that providing more flexibility to the structure is only beneficial for unsteady thermal soaring. The updraft gust tends to pitch up to the local section because of the weak torsional stiffness increasing the local angle of attack and thus the lift. The latter being much less used than static thermal soaring, we do not recommend building a UAV based on the optimal set of structural parameters found as it degrades a lot the aerodynamic performances of the aircraft on its flight envelope. After analyzing what was contributing to this performance gain in dolphin kicks, we figured out that a control of the pitch angle of the UAV with the elevator was providing the same gain of performance and even more in some cases. In light of the drawbacks brought by the structural parameters found, it is preferable to use a stiffer UAV with active control maximizing the power extracted from a thermal. For static thermal soaring, it seems that the structural set of parameters that maximize the static thermal soaring power extraction is more the translation of a non-optimized rigid geometry than a real benefit of giving deformation capacity. Indeed, along the turning polar studied, the structure does not deform a lot because of the low load factor turn. The optimizer has converged to a set of parameters leading to a better geometry from an aerodynamic performance point of view. In other words, treating structural parameters as optimization variables in this problem is another way to optimize the UAV “rigid” geometry, than using regular geometric parameters such as twist and dihedral angle non-linear distribution. The latter involves many more optimization variables, the previous problem can be seen as a more efficient way to optimize the aerodynamic performances of a rigid wing. The favorable change in performances is not due to the flexibility itself. The above conclusions are quite pessimistic, mostly due to the “constant mass” constraint imposed. The mass saved on a UAV must be dedicated to either its fuel or payload. If this constraint is released, the conclusion would be much more different.
Footnotes
Funding
The author(s) received no financial support for the research, authorship, and/or publication of this article.
Declaration of conflicting interests
The author(s) declared no potential conflicts of interest with respect to the research, authorship, and/or publication of this article.
Copyright
Copyright 2016 SAGE Publications Ltd, 1 Oliver’s Yard, 55 City Road, London, EC1Y 1SP, UK. All rights reserved.