Bionic micro aerial vehicles have become popular because of their high thrust efficiency and deceptive appearances. Leading edge or trailing edge devices (such as slots or flaps) are often used to improve the flight performance. Birds in nature also have leading-edge devices, known as the alula that can improve their flight performance at large angles of attack. In the present study, the aerodynamic performance of a flapping airfoil with alula is numerically simulated to illustrate the effects of different alula geometric parameters. Different alula relative angles of attack β (the angle between the chord line of the alula and that of the main airfoil) and vertical distances h between the alula and the main airfoil are simulated at pre-stall and post-stall conditions. Results show that at pre-stall condition, the lift increases with the relative angle of attack and the vertical distance, but the aerodynamic performance is degraded in the presence of alula compared with no alula, whereas at post-stall condition, the alula greatly enhances the lift. However, there seems to be an optimal relative angle of attack for the maximum lift enhancement at a fixed vertical distance considering the unsteady effect, which may indicate birds can adjust the alula twisting at different spanwise positions to achieve the best flight performance. Different alula geometric parameters may affect the aerodynamic force by modifying the pressure distribution along the airfoil. The results are instructive for design of flapping-wing bionic unmanned air vehicles.
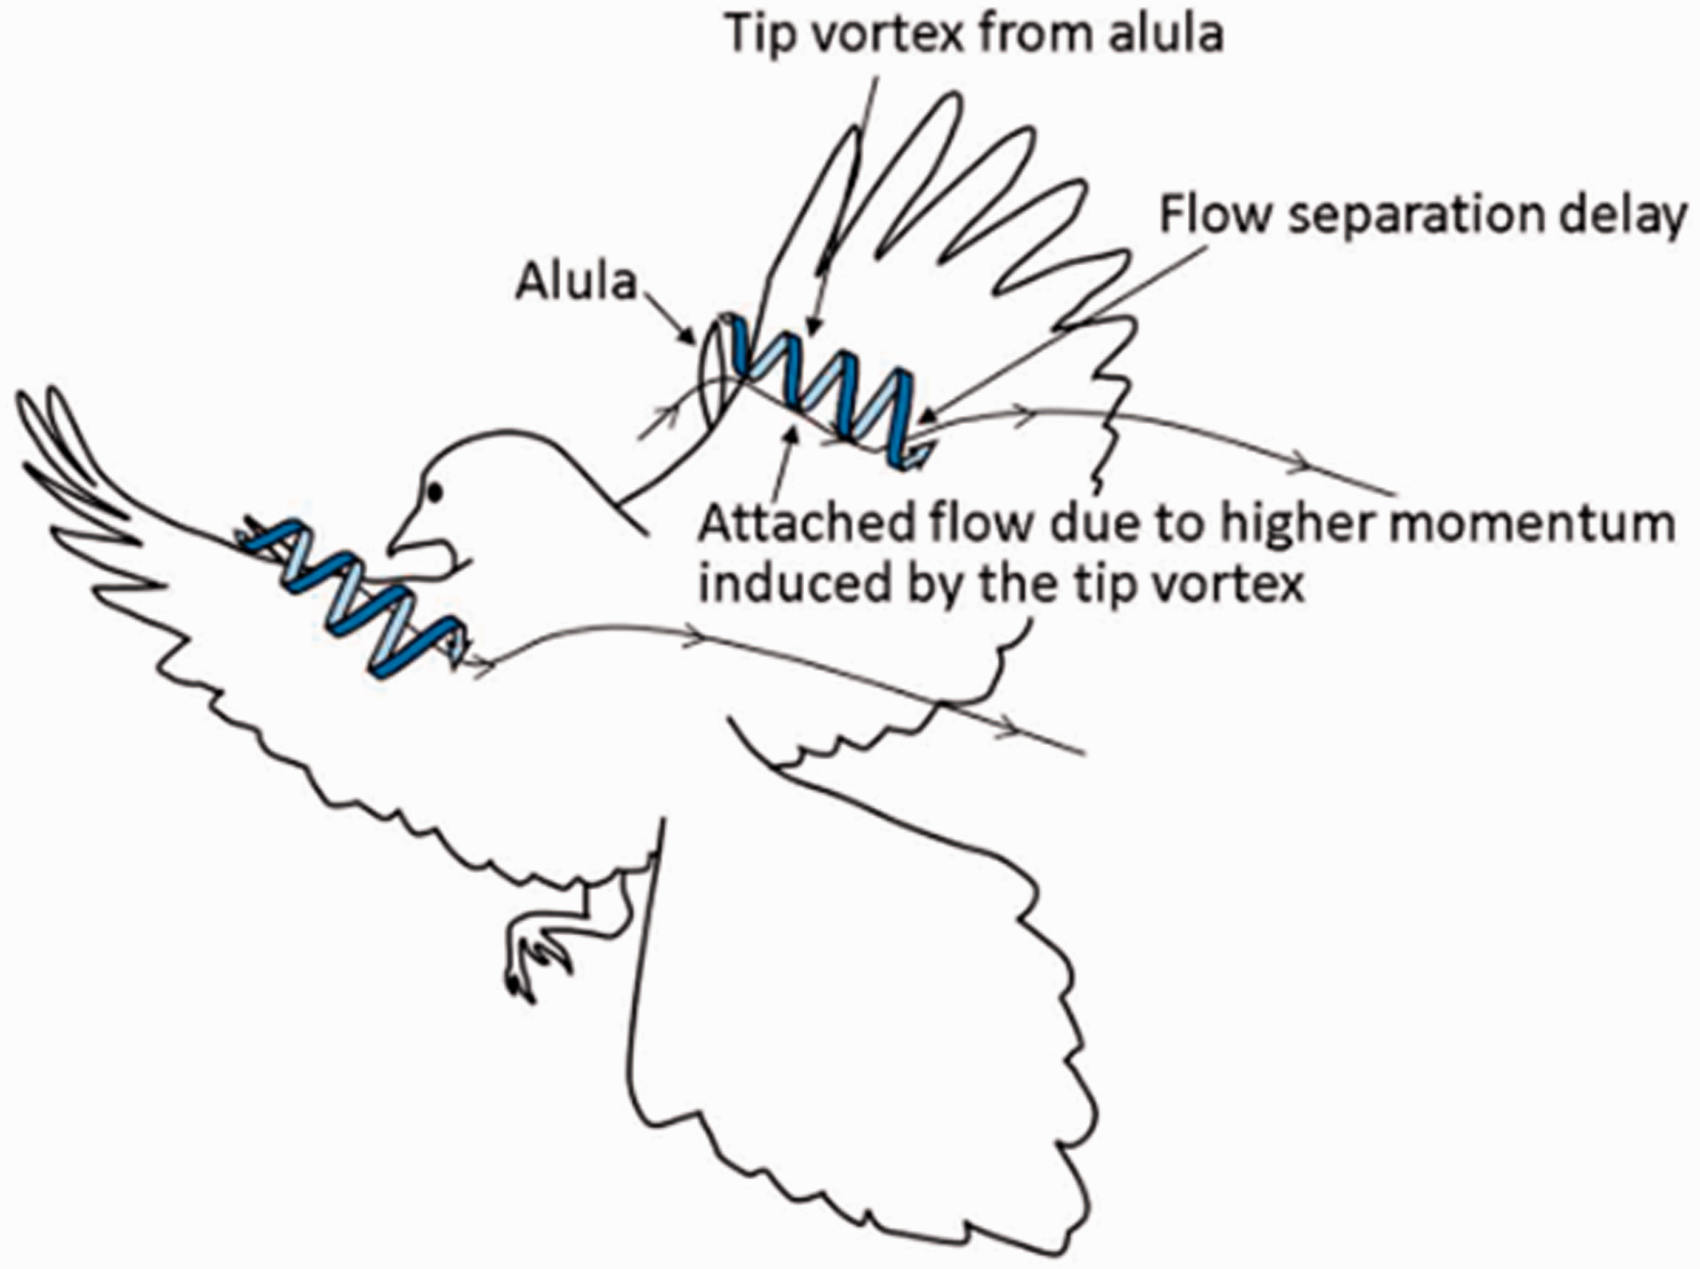
In the past decade, micro aerial vehicles (MAVs) have drawn widespread attention all over the world. Bionic micro aerial vehicles (BMAVs), a kind of MAVs, are widely concerned because of their high thrust efficiency and deceptive appearances. In recent years, more and more studies are focused on BMAVs, making great progress in various aspects, such as low Reynolds number aerodynamic mechanism,1–4 mechanical driving system and prototype,5,6 and control law design.7,8 As military and commercial demands grow, flight capabilities of BMAVs such as maneuverability, taking off, and landing manners need to be improved. Thus, it is necessary to develop auxiliary devices for BMAVs to improve their flight performance. BMAVs are inspired by flying creatures in nature. A close observation of bird wings will find that birds in nature usually have the alula, which is located between the hand wing and the arm wing and consists of a digit bone with two to six feathers, as shown in Figure 1. The alula is considered a high-lift device that can improve birds’ flight performance at high angles of attack (AoAs) and also reduce flight noise.9–13 In previous studies on the alula, two hypotheses are made trying to illustrate its aerodynamic effects. One is the leading-edge slot effect: the alula delays flow separation by reducing reverse pressure gradients around the leading edge,14,15 the other is the vortex generator effect: the alula delays stall by injecting momentum into the boundary layer.16 Meseguer et al.14 tested a pigeon airfoil model in a wind tunnel to study the influence of alula on a static airfoil. They found that the alula deflection at a high AoA could reduce reverse pressure gradients on the upper surface and delay flow separation and use the potential flow theory to explain this phenomenon. Meseguer et al.15 conducted wind tunnel experiments to study the wings of a pigeon equipped with different alulae. They found that the alula was an effective high-lift device. Although its length was only 17.5% of the main wingspan, the alula could increase the lift by a maximum of 22%. Lee et al.16 investigated the function of the alula in a wind tunnel and first proved that it had a function similar to the vortex generator. The flow structure measured by digital particle image velocity showed that at a high AoA, the tip of alula created a streamwise vortex, which induced a downwash flow along the upper surface of the wing and suppressed the flow separation over the wing surface, as shown in Figure 2. Austin and Anderson17 tested wings of four species at flow speeds from 7 to 20 m/s and AoAs from –10° to 35°. They found that at a fixed velocity, the alula deflected slightly at a low AoA and then rose to a larger deflection as the AoA increases. Eventually, the alula would retract and completely close at certain maximum AoA. Thus, they suggested that the alula might reduce the stall risk in flight. Mandadzhiev et al.18,19 studied the effect of a bio-inspired leading-edge device on a high-lift airfoil. They studied different alula relative angles of attack and deflection angles at two Reynolds numbers, as shown in Figure 3. They found that the alula deflection had a negative effect on lift at pre-stall condition, and meanwhile, a higher deflection angle and a lower relative angle of attack could get better lift enhancement at post-stall condition. Linehan and Mohseni20 investigated the aerodynamic force of a thin flat-plate wing with the alula. They concluded that when the wing stalled, a single alula could generate a better rolling moment than flap-aileron. Besides, they proposed a new solution to control the aerodynamic force at high angles of attack by sliding the alula, which entailed coordinated shifting of two alulae to manipulate the length and asymmetry of stabilized “sweeping vortices” on stalled wings. Research on the alula is usually carried out through wind tunnel tests, and there are fewer simulations of the alula because of difficulties in stall simulation. Ge et al.21 studied the bionic slat based on an owl by adopting experimental and numerical methods and found lift and stall angle increased when the bionic slat deflected. All the previous studies on the alula mentioned above, both experimental and numerical, only considered the effects of the alula in steady state, and the unsteady effects caused by the flapping motion are still not considered in published literature, that is, the effects of coupled alula geometric parameters and unsteady flapping motion on aerodynamic performance have not been studied. Actually, it can be observed that birds usually flap their wings wildly when taking off or landing with the popup of alula to enhance lift performance. The unsteady flapping will cause a hysteresis between the force and angle variation,22 which may also delay stall to a certain extent. Thus, it is necessary to carry out a research on flapping wing with the alula to figure out their coupled influences.
Pigeon with alula deflection.
Tip vortex formation from alula tips, adapted from Lee et al.16
Sketch of deflection angle and alula relative angle of attack , adapted from Mandadzhiev et al.19
In the present study, the aerodynamic performance is analyzed when the airfoil is equipped with different alulae (different relative angles of attack and vertical distances) under pitching and plunging motion to provide some guidance for design of BMAVs and preliminarily reveal some mechanisms of flapping alula.
Model settings and methods
Model settings
In the present study, 2D airfoils equipped with and without the alula are established to figure out the influence of different alula geometric parameters on the aerodynamic force. Although the alula is a 3D device, it can be seen as a 2D airfoil profile with different parameters for a selected spanwise section, as shown in Figure 4. Meanwhile, 3D flapping and twisting can be regarded as a composition of airfoils at different spanwise positions and plunging–pitching motions. In fact, in the early stage of investigating a complex scientific problem, researchers usually reduce a 3D model to a 2D model to explore some basic and important mechanisms, such as a 3D flapping model would often be simplified into a 2D plunging model and a 3D twisting model into a 2D pitching model, which has also achieved excellent results for us to better understand the aerodynamic mechanism. For example, the plunging airfoils23,24 are used to explain how birds produce lift and thrust at the same time when they flap their wings. Young and Lai25 found that the thrust efficiency reached the maximum when St (Strouhal number,) was between 0.1 and 0.4 by studying a NACA0012 airfoil, and the range almost coincided with that from 0.2 to 0.4 where the thrust efficiency of real flying animals peaked.26 Until now, many studies have been using the 2D simulation to study the unsteady flow and flapping wing. Thus, the 2D simulation to some extent can reveal the mechanism of the 3D flapping alula.
Drawing of the dorsal side of the wing of a goshawk, adapted from Videler,9 (c) is the spanwise section of alula that can be seen as a 2D airfoil profile with different parameters.
The geometry of airfoil is based on the previous study of bird wings and alula. The selected main airfoil is adapted from Liu,27,28 where they use a 3D laser scanner to measure the wing surfaces of mergansers and seagulls. As shown in Figure 5, the camber line and thickness of an S1223 airfoil are similar to those of the airfoils of mergansers and seagulls. Thus, the S1223 profile is selected as the main airfoil.29 As for the alula profile, there are few references for alula geometry. Therefore, a NACA4412 airfoil profile, which has good aerodynamic characteristics at low speeds,30 is selected as the alula airfoil. Austin and Anderson17 measured the wing morphologies of four bird species, as shown in Table 1. It can be found that the ratio between the mean wing chord length and mean alula chord length is from 5 to 10. To simplify the modeling, the main chord and alula chord are chosen to be 120 and 20 mm, which are also close to the values of real flying animals, as summarized in Table 1.
High-lift airfoil S1223 compared with merganser’s and seagull’s wing sections, adapted from Liu et al.27
Wing morphologies of four bird species, measured by Austin and Anderson.17
Bird specimen
Area (cm2)
Wing span (cm)
Mean wing chord (cm)
Wing AR
Alula length (cm)
Mean alula chord (cm)
Alula AR
Black Scoter
206.5
63.5
11.4
5.56
5.1
1.5
3.4
Lesser Scaup
180.6
53.3
9.5
5.60
3.8
1.0
3.8
Redhead Duck
240.0
61.0
11.1
5.49
5.1
1.5
3.4
Wood Duck
271.0
68.6
10.2
6.75
5.7
2.0
2.9
Figure 6 shows the sketch of the main airfoil and alula. The present study aims to demonstrate the effects of different alula relative angles of attack (the angle between the chord line of the alula and that of the main airfoil) and vertical distances (vertical distance between 1/4 chord points of both airfoils) on the aerodynamic performance of a flapping airfoil. The flapping motions (pitching and plunging) are prescribed as follows
where is the instantaneous pitching angle, is the pitching amplitude (herein it is fixed to be 10°), is the instantaneous plunging height, is the plunging amplitude (herein it is fixed to be 0.5 main chords), and is the flapping frequency. Meanwhile, is the AoA of freestream as shown in Figure 7. Besides, the pitching axis is fixed at 1/4 chord herein.
Sketches of the main wing and alula.
Sketch of 2D pitching-plunging motion of the airfoil (deep color: upstroke; light color: downstroke).
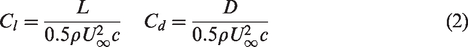
Figure 8 shows the directions of the lift force (L) and drag force (D) at post-stall condition. The direction of D is the same as that of the freestream flow and L is perpendicular to D. Meanwhile, the lift coefficient and drag coefficient are calculated from equation (2); the time-averaged lift coefficient and drag coefficient are calculated from equation (3)
Sketch of directions of lift force (L) and drag force (D) at post-stall condition.
Numerical method
In the present study, the commercial software Fluent is used to simulate the unsteady flow around the S1223 main airfoil and its alula with the NACA4412 airfoil.
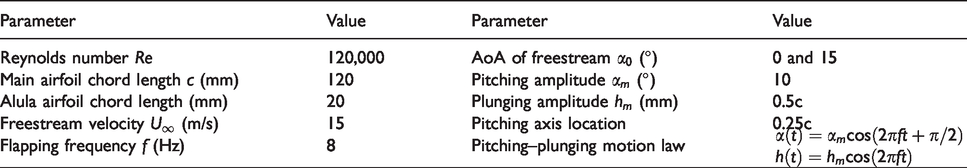
The freestream velocity considered herein is 15 m/s, which is close to the cruise speed of the bird. So, the Reynolds number Re () based on the main airfoil chord length (c) is about 1.2 × 10⁵. To closely simulate the bird flight, the flapping frequency is selected as 8 Hz to ensure that the reduced frequency () is 0.2. All the simulation settings are summarized in Table 2.
Simulation settings in the following main airfoil and alula airfoil study.
Parameter
Value
Parameter
Value
Reynolds number Re
120,000
AoA of freestream (°)
0 and 15
Main airfoil chord length c (mm)
120
Pitching amplitude (°)
10
Alula airfoil chord length (mm)
20
Plunging amplitude (mm)
0.5c
Freestream velocity (m/s)
15
Pitching axis location
0.25c
Flapping frequency f (Hz)
8
Pitching–plunging motion law
The Reynolds-averaged Navier–Stokes (RANS) equations and dynamic mesh have been used to study the aerodynamic performance of flapping airfoil. The shear stress transport k– turbulence model, which performs well in the low Re flow, has been used. Meanwhile, dynamic mesh settings use smoothing with diffusion parameter of 1.5.
Numerical validation
To validate the adopted numerical method, two test cases of the flapping airfoil have been illustrated.
In the first validation case, an NACA0012 airfoil (c =1 m) with pitching and plunging motion at is studied to validate the numerical method at pre-stall condition. The motion is described as follows
where . The parameters and methods used are the same as the previous numerical simulations.31,32Figure 9 compares the time histories of the lift coefficient and drag coefficient between the present study and Ashraf31 and Hoeijmakers and Mulder32 with consistent results. Therefore, the adopted numerical method is suitable for the present pre-stall simulation.
Time histories of lift coefficient (a) and drag coefficient (b) (red line: Ashraf31 calculation; green line: Hoeijmakers and Mulder32 calculation; blue line: present calculation).
In the second validation case, an NACA0012 airfoil (c =0.15 m) with pure pitching motion at is studied to validate the numerical method at post-stall condition. The motion is described as follows
where . Time histories of the lift coefficient and drag coefficient are shown in Figure 10 compared with those of the previous experimental test33 and numerical study.34 Although the present study has different results from the experimental test33 in value and performs worse in lift than the previous numerical study34 in the post-stall zone, it performs better in drag than the previous numerical study,34 and the trend of aerodynamic performance and flow structures can be well captured. Besides, both numerical results show poor agreement with experimental results and have oscillation in downstroke. Nearly, all the numerical results35–39 have similar phenomena and show poor agreement in the post-stall zone whichever turbulence model is used. The lift is inaccurate in the post-stall zone, probably caused by the shortcomings of RANS and complex vortex structures in the deep stall situation when the flow is largely separated. In addition, it is also difficult to measure the surface pressure in wind tunnel experiment due to the complex vortices at the post-stall stage,39 which may also cause force inaccuracy. The present study aims to qualitatively investigate the effects of different geometric parameters of alula on the aerodynamic force for design of MAV’s high-lift devices, which RANS is proved feasible in the previous study.35 Moreover, the flow will remain attached if the alula can delay flow separation, and the phenomenon occurs that flow returns to the attached state after the alula is deployed since our results can well capture the trend. In general, the adopted numerical method may be considered feasible in the post-stall simulation.
Time histories of lift coefficient (a) and drag coefficient (b) (red dots: Lee T experiment;33 green line: Kobra calculation;34 blue line: present calculation).
Mesh independence study
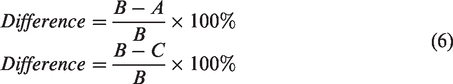
Three mesh magnitudes are employed for both single airfoil and alula airfoil to verify the independence of numerical solution on mesh size, as shown in Figure 11. The reference chord length in the force coefficient calculation is selected as the main airfoil chord length c for both the single airfoil and alula airfoil. For the single airfoil without alula, the coarsest mesh has around 40k cells, the medium mesh has around 90k cells, and the finest mesh has around 200k cells. The time histories of lift coefficient and drag coefficient of three meshes coincide quite well, as shown in Figure 12. Meanwhile, the time-averaged lift coefficient and drag coefficient for three meshes are also quite close, as shown in Table 3. The difference among force coefficients of each mesh is calculated from the following equations (A: coarse mesh, B: medium mesh, C: fine mesh)
Grids for single airfoil and alula airfoil.
Time histories of lift coefficient (a) and drag coefficient (b) for different meshes of the single S1223 airfoil.
Time-averaged lift and drag coefficients for three meshes of the single airfoil.
Time-averaged lift coefficient (difference %)
Time-averaged drag coefficient (difference %)
Coarse mesh
1.0233 (–0.157%)
0.0163 (–5.844%)
Medium mesh
1.0217 (0%)
0.0154 (0%)
Fine mesh
1.0198 (0.186%)
0.0152 (1.299%)
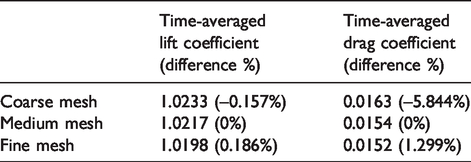
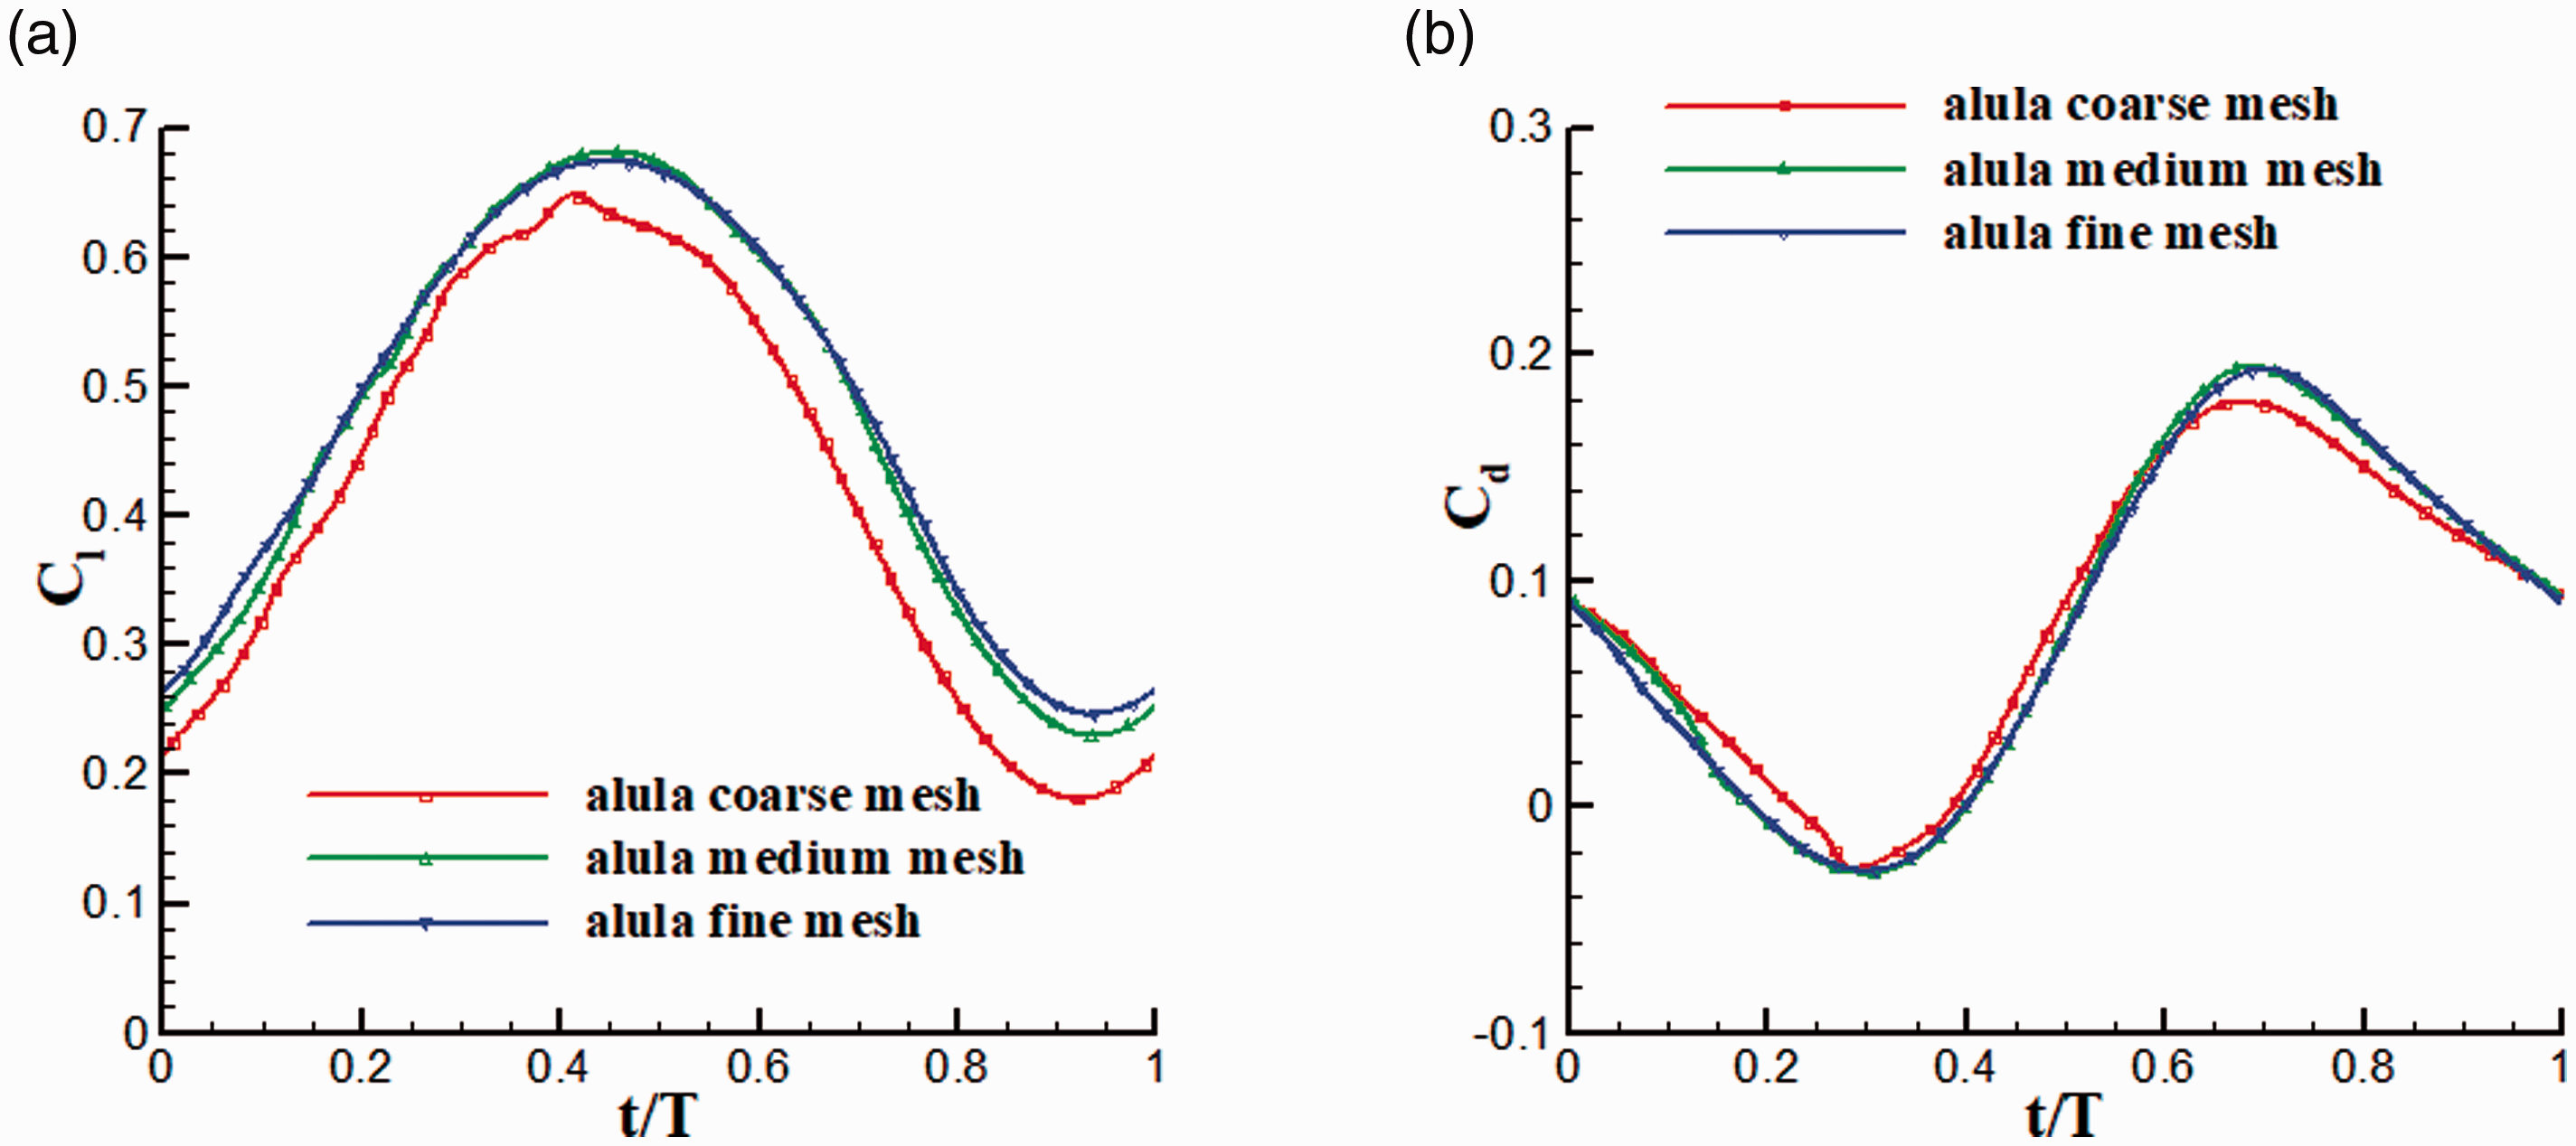
As for the airfoil with alula, the coarsest mesh has around 60k cells, the medium mesh has around 130k cells, and the finest mesh has around 260k cells. Although the medium mesh differs from the coarse mesh, it agrees well with the fine mesh, as shown in Figure 13. And a similar conclusion can be drawn on the time-averaged lift coefficient and time-averaged drag coefficient , as shown in Table 4. Therefore, in the following calculations, the medium mesh is used for both airfoils without and with alula.
Time histories of lift coefficient (a) and drag coefficient (b) for different meshes of the alula airfoil.
Time-averaged lift and drag coefficients for three meshes of the alula airfoil.
Time-averaged lift coefficient (difference %)
Time-averaged drag coefficient (difference %)
Coarse mesh
0.4217 (–10.258%)
0.0840 (–1.572%)
Medium mesh
0.4699 (0%)
0.0827 (0%)
Fine mesh
0.4766 (1.426%)
0.0812 (1.814%)
Results and discussion
In this section, the effects of different alula relative angles of attack and vertical distances between the alula and main airfoil on aerodynamic performance have been studied in detail. Two freestream AoAs (0° and 15°) are simulated to study the aerodynamic performance of flapping airfoils without and with alula at both pre-stall and post-stall conditions. Besides, the flexibility and passive deformation of the airfoil are outside the scope of the present study and have been ignored, although they may have some influence on the aerodynamic performance. The effect of alula at pre-stall condition, where the freestream AoA is 0°, will be studied in “Effect of alula different geometric parameters at pre-stall condition” section, whereas the effect of alula at the post-stall condition, where is 15°, will be studied in “Effect of alula different geometric parameters at post-stall condition” section. In both cases, different relative angles of attack from –5° to 25° at an interval of 5° and different vertical distances from 20 to 40 mm at an interval of 10 mm are studied under the pitching–plunging motion with the above mentioned law in “Model settings” section. For convenience of description, –5°, 0°, and 5° are defined as low relative angles of attack, 10° and 15° are defined as medium ones, 20° and 25° are defined as high ones.
Effect of alula different geometric parameters at pre-stall condition
Time-averaged aerodynamic force coefficients
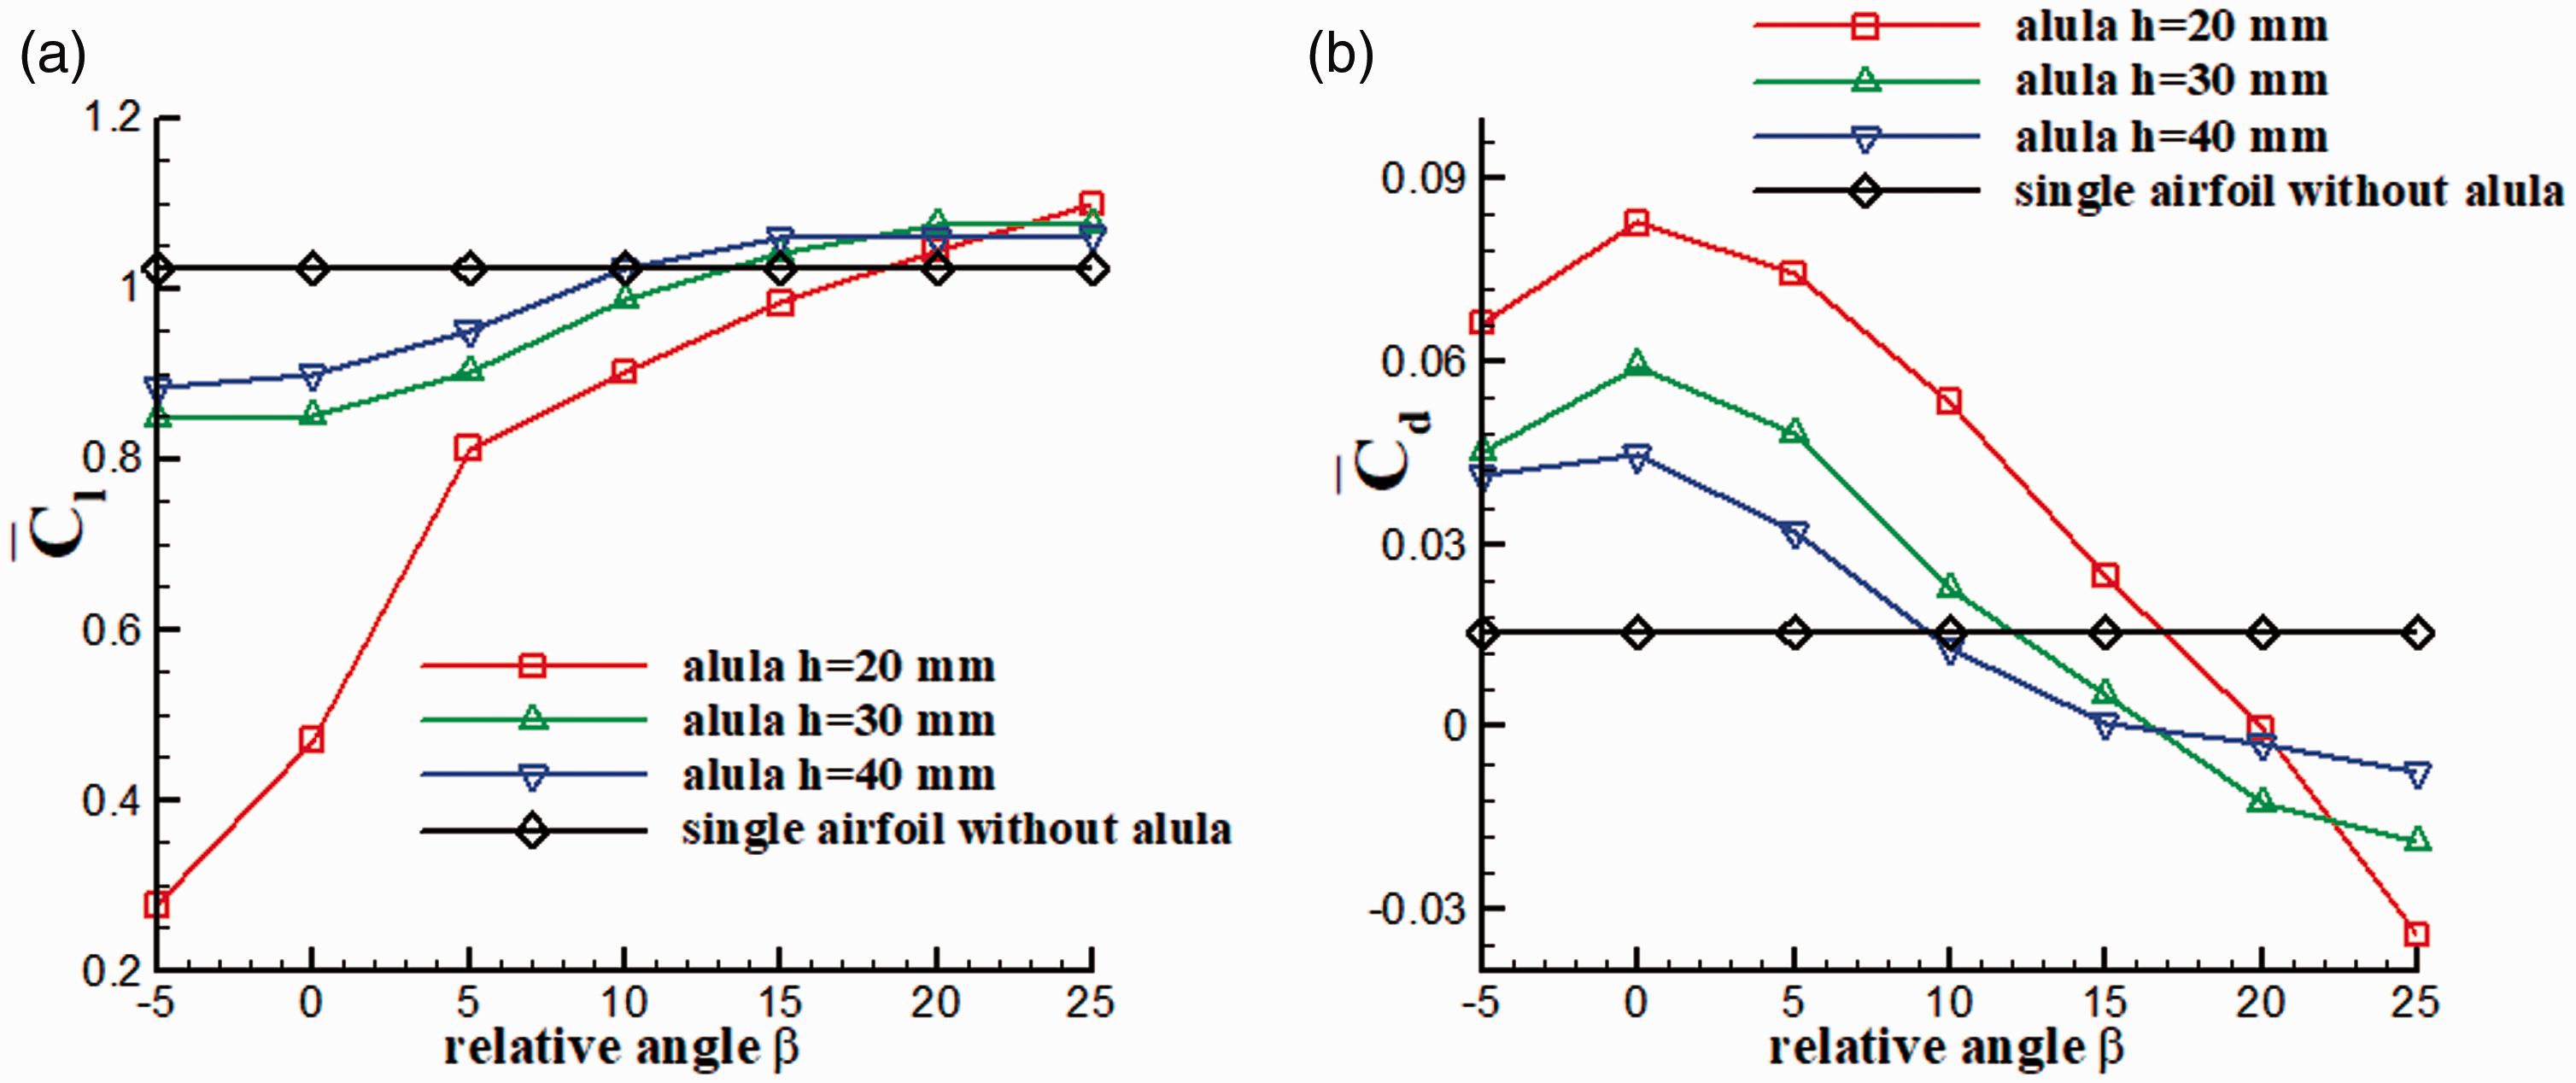
The freestream AoA is set to 0° to simulate the pre-stall condition. The time-averaged lift coefficient and time-averaged drag coefficient are shown in Figure 14. The black solid line shows the results of the single airfoil without alula. Red, green, and blue ones show results of alula different vertical distances, respectively. It can be seen from Figure 14 that when the alula deflects at a relatively low , the alula deflection has a negative effect on aerodynamic performance. However, when the alula deflection comes to a higher , it has a positive effect on both the lift and drag, but the improvement is a bit small compared with that of the single airfoil. This result differs from the previous steady experiment19 where it is found that at , the low can slightly improve lift at pre-stall condition. However, the present study finds high slightly enhances lift at pre-stall condition when the unsteady flapping motion is taken into consideration. Two main reasons may explain the difference between the present and experimental results: first, the alula models are different, as the experiment uses a 3D alula while the present simulation uses a 2D model, which can be found by comparing Figures 3 and 6; second, the motions of the model are different. The experiment adopts a steady and fixed model, while the present calculation uses a model under the pitching–plunging motion. In addition, different Re between the experiment and simulation may also account for the deviation. Compared with the results at different , in Figure 14, it can be found that increases with , while first increases and then decreases as increases. Meanwhile, increases with the increasing at the low and medium , but the trend reverses when becomes high; decreases as increases at the low and medium , while the trend also reverses at high β. Even at high , the value of becomes negative, indicating the airfoil produces a thrust in a flapping cycle.
Time-averaged lift coefficient (a) and time-averaged drag coefficient (b) at different vertical distances for AoA = 0°.
Thus, at pre-stall condition, a relatively high and high are helpful for birds to perform better. However, reports or researches are rare on birds deflecting their alula at pre-stall condition, with the following possible reasons: first, the alula is a 3D device, the 2D simulation may differ from the actual flight; second, the improvement may be too small to overcome the disadvantages caused by alula deflection, such as extra power consumption.
Time history of force coefficients and flow field
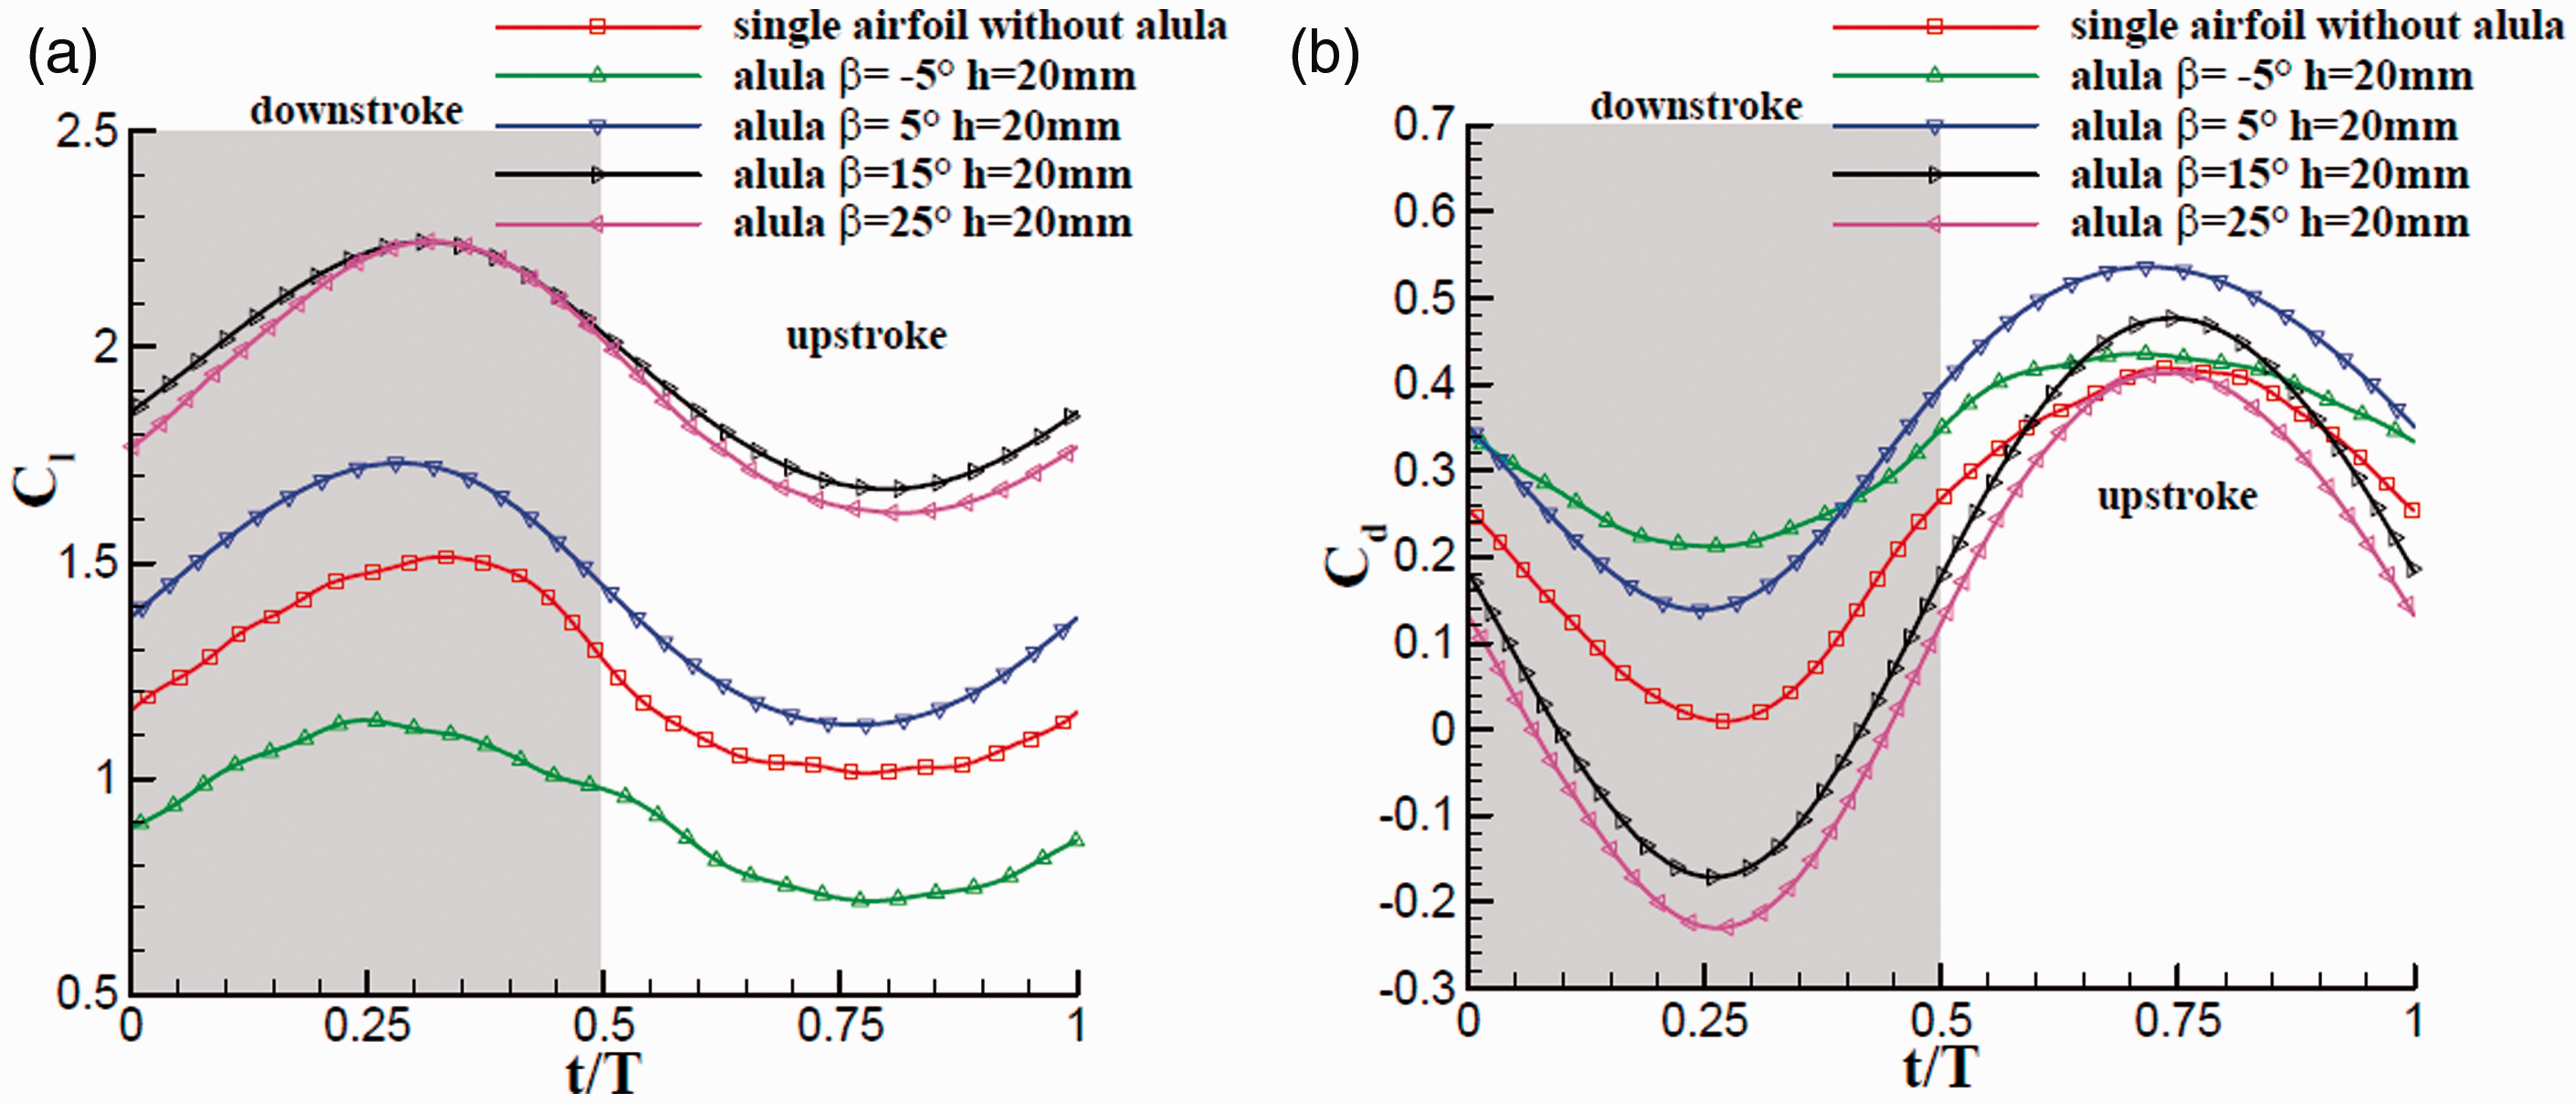
Figure 15 compares the time histories of lift coefficient and drag coefficient at = –5°, 5°, 15°, and 25°. It can be seen from Figure 15 that the curve of moves up as increases, and the shapes of different curves stay close. The maximum almost appears at the end of downstroke about 40% of the flapping cycle. On the other hand, the curve of moves down as increases except at –5°. The airfoil produces a thrust during the downstroke since the value of the drag is negative. Meanwhile, it can also be found that compared with the single airfoil, the change of force in downstroke is larger than that in upstroke, indicating that different have greater effects on downstroke than on upstroke.
Time histories of lift coefficient (a) and drag coefficient (b) at = –5°, 5°, 15°, and 25° (gray area: downstroke; white area: upstroke).
Figure 16 shows the time histories of lift coefficient and drag coefficient at different vertical distances for = –5°. From the figure, it can be seen that the curve of moves up with the increase of at = –5° as a whole. Meanwhile, it can be found that different have a greater influence on the aerodynamic performance during the downstroke than the upstroke because the value of the aerodynamic force changed in downstroke is larger than that in upstroke, especially for , which is similar to .
Time histories of lift coefficient and drag coefficient at different vertical distances for = –5°.
To better understand the effect of flapping motion on the alula, four typical moments in a flapping cycle (t/T = 0, 0.25, 0.5, and 0.75) of both the single airfoil and alula = 5°, = 20 mm airfoil are shown in Figure 17. During the whole flapping cycle, for both the single airfoil and alula airfoil, the flow remains attached. When the airfoil undergoes the plunging motion, the plunge velocity will induce an AoA, which is also a main contributor to thrust production. However, in the pitching motion, the pitch angle and plunge-induced angle offset each other. Finally, the effective AoA considering both the pitch angle and plunge-induced angle will follow a sinusoidal law, with the motion parameters being defined in the present study. Thus, the variation of the lift coefficient almost follows the sinusoidal function. From Figure 17, it can be found that the alula has no apparent effect on the flow structure of main airfoil at pre-stall condition. The presence of the alula mainly changes the pressure distribution of the leading edge and upper surface, causing the difference between lift and drag, which will be discussed in detail in the following part.
Pressure contours of the single airfoil (top row) and alula airfoil (bottom row) in different stages of a flapping cycle.
To further understand the effect of different alula parameters on aerodynamic force, the pressure contours of 40% of the flapping cycle (t/T = 0.4) at = –5°, 15°, and 25° are plotted in Figure 18. It can be seen that different mainly have effects on the low-pressure region of upper surface and the high-pressure region near the leading edge. The higher the is, the larger the low-pressure region and the smaller the high-pressure region. Thus, is higher and is lower. Especially at = 25°, it can be found that the low-pressure region of the alula airfoil is larger than that of the single airfoil, which slightly enhances lift at high at pre-stall condition. It is also found that different mainly affect the low-pressure region of upper surface, but have little effect on the high pressure region of the leading edge and lower surface, which is different from the effect of . On the other hand, at low and medium , the augment of enlarges the low-pressure region, causing an improvement in lift. However, when it comes to high , the low-pressure region reduces as increases, making the lift decrease. These differences in pressure distribution are caused by the disturbance of alula. When the alula deflects from the airfoil, there will be a slot between the alula and the airfoil. When the flow passes through the slot, it will be accelerated. However, the effect of acceleration is limited by and . For low (such as = –5°) and h, the slot between the trailing edge of the alula and the airfoil is too small. Flow separation from the alula will slow down the flow on the upper surface of main airfoil, which causes a big difference in lift. When and become larger, the slot becomes larger, and the low velocity on the upper surface of the alula has less effect on the airfoil. Thus, the effect of acceleration becomes enhanced, leading to a larger low-pressure region on the upper surface of the airfoil, which gradually narrows the gap of the lift between the single airfoil and alula airfoil.
Pressure contours of 40% of the flapping cycle (t/T = 0.4) at = –5° (the first row), 15° (the second row), and 25° (the third row).
Effect of alula different geometric parameters at post-stall condition
Time-averaged aerodynamic force coefficients
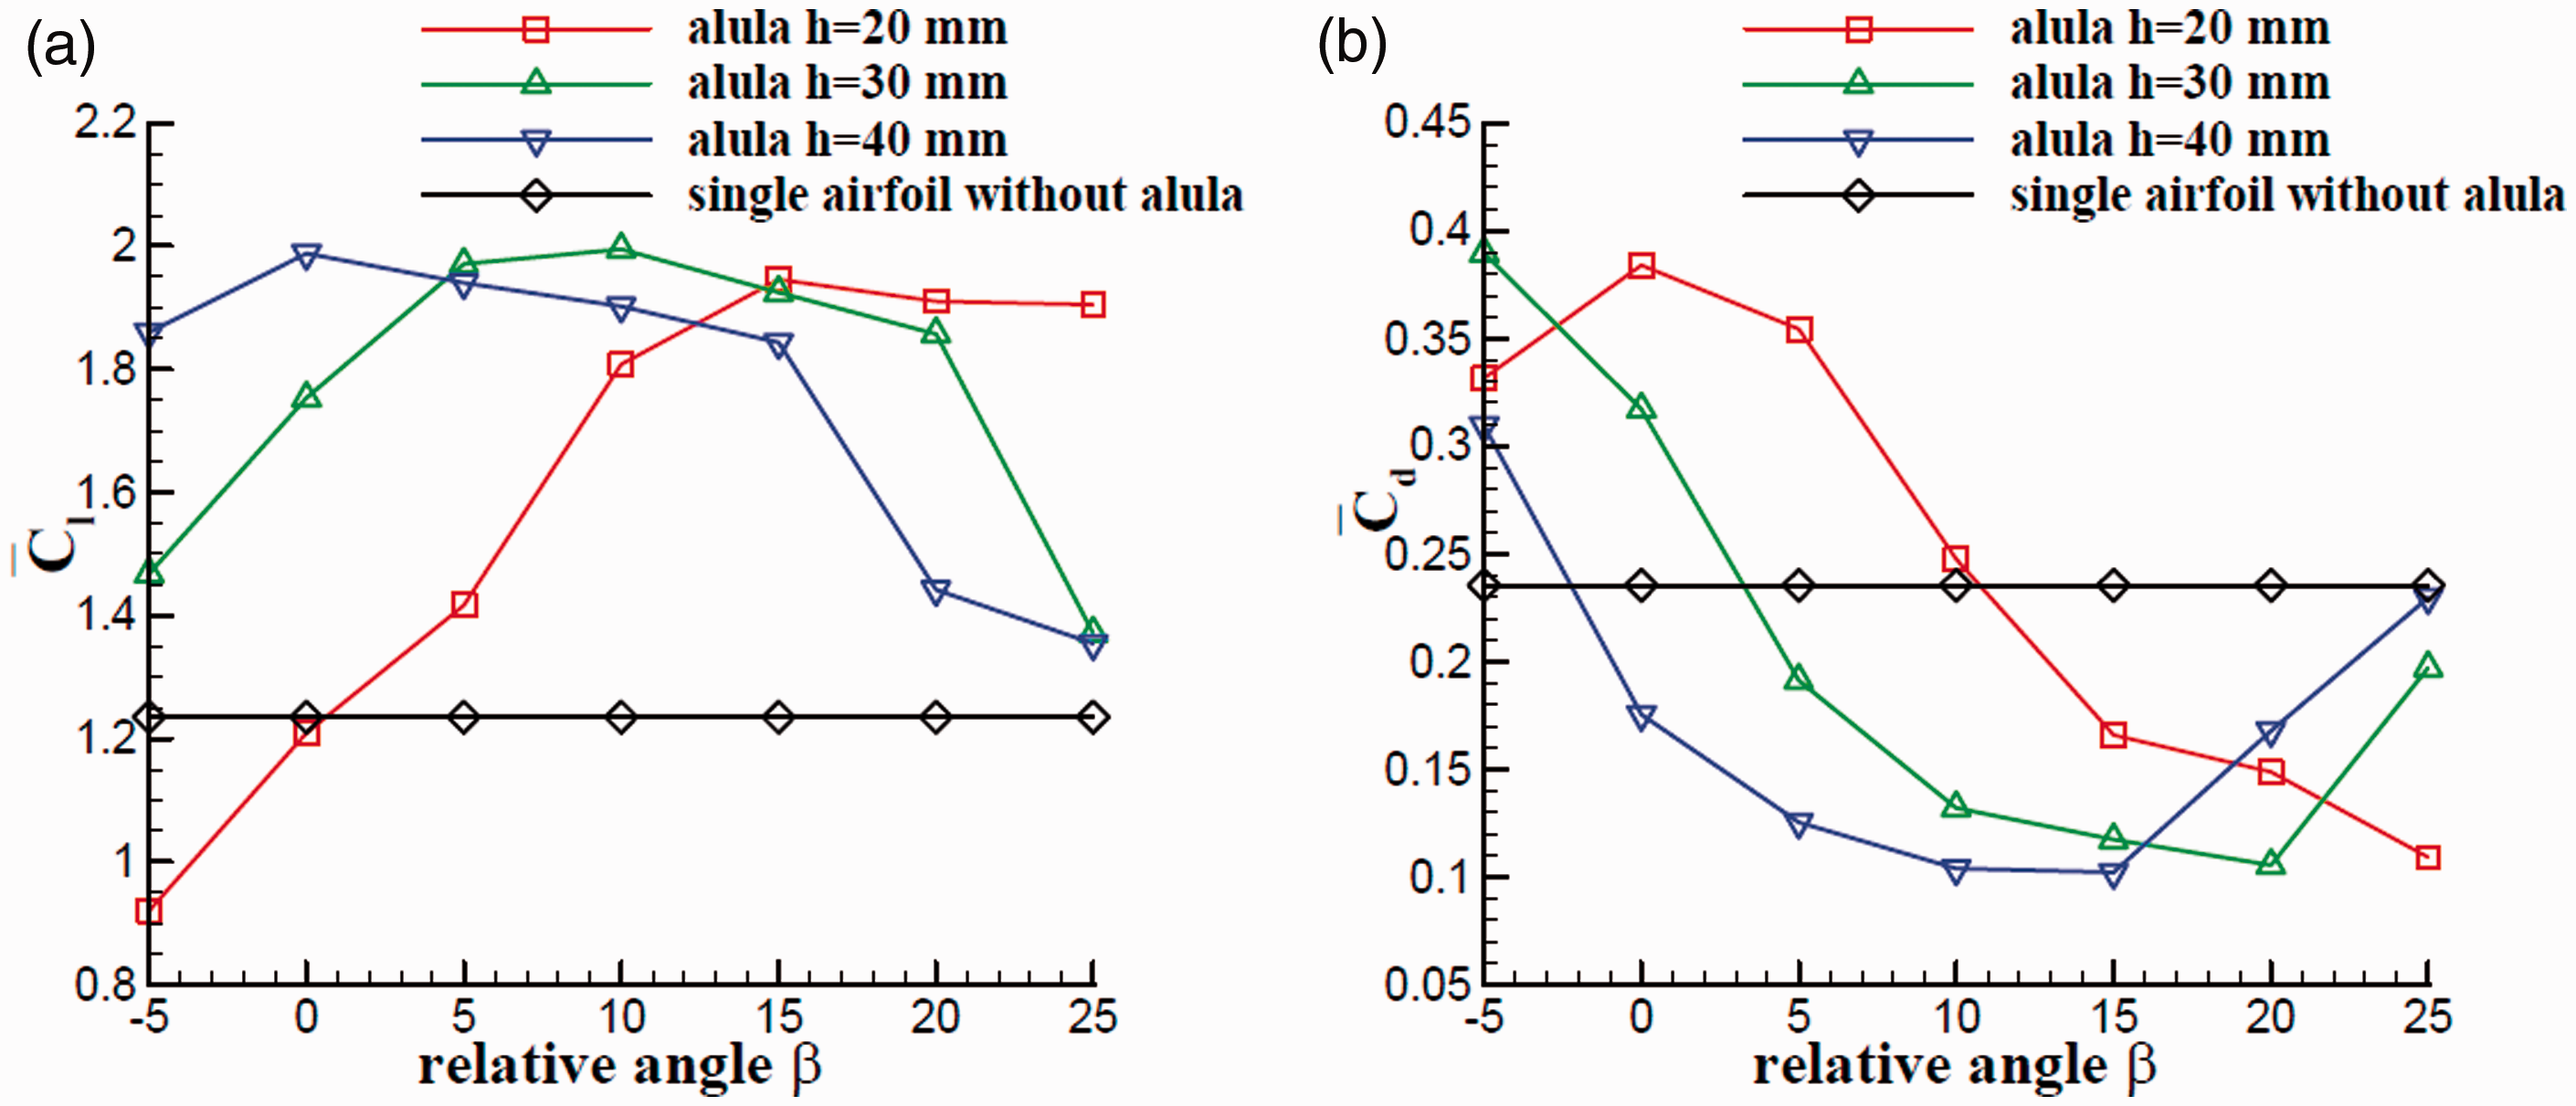
The freestream AoA is set to 15° to simulate the post-stall condition. The time-averaged lift coefficient and time-averaged drag coefficient are plotted in Figure 19. From the figure, it is seen that at a very low , increases with . And at the lowest , the alula deflection causes a reduction in lift. However, when becomes medium and high, does not monotonously increase with , and even after = 15°, decreases as increases. It can be found for most parameter combinations, the alula deployment has apparently improved , which means that the alula is a very useful high-lift device at large AoAs even in the flapping flight. As for , it decreases as increases at most . Only at = –5°, 20°, and 25°, the trend becomes different. As the same as , performs better than that of the single airfoil in most cases.
Time-averaged lift coefficient (a) and drag coefficient (b) at different for AoA = 15°.
It can be also seen that for each , first increases with and then decreases after a certain . As for , there are two opposite trends at different vertical distances. For = 20 mm, first increases and then decreases as increases. When becomes to 30 and 40 mm, the trend reverses. Meanwhile, it is indicated that at a fixed , there is an optimal , which can cause the maximum lift enhancement compared with that of the single airfoil. The optimal is about 15° at = 20 mm, about 10° at 30 mm, and around 0° at 40 mm. It can be found the optimal reduces as increases.
Because different can reflect different spanwise positions of alula, different can reflect different twist angles of alula. Thus, it can be inferred that in birds’ flight, if they can modify the twist angle at different spanwise positions of alula, they can get the best performance at post-stall condition.
Time history of force coefficients and flow field
Figure 20 depicts the time histories of lift coefficient and drag coefficient at = –5°, 5°, 15°, and 25°. It can be found that the curve of mainly moves up with increasing before 15°, and the occurrence of the maximum lift slightly delays. But when comes to 25°, although the value and phase of the maximum lift are close to that at = 15°, the valley is smaller than that of 15°, leading to a lower . In addition, for the single airfoil and alula airfoil with the lowest , the curve generally follows the sinusoidal function except for some roughness due to large flow separation. For other alula airfoils, the variation of lift obeys the sinusoidal law because the flow recovers attached under the effect of alula. As for the curve of , it almost moves down as increases; thus, nearly decreases except at = –5°.
Time histories of lift coefficient (a) and drag coefficient (b) at = –5°, 5°, 15°, and 25°.
Figure 21 depicts the pressure contours of four typical moments in a flapping cycle (t/T = 0, 0.25, 0.5, and 0.75) of both the single airfoil and alula = 15°, and = 20 mm airfoil. For the single airfoil, it can be found that from the beginning of downstroke, the reversed flow emerges on the upper surface. Along with the airfoil moving downstroke, flow separation is gradually aggravated since the effective AoA is increasing. However, due to the hysteresis effect caused by the unsteady motion, the lift does not decrease at once. When the downstroke comes to an end, a large separation vortex forms and sheds from the surface, resulting in reduced lift. During the upstroke, the flow remains separated, leading to a low lift. After the alula deflection, it is seen that during the whole flapping cycle, the flow can remain attached except for some small separation near the trailing edge and alula. Thus, the lift almost varies with the sinusoidal law like the effective AoA and is greatly enhanced compared with that of the single airfoil. It is obvious that the alula can delay flow separation and play an important role in flow control when the airfoil is under the flapping motion.
Pressure contours of the single airfoil (top row) and alula airfoil (bottom row) in different stages of a flapping cycle.
To further investigate the effect of alula on aerodynamic performance, the pressure contours of 30% of flapping cycle (t/T = 0.3) at = –5°, 10°, and 25° are plotted in Figure 22. It is shown that when the airfoil flaps without alula, the upper surface near the trailing edge of the airfoil has a large low-pressure region, and flow separation occurs at t/T = 0.3. At = 20 mm, when the alula deflects with a very low (–5°), the low-pressure region around the trailing edge enlarges, and the flow separation seems more violent, causing a worse aerodynamic performance than that of the single airfoil. But when the alula deflects with a larger (5° or higher), the reverse pressure gradient has been modified, and the flow separation seems delayed. Therefore, the lift greatly increases compared with that of the single airfoil without alula and small alula. It is proved that in the flapping motion, the alula can also function like the slot and improve the flight performance at a large AoA.
Pressure contours of 30% of flapping cycle (t/T = 0.3) at = –5°, 10°, and 25° (dark line: streamline).
Although at the largest and , the alula airfoil performs better than the single airfoil in aerodynamic force, the flow separation is not suppressed. Thus, it can be indicated that the strength of slot effect is limited, and the optimal effect is closely linked to alula geometric parameters. Similar results are concluded in the previous steady experimental study,19 where they found if the alula deflection angle was high and was inappropriate, the distance between the alula and the upper surface of main wing might be too large for a weak vortex to positively affect the boundary layer. From our present unsteady simulation, the alula is too far from the upper surface at the largest and . Although the alula is an effective high-lift device, the distance is too large for the slot effect to totally suppress the flow separation. It can be inferred that birds may modify the geometric parameters of alula to get the best performance in the post-stall and flapping process, such as by twisting different angles at different spanwise positions of alula or by dynamically changing the geometric parameters of alula during the flapping process. However, these hypotheses need to be further studied and confirmed.
Conclusions
In the present study, the aerodynamic performance of a flapping airfoil without and with alula is investigated. The effects of different alula relative angles of attack and vertical distances between the main airfoil and the alula are studied at pre-stall and post-stall conditions by using Fluent, with the following results:
At pre-stall condition, the alula deflection can slightly enhance lift at high ; however, at low and medium , the alula deflection degrades the aerodynamic performance. At post-stall condition, after certain , the alula deflection substantially enhances lift.
At pre-stall condition, lift increases with and . When the flow comes to the post-stall condition, a maximum lift enhancement is achieved for the alula deflection with a fixed . For example, the optimal is about 15° when = 20 mm and about 0° when = 40 mm. The optimal decreases as increases. The alula possesses the slot effect in the flapping motion, and the optimal effect is closely linked to its geometric parameters. It also indicates that the alula may have different twisting angles at different spanwise positions to achieve the best performance in birds’ flight.
At post-stall condition, the alula deflection can delay flow separation during the whole flapping cycle and enlarge the low-pressure region of upper surface, and thus, the lift is significantly enhanced. At different β, both the low-pressure region of upper surface and high-pressure region of leading edge are different. However, different mainly affect the low-pressure region of upper surface.
The numerical simulation results show some regulations of different alula geometric parameters and the potential for the alula-inspired device to enhance lift in the unsteady case. Therefore, the results are instructive for design of BUAVs, especially for improving their capabilities of taking off and landing. However, 3D effect is a factor that cannot be ignored in actual flight. For example, due to the limitation of a 2D model, the effect of alula tip vortex cannot be studied in 2D simulation. The alula tip vortex will inject momentum into the boundary layer, which is also an important role of alula proved by the previous study in the steady situation. Moreover, the tip vortex produced in the finite wing may have complex interactions with other vortex systems caused by the unsteady effect, which is also the biggest difference between 2D and 3D models. Meanwhile, the avian real flight motion not only includes flapping and twisting but also contains folding and sweeping which are also important in flight but cannot be revealed by 2D simulation. Therefore, we aim to build a 3D model with alula to study its effect in the future work. Besides, to further investigate the mechanism of lift enhancement, more accurate simulation methods such as detached-eddy simulation and large-eddy simulation are to be used in the future.
Footnotes
Declaration of conflicting interests
The author(s) declared no potential conflicts of interest with respect to the research, authorship, and/or publication of this article.
Funding
The author(s) disclosed receipt of the following financial support for the research, authorship, and/or publication of this article: This work was supported in part by the National Key Research and Development Program of China under Grant 2017YFB1300102, and National Natural Science Foundation of China under Grant 11872314 and U1613227 and the China Scholarship Council.
ORCID iD
Han Bao
References
1.
ElAwadYAElJackEM. Numerical investigation of the low-frequency flow oscillation over a NACA-0012 aerofoil at the inception of stall. Int J Micro Air Veh 2019; 11: 1–17. DOI: 10.1177/1756829319833687.
2.
YangTWeiMJiaK, et al. A monolithic algorithm for the flow simulation of flexible flapping wings. Int J Micro Air Vehic 2019; 11: 1–13. DOI: 10.1177/1756829319846127.
3.
FangZGongCRevellA, et al.
Passive separation control of a NACA0012 airfoil via a flexible flap. Phys Fluids2019;
31: 101904.
4.
GursulICleaverD. Plunging oscillations of airfoils and wings: progress, opportunities, and challenges. AIAA J 2019; 57: 3648–3665. DOI: 10.2514/1.J056655.
ZhangCRossiC.A review of compliant transmission mechanisms for bio-inspired flapping-wing micro air vehicles.Bioinspir Biomimet2017;
12: 025005.
7.
KarásekM, et al. Accurate position control of a flapping-wing robot enabling free-flight flow visualisation in a wind tunnel. Int J Micro Air Veh 2019; 11: 1–18. DOI: 10.1177/1756829319833683.
8.
ZhangH, et al. A method for evaluating the wind disturbance rejection capability of a hybrid UAV in the quadrotor mode. Int J Micro Air Veh 2019; 11: 1–19. DOI: 10.1177/1756829319869647
9.
VidelerJJ.Avian flight.
Oxford, UK:
Oxford University Press, 2006.
10.
NachtigallW andKempfB.Vergleichende untersuchungen zur flugbiologischen funktion des Daumenfittichs (Alula spuria) bei vögeln.Zeitschr Verglei Physiol1971;
71: 326–341.
11.
CarruthersACThomasALRTaylorGK.Automatic aeroelastic devices in the wings of a steppe eagle Aquila nipalensis.J Exp Biol2007;
210: 4136–4149.
12.
ÁlvarezJCMeseguerJMeseguerE, et al.
On the role of the alula in the steady flight of birds. Ardeola2001;
48: 161–173.
13.
ChoiHParkHSagongW, et al.
Biomimetic flow control based on morphological features of living creatures. Phys Fluids2012;
24: 311–477.
14.
MeseguerJ, et al. The alula: a leading edge, high lift device of birds.
Spain:
Universidad Politécnica de Madrid, 2003.
15.
MeseguerJFranchiniSPérez-GrandeI, et al.
On the aerodynamics of leading-edge high-lift devices of avian wings. Proc IMechE, Part G: J Aerosp Eng2005;
219: 63–68.
16.
LeeSIKimJParkH, et al.
The function of the alula in avian flight.Sci Rep2015;
5: 9914.
17.
AustinBAndersonAM. The alula and its aerodynamic effect on avian flight. In: ASME 2007 international mechanical engineering congress and exposition. New York, NY: American Society of Mechanical Engineers, 2007.
18.
MandadzhievBA, et al. Alula-inspired leading edge device for low Reynolds number flight. In: ASME 2016 conference on smart materials, adaptive structures and intelligent systems. New York, NY: American Society of Mechanical Engineers, 2016.
19.
MandadzhievBALynchMKChamorroLP, et al.
An experimental study of an airfoil with a bio-inspired leading edge device at high angles of attack. Smart Mater Struct2017;
26: 094008.
20.
LinehanT andMohseniK.Investigation of a sliding alula for control augmentation of lifting surfaces at high angles of attack. Aerosp Sci Technol2019;
87: 73–88.
21.
GeCRenLLiangP, et al.
High-lift effect of bionic slat based on owl wing. J Bionic Eng2013;
10: 456–463.
22.
NeefMHummelD.Euler solution for a finite-span flapping wing.Fixed Flapp Wing Aerodyn Micro Air Veh Appl2001;
195:429–449.
23.
KatzmayrR.Effect of periodic changes of angle of attack on behavior of airfoils.
USA:
National Advisory Committee for Aeronautics, 1922.
24.
Von KarmanBJM.Aerodynamic theory.
Heidelberg, Germany:
Springer, 1935.
25.
YoungJLaiJCS.Mechanisms influencing the efficiency of oscillating airfoil propulsion. AIAA J2007;
45: 1695–1702.
26.
TaylorGKNuddsRLThomasALR.Flying and swimming animals cruise at a Strouhal number tuned for high power efficiency.Nature2003;
425: 707–711.
27.
LiuTKuykendollKRhewR, et al.
Avian wing geometry and kinematics. AIAA J2006;
44: 954–963.
28.
LiuT, et al. Avian wings. In: 24th AIAA aerodynamic measurement technology and ground testing conference, Portland, Oregon, 28 June–1 July 2004.
29.
RongMPeiqingL.Numerical simulation of low-Reynolds-number and high-lift airfoil S1223. Lect Notes Eng Comp Sci2009; 2: 1691–1696.
30.
ColesDWadcockAJ.Flying-hot-wire study of flow past an NACA 4412 airfoil at maximum lift. AIAA J1979;
17: 321–329.
31.
AshrafMA.Numerical simulation of the flow over flapping airfoils in propulsion and power extraction regimes. University of New South Wales, Australian Defence Force Academy, School of Engineering and Information Technology, 2010.
32.
HoeijmakersHWMulderJ. Computational and experimental investigation into flapping wing propulsion. In: 54th AIAA aerospace sciences meeting, San Diego, CA, USA, 4–8 January 2016.
33.
LeeTGerontakosP.Investigation of flow over an oscillating airfoil. J Fluid Mech2004;
512: 313–341
34.
GharaliKJohnsonDA.Dynamic stall simulation of a pitching airfoil under unsteady freestream velocity. J Fluids Struct2013;
42: 228–244.
35.
WangSInghamD BMaL, et al.
Numerical investigations on dynamic stall of low Reynolds number flow around oscillating airfoils. Comp Fluids2010;
39: 1529–1541.
36.
GengFKalkmanISuikerASJ, et al.
Sensitivity analysis of airfoil aerodynamics during pitching motion at a Reynolds number of 1.35 × 10⁵. J Wind Eng Indus Aerodyn2018;
183: 315–332.
37.
WangS, et al.
Turbulence modeling of deep dynamic stall at relatively low Reynolds number. J Fluids Struct2012;
33: 191–209.
38.
LiXFengL-HLiZ-Y.Flow mechanism for the effect of pivot point on the aerodynamic characteristics of a pitching airfoil and its manipulation. Phys Fluid2019;
31: 087108.
39.
KarbasianHRKimKC.Numerical investigations on flow structure and behavior of vortices in the dynamic stall of an oscillating pitching hydrofoil.Ocean Eng2016;
127: 200–211.