
Abstract
This paper presents experimental results on the relation between forward airspeed, pitch angle, and power consumption of a quadcopter unmanned aerial vehicle. The quadcopter consists of an interchangeable spherical body, four cylindrical arms, and small propellers mounted at 1 m diagonal distance to minimize interference between body and propellers. This simple geometry facilitates results reproduction and comparison with simulation. Two different takeoff masses and four diameters of spherical bodies are tested for their steady-state speed and power for pitch angles up to
Introduction
Multicopter unmanned aerial vehicles (UAVs), or “drones”, have become a popular platform for applications such as aerial imaging, mapping, and inspection. These applications usually do not require high speeds or ranges but benefit of the vertical takeoff and landing capabilities of the multicopters. Moreover, in many countries, flying beyond visual line of sight (BVLOS) is not permitted yet. Therefore, most of todays’ multicopter designs are optimized for maximum flight time and payload capacity near the hover flight condition. New applications in which the drones will fly BVLOS, such as drone deliveries or offshore inspections, require long flight times, high speeds, and range. The majority of published research on multicopters focuses on dynamics and control of the vehicles such as Huang et al. 1 and Hoffmann et al. 2 who incorporate the aerodynamics of multicopters by using helicopter theory to improve control when deviating significantly from the hover regime. Sufficient experimental data are required to develop models that can accurately predict the performance and can be used in improved control, design software, or trajectory planning. However, there is only little published data for the flight performance of multicopters in forward flight. Schiano et al. 3 performed wind tunnel experiments on a quadcopter to create data for a complete aerodynamic model. However, the experiments were carried out without turning propellers. Neumann and Bartholmai 4 and Neumann et al. 5 determined the relation between attitude and the wind velocity by performing wind tunnel experiments in hover and forward flight conditions to determine the 2D wind direction and speed when tracking hazardous gases. Russell et al. 6 performed wind tunnel tests on five commercially available multicopters with varying geometries to determine forces, moments, and power as function of the wind speed, r/min, and attitude. Marino et al. 7 performed wind tunnel tests to map the relation between power and the wind velocity vector to later use the multicopter as a flying wind sensor. Prudden et al. 8 performed multiple experiments in wind tunnel conditions to map forward flight behavior. The focus was on the influence of frame geometry variations and the mutual interference between the rotors. For wind tunnel tests, creating a free-floating steady-state regime requires tuning the individual motor r/min to create a zero net force and moment. Next to that, vibrations created by the propulsion disturb these force readings or damage the sensor and for larger of heavier drones, the propeller-induced flow could significantly influence the wind tunnel flow. Rather than simulating steady-state flight conditions in a wind tunnel, this paper focuses on the forward flight regime with a constant speed and altitude in real outdoor flight in wind-still conditions as presented in Figure 1.

Multicopter with
Experiment
Components, configurations, and conditions
The geometry of the quadcopter consists of an interchangeable sphere as body, four cylindrical arms with a diameter 20 mm, and a diagonal distance between the propeller shafts of 1 m. The Graupner 9 × 5 propellers, for which the geometry is thoroughly described in Theys et al.,
9
have a diameter of

Quadcopter dimensions in mm with four different possible diameters of spherical body.
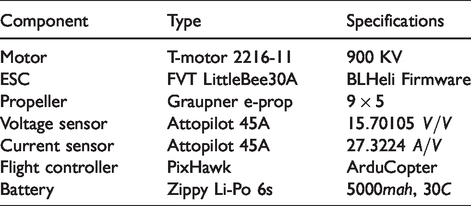
Figure 3 shows the multicopter fitted with a 40 cm diameter spherical body during mass check right before takeoff. Table 1 lists an overview of the used components that complete the quadcopter test setup.

Multicopter fitted with a 40 cm spherical Styrofoam body during mass check right before takeoff.
Used components for the test setup.
The four different diameters of hollow Styrofoam spheres can be fitted onto the body with cut-outs for the arms. Lead is added along the inner surface of the sphere to bring them all to the same mass. Table 2 presents an overview of the used spherical bodies.
Styrofoam spheres with different diameters used for the shape of the body, brought to a total mass of

With all bodies at the same mass, an additional lead mass can be added to achieve a total takeoff mass of
Mass distribution of the quadcopter for two different total masses.

Tests took place at two different days. Table 4 presents the atmospheric conditions at the time of the tests.
Environmental conditions during the experiments.
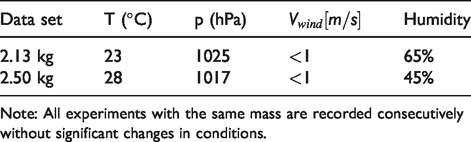
Note: All experiments with the same mass are recorded consecutively without significant changes in conditions.
Test procedure and data processing
The goal of the test procedure is to record the power consumption and resulting speed in steady-state level flight of the quadcopter as a function of its pitch angle. Speed, endurance, range, and payload capacity are fully determined if this relation is known for different total masses. 7
Flights are performed flying up and down one path at constant altitude. The pitch angle is gradually increased after each run up to a maximum pitch angle of
Figure 4 presents one run out of the recorded data during a flight. After turning the nose

Illustration of one run out of the recorded data during a flight. The multicopter accelerates to a steady-state velocity of
Figure 5 presents the total power consumption and horizontal velocity as a function of the pitch angle for all recorded data during the test flight of the configuration with a total mass of

Total power consumption and horizontal velocity as a function of the pitch angle for the configuration with
This procedure is applied to all configurations resulting in eight data sets of steady-state horizontal flight power and speed as a function of the pitch angle that varies between
Zones of steady-state horizontal flight recorded per configuration.

The initially planned total mass of
Results and discussion
Resulting speed for increasing pitch angles
Figure 6 shows the cruise speed at pitch angles from hover to

Cruise speed at pitch angles from hover to
To visualize the influence of body diameter and mass on the top speed, Figure 7 shows the average top speed at

Measured top speeds at
Power consumption in forward flight
Figure 8 shows the cruise power for pitch angles from hover to

Power as function of pitch θ and speed V for four different body diameters and two total masses. Top:
Effective lift-to-drag ratio
The efficiency with which aircraft can move through the air can be expressed with the glide ratio, also known as the aerodynamic efficiency


Figure 9 shows the calculated effective lift-to-drag ratio between hover and the maximum speed at
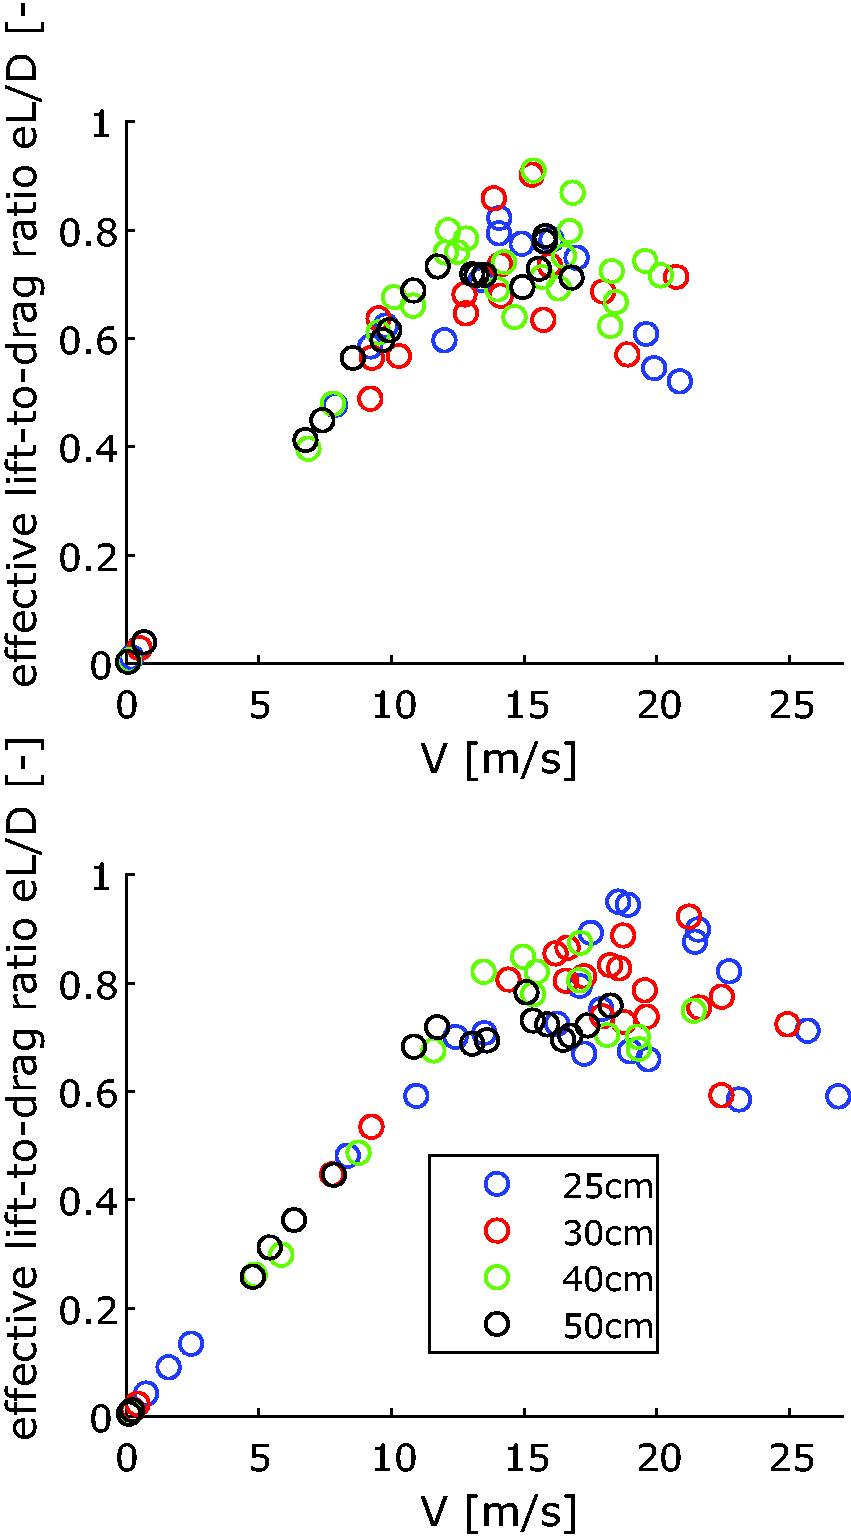
Calculated effective lift-to-drag ratio at pitch angles from hover to
Equivalent frontal surface
As it is common practice in helicopter performance identification,
10
the drag of the body can be represented with an equivalent frontal surface area Aeq with CD = 1

For a multicopter without lifting surfaces and flying at a constant low speed, the forces that apply are the weight, drag, and the force of the propellers. The latter one assumed to be along the shaft Fx. These forces are schematically presented in Figure 10. For this case, we can write the equivalent frontal surface as

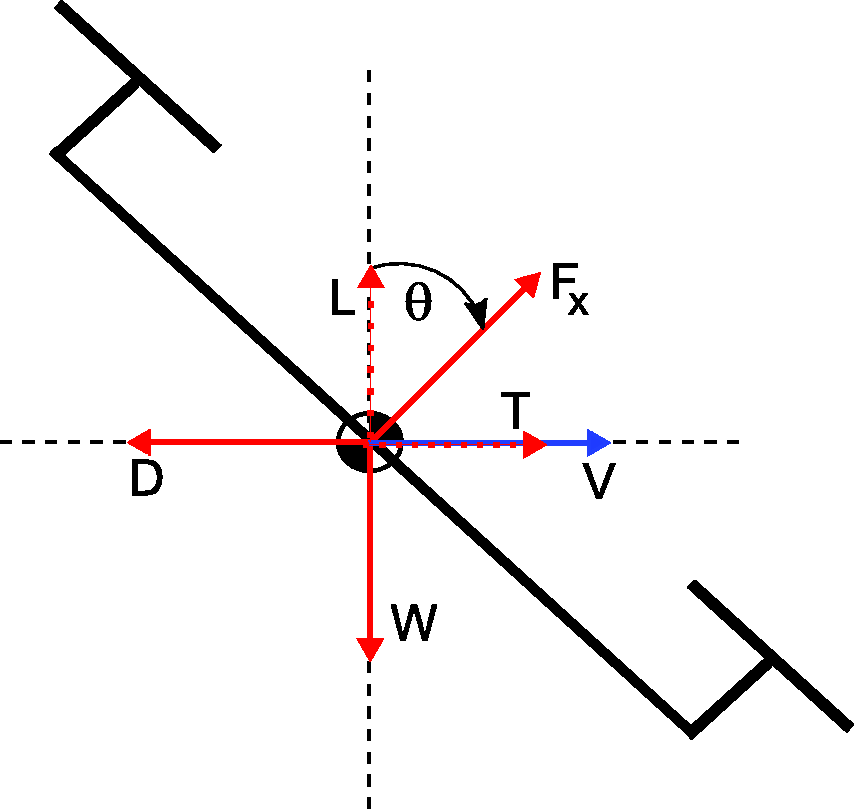
Forces on a VTOL UAV without lifting surfaces at constant speed and altitude.
Figure 11 shows the equivalent frontal surface at pitch angles from hover to
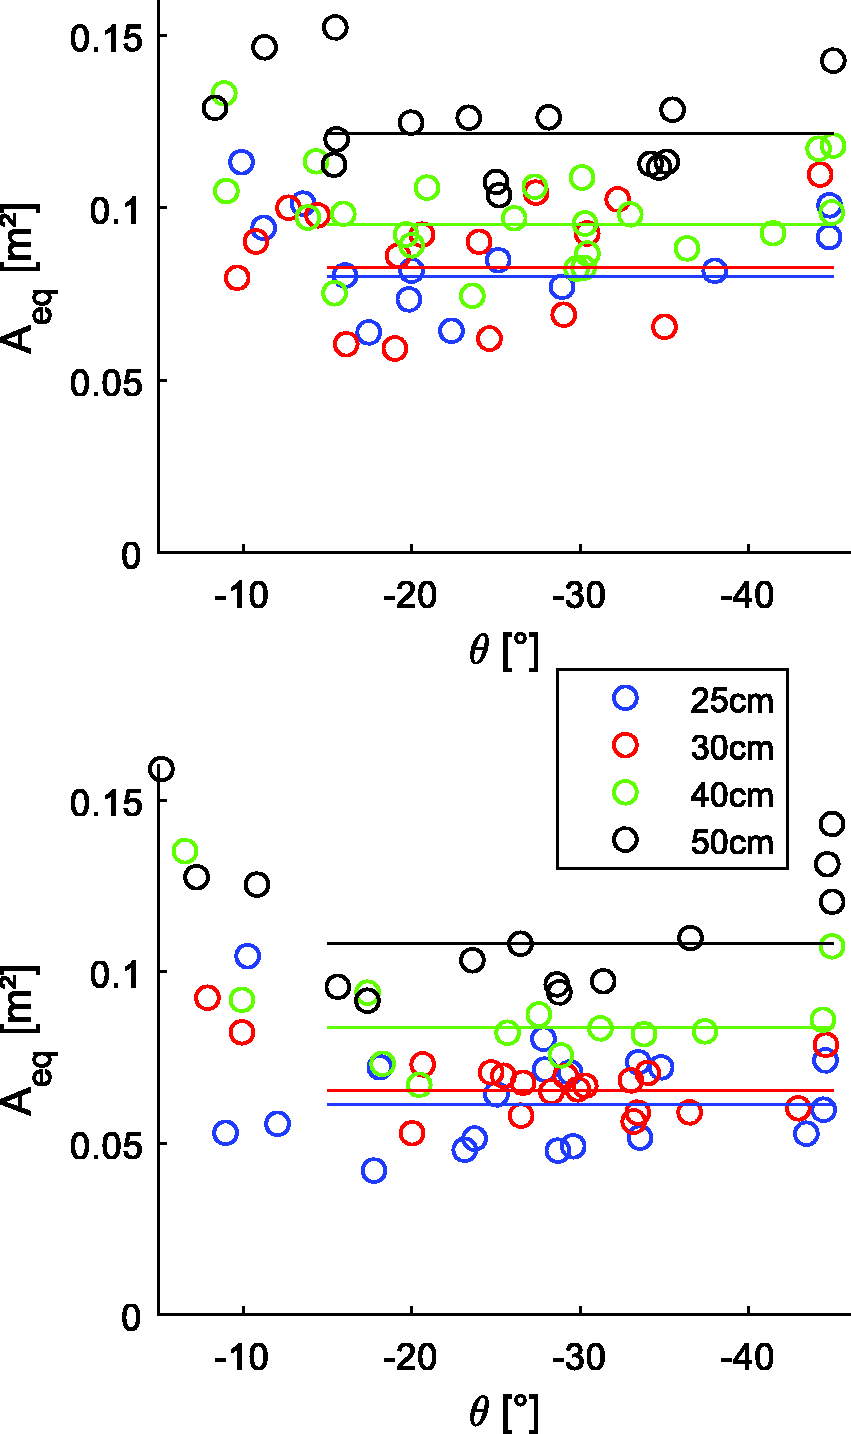
Calculated equivalent frontal surface at pitch angles from hover to
Figure 12 shows these mean equivalent frontal surface for angles between

Average calculated equivalent frontal surface for pitch angles between
Hover efficiency
As an example on how these data can be used for model validation, for the unique case of hover, the momentum theory as described by Rankine–Froude
12
and also known as the Actuator Disk Theory, can be used to predict the power as a function of the total mass mtot and the total disk area covered by the propellers Adisk. The power required from the battery Pbatt can be calculated with this basic model as

Figure 13 shows the average of the measured hover power for three different masses. Next to

Hover power and fit based on momentum theory with the assumption of a constant efficiency from battery power to kinetic energy of the accelerated air.
Conclusion and future work
Steady-state horizontal velocity and power of a quadcopter with a basic geometry and four interchangeable bodies of different diameters was tested at two total masses and pitch angles from
The data set obtained during the tests for this paper can be used as a reference for modeling the flight behavior of multicopter UAVs in forward flight. Trends are observed in the data but for further validation, more test data of different multicopters is required. Additional sensors can be added to monitor the individual states of each propulsion unit and measure r/min, voltage, current to allow also model validation of the propulsion system.
Footnotes
Declaration of conflicting interests
The author(s) declared no potential conflicts of interest with respect to the research, authorship, and/or publication of this article.
Funding
The author(s) disclosed receipt of the following financial support for the research, authorship, and/or publication of this article: This research was funded by VLAIO grant HBC.2017.0198.