
Abstract
The present paper aims at investigating the impact of an airfoil design on the propulsion system for a Martian rotary wing micro air vehicle. The main challenge for flying on Mars is the atmosphere’s density and speed of sound that are significantly lower than on Earth. It leads to compressible ultra-low Reynolds number (
Keywords
Introduction
Since 2004, three exploration rovers have successfully landed on the Martian surface. Yet, only about 60 km have been explored on 21,000 km of the planet’s circumferential path. Slow exploration rate is mainly due to the hilly landscape implying a limited traversable terrain and a lack of visibility on the ground. An aerial vehicle associated to rovers could significantly increase their range and mobility by providing an aerial point of view of their upcoming pathway. Three concepts are mature and dependable enough for a Martian mission: fixed-wing aircrafts, balloons, and rotorcrafts. For navigation assistance, rotorcrafts embody the most suited concept providing multiple take-off and landing, maneuverability, speed, and hover ability. 1 In the present project, focus is on the aerodynamic design of a hovering coaxial rotorcraft’s propulsion system with a 30 cm diameter. The helicopter is characterized with small dimensions in order to facilitate swarming, maneuverability, and interactions with rovers and, in a potential future, with mankind.
However, the Martian atmosphere is far from micro air vehicle (MAV) friendly. Density is substantially lower than on Earth at the ground level and is highly variable depending on the seasonal and daily cycles. During daytime, it can fluctuate between 0.014 and 0.020 kg/m3.2 Based on numbers from NASA, altitude has little impact on the near-surface density with variations up to 5% below 500 m. The Martian atmospheric temperature, strongly controlled by suspended dust holding solar radiations, is also lower than on Earth and eminently variable with 60°C of the diurnal near-surface range. 3 For a Martian mission, technology must be able to sustain −100°C. The low temperature, along with the different atmospheric composition, directly lowers the speed of sound: compressibility effects are more easily triggered. Furthermore, heavy atmospheric winds, up to 5 m/s during daytime, and turbulences can degrade the flight efficiency and stability. Averaged atmospheric conditions are summarized in Table 1.
Averaged atmospheric conditions of Mars and the Earth at ground level.

For propulsion system optimization, MAV’s mass is set to 200 g, the speed of sound to the average value, and density to the daytime minimal value: 0.014 kg/m3. Corresponding flows experienced by the vehicle’s rotors are subcritical, with a maximal tip Mach number reaching 0.7, and the chord-based Reynolds numbers are below 104. A new aerodynamic domain is explored: compressible ultra-low Reynolds number flows.
Several studies have numerically and experimentally assessed the boundary layer stability in this range of Reynolds number. The main transition mechanism is the separation bubble; amplification of Tollmien–Schlichting waves is unlikely to happen. In an incompressible undisturbed environment, the critical Reynolds number presented by Carmicheal
4
,
For ultra-low Reynolds number flows, the aerodynamic performance of a typical airfoil has been experimentally measured in water tunnels,
10
wind tunnels,
11
and a depressurized wind tunnel.
12
The influence of typical non-optimal airfoil shapes on the experimental rotor performance has also been evaluated on nano-rotors13,14 and in a depressurized facility.
15
Two incompressible camber line optimizations with a prescribed thickness distribution have been carried out in the range of Reynolds number of the Martian MAV. One based on XFoil
16
for
Therefore, for the ultra-low Reynolds number airfoil optimization, neither the impact of flow compressibility nor the airfoil’s thickness distribution has been studied so far. Since the existing studies compare the typical airfoil’s performance, the influence of small variations in the effective airfoil shape has not been evaluated numerically or experimentally. Finally, numerical solvers have not been fully validated on the Martian flows since no computational study has provided a simulation taking on board the three-dimensionality caused by the experimental facility.
This paper presents an investigation of the impact of the airfoil design on the aerodynamic performance of a Martian rotor. Steady and unsteady numerical solvers are evaluated by modelling the test section of a 3D depressurized wind tunnel. 18 Then, a compressible airfoil shape optimization process based on the 2D steady performance is characterized and carried out step by step for the flow behavior apprehension. Finally, the impact of airfoil shapes on the rotor performance is evaluated with an experimental campaign recreating the Martian atmospheric conditions and gas composition in an 18 m3 tank.
Assessment of 2D and 3D numerical tools for compressible ultra-low Reynolds number flows
Solver validation is essential for a relevance evaluation of a numerical investigation. In this part, the efforts simulated by ONERA’s 3D unsteady solver, elsA, 19 are compared to the known experiment recreating the Martian atmospheric conditions: the Mars Wind Tunnel (MWT). 18 The steady quick solver, XFoil, is assessed for a purpose of the airfoil optimization process.
Triangular airfoil experiment in Tohoku University’s MWT 18
The MWT experimental device is located at Tohoku’s University (Figure 1). Depressurization allows it to reach the Martian density for different flow Mach numbers. For the solver validation purpose, the triangular airfoil experiment 18 has been considered. This airfoil’s strong leading edge camber and sharpness causes significant unsteadiness in the flow, making it interesting for the numerical validation.

Tohoku University’s Mars Wind Tunnel. 18
Even if the MWT experiment is supposed to recreate 2D flows, Pressure-Sensitive Paint (PSP) measurements showed a three dimensionality over the airfoil. Moreover, the author’s 3D Large Eddy Simulation (LES) computations 18 provide greater lift and drag predictions than the experiment while not taking into account the test section. This phenomenon is due to the wall effect on the sides of the test section: for proper flow and forces evaluations, the entire test section needs to be simulated.
3D unsteady Navier–Stokes simulation of the experimental test section
The solver elsA was developed by ONERA in the 1990s. It is based on an integral form of the compressible Navier–Stokes equations. 19 Considering the Reynolds number range, the hypothesis of laminar flow in a non-turbulent environment is conceivable. 4 A boundary layer stability study and Moore’s transition criteria 20 have preliminary confirmed that no transition would occur neither by the amplification of Tollmien–Schlichting waves nor by the separation bubble. Mesh convergence has been studied for all Navier–Stokes simulations.
For the 3D simulation, representative experimental flow conditions (
As presented in Figure 2, laminar unsteady Navier–Stokes solver accurately predicts the 3D forces generated at the two first angles of attack (5° and 10°). For the third angle of attack, corresponding to a fully detached flow, the computed lift is over-estimated. Mesh density over the airfoil is insufficient to accurately simulate a highly unsteady detached flow. However, in the present study, airfoil’s aerodynamic performance is compared in their most effective range of incidences. Therefore, the solver is validated for 3D flows, and by extension, we assume that it provides reliable 2D flow predictions.
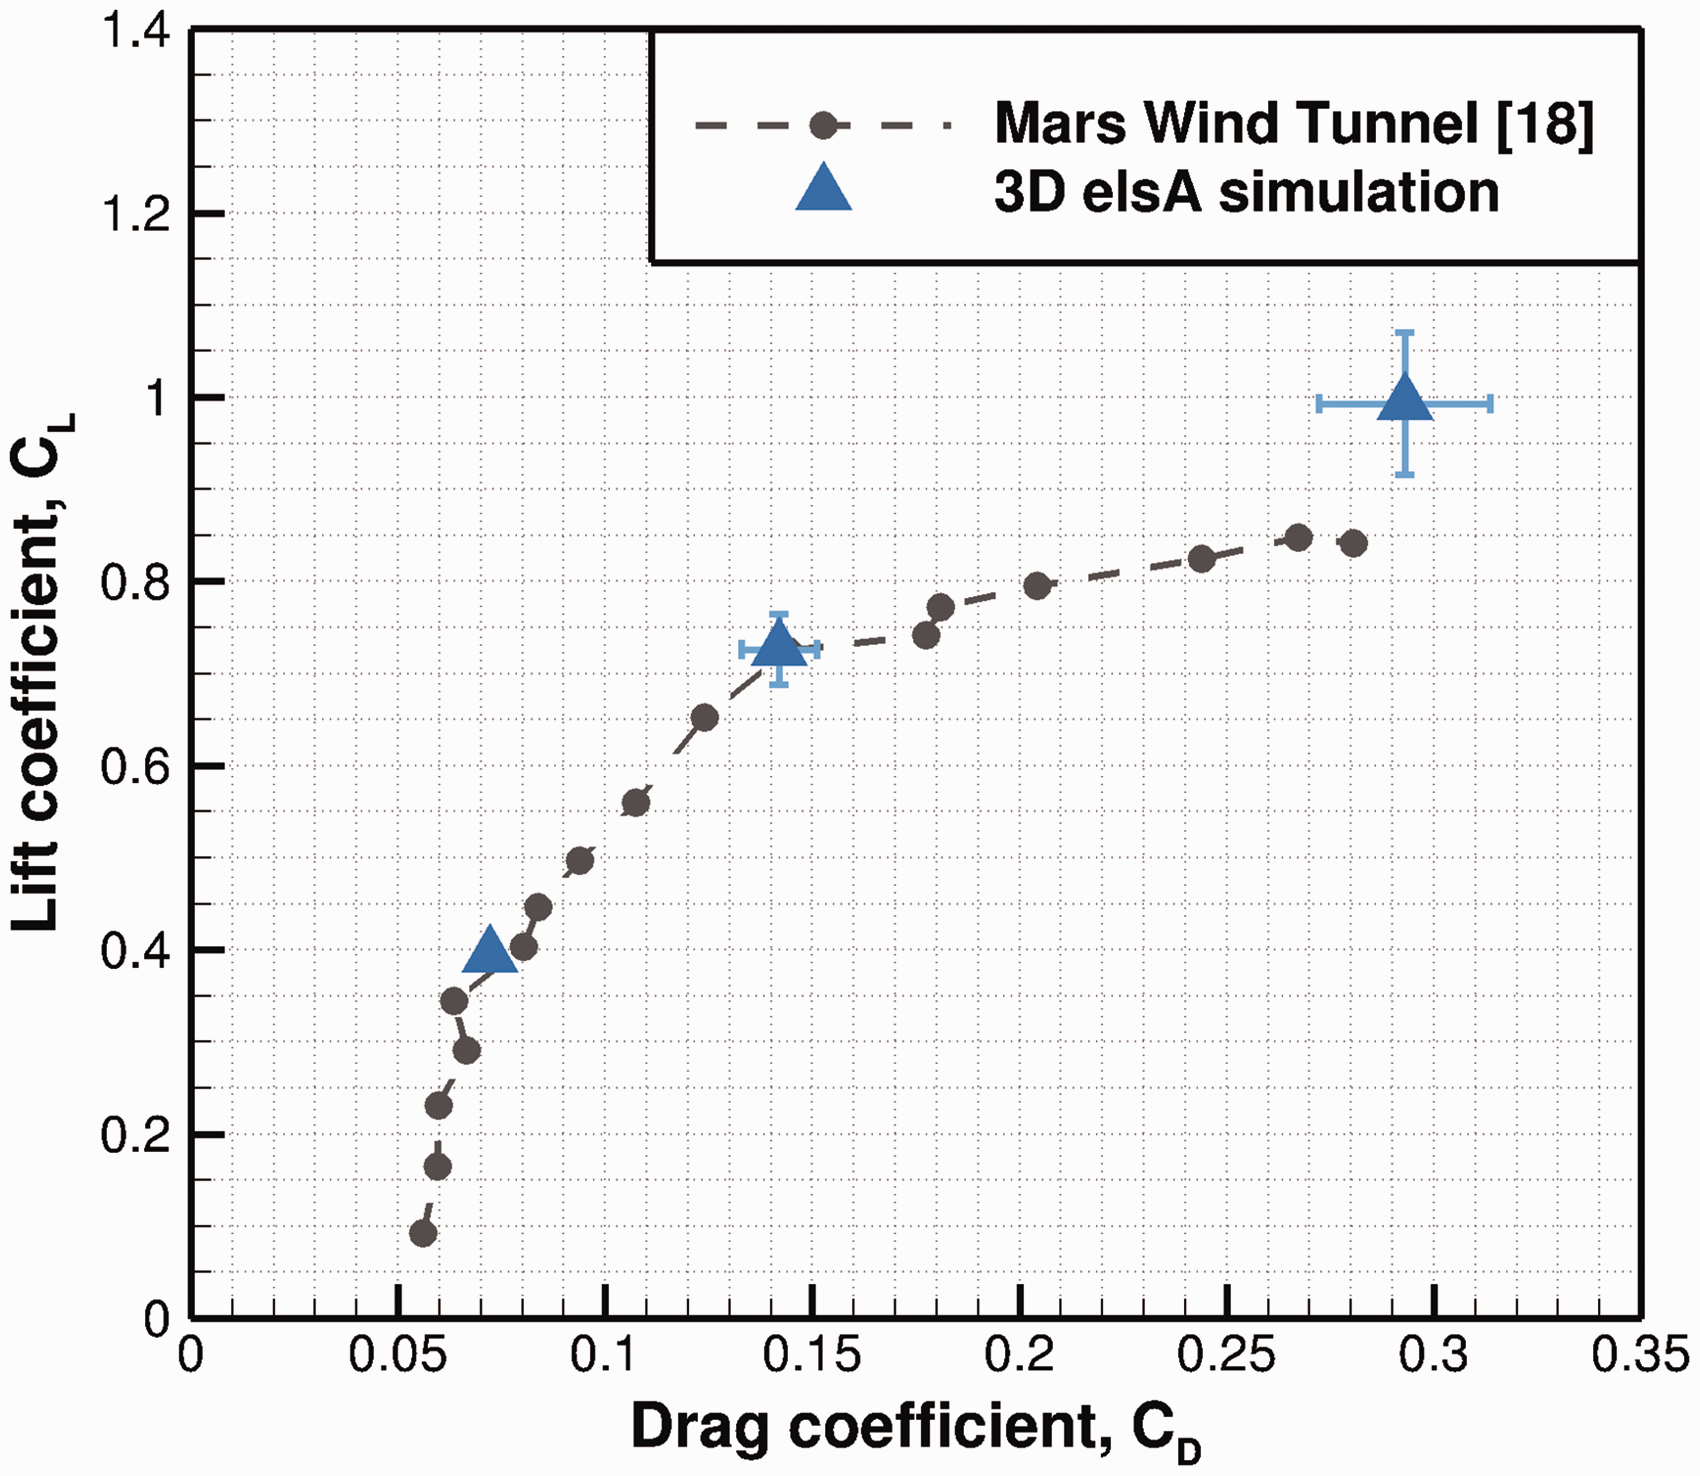
Polar comparing MWT measurements and 3D computations from elsA (with standard deviation) (
2D steady solver assessment for an airfoil optimization process
In an airfoil optimization process, a quick and effective tool is needed for the performance comparison: unsteady Navier–Stokes simulations’ computational cost is too significant. XFoil, a potential flow solver strongly coupled with the integral boundary layer formulation, provides a quick steady evaluation of lift, drag, and boundary layer state. In order to evaluate the laminar XFoil forces prediction, it is compared to the laminar steady and unsteady elsA solver on the triangular airfoil test case (
As presented in Figure 3(a), unsteadiness in 2D compressible ultra-low Reynolds number simulations tends to increase the forces generated by the airfoil. This is due to the flow recirculation created by the boundary layer separation. For

Comparison of different 2D solvers on compressible ultra-low Reynolds number flows. (a) Polar comparing elsA steady and unsteady 2D simulations (with standard deviation) and XFoil (
In steady computations using XFoil or elsA, the boundary layer separation creates a massive drag rise without significant lift gain causing poor aerodynamic performance. However, forces predictions anterior to heavy boundary layer separation provide valuable hints on the airfoil’s performance. Therefore, we consider that the steady solver XFoil can be used for airfoil comparison in an optimization process acknowledging that it does not take on board the entire physic of the separated flow.
Robust airfoil optimization process based on the XFoil’s performance evaluations
In a purpose of optimization, automatic airfoil generation with finite parameters is primordial. The Universal Parametric Geometry Representation Method – CST method
21
has been chosen for its ability to recreate any
The major issue raised by XFoil is convergence: many phenomena can cause a non-convergence compelling the optimization process to be extremely robust to it. The optimization process consists of evaluating the entire parameters domain with an increasing proximity between the different sets of parameters. As presented in Figure 4, from the evaluation of input generation N, the 10 most effective airfoils are set as the boundaries of a restricted domain. The parameters outside of the restricted domain are eliminated from the optimization and a densified new input generation N + 1 is evaluated. Therefore, the optimization process is robust to non-convergence because unconverged sets are not necessarily rejected from the new input generation providing that they are included in the restricted domain. However, sufficient proximity between the evaluated sets on the domain is needed in order to avoid the elimination of unconverged effective sets of parameters. This process demands a very important number of sets evaluations. Each generation counts at least 50,000 sets of parameters evaluated several times. Approximately half a million XFoil evaluations are carried out in each generation.

Two-dimensional representation of the selection process robust to non-convergence.
Since the Martian atmosphere is highly turbulent, airfoil optimization also needs to be robust to the fluctuating flight conditions. Hence, an airfoil’s competitiveness is evaluated in the entire hover range of a Martian MAV. The performance function is built as the mean value between lift-to-drag ratio and endurance coefficient over a range of Reynolds numbers
Compressible and incompressible airfoil optimization for ultra-low Reynolds number flows
For the flow behavior apprehension, the optimization has been carried out step by step, adding gradual complexity in incompressible flows and then assessing the impact of compressibility.
Incompressible airfoil shape optimization: Camber line and thickness distribution
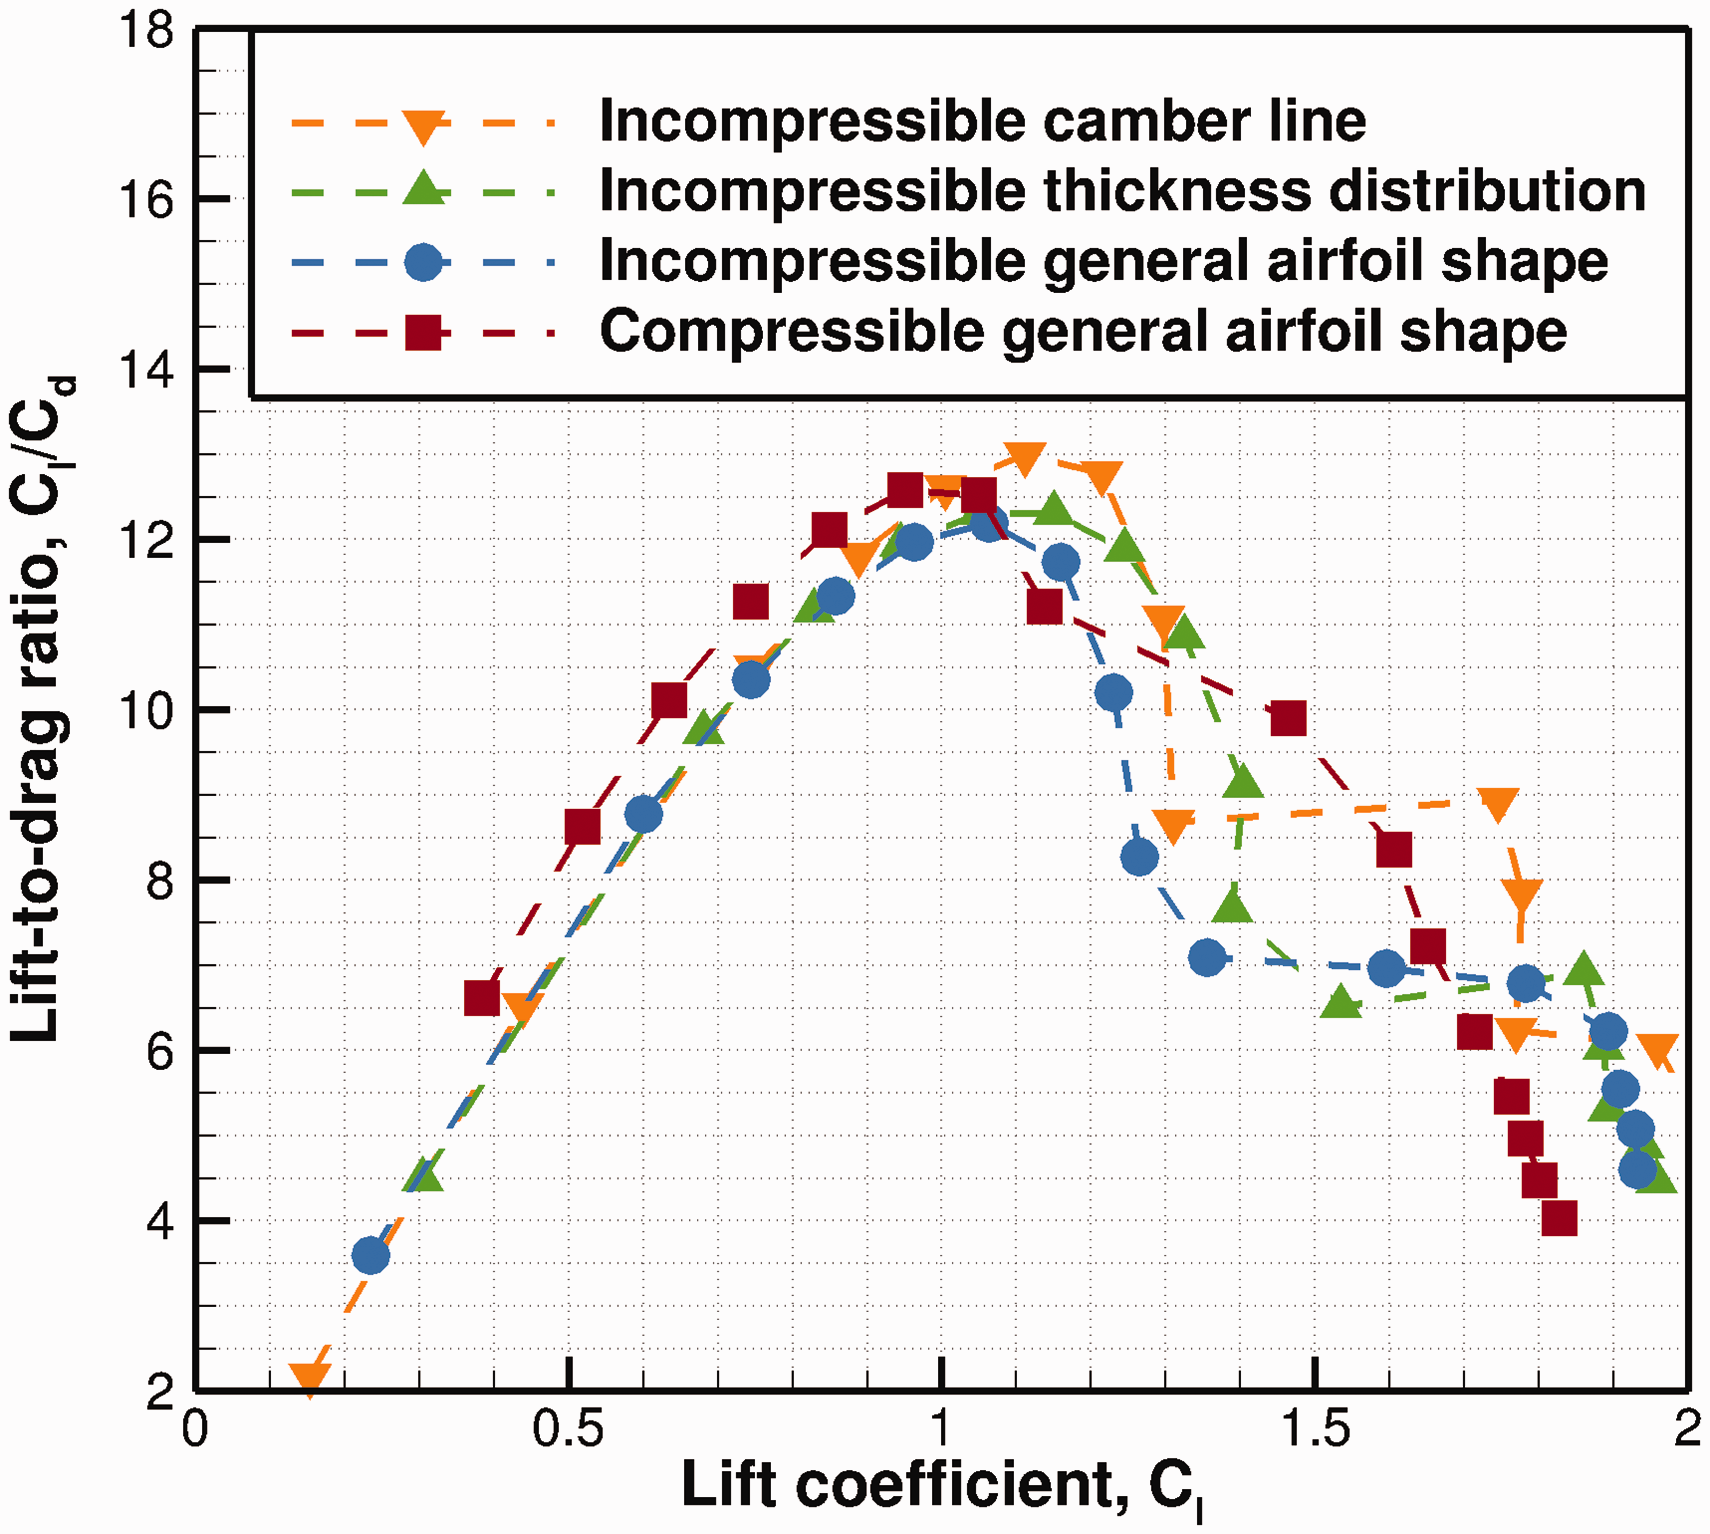
Three incompressible airfoil optimizations have been carried out with increasing complexity (c.f. Figure 5(a)). Camber line optimization with a predefined 2% relative thickness distribution. Then, thickness distribution optimization from the optimal camber line with a minimum relative thickness constraint is set to

Incompressible general airfoil optimization performance comparison with the different optimization steps. (a) Incompressible XFoil optimal airfoil shapes: a camber line optimization with a predefined thickness distribution (yellow), thickness distribution optimization (green), and general shape optimization (blue). (b) XFoil's lift-to-drag ratio in flight conditions (
Thickness distribution optimization tends to a thin leading edge for proper flow adaptation and to a surprising round trailing edge: its impact is evaluated in the section Evaluation of airfoil optimization with 2D unsteady compressible Navier–Stokes simulations. The optimized thickness distribution with a pre-optimized camber line (Figure 5(a) in green) displays thinner parts at
Figure 5(b) exhibits that a better lift-to-drag ratio on a larger range of coefficient of lift is achieved for each optimization complexity increment. This is mainly due to a better leading edge flow adaptation and trailing edge decompression permitting wider pressure distributions.
Compressible airfoil shape optimization: Camber line and thickness distribution
The flow compressibility directly magnifies the pressure distributions over the airfoil enhancing pressure gradients. Hence, the efforts generated are more important and the boundary layer separation is more easily triggered. Its impact on the airfoil design has been evaluated for a general airfoil shape optimization. The flow rate is set to M = 0.5 for avoiding local shocks appearance.
As presented in Figure 6, a compressible airfoil optimization results in an equivalent thickness distribution with a reduced camber compared to incompressible optimization. The reduced camber permits to reduce drag production at low lift production and to achieve a better lift-to-drag ratio in compressible flows.

General airfoil shape comparison for a compressible and incompressible optimization.
Evaluation of airfoil optimization with 2D unsteady compressible Navier–Stokes simulations
Since the optimization process is based on a simplified steady solver, it is essential to numerically audit the optimal airfoils with a validated solver.
Assessment of the increasing complexity in the airfoil optimization
Figure 7 exhibits the aerodynamic performance of each optimization steps’ optimal airfoil in compressible ultra-low Reynolds number flows. The different optimized airfoils have a very close unsteady Navier–Stokes lift-to-drag ratio: small design variations have lesser impact on the airfoil’s aerodynamic performance with the validated solver than with XFoil. Compressible optimum generates lower drag for
Averaged unsteady 2D N-S lift-to-drag ratio of the optimized airfoils evaluated with elsA in flight conditions (
Impact of trailing edge shape on the aerodynamic performance
The main difference between the optimized and the predefined thickness distribution comes from trailing edge definition. Therefore, its impact on the 2D aerodynamic performance is evaluated by producing an optimal compressible airfoil with a sharp trailing edge replacing its unusual round shape.
As presented in Figure 8, round and sharp trailing edge thickness distribution have a similar 2D aerodynamic performance. Considering the Reynolds number range, the boundary layer growth and flow recirculation triggered by separation at the upper surface minimize the magnitude of the trailing edge shape. Hence, for a Martian airfoil optimization, focus needs to be mainly directed towards the camber line distribution and leading edge shape.

Evaluation of the impact of the trailing edge shape on the aerodynamic performance: averaged unsteady N-S polar in flight conditions (
Evaluation of the optimized airfoil compared to airfoils picked from literature
In order to evaluate the steady optimization process based on XFoil, the compressible general airfoil shape is compared in regard to lift-to-drag ratio with airfoils considered in the literature as aerodynamically effective in ultra-low Reynolds number flows. The 6% cambered plate has been experimentally proven to be the most effective of the evaluated airfoils for the Martian flight conditions.13,14 And since biomimicry leads to corrugated airfoils enhancing vortex production, a dragonfly airfoil (Figure 10(b)) is picked; it was also experimentally proven to be the most aerodynamically effective from three sections at different radius of a dragonfly wing at the ultra-low Reynolds number. 11 Both airfoils are generated with a 2% relative thickness distribution.
As presented in Figure 9, the dragonfly airfoil, generating lift on the principle of vortex production enhancement, succeeds to generate low drag and to match with the lift-to-drag ratio of the two other airfoils for a very low lift production

Incompressible and compressible 2D aerodynamic performance evaluated with elsA of an optimized airfoil compared to airfoils from literature.11,14,18 (a) Incompressible averaged unsteady N-S polar in flight conditions (

Two-dimensional averaged unsteady N-S mach contours at similar lift production evaluated with elsA. (a) Averaged unsteady N-S mach contours in flight conditions (
The compressible optimum exhibits the best 2D lift-to-drag ratio over the widest range of lift production. However, the 6% cambered plate, also relying on high camber shifting the boundary layer separation downstream, shows similar performance. Therefore, the present optimization process is validated, and the experimentally based assumption, that airfoils with a design close to 6% cambered plate are the most aerodynamically efficient in 2D, is validated too. Nevertheless, a slight modification of 2D flow behavior might have greater impact on 3D flows. Then, it is necessary to investigate the impact of airfoil shapes on the 3D rotor aerodynamic performance.
Note that lift-to-drag ratios are very similar in compressible and incompressible flows for the low lift production. At the higher lift production, the drag rise is more important in compressible flows degrading the 2D lift-to-drag ratio.
Experimental investigation of the impact of airfoil shapes on the 3D rotor aerodynamic performance
The compressible airfoil optimization process has been numerically evaluated in 2D. The next step is to evaluate the impact of airfoil shapes on rotors with a similar planform distribution. In this purpose, an experimental campaign in a depressurized tank has been carried out in collaboration with Centre National d’Études Spatiales (CNES).
Experimental setup recreating the Martian atmospheric conditions
The depressurized facility is an 18 m3 tank located at ONERA’s Fauga center. Inside the tank, a testbed provided by ISAE-SUPAERO is incorporated for the rotor thrust and torque measurement (Figure 11). Rotor wake is headed towards the tank’s tube, significantly reducing the flow recirculation.

Experimental facility evaluating the rotor performance in the Martian atmosphere. (a) ISAE-SUPAERO’s experimental testbed in the depressurized tank; and (b) 18 m3 depressurized tank located at ONERA’s Fauga center.
The Martian atmospheric conditions are met in the tank in terms of kinematic viscosity for the flight Reynolds number consistency. The aimed pressure inside the tank has been calculated based on temperature and gas composition. Hence, the performance is compared with dimensionless numbers
Every experimental rotor has been evaluated in air and CO2. The dimensionless performance is comparable with the two gases since no heavy compressibility effects has been reached as the rotating speed has been limited to 4000 r/min for conservative reasons. The following measurements have been evaluated in air. Experimental rotors all have the same planform distribution based on Maryland’s experiment 22 (Figure 12). Therefore, the experimental measurements can be validated with comparison to the original experiment, and the influence of airfoil shapes on the rotor performance can be assessed independently from the planform design.

Experimental rotors’ planform distribution 22 for evaluating the impact of airfoil shapes on the rotor performance—dimensions in mm.
Validation of experimental facility with comparison to Maryland’s experiment
Figure 13 displays thrust coefficients of the present experiment compared to Maryland’s 22 for two collective pitch angles with the same rotor shape and production protocol. Maryland’s airfoil is a 6.35% cambered plate with a sharp leading edge and blunt trailing edge. The measured dimensionless thrust varies depending on the experimental facility: the present experiment shows greater thrust coefficients than Maryland’s. The main difference between the two facilities is the depressurized tank size, substantially larger in the present experiment. The hypothesis is that the flow recirculation in Maryland’s smaller tank (0.6 m3) tends to increase the induced velocity. As a consequence, it reduces the local blade’s incidence angle and the generated efforts. In the present experiment, the influence of the flow recirculation is lowered by the greater tank size (18 m3) and the testbed placement.
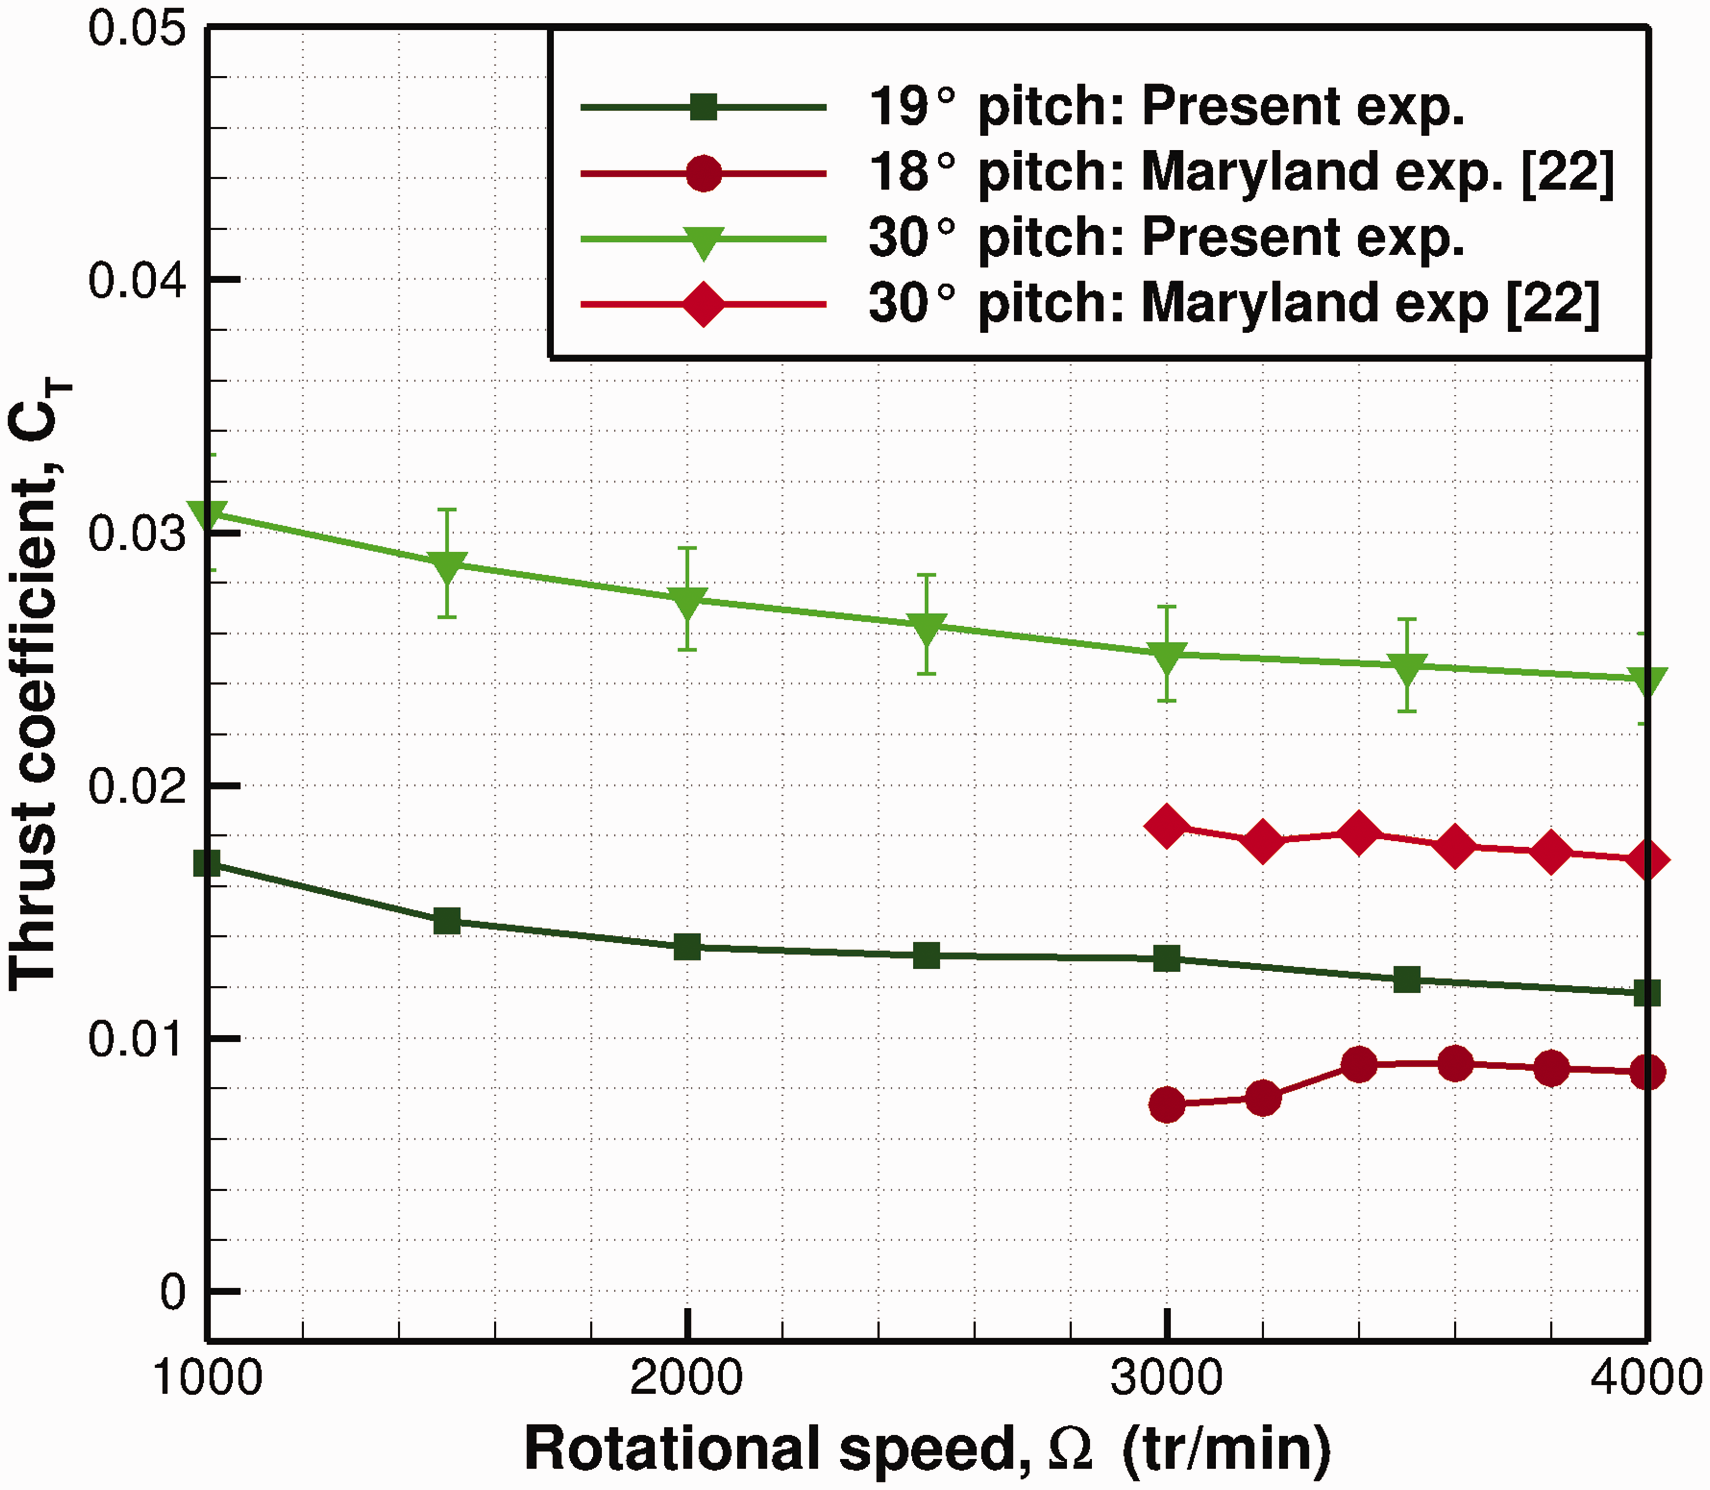
Thrust coefficients from the present experiment (with measurement error) compared to measurements from literature.
Despite the bias in experimental measurements, both experiments show relative consistency in thrust coefficients with a variation of collective pitch angles. The present experiment is considered validated.
Influence of airfoil shapes on the rotor performance in the Martian atmospheric conditions
The impact of airfoil shapes on 3D flows is exhibited in Figure 14. The rotor performance shows the same tendencies as in 2D Navier–Stokes computations for the different airfoil shapes. Highly cambered airfoils shifting boundary layer separation downstream show comparable

Impact of airfoil shapes on the present experimental rotor performance in air for the same planform distribution (Figure 12) and a collective pitch angle of
Conclusions
The present study exhibits a numerical and experimental investigation of the impact of airfoil shapes and optimization on 2D and 3D compressible ultra-low Reynolds number flows. The main conclusions drawn are the following:
Laminar unsteady Navier–Stokes solver elsA provides a proper flow simulation and forces prediction in an undisturbed 3D Martian environment. XFoil, a potential flow solver strongly coupled with an integral boundary layer formulation, quickly allows assessing airfoil’s 2D efforts and the boundary layer state without taking on board the entire physic of the flow. It can be used in an airfoil optimization process. Subcritical compressibility has little impact on the 2D aerodynamic performance but eases the boundary layer detachment. Optimal airfoils for 2D ultra-low Reynolds number flows are thin and highly cambered with leading edge and trailing edge cambers. It allows them to adapt to the incoming flow and to delay the boundary layer separation along with unsteadiness production. Small variations in the airfoil design have little impact on the rotor performance as long as the airfoil is highly cambered shifting boundary layer separation downstream: close to a 6% cambered plate. 3D effects do not fully compensate nor stabilize the detached flow experienced by airfoils enhancing vortex shedding for lift production. Rotor subcritical dimensionless performance is comparable with an air- or CO2-filled tank for the same flight Reynolds number.
Based on the present optimized airfoil for the Martian flows, the impact of rotor shape is currently investigated. Rotor optimizations based on a free vortex method solver are performed for isolated and coaxial configurations. The optimization process is evaluated with 3D Navier–Stokes simulations and experimental measurements of both configurations. The ultimate objective is to develop a reliable propulsion system for a 30 cm Martian rotary wing MAV.
Footnotes
Acknowledgements
The authors would like to thank the “Centre National d’Études Spatiales” (CNES) for its support in the experimental campaign. They also thank the people involved from ISAE-SUPAERO (Rémy Chanton, Sylvain Belliot, Xavier Foulquier, Sébastien Prothin, Thierry Jardin, Valérie Allain, and Bernard Rivière) and from Propulsion Laboratory at ONERA (Christophe Corato, Jérome Anthoine, Jean-Charles Durand, and Jouke Hijlkema).
Declaration of conflicting interests
The author(s) declared no potential conflicts of interest with respect to the research, authorship, and/or publication of this article.
Funding
The author(s) received no financial support for the research, authorship, and/or publication of this article.