
Abstract
This research investigated the behavior of a Manduca sexta inspired biomimetic wing as a function of Reynolds number by measuring the aerodynamic forces produced by varying the characteristic wing length and testing at air densities from atmospheric to near vacuum. A six degree of freedom balance was used to measure forces and moments, while high speed cameras were used to measure wing stroke angle. An in-house created graphical user interface was used to vary the voltage of the drive signal sent to the piezoelectric actuator which determined the wing stroke angle. The Air Force Institute of Technology baseline 50 mm wing was compared to wings manufactured with 55, 60, 65, and 70 mm spans, while maintaining a constant aspect ratio. Tests were conducted in a vacuum chamber at air densities between 0.5% and 100% of atmospheric pressure. Increasing the wingspan increased the wing’s weight, which reduced the first natural frequency; and did not result in an increase in vertical force over the baseline 50 mm wing. However, if the decrease in natural frequency corresponding to the increased wing span was counteracted by increasing the thickness of the joint material in the linkage mechanism, vertical force production increased over the baseline wing planform. Of the wings built with the more robust flapping mechanism, the 55 mm wing span produced 95% more vertical force at a 26% higher flapping frequency, while the 70 mm wing span produced 165% more vertical force at a 10% lower frequency than the Air Force Institute of Technology baseline wing. Negligible forces and moments were measured at vacuum, where the wing exhibited predominantly inertial motion, revealing flight forces measured in atmosphere are almost wholly limited to interaction with the surrounding air. Lastly, there was a rough correlation between Reynolds number and vertical force, indicating Reynolds number is a useful modelling parameter to predict lift and corresponding aerodynamic coefficients for a specific wing design.
Keywords
Introduction
The field of flapping wing micro air vehicles (FWMAV) is an emerging field in the greater discipline of aeronautical engineering. The needs of the Department of Defense (DoD) and industry over the past century have necessarily entailed the design of large fixed-wing or rotary aircraft capable of carrying people and cargo over long distances. Likewise, the technology in this area of study has largely matured, as can be demonstrated by the continued use of airframes which were originally designed in the 1950s and 1960s. Rotor or propeller driven micro air vehicles (MAVs) have been successfully used for several years, but have the disadvantages of a larger acoustic signature and conspicuous appearance. However, FWMAVs present a promising field for future application. Bird or insect sized aircraft have several advantages. FWMAVs are designed to be more maneuverable, harder to detect, and smaller than conventional aircraft, which leads to several promising niche mission uses.
FWMAVs are a continuation of the direction in recent decades of the DoD relying more heavily on unmanned systems. The Department of Defense Unmanned Systems Integrated Roadmap lists several key areas which unmanned systems hold an advantage over manned systems, including ‘long-duration undertakings with mundane tasks ill suited for manned systems,’ missions which ‘have the potential to unnecessarily expose personnel to hazardous conditions,’ and ‘capabilities that are inherently dangerous.’ 1 MAVs follow this paradigm, offering further potential advantages, to include a smaller logistics footprint, augmentation to existing weapons systems, delivering capabilities to smaller units, which may not have advanced technology at their disposal, and several tactical applications in an asymmetric battlefield, typified by the recent conflicts throughout the Middle East. 2 The potential advantages MAVs offer on the battlefield motivate further academic investigation in the continuous art of military aerial innovation.
The relatively new innovation of FWMAVs provides unique opportunities, but also involves several engineering challenges inherent in most immature novel technological fields of study. The small size of FWMAVs presents several challenges. Insect-sized wings are designed to operate in unsteady low Reynolds number flow. This separates the flow characteristics of FWMAVs from aircraft in more common flight conditions, which have been researched and studied at length. The small amount of lift and thrust generated by MAVs makes reducing weight extremely critical for insect-sized FWMAVs. Optimizing the structures, selecting the lightest available materials, which still fulfill other design requirements, and producing enough lift to attach a payload are important considerations. There are several other issues related to miniaturization. The limitations of small, lightweight energy sources are a problem in autonomous flight. Small state of the art batteries do not have high enough energy densities to allow a MAV to operate for extended periods of time. MAVs also carry miniaturized optical systems for control and intelligence, surveillance, and reconnaissance (ISR) purposes, which are difficult to manufacture at a sufficient resolution and a low enough weight. These are some of the challenges why optimizing lift with respect to weight is a critical problem.
Background and literature review
The following consists of a summary of the Air Force Institute of Technology (AFIT) FWMAV technology and a review of past literature pertaining to this research. This includes an examination of the fundamentals of FWMAV flight, and a review of recent FWMAV research accomplished at AFIT.
Flapping wing aerodynamics
Ellington divides flapping wing flight between turbulent regimes, characteristic of most birds, and laminar regimes involving strong vortices, which are characteristic of most insects. Ellington’s research shows large insects reach Reynolds numbers of 10,000, at which point turbulence begins. This low Reynolds number regime encompasses fliers up to 20 g. Anything greater than this Reynolds number and mass range is beyond AFIT’s research scope. 3
Fliers at this scale also tend to have a horizontal stroke plane angle (β), as shown in Figure 1. The stroke plane describes the angle between the horizontal and the mean plane along which the chord travels. The wing movement of a horizontal stroke plane wing consists of four distinct phases.
5
The wing beats in one direction, and then at the end of the half stroke, it undergoes a rotation along the longitudinal axis called supination. The wing then flaps in the other direction, and then at the end of the half stroke, it undergoes another rotation called pronation. All together this movement, as previously stated, resembles a figure eight pattern. This motion can be described with three kinematic angles. These are the elevation angle (θ), the wing position angle (

The three kinematic angles of an insect with an approximately horizontal stroke plane. Stroke plane angle (β) is the angle between the horizontal (horizontal red dotted line) and stroke plane (gray dotted line). Elevation angle (θ) is the angle between the mean chord and β. Wing position angle (
Conn et al. present a modified Reynolds number for flapping wings by defining the velocity as the wingtip velocity.
6
In addition, the characteristic length is defined as the mean chord of the wing. This is used to calculate the Reynolds number, shown in equation (1)

The density (ρ) and dynamic viscosity (µ) refer to the properties of the air, flapping frequency (f) is the number of times the wing completes a complete flap cycle per second, and the wing length (R) describes the length of one wing from the base to the tip. The aspect ratio

Span (R) and flap angle (
The capture and recirculation of the leading edge vortex (LEV) has been extensively studied as an unsteady mechanism primarily responsible for generating lift over insect wings. This has been demonstrated with the Manduca sexta wing, which is used in research because of the size and aerodynamic influence of the forewings. 7 The existence of a LEV over the Manduca sexta wing has been visually analyzed with live specimens and with the AFIT designed biomimetic wing.8,4 The LEV consists of a vortex with appreciable span-wise flow maintained at the leading edge of the wing during the upstroke and downstroke. At pronation and supination, the vortex is shed, after which a new vortex is quickly formed. The LEV causes a low pressure area above the wing, which delays the onset of stall. The LEV also increases circulation and increases the apparent camber of the wing from the perspective of the relative wind. 4 The development and formation of the LEV provides an unsteady mechanism through which the M. sexta can produce greater lift than a simplified quasi-steady model would predict. 4
Mechanical considerations for biomimicry
Piezo electric actuators (PZT) are an effective mechanism for generating flapping motion. 9 PZTs have several advantages for FWMAV use, which include their light weight and ability to produce oscillatory motion in response to an electric signal. Wood designed a four-bar linkage which transmits the linear translation of the PZT tip (δ) into angular motion (θw) of the wing.
Figure 3 demonstrates the design of the four-bar linkage.
11
The four-bar linkage consists of four segments, labeled L1, L2, L3, and L4. The stroke angle (


The four-bar linkage mechanism has three free joints. One joint is attached to L4, one joint links L1 to L2, and the other joint links L1 to the translating material attached to the tip of the piezo. The transmission ratio (T), which describes the ratio of stroke angle to displacement angle, is shown in equation (3). The L3 linkage directly determines the total stroke angle for a given piezo displacement
Whitney and Wood outlined the use of a passive rotation joint to simulate the flapping movement of the wing. 10 With passive rotation, a flexible rotation joint attaches the wing to the four-bar linkage, allowing the wing to rotate as a result of the flapping motion. At the end of the stroke, the wing contacts an angled passive rotation joint, which transfers the kinetic energy of the wing into motion about the joint, thus enabling pronation and supination.
Figure 4 shows a schematic of a passive rotation joint, and equation (4) calculates rotational stiffness of the joint
Passive rotation joint schematic.
12

Although this design entails a passive approach to pronation and supination, design of the rotation joint stiffness and angle stops 13 ensures control of the angle of attack of the wing as well as smooth wing rotation.
Previous AFIT FWMAV research
O’Hara and Palazotto conducted a morphological study of M. sexta forewing specimens for the purpose of constructing a biomimetic wing with similar flapping performance. 7 The scales of the hawkmoth were removed and the dimensions of the venation of the wings was determined using top-down and cross-sectional images of wing, as shown in Figure 5.

Locations of cross-sectional cuts made to measure venation dimensions across the wing. 7
The material properties of the veins and wing membrane were measured and a laser was used to measure the three dimensional structure of the wing, including camber. This completed a thorough morphological study of the material and structural properties of the M. sexta forewing. Following the morphological study, O’Hara and Palazotto conducted scanning laser vibrometry tests to determine the forewing dynamics. O’Hara selected various materials to best match the properties of the M. sexta forewing. 14 Through careful consideration of the material properties of the biological wing, conclusions reached by previous research, and measurement of the properties of various materials, 12.5 µm mylar was determined to be a suitable material to mimic the membrane, and a 0/90/0 YSH-70A carbon fiber laminate best replicates the strength and stiffness of the internal venation pattern.
Following this, O’Hara detailed a repeatable manufacturing method for in-house fabrication of the biomimetic wing, and the PZT and flapper support base. The construction of the wing began with the development of CAD designs of the venation pattern. This was followed by pressing of the carbon fiber laminate. Laser ablation was then used to cut the CAD patterns into the carbon fiber. Finally, the carbon fiber and Kapton were pressed together, followed by thermosetting of the mylar membrane.
Once the biomimetic wing and flap mechanism were constructed, testing was conducted to compare the engineered wing to the biological wing, shown in Figure 6. This testing determined if the structural dynamics of the engineered wing matched the biological wing without scales, thereby showing the final wing and flapper design performs at least equivalently to its biological analogue. This makes it suitable for future FWMAV research in the 50 mm length wing configuration.

Biological Manduca sexta wing vs. biomimetic M. sexta wing. 14
DeLuca et al. used the O’Hara wing design to conduct a series of tests to provide a comprehensive understanding of the aerodynamic forces and moments, and modeled the aerodynamic coefficients produced by the new wing design to be used in future control law development.4,15 A ATI Nano-17 titanium force torque sensor was used to measure the forces on the wing, and a stereo particle image velocimetry (PIV) system was used to capture images of the airflow. The tests utilized 30°, 45°, and 60° angle stops to alter the angle of attack of the wing by limiting the range of rotation at pronation and supination.
The PIV imagery, shown in Figure 7, and force/moment measurements together conclusively determined the nature of the unsteady aerodynamic airflow, how exactly the vortices form and shed, and why exactly the quasi-steady assumption failed to provide accurate predictions for the forces and moments of the wing.
PIV images of LEV formation and shedding of a single flap cycle, segmented into eight phases. The red arrows show the location of the vortices in each frame, while the yellow arrows show the movement of each individual vortex from frame to frame. 4 LEV: leading edge vortex; PIV: particle image velocimetry.
The kinematic angles were calculated using high speed camera imagery and a custom written edge detection algorithm, through which instantaneous lift and drag coefficients were calculated with a new mathematical model. These coefficients were also utilized to estimate lift and drag using lifting line theory.
Experimental methodology
The laboratory instrumentation setup, flapper mechanism fabrication process, and flapper operationalization process were nearly identical to those used by DeLuca, 4 O’Hara and Palazotto, 7 and DeLuca et al. 15 However, there were two alterations made to the previously utilized methodology. First, modified CAD designs were created to fabricate larger wing designs. Second, slightly different instrumentation setup and testing procedures were used for the partial vacuum testing.
Construction of constant aspect ratio, longer span wings
The flapper assemblies used in this research were fabricated as prescribed by Lindholm 13 and O’Hara. 14 The materials used in the fabrication process were carbon fiber, Pyralux, 12.5 µm, 25 µm, and 50 µm thick Kapton tape, mylar, porous and nonporous Teflon, and airweave SS FR bleeder cloth. The hardware used in the fabrication process included an LPKF Multipress S, LPKF Proto Laser U, and Eden 500 V rapid prototype machine. Additional CAD drawings were made to fabricate larger wings used in this research.
The drawings used to cut the carbon fiber and Kapton pieces were designed in CorelDraw for previous research. Four larger wing geometries were created, based on the CAD files of the original wing. The new wings, shown in Figure 8, were 55, 60, 65, and 70 mm in length, respectively. The width of the passive rotation joint, defined in equation (4), was modified to increase the joint’s stiffness in proportion to the increase in the length of the wing. A 40% longer wing, measured from where the rotation joint meets the wing base, also had a 40% wider rotation joint. All five passive rotation joint designs are shown in Figure 9.

CAD geometry of 50, 55, 60, 65, and 70 mm wings.

CAD passive rotation joints of 50, 55, 60, 65, and 70 mm wings. The 45° and 60° angle stops were used for this research. The angle stops were attached through the slits shown in the passive rotation joint schematics above.
The slits through which the angle stops are placed were moved further apart as the passive rotation joint widened. The dims of the attachment point to the four-bar linkage remained unchanged. The wing planform area was scaled proportionally in both directions so the aspect ratio remained constant. The rectangular boundary of the CAD drawings was lengthened to accommodate the increased length of the wing. However, the rectangular boundary was not widened, so the two alignment holes remained identical for all CAD drawings. Because each wing was made with four separate CAD drawings, as shown in Figure 10, all four drawings were altered in complete synchrony with one another.

Wing geometries for separate fabrication steps. 1 and 2 are for carbon fiber, 3 is for Kapton, and 4 for the total wing.
The four separate CAD drawings were used for laser ablation of the carbon fiber, Kapton, and combined carbon fiber, Kapton, and carbon fiber (CKC). The separate CAD drawings for each wing length were overlaid in Microsoft Paint to ensure overlap of all four rectangles, wings, alignment holes, and fiducial holes. This step revealed discrepancies between the separate CAD images caused by misalignment in the increased span wing designs.
The definition of wing length (R) became a matter of concern with the change in passive rotation joint length. The wingtip velocity (V) was calculated by measuring the distance between the wingtip and the point about which the wing rotated. The wing did not rotate about the wing root, which was used to measure R. Rather, the wing rotated at the four-bar linkage. Therefore, a more accurate distance for measuring the wingtip velocity was from the tip of the wing to the edge of the attachment point to the four-bar linkage. This new wing length was named R2, shown in Figure 11. R was used to calculate the characteristic length (L), which was the mean chord of the wing, whereas R2 was used to calculate the wingtip velocity. Equation (1) was reformulated to account for the two separate lengths, shown in equation (5)


Comparison between R, used to calculate L, and R2, used to calculate V. 16
Vacuum testing
The Nano-17 force transducer, optoNCDT displacement sensor, and flapper assembly were placed in a 24 × 24 in. Abbess Instruments and Systems, Inc stainless steel vacuum chamber, shown in Figure 12. The vacuum chamber had reinforced plexiglass doors on two sides, as well as glass windows on three sides. All tests were conducted within the chamber. Tests done at atmospheric pressure were completed with the two doors open to enable easy access to the flapper assembly, which also reduced recirculation of still air in the atmospheric tests. For the vacuum tests, the doors were clamped shut, and the pressure was monitored.
Vacuum test chamber and associated measurement and instrumentation equipment.
An Instrutech, Inc Superbee CVM201GAA gauge, shown in Figure 13, was used to measure the pressure of the air. The gauge had a range of

Pressure display, release valve, and cables.
For the vacuum tests, the wing was first flapped at a small number of atmospheric pressure test points to measure baseline data for the wing at these conditions, as well as to detect if there were any defects in the wing and flapper assembly. This was done with the doors closed, to compare the performance of each individual wing at atmospheric pressure and partial vacuum under identical test configurations. After this was accomplished, the vacuum pump was opened until the chamber was at a pressure 10% lower than the enumerated test pressure, to account for the fact the chamber was not a perfectly sealed system. This made it necessary to start each test at a lower pressure, and slightly open the valve to creep up to the specified pressure. Air did leak from the vacuum chamber, but occurred at a low enough rate such that data could be taken at desired pressures within 1% of the prescribed value for a test run of five successive flap cycles.
Another factor to consider when testing at lower than atmospheric densities was the need to adjust the driving amplitude range. The drive signal sent to the piezo to flap the wing is given in equations (6) and (7).
15
The signal can be described with the driving amplitude voltage (A), which describes the voltage of the signal as a fraction of 200 V, and which alters the amplitude of the flapping motion, bias (η), which weights the flapping motion towards either the upstroke or downstroke while maintaining the same period (T), and the flapping frequency (ω)


For atmospheric tests with the original 50 mm wing, the driving amplitude voltage was varied between 0.2 A and 0.7 A, in increments of 0.025 A, for a total of 21 different driving amplitudes. However, when the air was at densities lower than atmospheric, less voltage was required to flap the wing at a particular stroke angle, because the wing had less air resistance and drag to move through. Therefore, the wing was flapped at various driving amplitudes to determine the voltage which would achieve the maximum designed stroke angle. The driving amplitude increment was altered so the number of test points remained the same, given the adjusted maximum driving amplitude. As the density of the air was decreased, the test sweeps occurred over a smaller voltage span, but with an evenly spaced number of test points. At the lowest densities, the minimum driving amplitude was also varied, as the wing would flap at lower minimum voltages. Again, the increments between amplitude settings varied to maintain an equal number of test points.
Air pressure was maintained at specified values by alternatively engaging the vacuum pump, and opening the air release valve, shown in Figures 12 and 13. Typically the pressure was lowered to slightly below the testing condition, and testing began once the pressure reached the desired levels. Once testing was complete, the vacuum pump was turned on for a few seconds to lower the air pressure, so the manual tuning and data collection could begin for the next driving amplitude. For the tests conducted at the lowest air density, the vacuum pump was operating for the entire test duration to ensure data was collected at or near complete vacuum. The pressure of the chamber leveled out to between 4.3 and 4.33 Torr for these tests, or 573 to 577 Pa, which is approximately 0.57% of standard atmospheric pressure.
Results and discussion
The goal of this research was to answer three fundamental questions. First, whether increasing the size of the wing is practical to increase vertical force and lift. Second, to determine the power requirements and force and moment response of the wing under purely inertial motion, with no aerodynamic effects of air resistance. Third, if correlating Reynolds number data compared to vertical force yields trends for modelling future designs.
The following tests assisted in answering these three questions. First, a series of tests were conducted with increasingly larger wings, to determine the effect increasing wing size has on vertical force, as well as to develop part of the aforementioned Reynolds number data. Second, a series of tests at partial vacuum were conducted to provide further data regarding Reynolds number. Finally, a test at near vacuum was conducted to determine the power requirements, forces, and moments produced by the wing under purely inertial conditions.
Wing length modification
Four wings with longer spans were designed to examine the effect of larger scaled wings on vertical force production. Increasing the length of the wingspan leads to an increase in weight, as well a decrease in natural frequency. The decrease in natural frequency (ωn) is due to the change in equivalent stiffness (keq) and equivalent mass (meq) of the system, as shown in equation (8)

Table 1 shows the weight and natural frequencies of the larger wing designs. The wingtip velocity was calculated with f,
R, R2, AR, wing weight, and natural frequency of wings with an aspect ratio of 14.42.
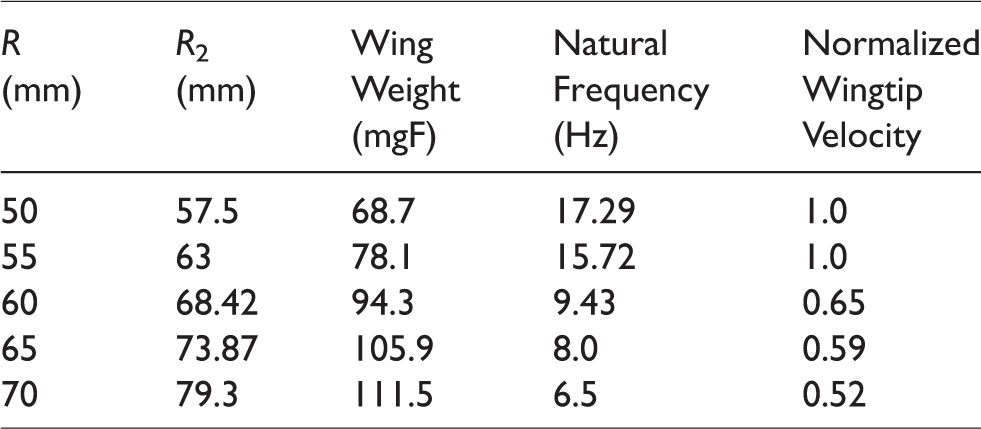
There is a clear trend showing the wingtip velocity decreasing with increasing wingspan. The 65 mm and 70 mm wings failed to produce sufficient lift due to low flapping velocity and an inability of the wing to rotate and pronate properly. This tendency to simply paddle, rather than pronate and supinate, is traced to the lower flapping velocity, which indicates the wing did not have enough kinetic energy to bend the passive rotation joint.
As the two largest wings lacked the capability to produce sufficient vertical forces, no further testing was conducted. Figures 14, 15, and 16 show the vertical force, power, and vertical force to power ratio of the 55 and 60 mm wings in comparison to the original 50 mm wing design, respectively.
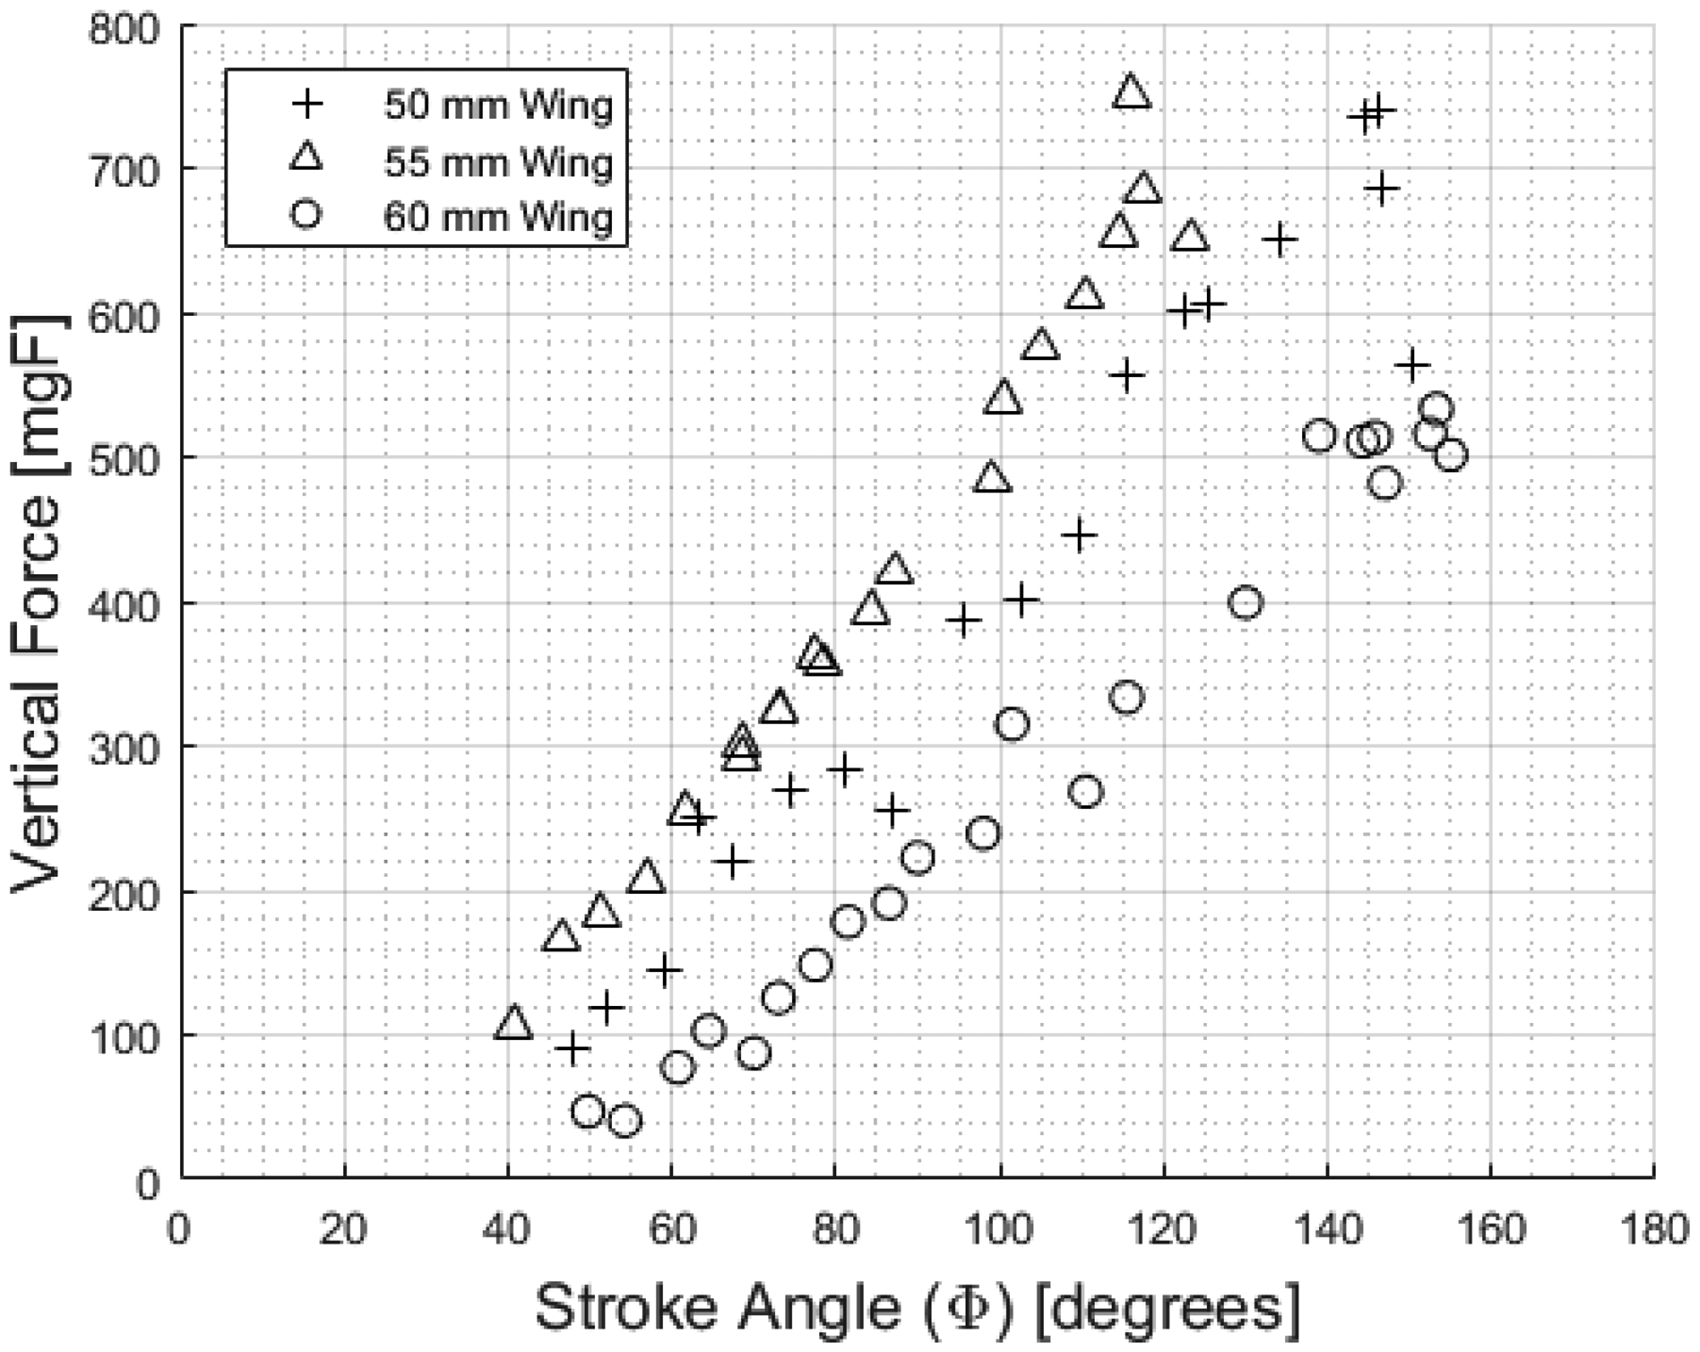
Vertical force of the 50 mm wing, 55 mm wing, and 60 mm wing.

Power of the 50 mm wing, 55 mm wing, and 60 mm wing.

Vertical force to power ratio of the 50 mm wing, 55 mm wing, and 60 mm wing. There was no notable trend between the three wings.
The 55 mm wing had a higher vertical force than the 50 mm wing, ranging from about 50 to 100 mgF for a given stroke angle. This exceeds the 10 mg increase in weight, indicating the 55 mm wing is a superior wing, despite flapping at a lower frequency. The lower flapping frequency combined with the stiffer passive rotation joint provides a more resilient operating design, which is less responsive to failure and wing separation from the joint. The 55 mm wing consumed more power than the 50 mm wing, as shown in Figure 15. The small, but consistent improvement in vertical force produced by the 55 mm wings was expected, as measurements of biological M. sexta forewings by O’Hara showed a range in length from 42.59 mm to 57.85 mm. 14 The range in wing lengths seen in nature within this single species corresponds with a similar range in total body mass, and hence total lift production. Therefore, the small range of wing sizes seen among moths of this species may represent a range in which wing length predominately determines the force production capabilities of the wing.
However, the 60 mm wing shows a reversal of this trend. The increased wing length leads to a decrease in vertical force, varying from 50 mgF at a stroke angle of 50°, to 250 mgF for a stroke angle of 145°. This decrease in force production is inextricably linked to the decrease in wingtip velocity. As Figure 15 shows, the 60 mm wing consumed less power than the 50 mm wing. Figure 16 demonstrates there is no clear trend related to wing efficiency due to a simple change in wing length within this range.
Four-bar linkage modification
The original four-bar linkage design consisted of 12.5 µm thick Kapton. Two additional four-bar linkage designs were constructed to increase the total system natural frequency. The new four-bar linkages utilized 25 µm and 50 µm thick Kapton joints. Figures 17, 18, and 19 compare the vertical force, power, and vertical force to power ratio of the three linkages, each used to flap the baseline 50 mm wing.

Vertical force of the 50 mm wing flapping with four-bar linkage Kapton thicknesses of 12.5, 25, and 50 µm.

Power of the 50 mm wing flapping with four-bar linkage Kapton thicknesses of 12.5, 25, and 50 µm.

Vertical force to power ratio of the 50 mm wing flapping with four-bar linkage Kapton thicknesses of 12.5, 25, and 50 µm.
There was an increase in the natural frequency of the system. Whereas the original wing flapped at approximately 17 to 19 Hz, the 25 µm linkage increased this frequency to 22 Hz, and the 50 µm linkage increased it to 25 Hz. The maximum stroke angle of the wing decreased from 150° to 130° for the 50 µm linkage, due to an increase in drag.
The 25 µm linkage increased the vertical force by 100 to 200 mgF for a given stroke angle. The 50 µm linkage, although successful in increasing the natural frequency even further, produced vertical forces of the same magnitude as the 12.5 µm linkage design. This can be attributed to the degradation in the flapping motion of the wing, characterized by a vertical bouncing motion and a nearly horizontal angle of attack, as shown in Figure 20.

Angle of attack change between 12.5 µm linkage (top) and 50 µm linkage (bottom). Image is of the wing, with the camera on the y axis.
Increasing the thickness of the linkage increased the flap natural frequency and reduced the total stroke angle, which resulted in an increase in power required to operate the wing, shown in Figure 18. At a stroke angle of 130°, power consumption increased 300% compared to the original design. Furthermore, the wing suffered catastrophic wing failure at the rotation joint after a few seconds of operation. Figure 19 demonstrates how the increase in vertical force compensates for the increase in power for the 25 µm linkage, while the efficiency precipitously declines for the 50 µm linkage.
The results showed a limit to the benefits of increasing the natural frequency of the wing. The wing kinetic energy changes with the velocity squared, whereas the mass has a linear effect on kinetic energy. Thus, increasing the natural frequency increases the kinetic energy more than increasing the mass. Instead of contributing to the flapping and smooth transitions, and consistent pronation and supination, the excess kinetic energy resulted in unwanted vertical bouncing, and a 0° angle of attack, which hindered vertical force production. The AFIT FWMAV design did not operate as designed when excessive power was delivered to the system.
Altered wings and linkages
Tests were conducted with various combinations of new linkage and wing designs to balance the design trade offs of wing size vs. natural frequency. Table 2 shows the wing length, linkage thickness, natural frequency, and normalized wingtip velocity of the proposed wing designs.
R, R2, wing weight, and natural frequency of wings with an aspect ratio of 14.42.

The 45° angle stop was used only for the 55 mm wings, while the other wings utilized the 60° angle stop. Figures 21, 22, and 23 illustrate the forces, power consumption, and efficiency of the new wing designs, respectively.

Vertical force of wing designs listed in Table 2.
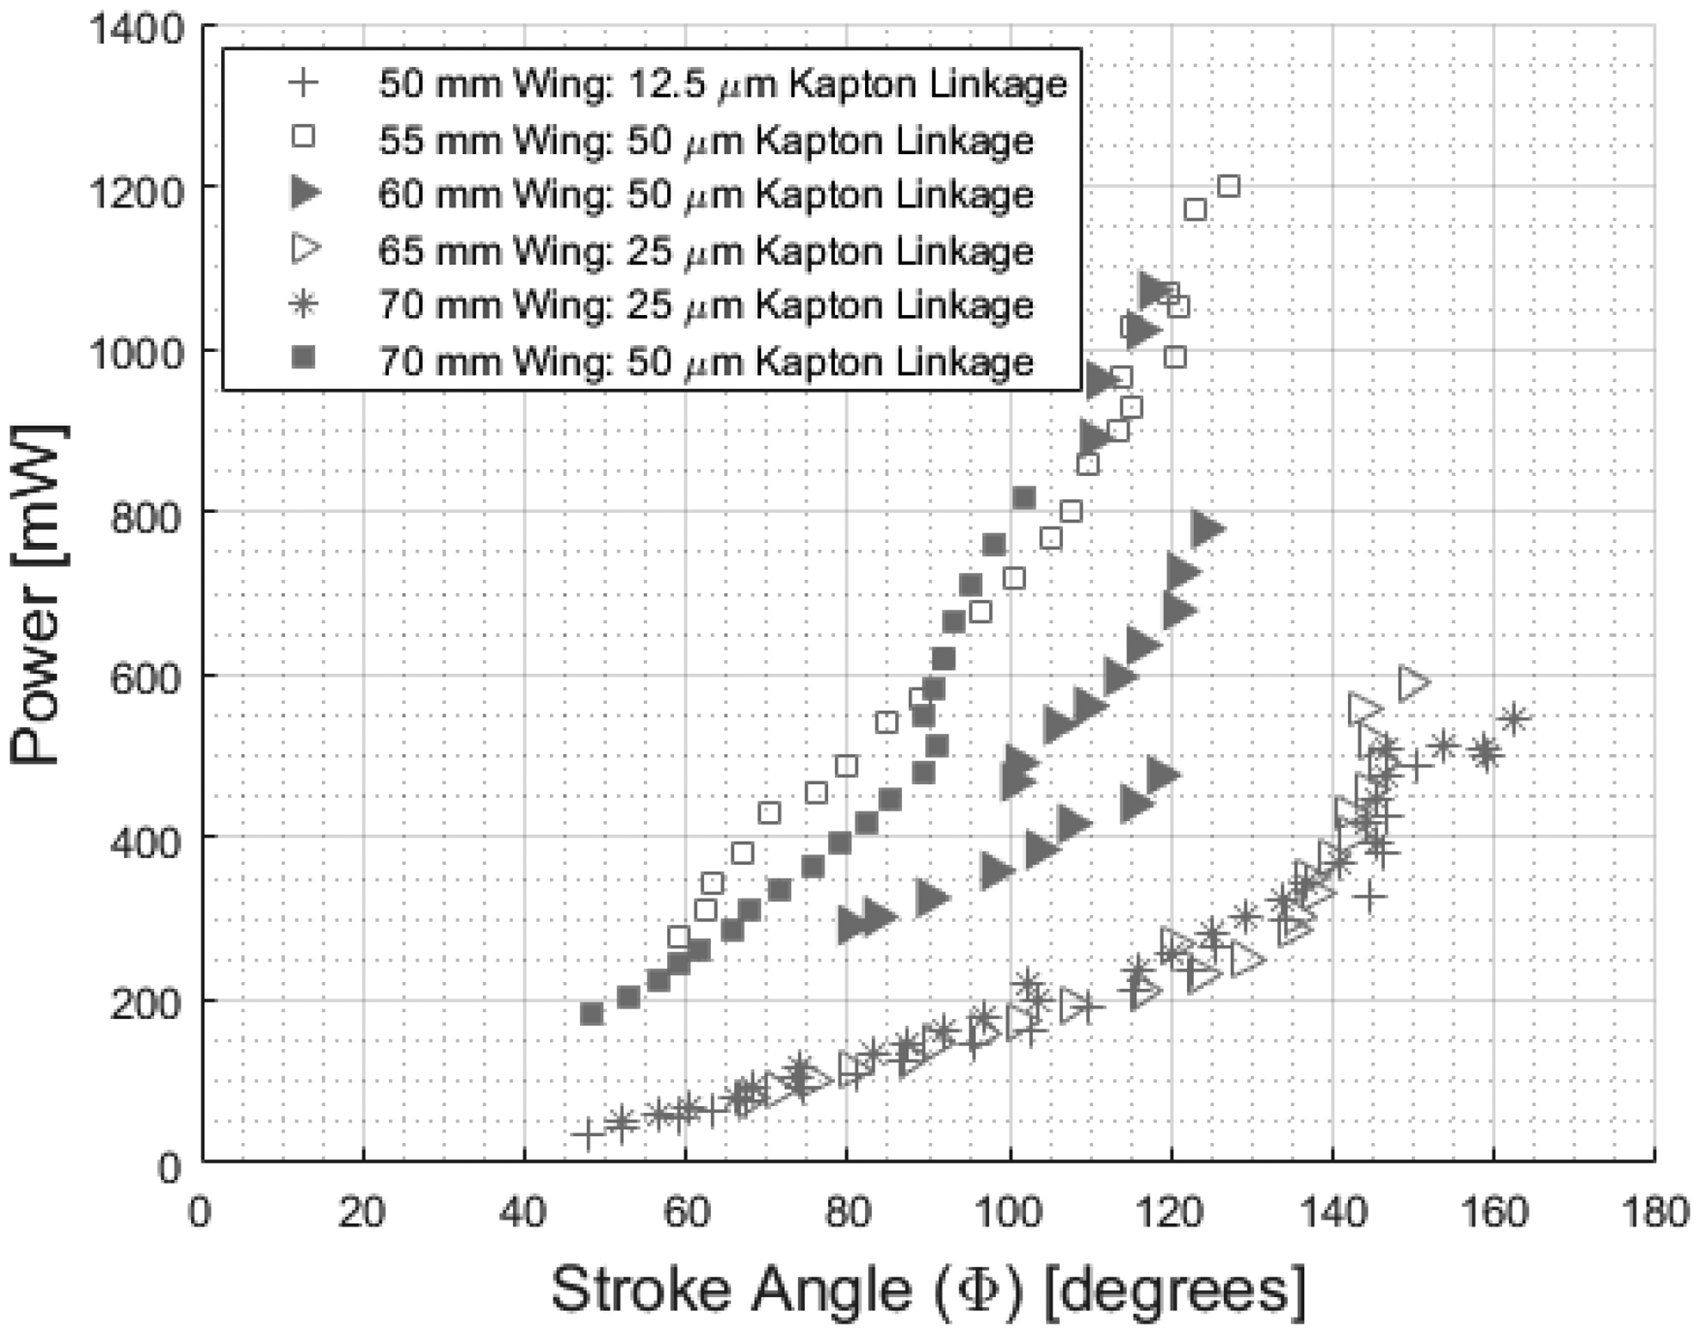
Power of wing designs listed in Table 2.

Vertical force to power ratio of wing designs listed in Table 2.
Because of the varying frequencies and wing lengths, there was not a clearly delineated progression of vertical force with increasing wing length. However, there were two designs which produced clearly superior forces. The 55 mm wing at 22.8 Hz equipped with a 45° angle stop generated vertical forces up to 600 mgF greater than the original wing for a given stroke angle. The 70 mm wing at 15.7 Hz generated vertical forces up to 650 mgF greater than the original wing for a given stroke angle. At a stroke angle of 100°, the new designs increased the vertical force by up to 165%, whereas the power consumption increased by up to 399%. As Figure 23 shows, the increase in vertical force was accompanied by a decrease in efficiency.
The 60 mm wing with the 50 µm Kapton joint was tested with several wing specimens, some of which were not constructed properly. For this reason, a nonlinear relationship exists between stroke angle and vertical force, as well as stroke angle and power. The 70 mm wing with the 50 µm Kapton joint initially consumed less power than the 55 mm wing with the 50 µm Kapton joint. However, as stroke angle increased the 70 mm design consumed more power. The drag on the wing explains this increase in power for the largest wing.
An advantage to increasing the planform area of the wing, rather than simply increasing the natural frequency of a 50 mm wing, was a longer service life and a smoother flapping motion. The original AFIT wing flapping at higher frequencies had a choppy flapping motion, and succumbed quickly at the passive rotation joint. In comparison, the 65 and 70 mm wings flapped through several full amplitude sweeps without breaking.
Vacuum tests
To examine the effect of altering the Reynolds number of the wing, air density tests were conducted at 85%, 70%, 55%, 25%, and 0.5% of standard atmospheric pressure (atm). The vacuum tests took place with additional extension cords used to attach the Nano-17 to the rest of the experimental setup. To determine the effect the extension cord had on data accuracy, a single wing was tested at various amplitudes, with and without the extension cord attached. The results indicated the data values remained within 1.8% of the values without the extension cords, provided a sufficient number of tests were conducted at each test point.
To account for the inherent differences in the individual wing specimens, each wing was first flapped at five driving amplitudes before the vacuum pump was engaged to compute reference values. The number of test points was limited to five for the atmospheric testing because a full amplitude sweep would sometimes degrade the wing before it could be used for the partial vacuum tests. Figures 24 through 26 give the vertical force, power, and efficiency for the five partial vacuum tests, respectively.
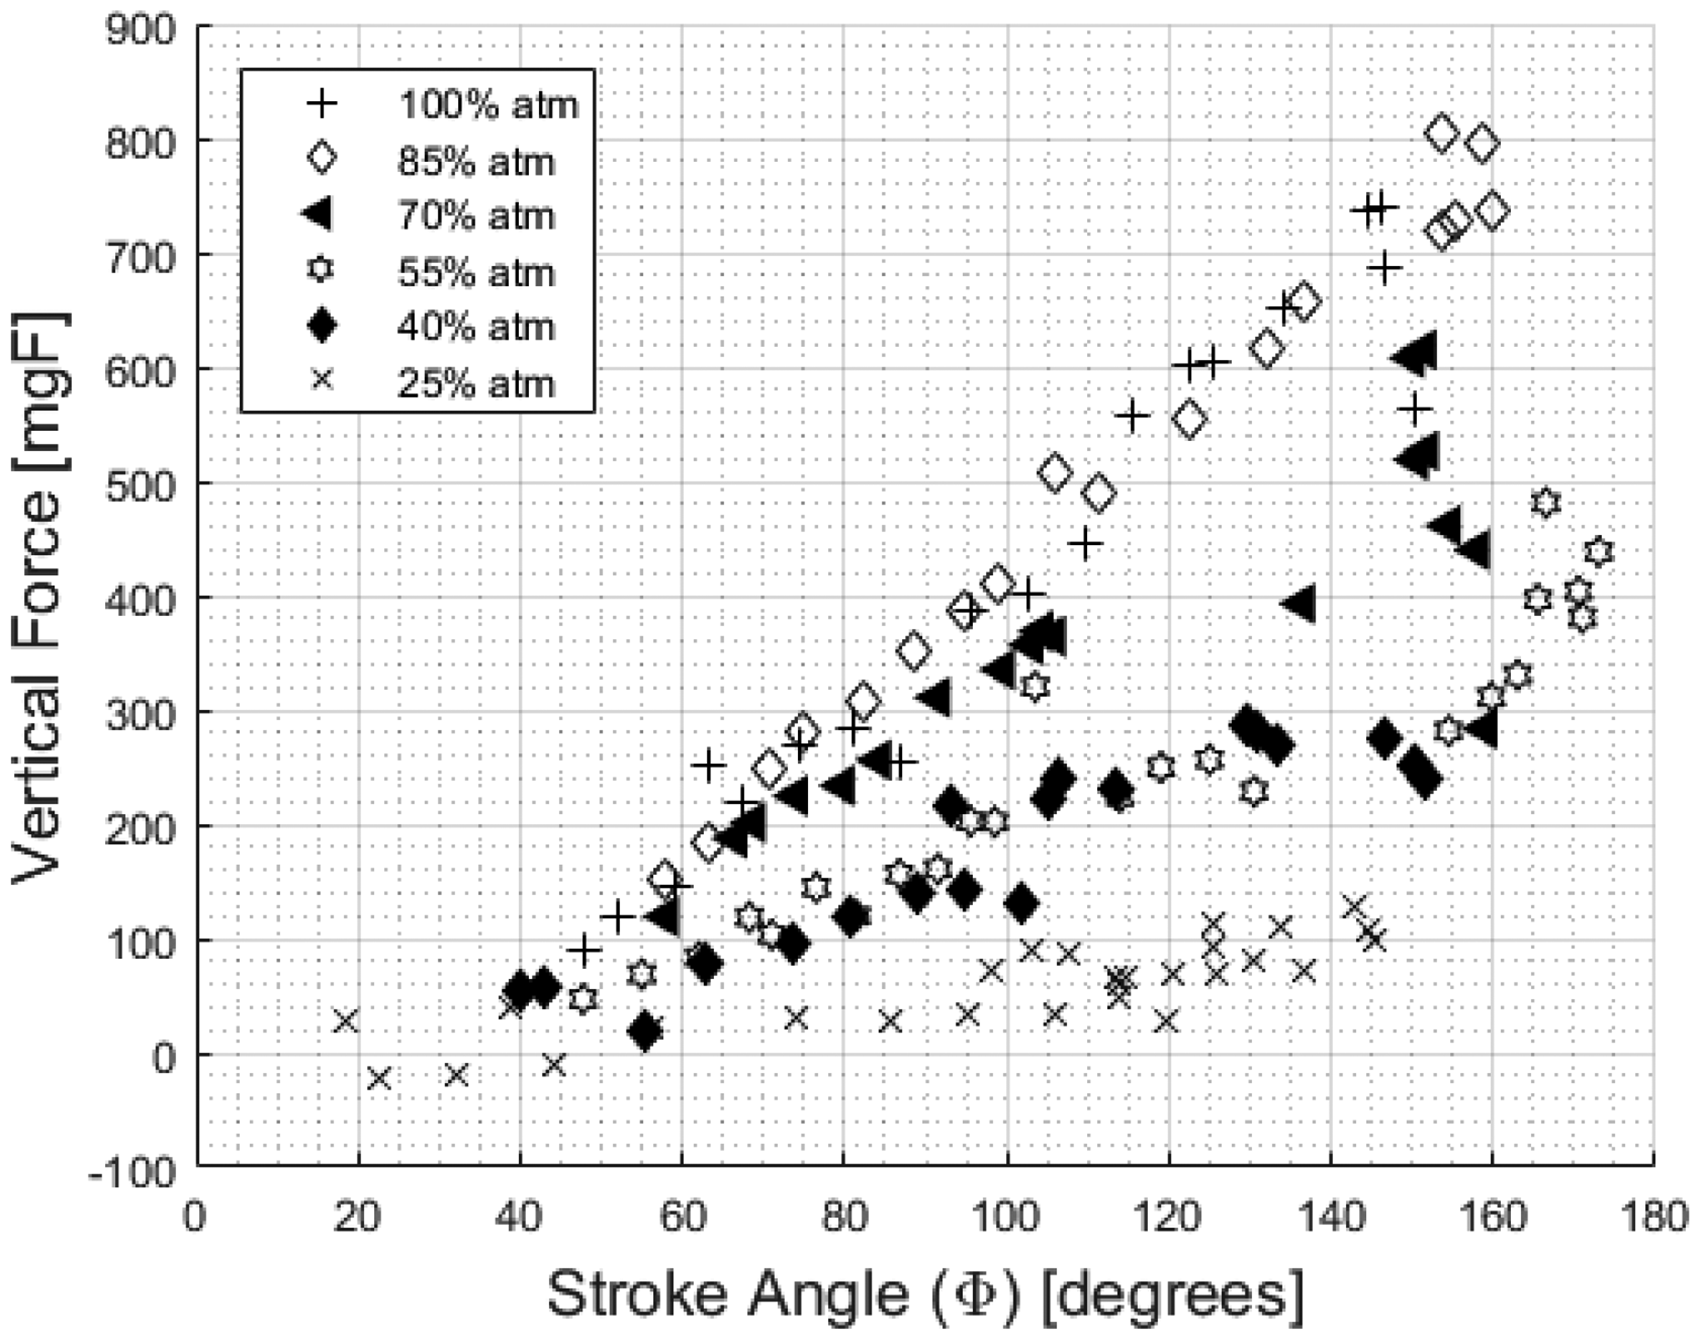
Vertical force vs.

Power vs.
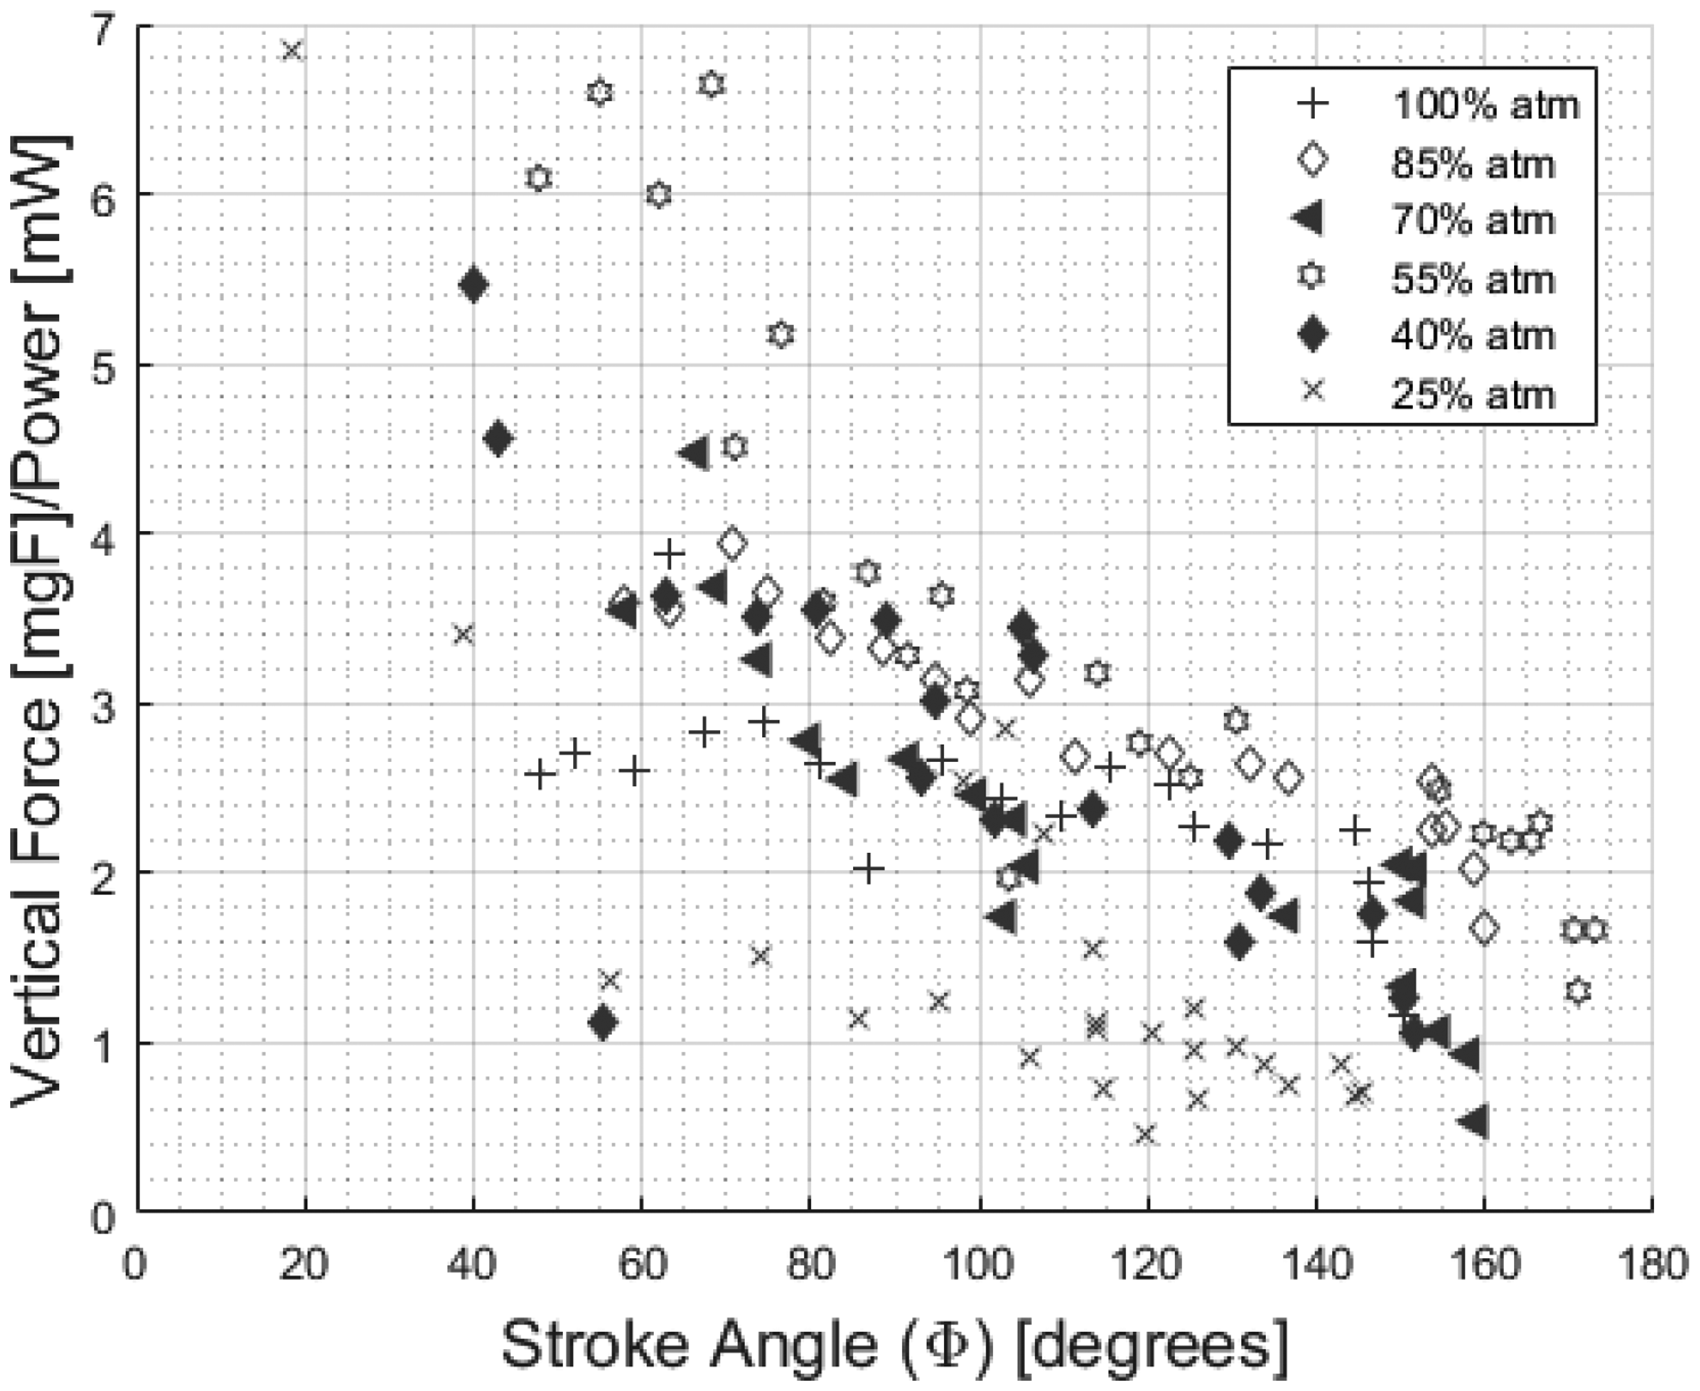
Vertical force to power ratio vs.
There was a clear pattern of vertical force increasing at a slower rate under partial vacuum as stroke angle was increased, with the maximum stroke angle occurring at lower driving voltage amplitudes. There was also a pattern of power consumption decreasing with decreasing air density, due to the decrease in vertical force production. There was no clear trend regarding vertical force to power ratio. The relationship between stroke angle and vertical force and power broke down for certain test cases, such as the 70% atm and 40% atm cases. This was due to the asymmetric flapping of these tests. Under partial vacuum conditions, symmetrical flapping was impossible to achieve under certain stroke angles. The difference between upstroke and downstroke would vary considerably from one stroke angle to the next. As a result, vertical force and power did not increase in a linear fashion.
Reynolds number effect was the principal reason for these tests; however, other useful information can also be determined from this data. For example, at altitudes and temperatures seen in mountainous regions of the world, the density of air can reach the air densities seen in the partial vacuum tests. These tests indicate decrease in density leads to a decrease in vertical force. This degradation in performance under certain conditions must be considered when determining the lift requirements of an FWMAV.
Near absolute vacuum test
Tests were conducted at 4.3 Torr, which was the lowest attainable air pressure, to determine the purely inertial behavior of the biomimetic wing. The pressure 4.3 Torr is equivalent to 573 Pa, or 0.57% of atmospheric pressure. Figures 27 through 29 compare the forces, moments, and power consumption of the wing operating near absolute vacuum to the same specific wing operating at atmospheric pressure, as well as to the baseline wing test at atmospheric pressure.
Figure 27 shows at near vacuum conditions, the 50 mm wing produces negligible cycle-averaged forces. The vertical force would oscillate between −40 and 40 mgF, while the original wing at atmospheric conditions produced vertical forces which increase linearly from 365 to 600 mgF. The negligible cycle-averaged forces produced by the wing under purely inertial movement indicate all force data collected for the biomimetic wing are the result of aerodynamic forces on the wing. The data is not affected by kinematic movement of the wing itself, or the movement of the vibrating piezo. The moment data in Figure 28 also shows negligible moment production at vacuum.

Comparison of forces of the 50 mm wing at 100% atm at 17.3 Hz (top) vs. 0.57% atm and 17.3 Hz (bottom).
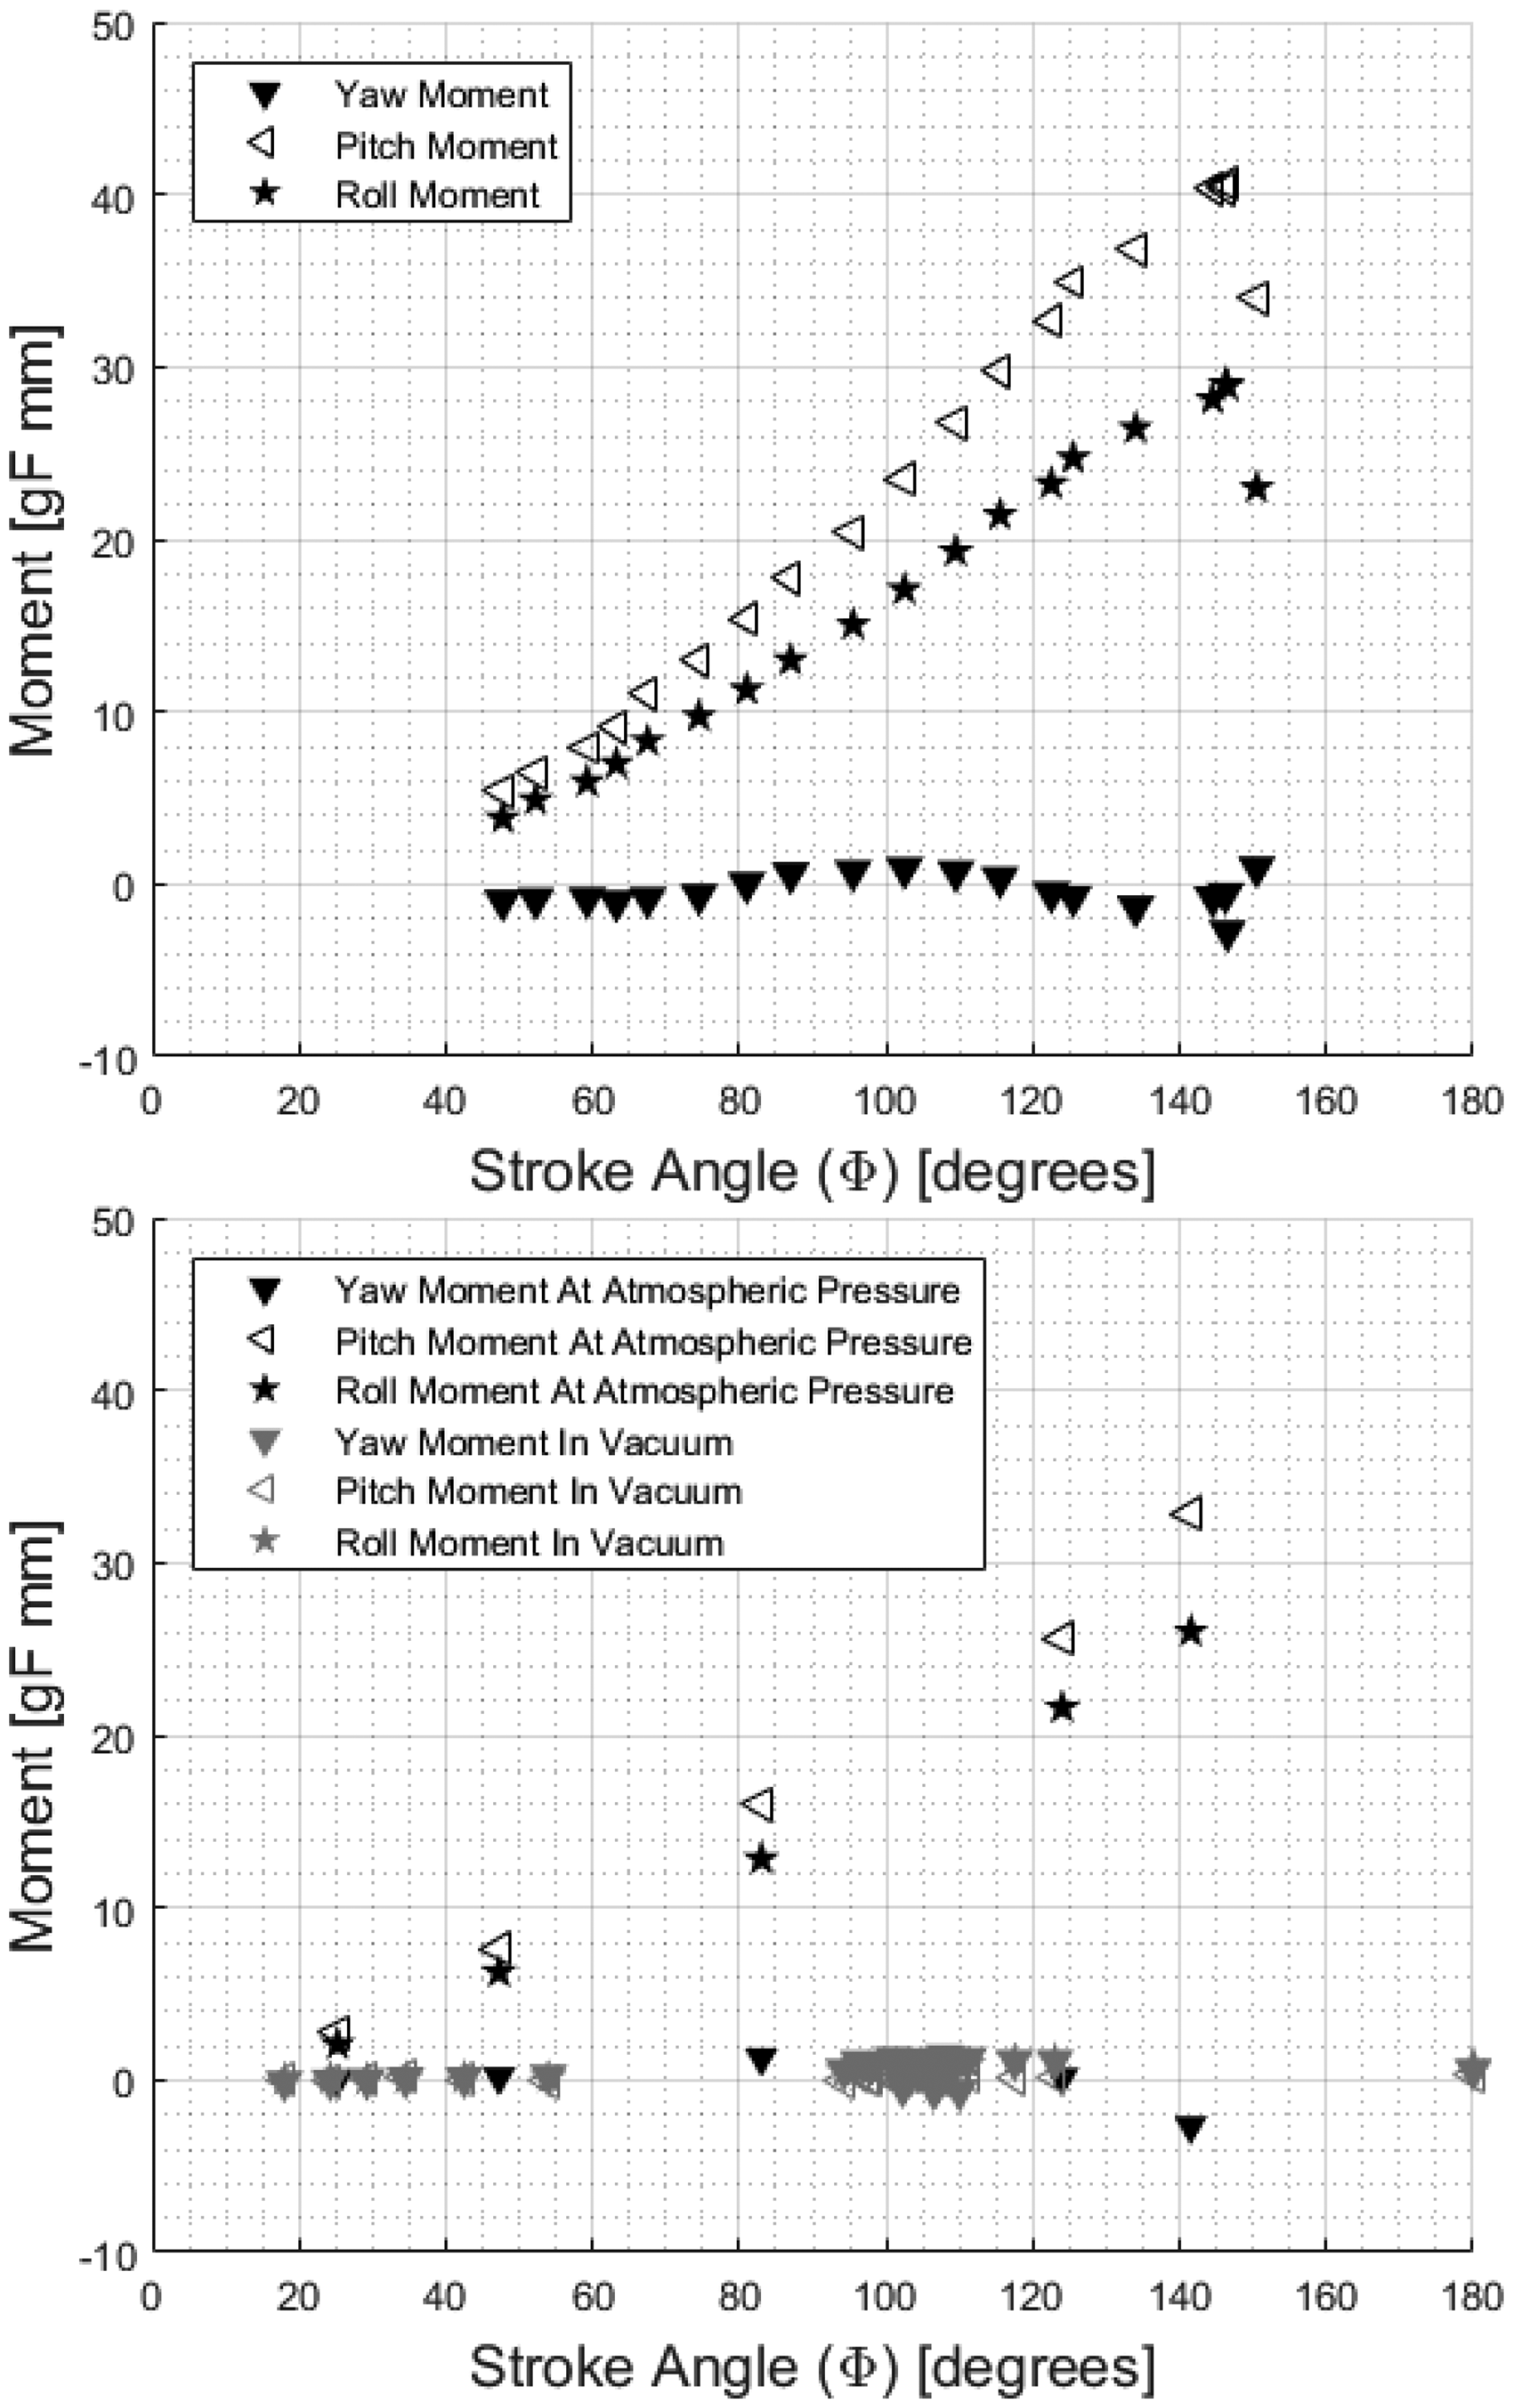
Comparison of moments of the 50 mm wing at 100% atm at 17.3 Hz (top) and 0.57% atm and 17.3 Hz (bottom).
The negligible forces and moments produced by the wing and the piezo suggest future researchers can use data collected by past researchers while utilizing new piezo designs. The use of a piezo of differing weight or dimensions will not require a significant inertial correction to previously collected force and moment data.
Figure 29 compares the power consumption of the wing flapping at atmospheric pressure to the same wing operating near vacuum pressure. The maximum power consumption was 70 mW, at a stroke angle of 180° under near vacuum conditions, while the original 50 mm wing consumed 487 mW, at a stroke angle of 150°.

Power comparison of the 50 mm wing at 100% atm at 17.3 Hz and 0.57% atm and 17.3 Hz. The power of the specific wing flapped at 0.57% was also measured at 100% atm at five test points to account for the variation in individual wing specimens.
The increase in power consumption with increasing stroke angle in most of the atmospheric tests can be attributed to the wings’ interaction with the air, rather than an increase in the kinetic energy of the wing. At a stroke angle of 150°, the vacuum test consumed 84.4% less power than the wing consumed flapping at the atmospheric pressure. Although there are small energy savings made by decreasing the weight of the wing, most of the power requirement is a result of overcoming drag at atmospheric pressure.
Reynolds number
Equation (5) provides the formulation for Reynolds number. The dynamic viscosity was calculated with Sutherland’s Law, shown in equation (9), which calculates the viscosity of the air using the temperature in comparison to a reference viscosity (µ), reference temperature (Tref), and a constant (X), which were measured in the lab before each test, and compared to tabulated values found in Brown
16

The Reynolds number varied from 73.8 for the 25% atmospheric pressure test at an 18° stroke angle, to 3168 for the 55 mm wing flapping at 22.8 Hz at a 130° stroke angle. This variance was due to the different air densities, characteristic lengths, and wingtip velocities of the various test conditions. For each test point, the Reynolds number is compared to the vertical force. Figure 30 shows the Reynolds number data for the original 50, 55, and 60 mm wings.

Reynolds number vs. vertical force of the 50, 55, and 60 mm wings with original linkages.
The plot shows the data of all three wings overlaps nearly coincident with each other, indicating vertical force linearly correlates with Reynolds number. The overlap suggests Reynolds number can be used to directly predict the vertical force capabilities of a wing.
Figure 31 compares the 50 mm wing behavior with the three separate linkages. The 50 mm wing with the 50 µm linkage shows atypical behavior. This particular wing generated lower vertical force than the 50 mm wing with the 25 µm linkage. Although the 12.5 µm linkage and 25 µm linkage 50 mm wings both have overlapping data points for vertical force, the 50 µm linkage has a shallower curve, indicating the vertical force increases more slowly as Reynolds number increases. This is a similar pattern as the previously shown data, which compared the three linkage designs, wherein the 50 µm design led to degraded performance despite a higher wingtip velocity.

Reynolds number vs. vertical force of the 50 mm wing with three separate linkages.
Figure 32 shows the Reynolds number data for the longer wing designs with thicker linkages. The vertical force plot shows the same pattern with a large amount of overlap, with the exception of the 60 mm wing. The 60 mm wing behavior can be attributed to the use of multiple wings which operated under various flapping frequencies, temperatures, and angles of attack.

Reynolds number vs. vertical force of the 50–70 mm wings and 12.5–50 μm Kapton linkages at atmospheric pressure. The 60 mm wing with 50 μm Kapton linkage deviates from the pattern due to multiple wings being used for the testing, some of which were not properly constructed.
Figure 33 shows the Reynolds number data for the partial vacuum tests. The vertical force graph shows a clear trend of Reynolds number and vertical force correlation regardless of specific test conditions.

Reynolds number vs. vertical force at 25–100% atmosphere.
With the exception of the 60 mm wing with the 50 µm thick Kapton linkage and 50 mm wing with the 50 µm thick Kapton linkage, there is a correlation between Reynolds number and vertical force, which indicates that increasing the Reynolds number will lead to an increase in wing lift production. The Reynolds number correlates with the wing characteristics in equation (10)
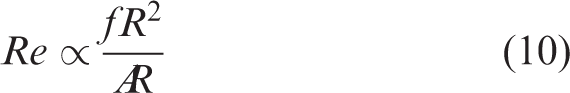
The decrease in natural frequency associated with an increase in wing length can be attenuated by increasing the stiffness-to-mass ratio of the flapper joint system. Further increasing the four-bar linkage Kapton thickness from 12.5 µm to 25 µm increases the vertical force-to-power consumption ratio of the system.
Conclusion
The research presented represents a significant contribution to the understanding of the aerodynamics, modeling, and design of the piezoelectric actuator driven M. sexta inspired biomimetic wing. A six degree of freedom force and moment balance, displacement sensor, vibrometer, and three high speed cameras operating at a 1000 Hz frame rate were used to capture the behavior of the wing, controlled through the use of an AFIT written MATLAB graphical interface, which controlled the drive signal sent to the piezoelectric actuator attached via a four-bar linkage to the biomimetic wing. The goal of the testing was to further elucidate the aerodynamics and design of a M. sexta wing by measuring the performance of the wing in variable air densities with varying wing spans.
The three research areas addressed were the effect of Reynolds number on the wing design, using larger span constant aspect ratio wings to increase total lift, and the impact the motion of the wing, and its flap harmonics, had on force measurements, compared to the impact of purely aerodynamic forces. All three of these research questions were answered by separately varying the air density and characteristic length of the wing. Tests were conducted in which the length of the wing was increased from 50 mm to 55, 60, 65, and 70 mm. A constant aspect ratio was maintained; therefore, only a single variable was changed for each set of tests. Next, tests were conducted in which the air density was indirectly altered by lowering the air pressure to 85%, 70%, 55%, 40%, 25%, and 0.57% of atmospheric pressure, respectively.
The variable wing length tests demonstrated increasing the characteristic length of the wings increased the vertical force production up to 165% over the baseline design, when the flapper’s mechanical drive system was strengthened to offset the decrease in natural frequency, which accompanied an increase in length. Thicker Kapton in the four-bar linkage increased the natural frequency of the system, which when combined with the larger wings, resulted in increased vertical force production over the baseline 50 mm design. However, these gains were also accompanied by an increase in power consumption required to overcome the increased wing mass and flapper inertia, and associated induced drag penalty.
The tests conducted at near vacuum conditions proved the measured forces and moments were attributed to the wing’s interaction with the air, and not inertial from the kinetic energy of the wing’s movement. Under purely inertial wing motion, the Nano-17 force transducer measured negligible force and moment production, while power consumption was 84.4% lower. Thus the AFIT wing has negligible inertial losses compared to designs with gear driven linkages.
The Reynolds number data collected with the variable air density and characteristic length tests provided a linear correlation between Reynolds number and vertical force production. This data, in conjunction with the aerodynamic coefficient and thrust results obtained by DeLuca, 4 suggest future researchers can use the characteristic length and natural frequency of a given wing to estimate the maximum expected vertical force production, instead of constructing heuristic wing models and performing iterative wing force generation testing, yielding a unique mission specific rapid design/build/test capability.
Finally, the Reynolds number data collected did not demonstrate a decisive relationship between Reynolds number and vertical force to power consumption ratio. There was also no relationship between wing size and efficiency. However, it was definitively shown that the 25µm Kapton four-bar linkage yielded superior power efficiency. Furthermore, efficiency decreased with increasing stroke angle. This suggests the efficiency of a FWMAV can be increased by optimizing the four-bar linkage, yielding designs which produce adequate forces at lower stroke angles.
Recommendations
This research effort was limited by the fact the driving design goal was to increase vertical force production by increasing the wing planform area and length in a constant ratio, and then subsequently increase the Kapton thickness in the four-bar linkage to achieve a dynamic stiffness necessary to maintain a natural frequency which produces increased force. Although successful, the undesirable side-effects of a decreased maximum stroke angle, and lower power efficiency were realized. Future research should take a holistic review of the several aspects of the flapper mechanism to simultaneously maximize wing area and natural frequency, while also minimizing weight and power consumption. The wing can be further improved by changing the cross-sectional geometry of the veins, changing the aspect ratio, using stiffer carbon fiber, and optimizing the passive rotation joint and angle stops. The four-bar linkage can be further improved by optimizing the Kapton thickness and the length of the L3 joint. The piezo can be optimized by changing the length and the cross sectional geometry, and using a less dense material. A system level optimization effort will provide increased performance for any FWMAV. Furthermore, conducting a Reynolds number sweep by modifying the aspect ratio of the wing will provide a final and complete look at the influence Reynolds number has on the wing. If the correlation between Reynolds number and vertical force persists as function of varying aspect ratio, this will provide another opportunity to model predictable wing performance.
Footnotes
Declaration of conflicting interests
The author(s) declared no potential conflicts of interest with respect to the research, authorship, and/or publication of this article.
Funding
The author(s) disclosed receipt of the following financial support for the research, authorship, and/or publication of this article: the Air Force Research Laboratory Munitions Directorate (AFRL/RW).