
Abstract
Flexible membrane wings at the micro air vehicle scale can experience improved lift/drag ratios, delays in stall, and decreased time-averaged flow separation when compared to rigid wings. This research examines the effect of frame camber on the aerodynamic characteristics of membrane wings. The frames for the wings were 3D printed using a polymer-based material. The membranes are silicone rubber. Tests were conducted at Re ∼50,000. Aerodynamic force and moment measurements were acquired at angles-of-attack varying from −4 to 24°. Additionally, digital image correlation data were acquired to assess time-averaged shapes of the membrane wings during wind tunnel tests. An in-house program was developed to average the deflection plots from the digital image correlation images and produce time-averaged shapes. Lifting-line theory based on the time-averaged shapes was then used to calculate theoretical lift and induced drag coefficients, showing that the time-average shape of the membrane under load contributes extensively to the aerodynamic performance. The results show that introducing camber to the frames of membrane wings increases aerodynamic efficiency.
Keywords
Introduction
The evolution of wings for fixed-wing micro air vehicles (MAVs) has led to one with a flexible membrane structure. Previous MAV studies concluded that applying a similarly flexible membrane material to a fixed-wing-type MAV increases aerodynamic efficiency, assists with gust alleviation and has control advantages when compared with rigid wings.1–4 Additional studies focusing more specifically on wing and membrane parameters—including cell geometry, membrane pre-strain, frame flexibility and trailing-edge scallop characteristics—have shown the benefits on wing flexibility.5–8 Typically, membrane wings are composed of a rigid or semi-rigid frame (frame stiffness >> membrane stiffness) and a silicon rubber (or similar) membrane, as shown in Figure 1. Spanwise battens divide the wing into cells and are often implemented to adjust overall wing stiffness or optimize the effect of the membrane deformation.
Typical frame (dashed lines) and membrane (gray) structure.
Most membrane wing studies have focused on flat-frame geometries or ad hoc cambered wing designs with little emphasis on the effect of frame camber. Moderate frame camber has well-known benefits and these exist in the low Reynolds number range as well. Pelletier and Mueller
9
studied the effect of 4% camber for low aspect ratio, low Reynolds number (∼1.4 × 10⁵) rigid wings. As shown in Figure 2, camber (right figure) increases the lift coefficient.
Rigid flat (left) vs. rigid cambered (right) low-AR, low Re wings.
9

For membrane wings, though, the effect of frame camber on the aerodynamic performance of low aspect ratio wings has not been systematically investigated. Due to the potentially large cambering of membrane created by the aerodynamic loading, the frame camber may play a less significant role. Thus, it is of interest to determine whether applying camber to the frame of a flexible membrane wing would allow for improved aerodynamic performance and to quantify the benefits if identified. This research investigates the effects of applying camber to the frames of membrane wings. Experimentally obtained, time-averaged aerodynamic force coefficients and membrane deformations are used as a comparison between membrane wings with cambered frames and those with flat frames. Specifically, the objectives are:
to measure the aerodynamic forces for flexible membrane wings with cambered frames and determine whether they are more efficient than membrane wings with flat frames, to obtain time-averaged shapes of the membrane wings during test conditions and compare geometric trends between frame camber and membrane shape, and to correlate changes in aerodynamic forces with time-average membrane shapes using lifting-line theory calculations.
Methodology
Facilities
Experiments in this investigation were performed in The University of Alabama’s low-speed wind tunnel. The tunnel has an open-circuit, interchangeable test section. For this investigation, the 30 in × 30 in (76 cm × 76 cm) MAV test section was used. The MAV test section is 6 ft (1.83 m) long with 360° of optical access. The flow velocity ranges from 4.5 to 49.2 mph (2.0 to 22.0 m/s) with an uncertainty of ±0.67 mph (0.3 m/s).
10
The centreline-free stream turbulence intensity is less than 0.5% at 10 m/s. The freestream velocity was recorded using a pitot-static probe. Static and stagnation pressures were measured by a pitot-static tube and a digital pressure scanner (NetScanner PSI-9116, ±5 kPa range). Air density was calculated using the ideal gas law for dry air conditions. For this calculation, ambient absolute pressure and temperature were measured by a Druck DPI-142 digital barometer and K-type thermocouple connected to a National Instruments USB-9211 module, respectively. The estimated bias-based error for the freestream velocity is ±0.3 m/s.
8
A diagram of the wind tunnel test section with a model installed is shown in Figure 3.
Wind tunnel test section.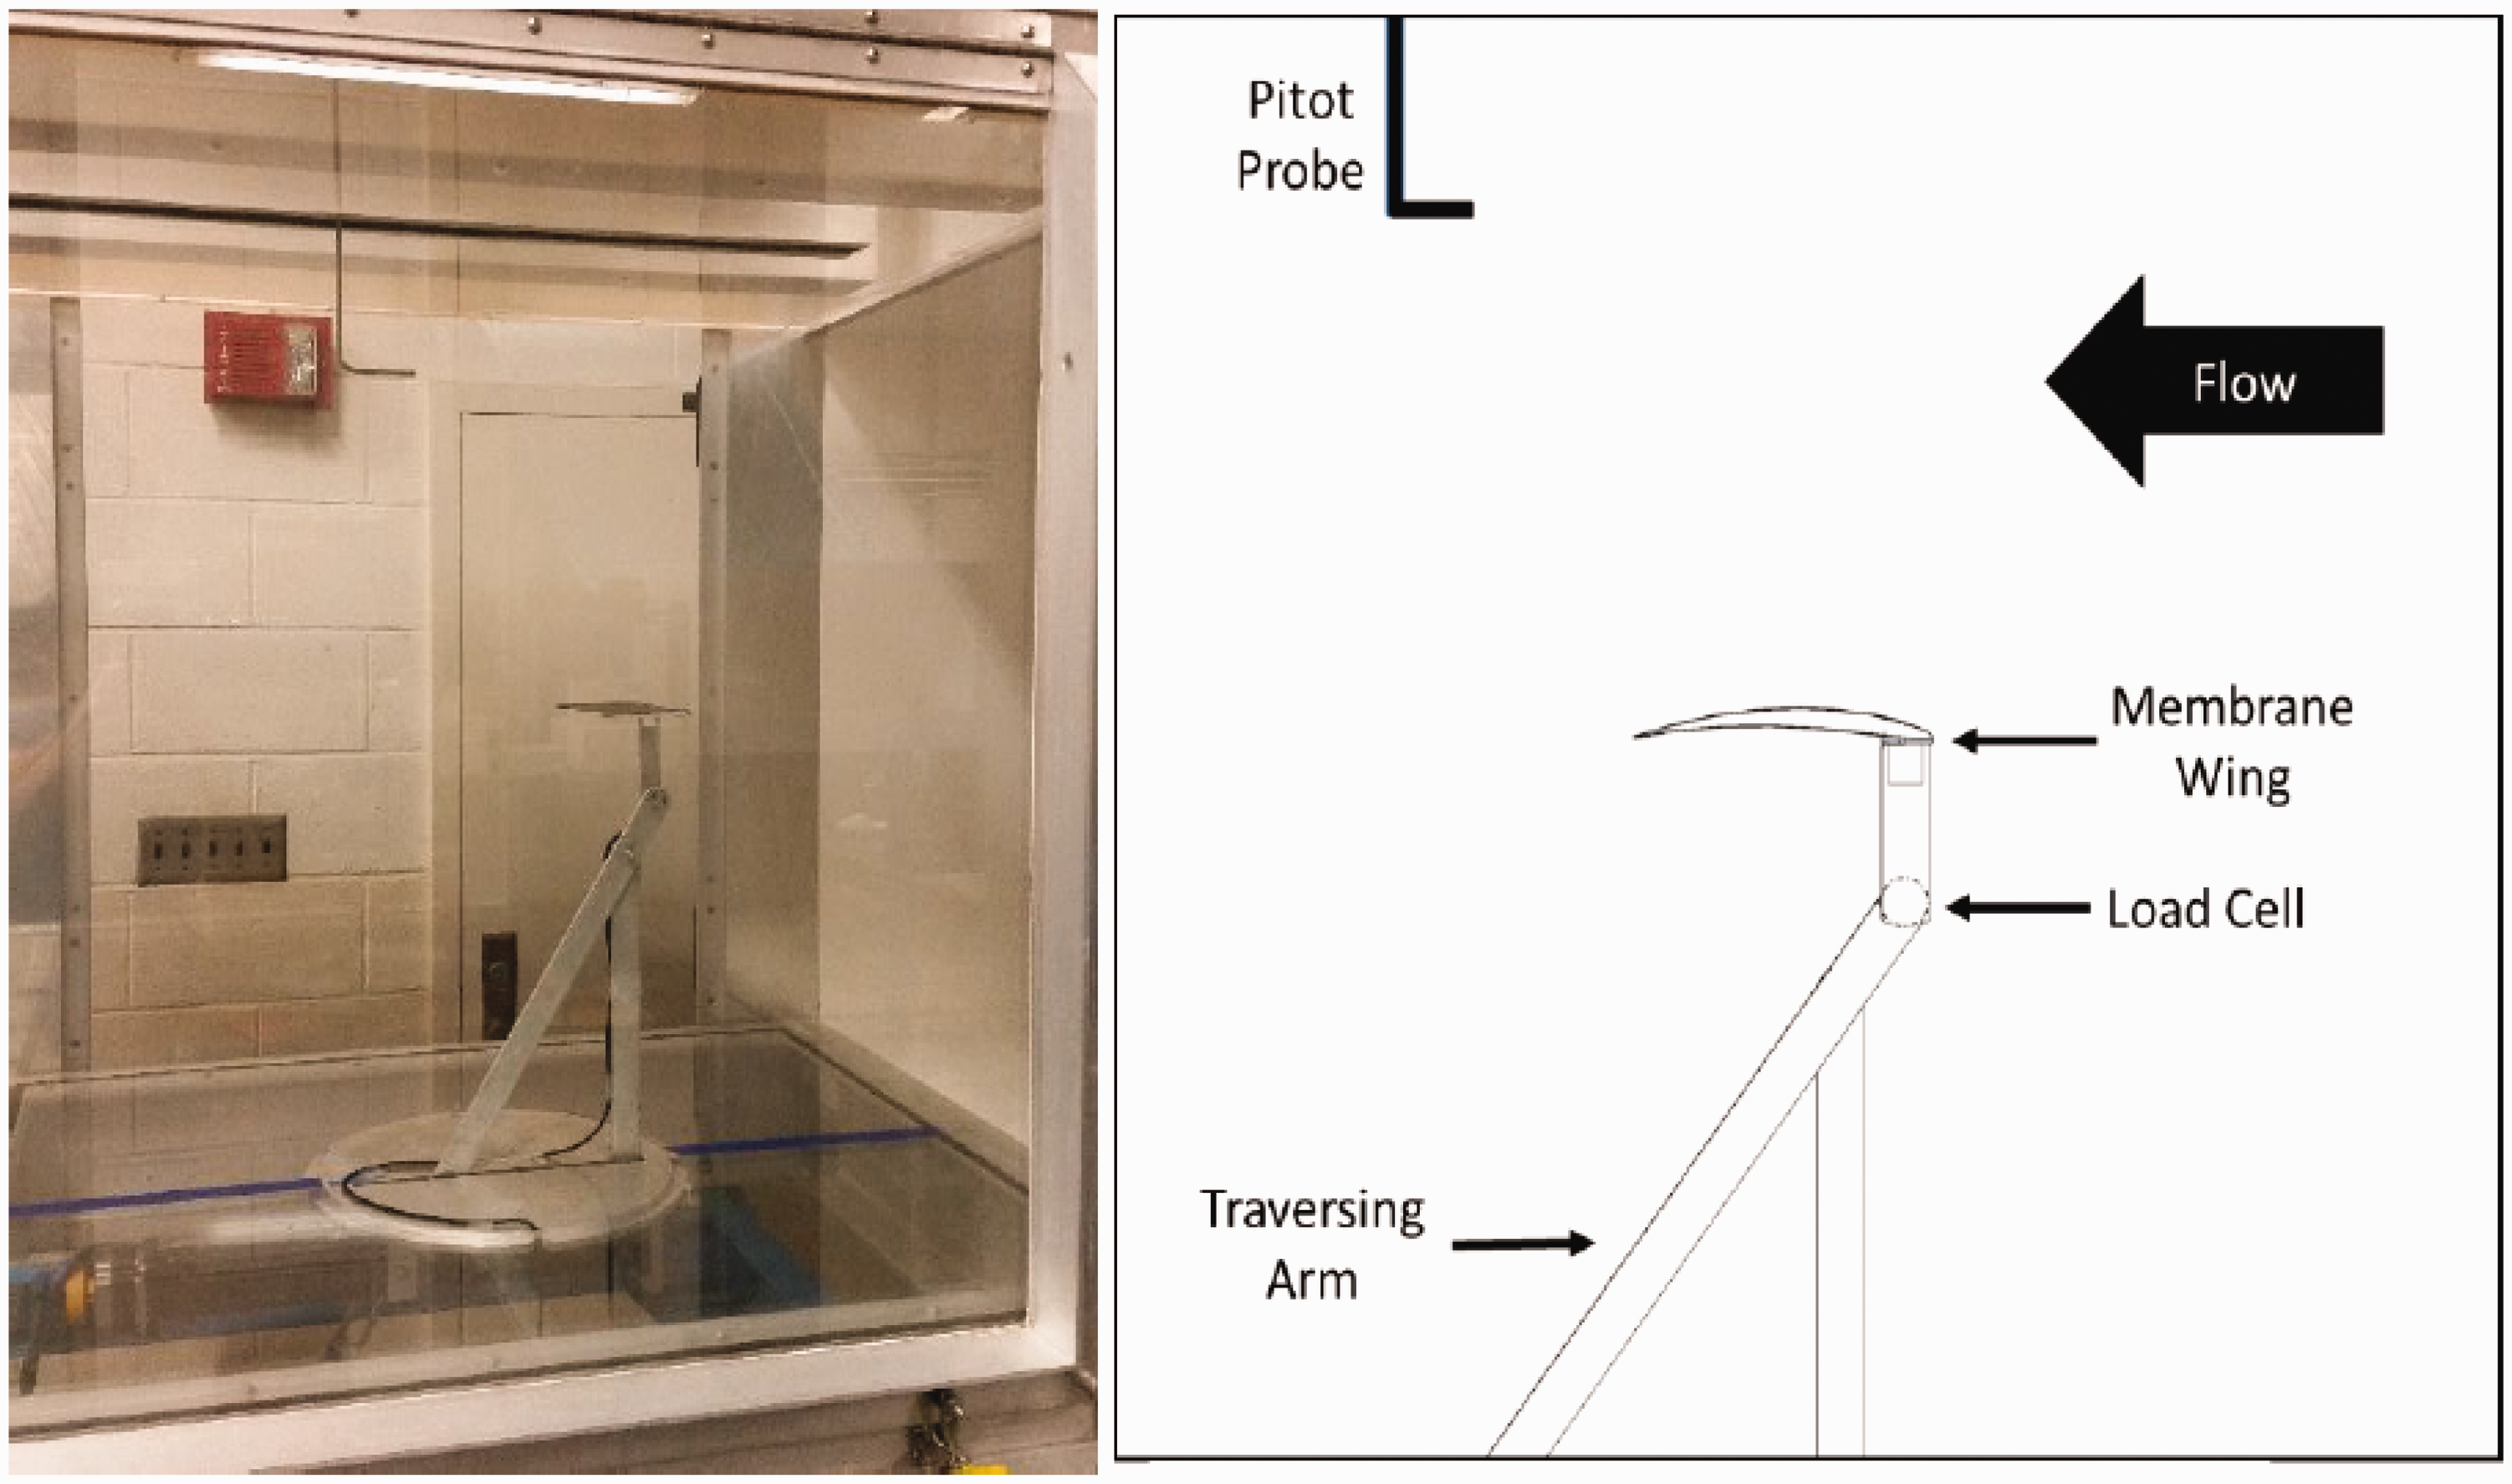
3D printing lab
The frames were printed in the UA 3D Printing Lab, part of the College of Engineering’s student workspace called The Cube. The two printers primarily used for this research were the Objet30 Pro and Stratasys Dimension SST 1200es. The Objet30 Pro is a commercial grade 3D printer capable of accuracies down to 6 × 10⁻⁴ in (0.01 mm) on a build table of 11.57 × 7.55 × 5.85 in (294 × 192 × 149 mm). The Objet30 printer was used to create the cambered frames with a photopolymer material called Vero. A beam tip deflection test was performed to measure the modulus of the material. Test specimens of 0.25 × 0.25 × 3.5 in (0.64 × 0.64 × 8.9 cm) were printed and clamped at one end, and known weights were placed on the other end. Based on beam theory and the measure tip deflection, the modulus was measured to be 130 ksi (900 MPa), significantly higher than the modulus of the silicon rubber membrane 65 psi (500 KPa). The quoted modulus of elasticity for the frame material is 290–430 ksi (2000–3000 MPa).
The Stratasys Dimension SST 1200es is also a commercial grade 3D printer. It uses fused deposition modeling to create parts from ABSplus plastic material. It prints with a layer thickness of 0.01 in (0.25 mm) with a build size of up to 10 × 10 × 12 in (254 × 254 × 305 mm). The support material is composed of Soluble (SST 1200es) and Breakaway (BST 1200es). The Stratasys printer was used to create molds for the membrane adhering process, discussed in the next section.
Test articles
The Objet30 Pro 3D printer was used for printing the frames. The frames were designed in SolidWorks. The printed frames are 6.0 in × 3.0 in × 0.11 in (152 mm × 76 mm × 2.8 mm), creating an aspect ratio of two. The battens are each 0.15 in (3.8 mm) wide. A top view of the frame without the membrane is shown in Figure 4.
Top view of frames without membrane. Dimensions are in inches.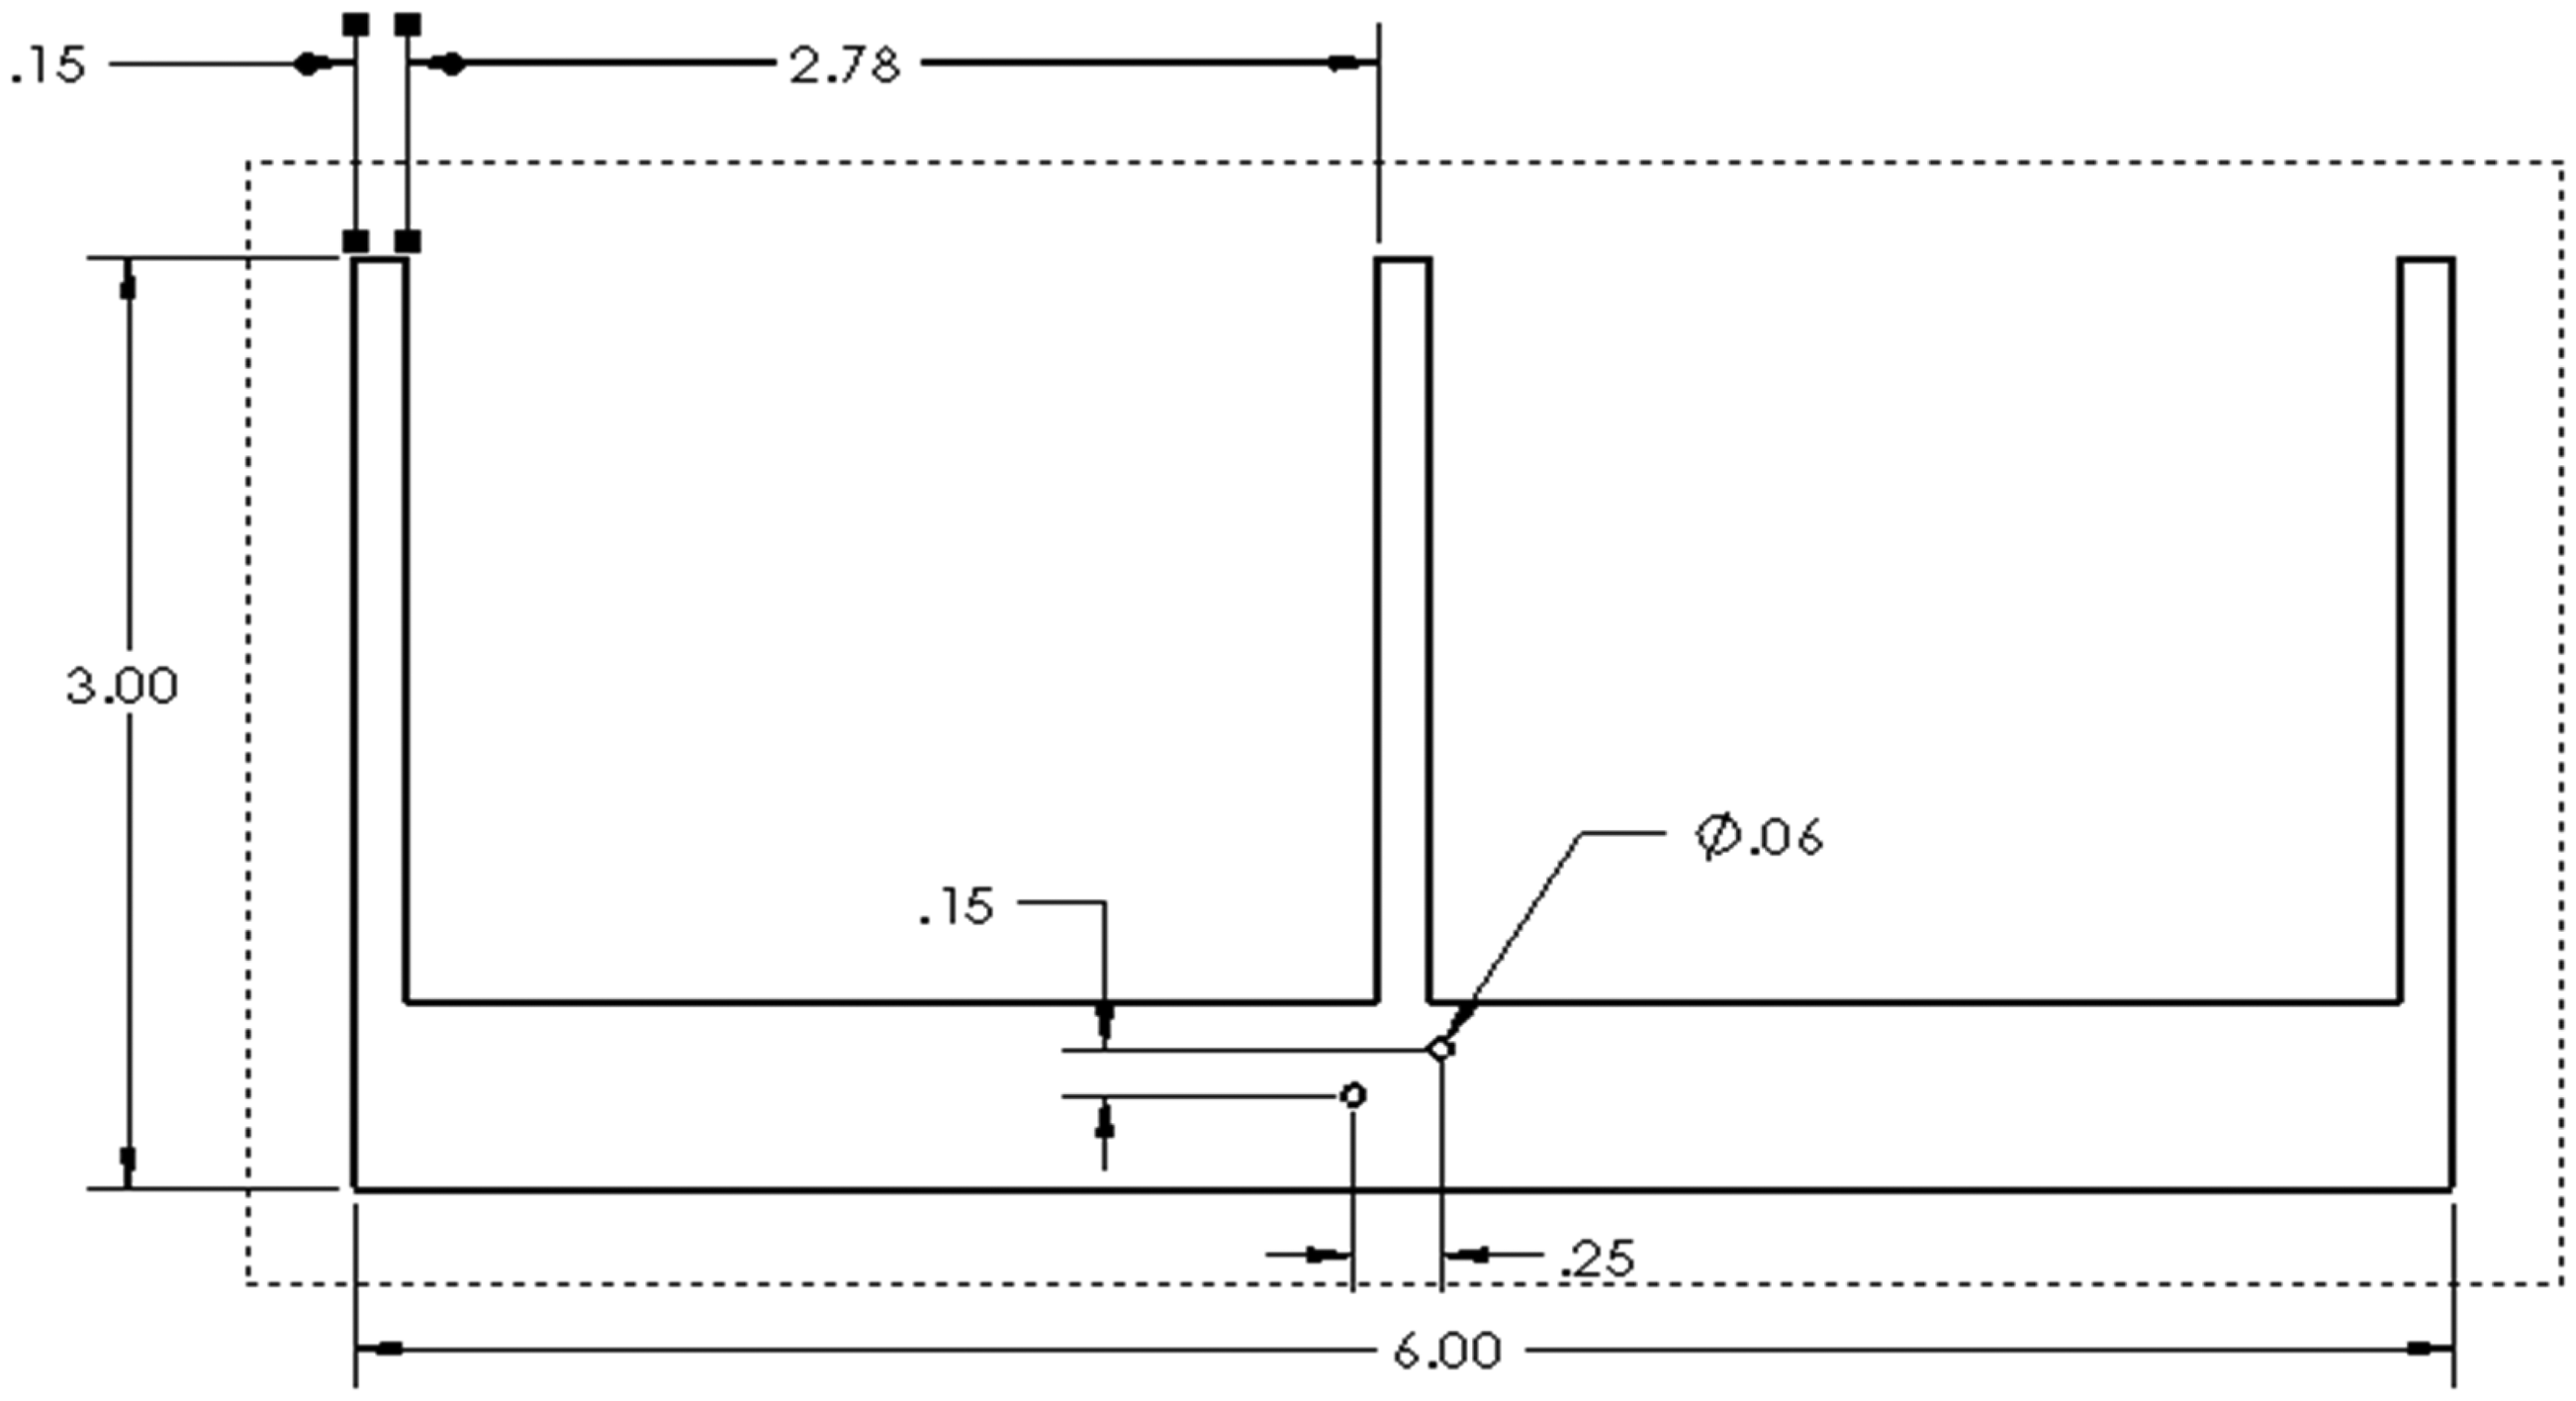
The frame aspect ratio of 2 and cell aspect ratio of ∼1 was chosen based on previous studies of low aspect ratio specimens.
8
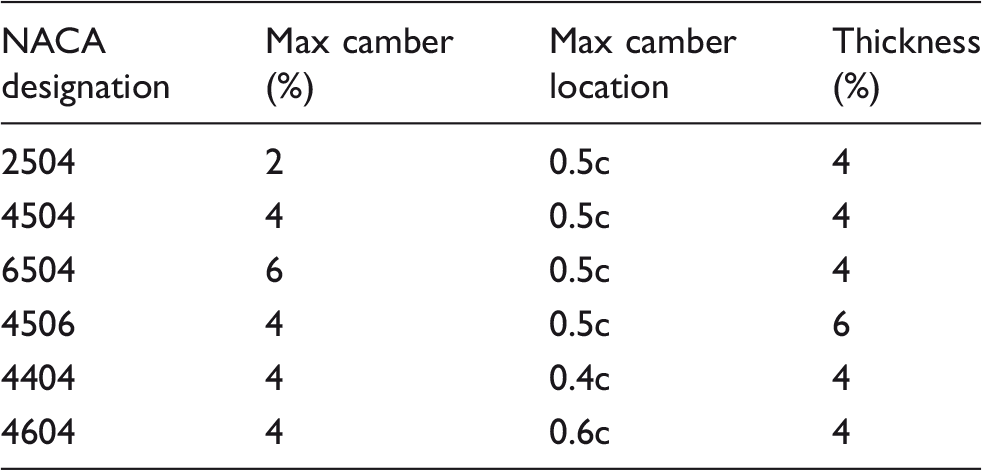
Frames with 2%, 4% and 6% camber were printed following the NACA 4-series specification, as well as frames with no camber. Frames also vary in thickness and maximum camber location. A frame with an NACA 4504 (4% max camber, 50% max camber location, and 4% thickness) airfoil is shown in Figure 5. Table 1 shows the list of test specimens.
Top: 3D-printed NACA 4504 frame for a membrane MAV wing. Bottom: Cross-section for 3D-printed frame. Test specimens.
The membrane adhered to the frames is a silicone rubber material with a thickness of 0.010 ± 0.002 in (0.025 ± 0.005 cm), a tensile strength of 800 psi (5.52 MPa), and a hardness of 20 A (hardness as reported by the manufacturer). From high-speed video analysis, the rigidity of the battens is negligible. Displacement of the tips of the battens at the trailing edge was less than 1% of the wing span. Membrane vibration and displacement were independent of batten movement. As presented in 3D printing lab section, the modulus for the membrane is significantly lower than the modulus of the frame; hence, the flexibility in the wing at the test dynamic pressure is derived primarily from the membrane.
The membranes were adhered with zero applied pre-tension. An adhesive called dragon skin was used to adhere the silicone membranes to the frames. Adhering silicone membranes with dragon skin followed a process developed by Abudaram et al.
11
For the adhering process, frame molds were 3D printed for each frame using the Stratasys Dimension SST. The membrane was placed on the mold, followed by the frame with applied dragon skin and a weighted object. Each membrane was then cut to form a trailing edge scallop of 25% of the membrane chord, a means to reduce drag but maintain lift.
7
Frames were printed with airfoils (battens) of 2504, 4504, and 6504. Additionally, a membrane wing with a flat frame was fabricated for comparison. Figure 6 shows the printed test subjects.
Test articles and related 3D printed items.
Data acquisition
A Nano-17 E ATI Industrial Automation load cell was used to measure forces and moments in the x, y, and z directions. The load cell has a resolution of 1.41 × 10⁻³ lb (6.25 × 10⁻³ N) for force measurements and 2.5 × 10⁻⁴ lb∙in (3.13 × 10⁻² N∙mm) for moment measurements. This corresponds to a force and moment coefficient resolution of 0.009 and 5 × 10⁻⁵, respectively, for the test conditions. Angle-of-attack setting was achieved using a Velmex Xslide linear traverse to control a traversing arm with a range of −4 to 24° as shown in Figure 7.
Test article/traverse setup in wind tunnel coordinate system.
Digital image correlation
A Correlated Solutions’ VIC-3D System was used for digital image correlation (DIC) measurements of the membrane deformation. The DIC system used a dual-camera configuration with the line of sight for both cameras angled at 90° from each other and in a plane normal to the model. Figure 8 shows a top view schematic of the DIC system setup with respect to the wind tunnel and test articles.
DIC system setup.
Approximately 100 images were acquired during each test with an exposure time of 1 ms and a sampling of approximately 5 Hz. Correlated Solution’s software was used for developing displacement matrices for the vibrating membranes. Zhang et al. 8 determined, due to shifting in the membrane vibration frequency, that the RMS displacement error converged to less than 0.02 mm at 100 images. The system is quoted to have the capability of measuring displacements of 0.05 mm. For the software to measure displacement, a random speckle pattern is applied to the membrane surface. The speckle pattern was generated using white spray paint. Only half of the wing was painted to improve the field-of-view and corresponding resolution (symmetry was assumed). Displacement plots were generated for 6° and 18° angles-of-attack. Those angles were chosen as they represent the regions of peak aerodynamic efficiency and high (near maximum) lift coefficient, respectively. Further post-processing of the data, including data smoothing, aerodynamic twist measurements, and lifting-line theory calculations are presented in the next section.
Results and discussion
Experimental force and moment measurements
Three separate tests were performed for each wing. Repeated tests were performed on different days. Figures 9 to 17 plot the median curves and will be discussed in terms of camber, camber location, and frame thickness, respectively.
Plots for CL (top) and CD (bottom) with varying frame camber.
Varying maximum camber
Figures 9 to 11 show the effects of changing maximum camber on aerodynamic forces, efficiencies, and moments, respectively. The dynamic pressure and wing planform area were used to calculate the force and moment coefficients; the chord was also required for the moment coefficient. Uncertainty estimates based on equipment and tunnel parameters are shown as error bars. In the legends for the plots, the first number represents the maximum camber as a percentage. For example, 4504 indicates a maximum camber of 4%. From Figure 9, it is observed that wings with cambered frames exhibit lift advantages of up to 16%, especially at higher angles-of-attack in the stall region when compared to the flat frame. The negative lift coefficient for the flat frame case at zero angle-of-attack is a hysteresis effect of the upward propagation of angle-of-attack during the test. For lower angles-of-attack, drag reductions of up to 40% (at α = 6°) were measured with cambered frames, with the exception of 6% camber frame which produced a similar drag measure as the flat-frame model. At higher angles-of-attack, the 2504 and 4504 frames experienced drag reductions of 10–20% when compared to flat frames, while the 6504 frame experienced similar to slightly higher drag. Increasing frame camber increases lift, particularly at high angle-of-attack with the 6% cambered frames outperforming the rest of the wings. This corresponds to an expected upward and left shift of the lift curve due to cambering.
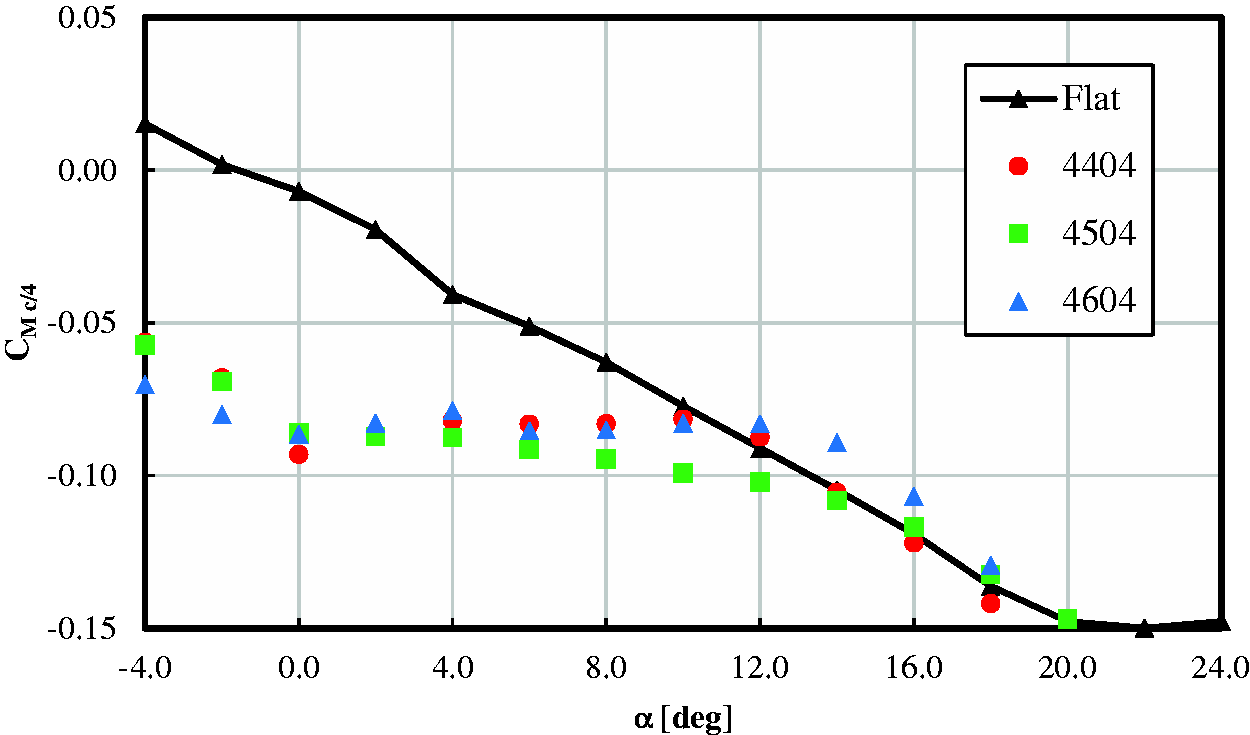
Plots for L/D (top) and CL3/2/CD (bottom) with varying frame camber. Plot for CM,c/4 with varying frame camber.

The L/D ratios, Figure 10, for each of the wings with cambered frames outperformed those of the flat frames by up to 60% with the maximum L/D ratios occurring between 6 and 12°. The ratio CL3/2/CD was also compared, providing an indication of endurance efficiency for a propeller-driven vehicle, as fixed-wing MAVs use a propeller for propulsion. The wings with cambered frames of 6% experience the greatest endurance efficiency at 12°. This is a result of the increased sensitivity with respect to lift. The wings with cambered frames of 2% and 4% camber also outperform the flat frames in endurance by up to 60% at α = 12° and over 200% at α = 2°.
Figure 11 shows that the quarter-chord pitching moments for the wings with cambered frames are more negative than the flat frames and, increasing the frame camber creates a more negative moment. This indicates that the center of pressure of the cambered frames is behind the quarter chord. The pitching moment for the cambered frames stays relatively level for lower angles-of-attack and begins to decrease as the stall region is approached. Thus, the quarter chord for low angles of attack is close to the aerodynamic center for the cambered frames. The decrease in pitching moment in the stall region is more prevalent as camber decreases. Unlike the cambered frame wings, the flat frame displays a negative Cm,c/4 slope. These observations indicate that the aerodynamic center for the flat-frame membrane wing is aft of the quarter chord. Additionally, this negative trend of the flat frame is likely due to the angle-dependent membrane cambering with increasing angle of attack (see time-averaged shape theoretical analysis section for more on additional membrane cambering). The relative cambering of the membrane will be more significant for the flat frame than the membrane frame, thus driving the moment coefficient more negative with angle of attack. While it is expected that the cambered frames also exhibit increased membrane cambering with angle of attack (thus aerodynamic loading), the frame camber decreases this effect as indicated in the moment coefficient curve.
Varying maximum camber location
Figures 12 to 14 show the plots for the case when maximum camber location on the frame is adjusted upstream or downstream. In the legends for the plots, the second number represents the location of the maximum camber as a percentage of chord length measured from the leading edge. For example, 4504 indicates a maximum camber located at 50% of the chord length. Similar to varying maximum camber section, these cambered frames also outperformed the flat frames. While little difference (within uncertainty range) is observed in aerodynamic coefficient plots with respect to maximum camber location in Figure 12, the lift-sensitive endurance plot in Figure 13 displays a decrease in endurance when the maximum camber location is shifted fore or aft of 0.5c by up to 15%.
Plots for CL and CD with varying maximum camber location on frame. Plots for L/D and CL3/2/CD with varying maximum camber location on frame. Plot for CM,c/4 with varying maximum camber location on frame.

Varying frame thickness
Figures 15 to 17 show the resulting plots for the case when frame thickness is changed. In the legends for the plots, the last two numbers represent the thickness of the airfoil as a percentage of the chord. For example, 4504 indicates a frame thickness of 4%. Once again, the cambered frames showed better aerodynamic characteristics than the flat frames. However, Figure 16 shows that the cambered frame with a thickness of 6% had up to 15% lower aerodynamic efficiency when compared with the cambered frame of 4% thickness. The cambered frame of 6% thickness only marginally increased lift, while increasing drag and decreasing L/D and endurance. One concern was whether frame flexibility could account for the measured differences between the 4% and 6% thickness frames. High-speed imaging of the frames, though, showed negligible frame-tip deflection (less than 0.10 in) between the two frames. A possible explanation for the increased drag for the 6% frame could be the increased projected frontal area or increased cavity size underneath the membrane and aft of the leading-edge region. Both would effectively increase the wake size.
Plots for CL and CD with varying frame thickness. Plots for L/D and CL3/2/CD with varying frame thickness.

In summary, the aerodynamic force coefficients from the experimental study indicate that frame cambering had a larger effect than maximum camber location or frame thickness on the AR = 2 membrane wings. Membrane wings with cambered frames displayed greater lift than the flat frame baseline by as much as 16%, particularly at angles-of-attack greater than 10°. Additionally, membrane wings with cambered frames produced less drag than the flat frame baseline with the exception of 6% cambered frame and 6% thickness. Therefore, aerodynamic efficiency and endurance measurements for the membrane wings with cambered frames were superior. From observing moment plots, increasing camber further decreased the pitching moment, and the aerodynamic center is near the quarter chord for all cambered frames.
Time-averaged shape theoretical analysis
To better interpret and understand the force data of earlier section (Experimental force and moment measurements), time-averaged shapes of the membrane wings were acquired. The time-averaged shapes were used as part of a lifting-line analysis to estimate lift and induced drag. The time-averaged shapes were acquired for specimens at 6° and 18°, corresponding to regions of high aerodynamic efficiency and approaching stall conditions, respectively.
As mentioned in Digital image correlation section, a DIC camera system was used for acquiring displacement matrices. The resulting displacement plots were averaged over time and used for a theoretical, lifting-line analysis. The lifting-line analysis used in this study is outlined by Bertin and Smith. 12 Lifting-line theory considers effects from the local circulation, local chord length, local geometric angle of attack, and zero-lift angle-of-attack. Based on the Kutta-Joukowski theorem, the lift on an airfoil section of a wing is a function of the bound circulation. However, lift distribution, and hence spanwise circulation distribution, is not constant over a wing of finite span.
An in-house code was developed and used to estimate the lift coefficient based on the time-averaged membrane shape. The basic structure of the code is detailed in Figure 18. First, the code imported the time-averaged displacement matrices. Next, at each spanwise location, a third-degree polynomial fit of the chordwise displacement was calculated, effectively smoothing the data and reducing noise near the trailing edge. Figure 19 qualitatively illustrates typical trailing-edge displacement noise reduction due to the polynomial smoothing process. Finally, a correction was applied to level the frame to eliminate the offset slope between the original DIC coordinate system and the wing-body coordinate system.
Plot for CM,c/4 with varying frame thickness. Flow diagram of the lifting-line code structure. Effect of third degree polynomial fit on the trailing edge on the NACA 4504 frame.


The code incorporated the monoplane equation to compute aerodynamic coefficients using 100 sections evenly spaced across the span, although results typically converged with less than 10 iterations (A coefficients). As φ changes with spanwise location, both the geometric twist (local airfoil twist relative to the root chord, due to membrane trailing-edge deflection) and aerodynamic twist (local airfoil zero-lift angle-of-attack, due to membrane cambering) change due to the membrane deflection. The chord length is also spanwise dependent due to trailing-edge scalloping, as shown in Figure 20. Figure 21 illustrates the flow chart for the section of the code employing the lifting-line analysis. In the time-averaged deformation plots, note that the coordinate access has shifted from the wind tunnel coordinates to wing coordinates. For example, the leading edge is located at x/c = 1, and z/c refers to the out-of-plane displacement of the membrane wing.
Local chord and effective angle-of-attack. Lifting-line analysis flow chart where the spanwise circulation is represented by a sine series of strength, Ai, distributed along the span, Φ.

Figure 22 shows the theoretical and experimental results for the 2504, 4504, and 6504 at an angle-of-attack of 6° where the aerodynamic efficiency is high. With the exception of the membrane wing 6504 frame, the theory reasonably approximates (∼10% lower) the lift coefficient at 6° angle-of-attack. Membrane displacement is shown in Figure 23. On the left is a side profile, where the color represents the relative displacement to the chord, z/c. On the right is a planform contour plot of the displacement using the same color scale. From observing the time-averaged shapes at this angle-of-attack in Figure 23, the membrane wing with the 6504 frame has noticeably more membrane displacement near the leading edge compared to the 2504 and 4504 wings, creating a region of local negative camber near the leading-edge. Maximum membrane displacement relative to the chord line is observed near the trailing edge at the maximum scallop location for each of the 6° cases. Displacements at this location were 0.09, 0.08, and 0.08 z/c for the 2504, 4504, and 6504 wings, respectively. Despite the smoothing efforts, the contours in Figure 23, especially the 6504 case, show some spatial waviness and discontinuities. This is potentially an effect of the chordwise fitting routine. An estimated uncertainty of for the displacement measurements based on the fitting technique and DIC resolution is ±0.01 z/c. At low angles-of-attack and hence low aerodynamic loading, there is substantial trailing edge variance in the raw deflection data. This could lead to disproportional weighting of the fit. Thus, a global surface fit could improve the smoothing process. At the higher angle-of-attack case (Figure 25), and hence increased angle dynamic loading, these effects are diminished.
Lift coefficient at 6°. Time-averaged shapes at 6° (side view on left, top view on right). From top to bottom: 2504, 4504, 6504. Flow is from right to left (TE = 0, LE = 1). Red indicates more deflection (as indicated by the z/c value on the left), while blue indicates little to no deflection.

The results at 18° near the maximum lift coefficient, shown in Figure 24, were similarly consistent between theory and experiment across all three wing cambers, with the largest difference of 5% over-prediction of the 6504 wing. Figure 25 displays the time-averaged shapes for this condition. Maximum membrane displacement relative to the chord line is observed near the trailing edge at the maximum scallop location for the 2504 (0.10 z/c) and 6504 (0.14 z/c) cases. However, the 4504 had a maximum displacement closer to the mid-chord point at approximately 0.06 z/c.
Lift coefficient at 18°. Time-averaged shapes at 18° (side view on left, top view on right). From top to bottom: 2504, 4504, 6504. Flow is from right to left.

The results for the theoretical lift coefficient indicate that using lifting-line theory for analysis of the measured time-averaged shapes for membrane wings is a reasonable first-order method for approximating lift for those wings despite the limiting assumptions of high Re, attached and steady flow. This shows the importance of the bound vorticity of the wings relative to the time-averaged shape. Issues do exist; in the 6504 case (Figure 23, bottom left), large membrane displacements and complex cambering likely contributed to the large over-prediction of CL. Additionally, membrane vibration plays an important role. As discussed by Rojratsirikul et al. 6 and Zhang et al., 8 membrane vibration energizes the shear layer above the wing and decreases the effects of flow separation, especially at higher angles of attack.
Frame camber has a noticeable effect on membrane camber. This is apparent by viewing the membrane wing side views shown in Figure 26. In the plots, the green line represents an adjusted chord line that spans from the leading edge of the wing to the trailing edge of the membrane scallop. The blue line represents the time- and spanwise-averaged membrane shape. The distance between the adjusted chord line and the maximum membrane displacement location normal to the adjusted chord line, (a) Time-averaged and spanwise-averaged shape side views for membrane wings from top to bottom: flat and 2504 airfoils. Flow is from right to left (TE = 0 and LE = 1). The blue line is the time- and spanwise membran shape and the green line is adjusted chord line. (b) Time-averaged and spanwise-averaged shape side views for membrane wings from top to bottom: 4504 and 6504 airfoils. Flow is from right to left. CL,max vs. additional membrane camber.

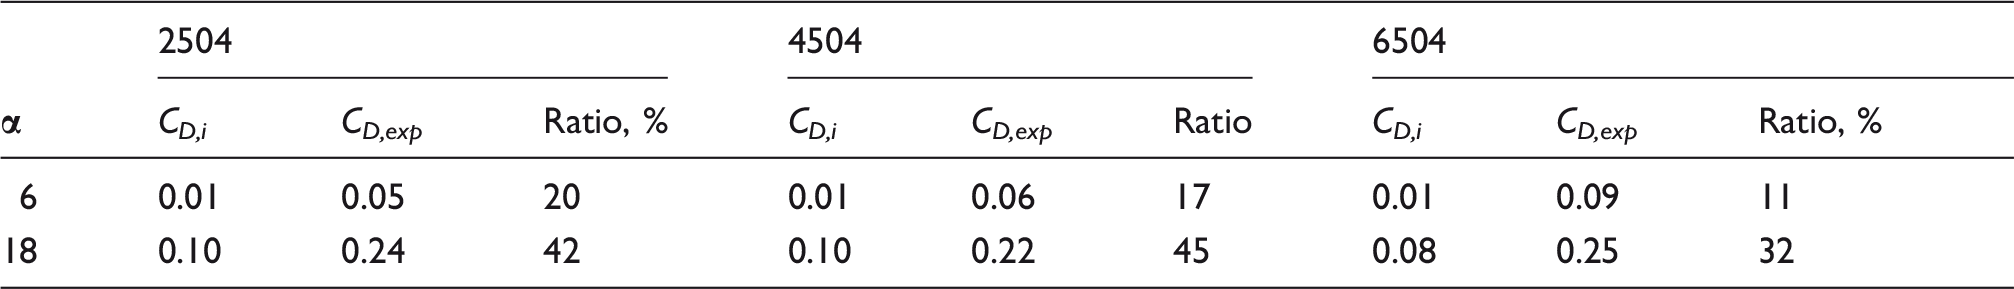
Induced drag calculations.
Conclusions
In this study, low aspect ratio, flexible MAV wings with cambered and flat frames were designed, fabricated, and tested to determine whether cambered frames provide membrane wings with aerodynamic advantages when compared to those with flat frames. The frames were modeled in SolidWorks and constructed using an Objet30 Pro 3D printer with an aspect ratio of 2. The membranes were composed of a silicone rubber material. The wings were tested in a low-speed wind tunnel at a Reynolds number of ∼50,000 (10 m/s) while varying angles-of-attack from −4 to 24°. A six-component load cell was used to gather force and moment measurements. From the force and moment measurements, plots were developed for lift, drag, efficiency, and pitching moment coefficients vs. angle-of-attack. By analyzing the resulting plots for aerodynamic forces and moments, the following conclusions are made about the AR = 2 membrane wings:
Varying frame camber had a larger effect on the aerodynamic coefficients than varying maximum camber location or frame thickness. At angles-of-attack greater than 10°, as the lift curve slope starts to decrease, all of the membrane wings with cambered frames displayed greater lift than that of a flat frame baseline. With the exception of the 6% cambered frame and 6% thickness, the membrane wings with cambered frames produced up to 16% more lift and 10–20% less drag than the flat frame baseline. L/D and endurance measurements for the membrane wings with cambered frames were superior to that of the flat frame by up to 60%. With frame camber, the aerodynamic center is near the quarter chord. Increasing frame camber causes the quarter-chord pitching moment to become more negative. Without frame camber, the membrane wing’s aerodynamic center is aft of the quarter chord.
In addition to the aerodynamic force measurements, a DIC camera system was used to acquire time-averaged shapes for the membrane wings during wind tunnel tests. The wings were mounted at angles-of-attack of 6° and 18° to represent the regions of maximum efficiency and approaching stall, respectively. Lifting-line theory was applied to the time-averaged shape to calculate theoretical lift and induced drag coefficients. The calculations required inputs such as the local chord length and geometric twist which were determined from the geometry of time-averaged shapes. From the analysis of the time-averaged shapes, the following conclusions are made:
Applying lifting-line theory to time-averaged shapes of membrane wings does a reasonably good job of approximating lift coefficients and capturing the effects of bound vorticity despite the low Re, low AR environment. Theoretical calculations were within 5–10% of measured values. One exception was when considerable local negative cambering was present near the leading edge. Based on DIC measurements, increasing frame camber results in increased aero-induced membrane camber relative to the adjusted chord line and thus assists in increasing the maximum lift coefficient. The induced drag is a smaller contributor to the total drag (11–20%) at lower angles of attack associated with high aerodynamic efficiency. As the total drag increases with angle of attack, the relative induced drag contribution (32–42%) increases near maximum lift conditions. Increasing the wing camber lowered the induced drag contribution to the total drag.
Footnotes
Declaration of conflicting interests
The author(s) declared no potential conflicts of interest with respect to the research, authorship, and/or publication of this article.
Funding
The author(s) disclosed receipt of the following financial support for the research, authorship, and/or publication of this article: The authors would like to offer a special thanks to the National Science Foundation REU grant number 1358991 for making this research possible.