
Abstract
Hot fire tests were performed using a single-injector research combustor featuring a large optical access window (
Keywords
Introduction
Liquid propellant rocket engines (LPREs) are a key technology for space launchers world wide. The liquid oxygen–hydrogen (LOX/H
Due to its direct influence on flame anchoring, combustion stability, system pressure and overall performance, the injector design is a crucial element in the development of LPREs. The velocity ratio (
Sub-scale experiments can also be used to assess the thermoacoustic stability characteristics of a particular injector design.20,21 Thermoacoustic instabilities are caused by the coupling of oscillating heat release rate (
A more straightforward approach to assessing the Rayleigh criterion is the direct extraction of
The DLR optically accessible rocket combustor model ‘N’ (BKN) addresses the aforementioned need for validation test cases and enables multiple opportunities for validation. The experiment is extensively equipped with conventional diagnostics, such as thermocouples and pressure sensors and is, therefore, able to provide well-defined boundary conditions, which can be compared to steady-state simulations or time-averaged results of unsteady simulations. The same applies to the large optical access window enabling the examination of a great portion of the flame and providing information on the steady-state flame topology. A time-resolved comparison between experiment and unsteady simulations can be performed by comparing the acoustic amplitudes or sequences of flame snapshots, as well as via qualitative comparison of thermoacoustic interaction facilitated by the 2D Rayleigh Index distributions under different sets of operating conditions presented later in this article.
This work presents experiments with BKN and the propellant combination of LOX and compressed-/liquefied-natural-gas (CNG/LNG) and a comparison with previous experiments with the same injection element but hydrogen (H
First, the experimental setup including the optical diagnostics and operating conditions will be presented for the latest experiments with LOX/CNG/LNG. Then, the methodology of the performed analysis will be described. The influence of four LOX/LNG operating conditions on the flame topology will be shown and discussed in comparison to previous LOX/CNG and LOX/H
Combustion chamber
The hot-fire tests with BKN presented in this work were conducted at the European Research and Technology Test Facility P8
28
for cryogenic rocket engines. The experimental hardware consists of a single-element injector head, an optical combustion chamber segment with 50 mm diameter, additional chamber segments, and a convergent divergent nozzle with a throat diameter (
Experimental combustor model ‘N’ (BKN) configuration.
In order to provide an extensive set of boundary conditions, at least one temperature, static pressure and unsteady pressure measurement is made in the manifolds for LOX (
LOX and LNG are injected through a shear coaxial injection element with a tapered LOX post. A cooling film of CNG reducing the heat load to the windows is injected via an annular gap between the chamber wall and faceplate. Both injection systems are illustrated in Figure 2. The dimensions of the injection system are given in Table 1. Combustion was initialised via a torch igniter.
Injection system configuration. 14
Geometrical dimensions of injection systems.
Visualization of the flame within the ultraviolet (UV) and blue wavelength regimes (BR) was carried out using two synchronously and coaxially recording high-speed camera systems. The UV regime is dominated by the intense radiation from the OH* radical with its intense emission bands around 310 nm. The excited H
The blue flame emission was recorded by a Photron® Fastcam SA-Z type 2100K-M-64G camera model. Its proprietary design advanced CMOS image sensor has an active area of 20.48
UV radiation (OH*) was recorded using an image intensified Photron® Fastcam SA-X2 type 480K-M4 high-speed camera, also equipped with an identical proprietary design advanced CMOS image sensor. Frame rates of 7200–20,000 Hz were applied. The UV radiation was converted into visible light using a Hamamatsu® image intensifier, model C10880 GHD1101, which was attached to the camera’s lens mount. Gate width and gain were set for optimal image quality. A Nikon® UV-Nikkor f = 105 mm lens with an aperture of 4.5 was used, equipped with a UV bandpass filter (CWL: 306.8 nm; FWHM: 10 nm; T(306.8 nm): 64%).
Operating conditions
In the most recent campaign tests with BKN and the propellant combination LOX/CNG/LNG were conducted at chamber pressures from 41 up to 66 bar and ratios of oxidiser to fuel (ROF
The test runs are presented in Figure 3. The test sequences are described with traces of the static chamber pressure
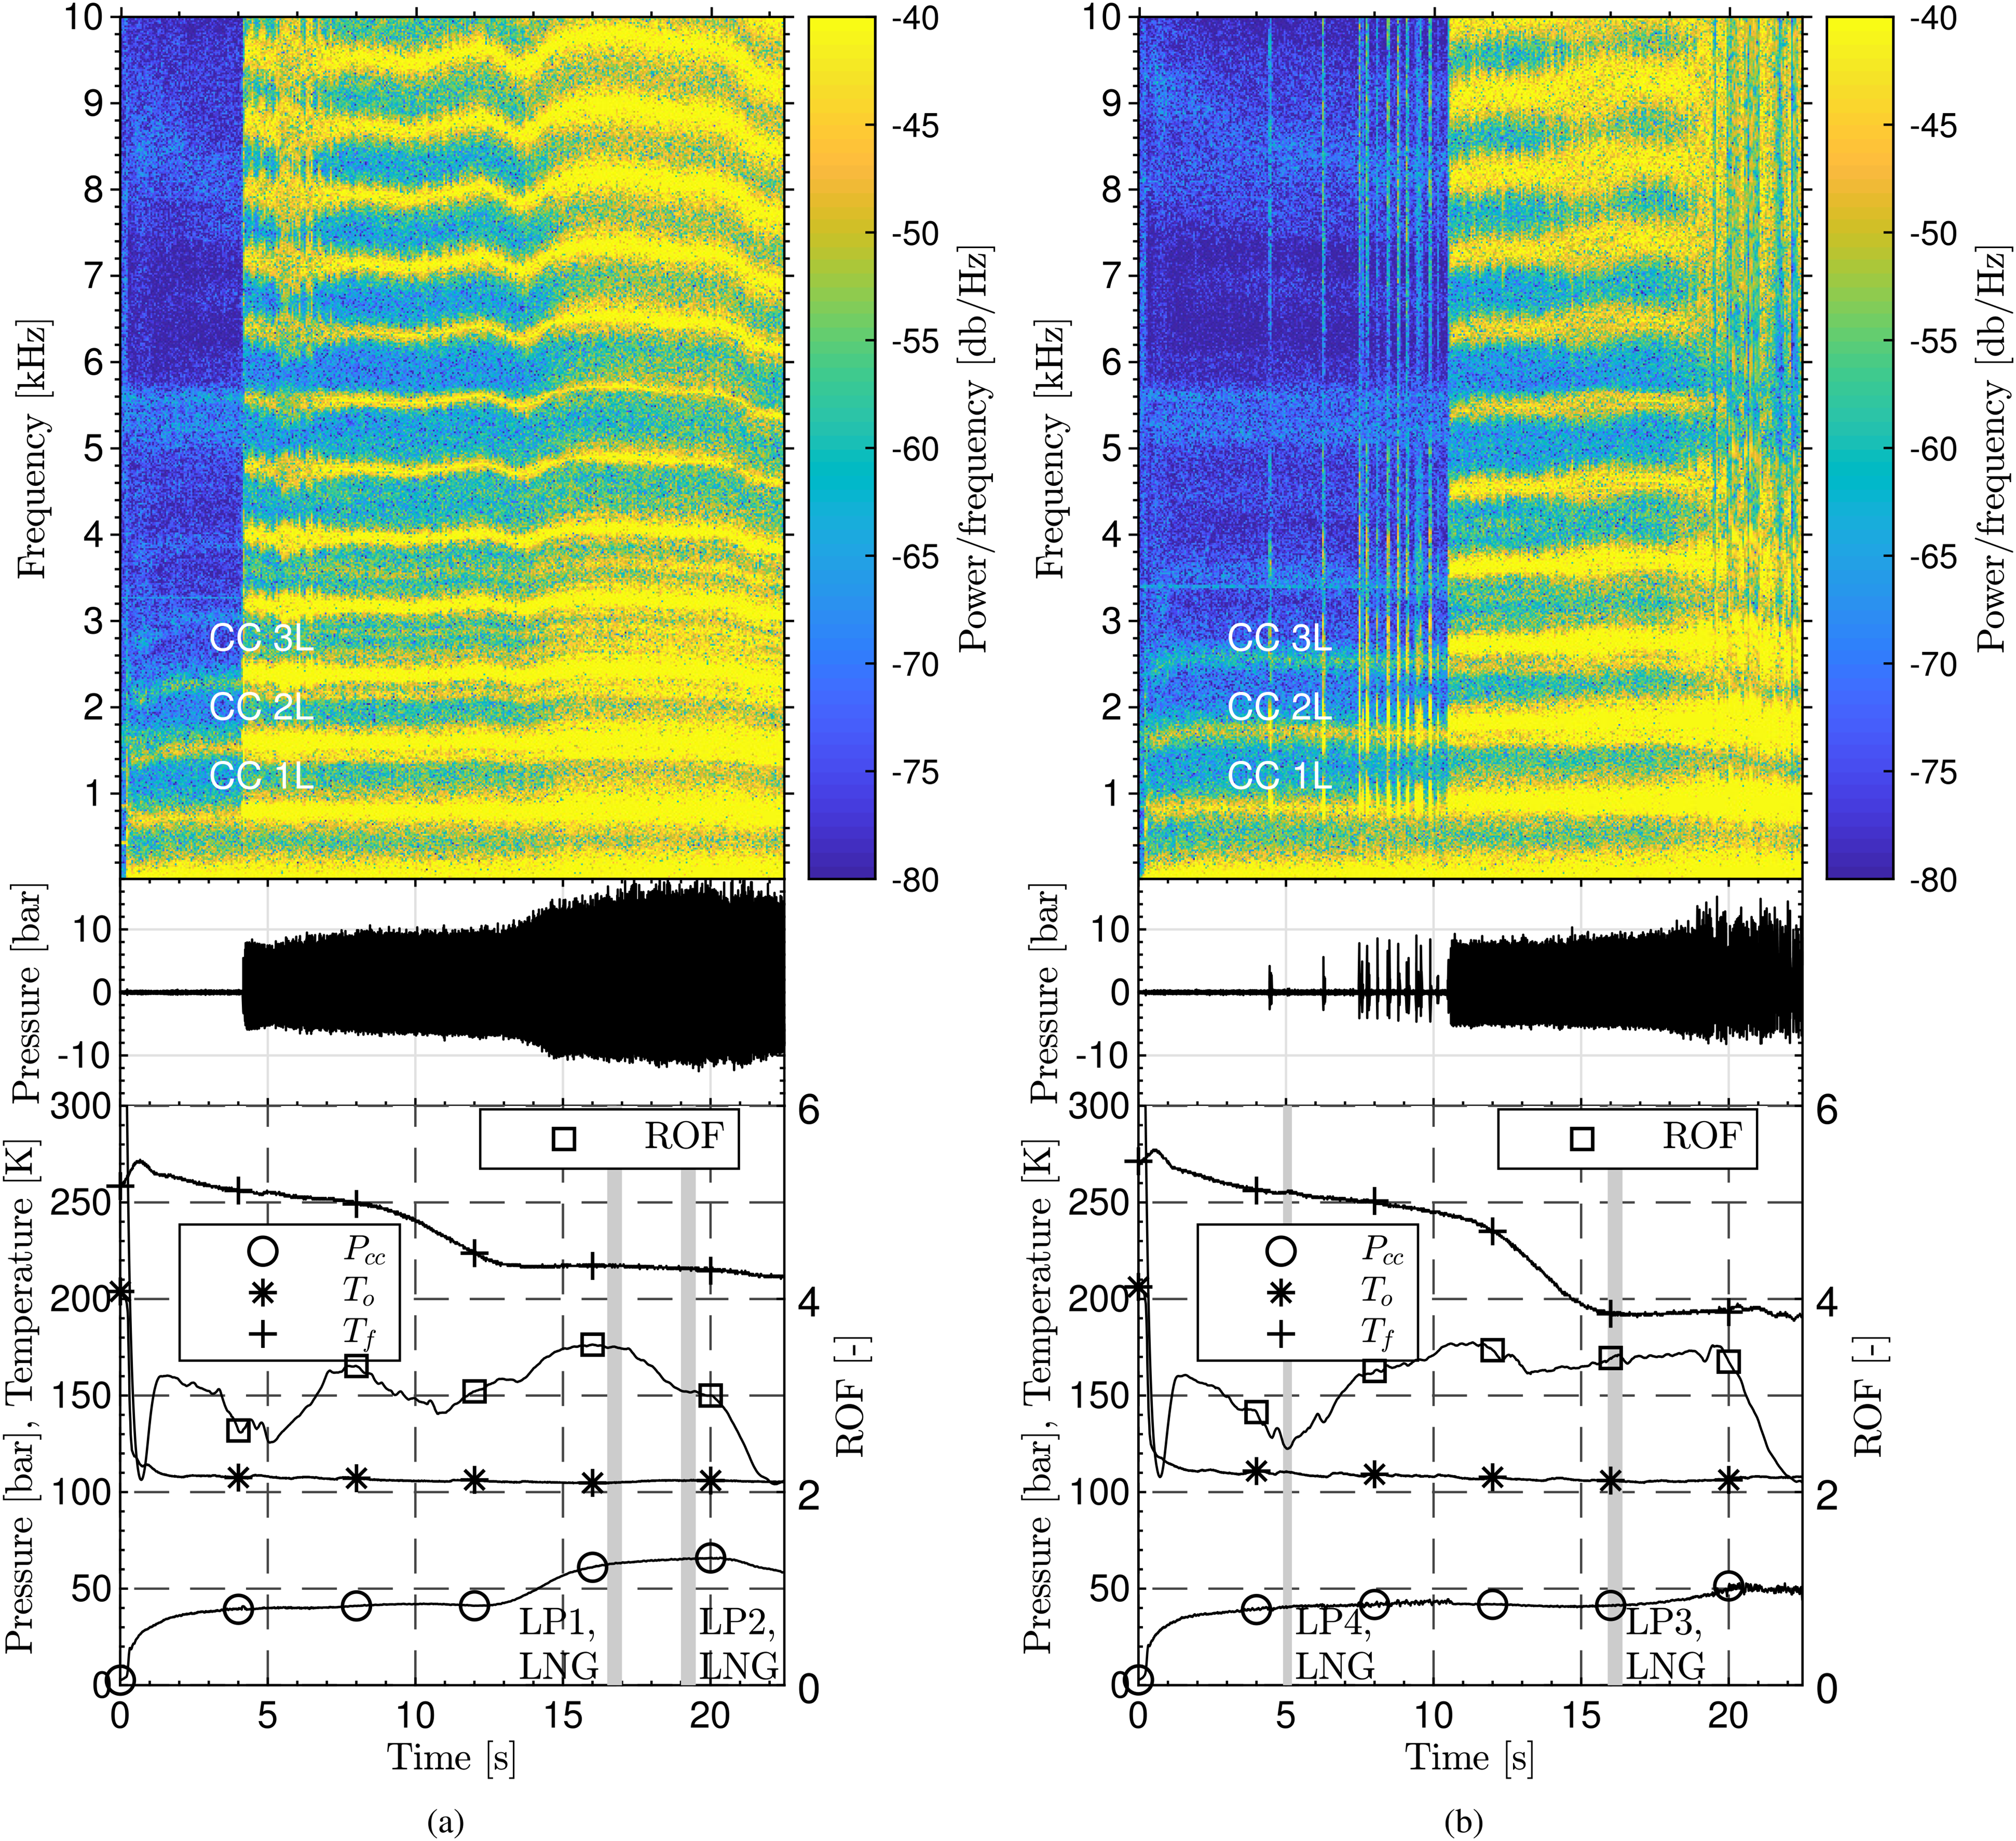
Sequence of tests with operating conditions and grey highlighted interval used for extracting the data for all load points. (a) Test 1; (b) Test 2.
Both test runs develop high amplitude combustion instabilities characterised by excitation of the chamber longitudinal resonance modes. Table 2 summarises the steady-state test condition and the injection conditions for all four load points. The data are mean values from a sample period of 0.5/0.3 s. Since the data from these four operating conditions will later be compared to data from previous tests, these are depicted as LNG LPs. This indicates that LNG was used with CNG to regulate the fuel injection temperature, while in previous tests solely CNG or cold gaseous hydrogen were used.
Steady state and injection conditions for all four load points from the LOX/CNG/LNG tests.
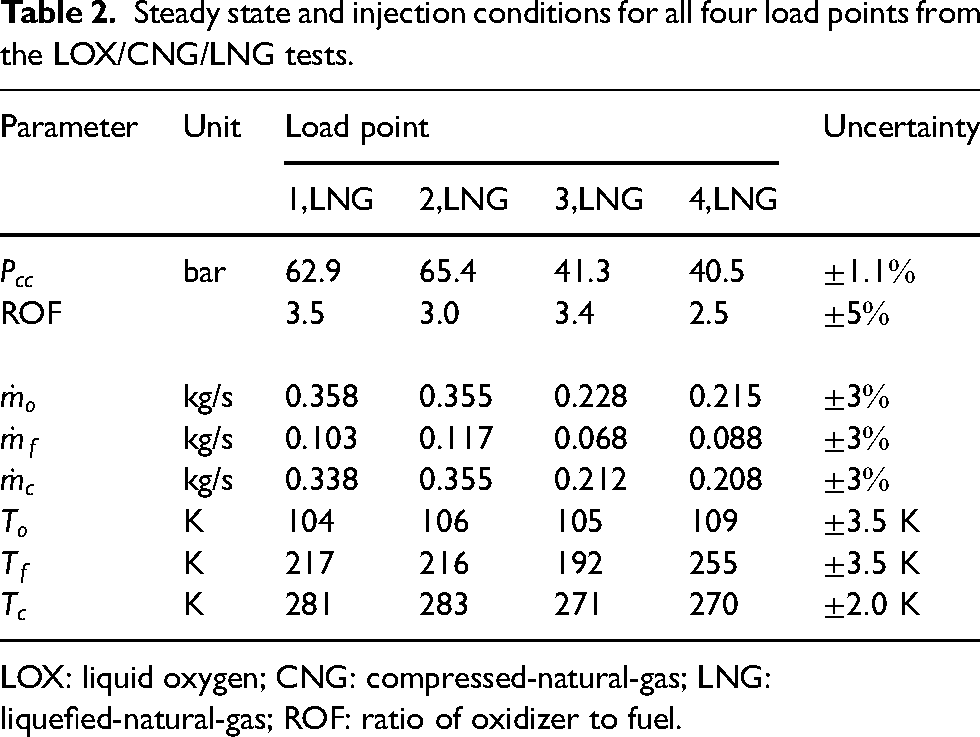
LOX: liquid oxygen; CNG: compressed-natural-gas; LNG: liquefied-natural-gas; ROF: ratio of oxidizer to fuel.
Flame topology analysis
The flame opening angle, flame width and flame length were measured within the framework of the flame topology analysis. For the flame opening angle, a threshold-based flame boundary detection algorithm 14 was applied to a time-averaged image of the corresponding LP. A linear fit to the boundaries of the detected flame was performed in the first 6% of the flame’s optically accessible length, which enabled the derivation of a flame opening angle. For the determination of the flame width, the mean values of each row and for the flame length mean values of each column were calculated. In this case, 75% of the peak intensity from the time-averaged OH* and blue radiation images was used to define the flame width at the three-quarter maximum (FlW34M) and the flame length at the three-quarter maximum (FlL34M). It should be noted that in the latter case only the downstream limitation of the intensity at the three-quarter maximum has been considered.
Flame dynamics analysis
The dynamic mode decomposition (DMD) was applied to isolate the underlying dynamics in the data with respect to its frequencies. The slightly adapted implementation of a multi-variable DMD 22 enables a direct analysis of the high-speed imaging in relation to measurements from various sensors. Therefore, the sensor data is resampled to the snapshots of high-speed imaging and added as pseudo-pixels to the input matrix of the DMD algorithm. The algorithm decomposes the data into three matrices. One containing the spatial data, the second containing the amplitudes and the third the temporal data of each mode. The matrix containing the spatial data of each mode is divided again into the imaging and sensor data. Thus each type of measurement can be treated individually, but is filtered to modes containing the same frequency content.
The decomposed pressure oscillations gained from the DMD can be compared to bandpass filtered data with a narrow filter width and are used to reconstruct the pressure field in the chamber. The axial pressure distribution and thus the pressure field in the window region is interpolated by a spline-interpolation method. Combining both (intensity and pressure) reconstructions, a 2D Rayleigh Index via equation (2) for each (or multiple) frequencies referring to the decomposed mode(s) 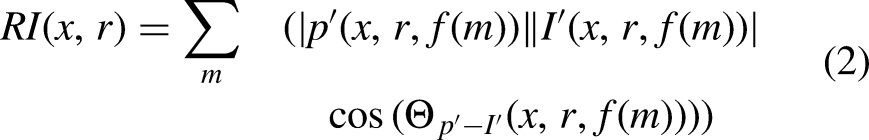

Flame characteristics
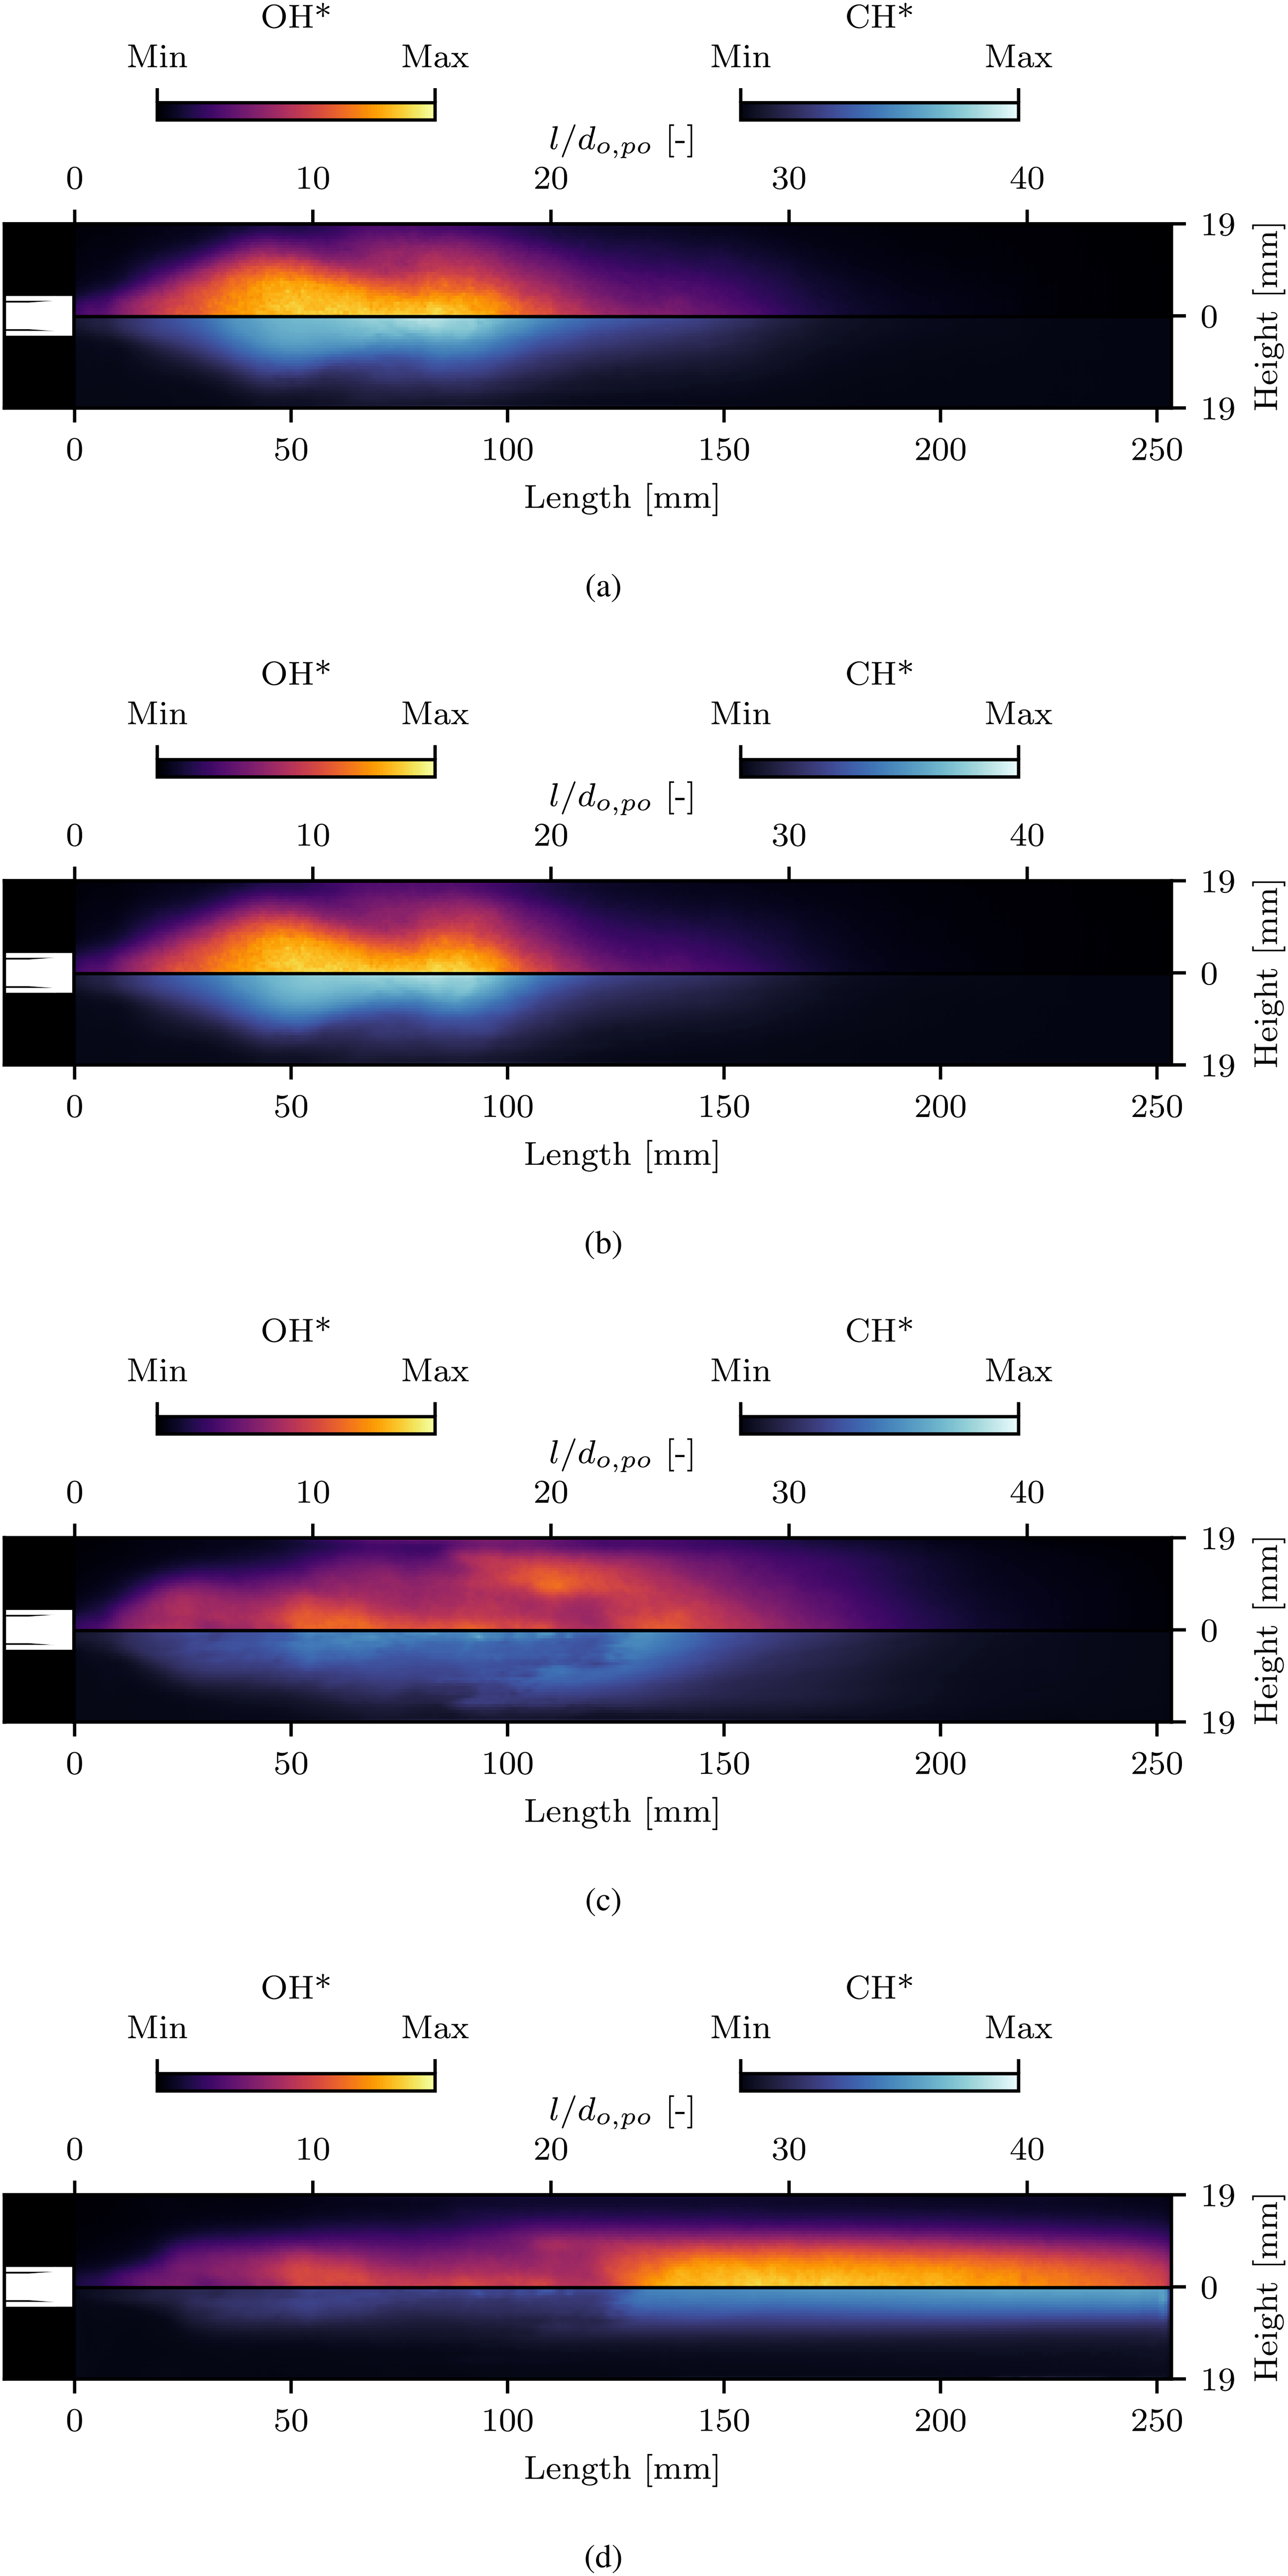
First, the flame visualisations will be shown for the four LPs with the propellant combination of LOX/LNG. The instantaneous flame radiation measurements of the first recorded frame in each LP (Figure 4(a) to (d)) show the OH* imaging on the top and the CH* imaging at the bottom. The CH* radiation displays the same half of the flame as the OH* radiation but mirrored.
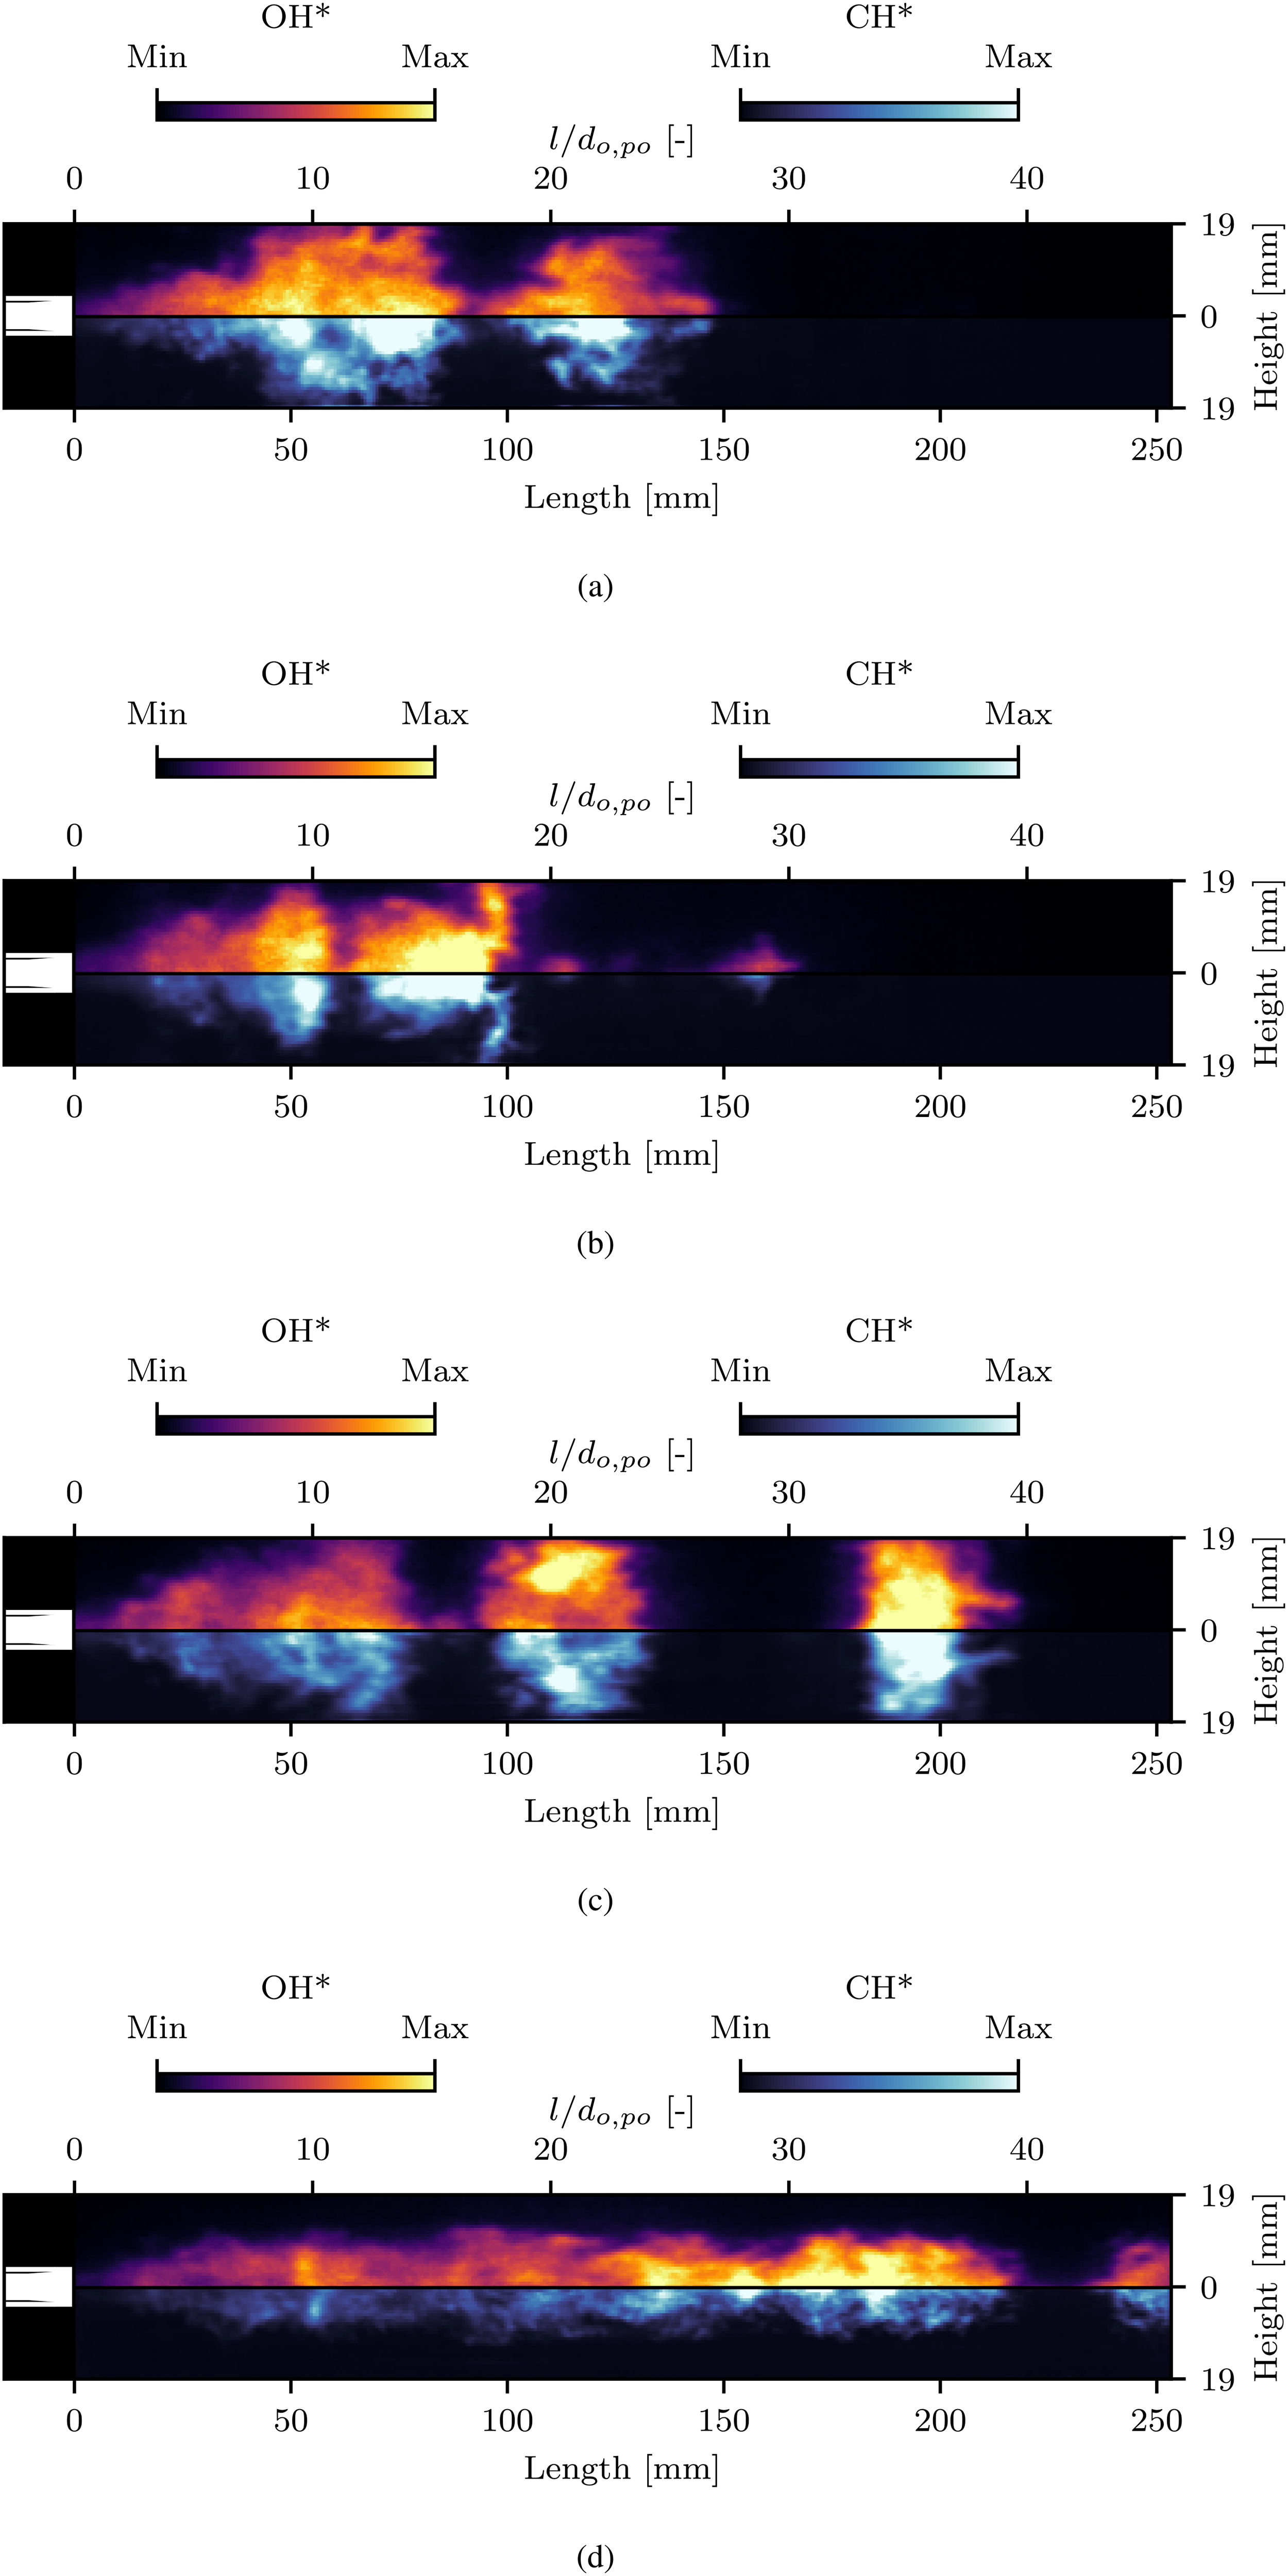
Instantaneous flame radiation imaging (OH*/CH*) (a) LP1,LNG; (b) LP2,LNG; (c) LP3,LNG; (d) LP4,LNG. LP: load point; LNG: liquefied-natural-gas.
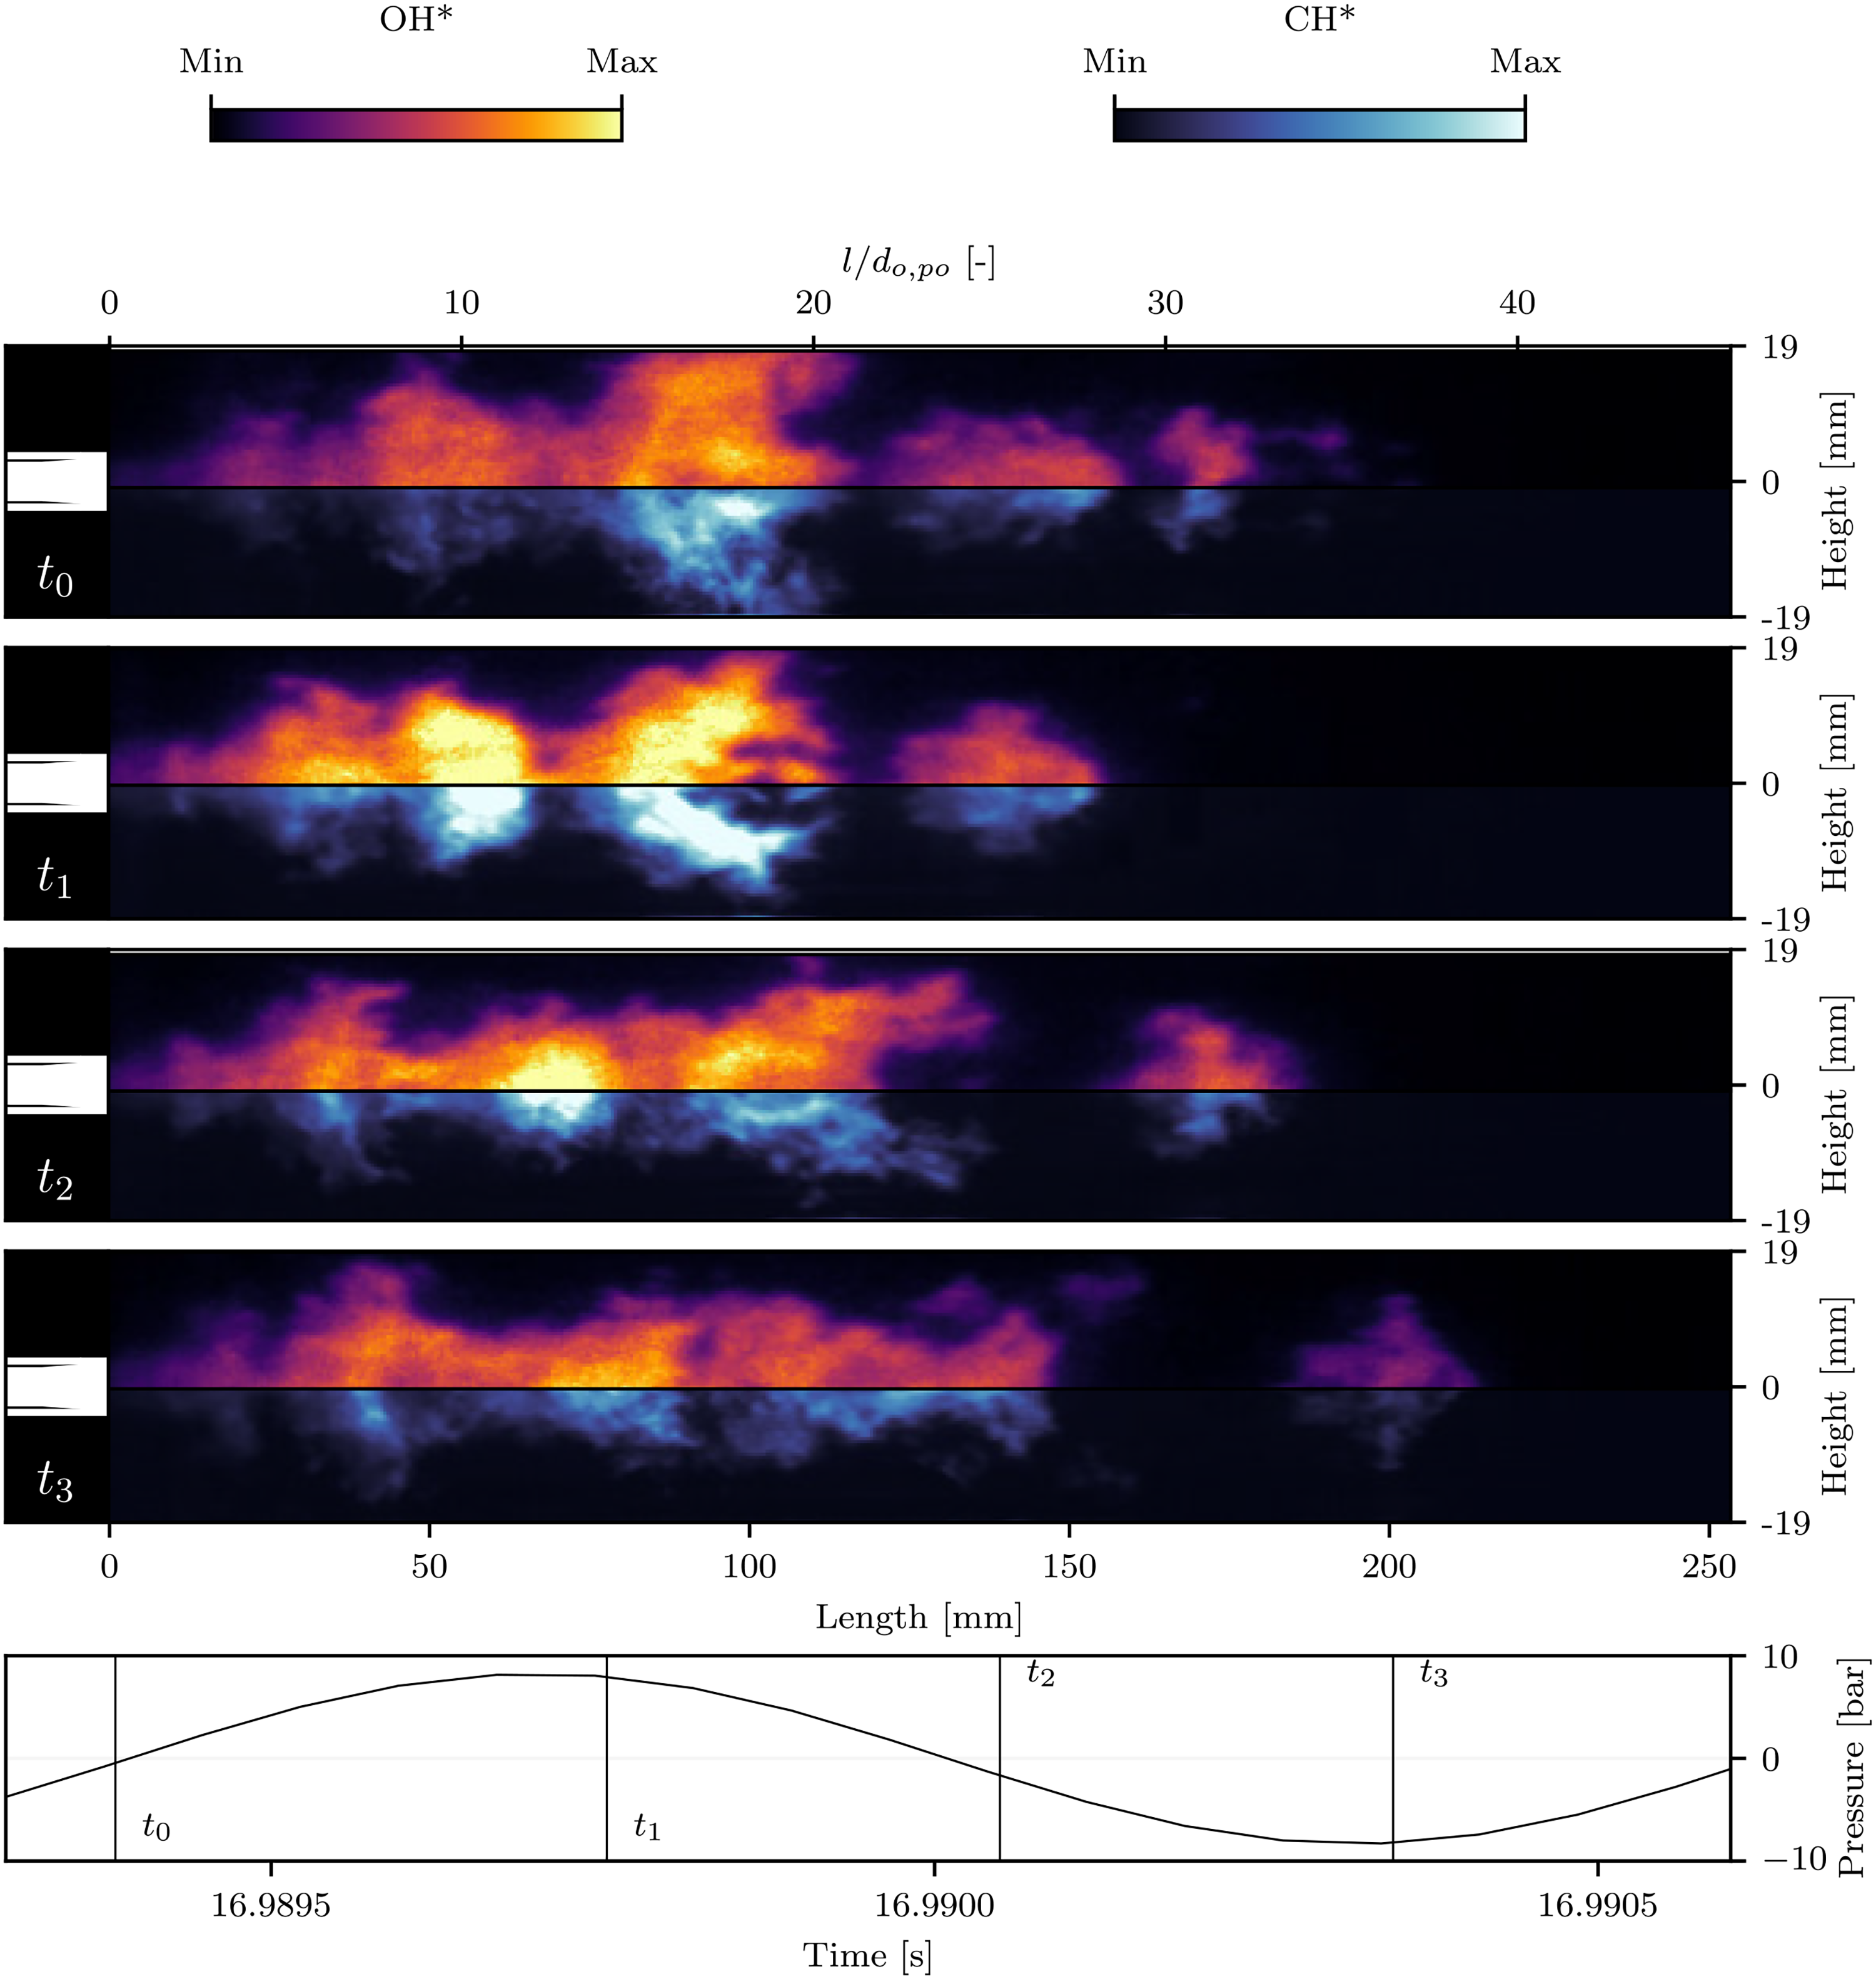
Sequence of instantaneous flame radiation snapshot (OH*/CH*) with respect to bandpass-filtered (at 1L frequency) unsteady pressure
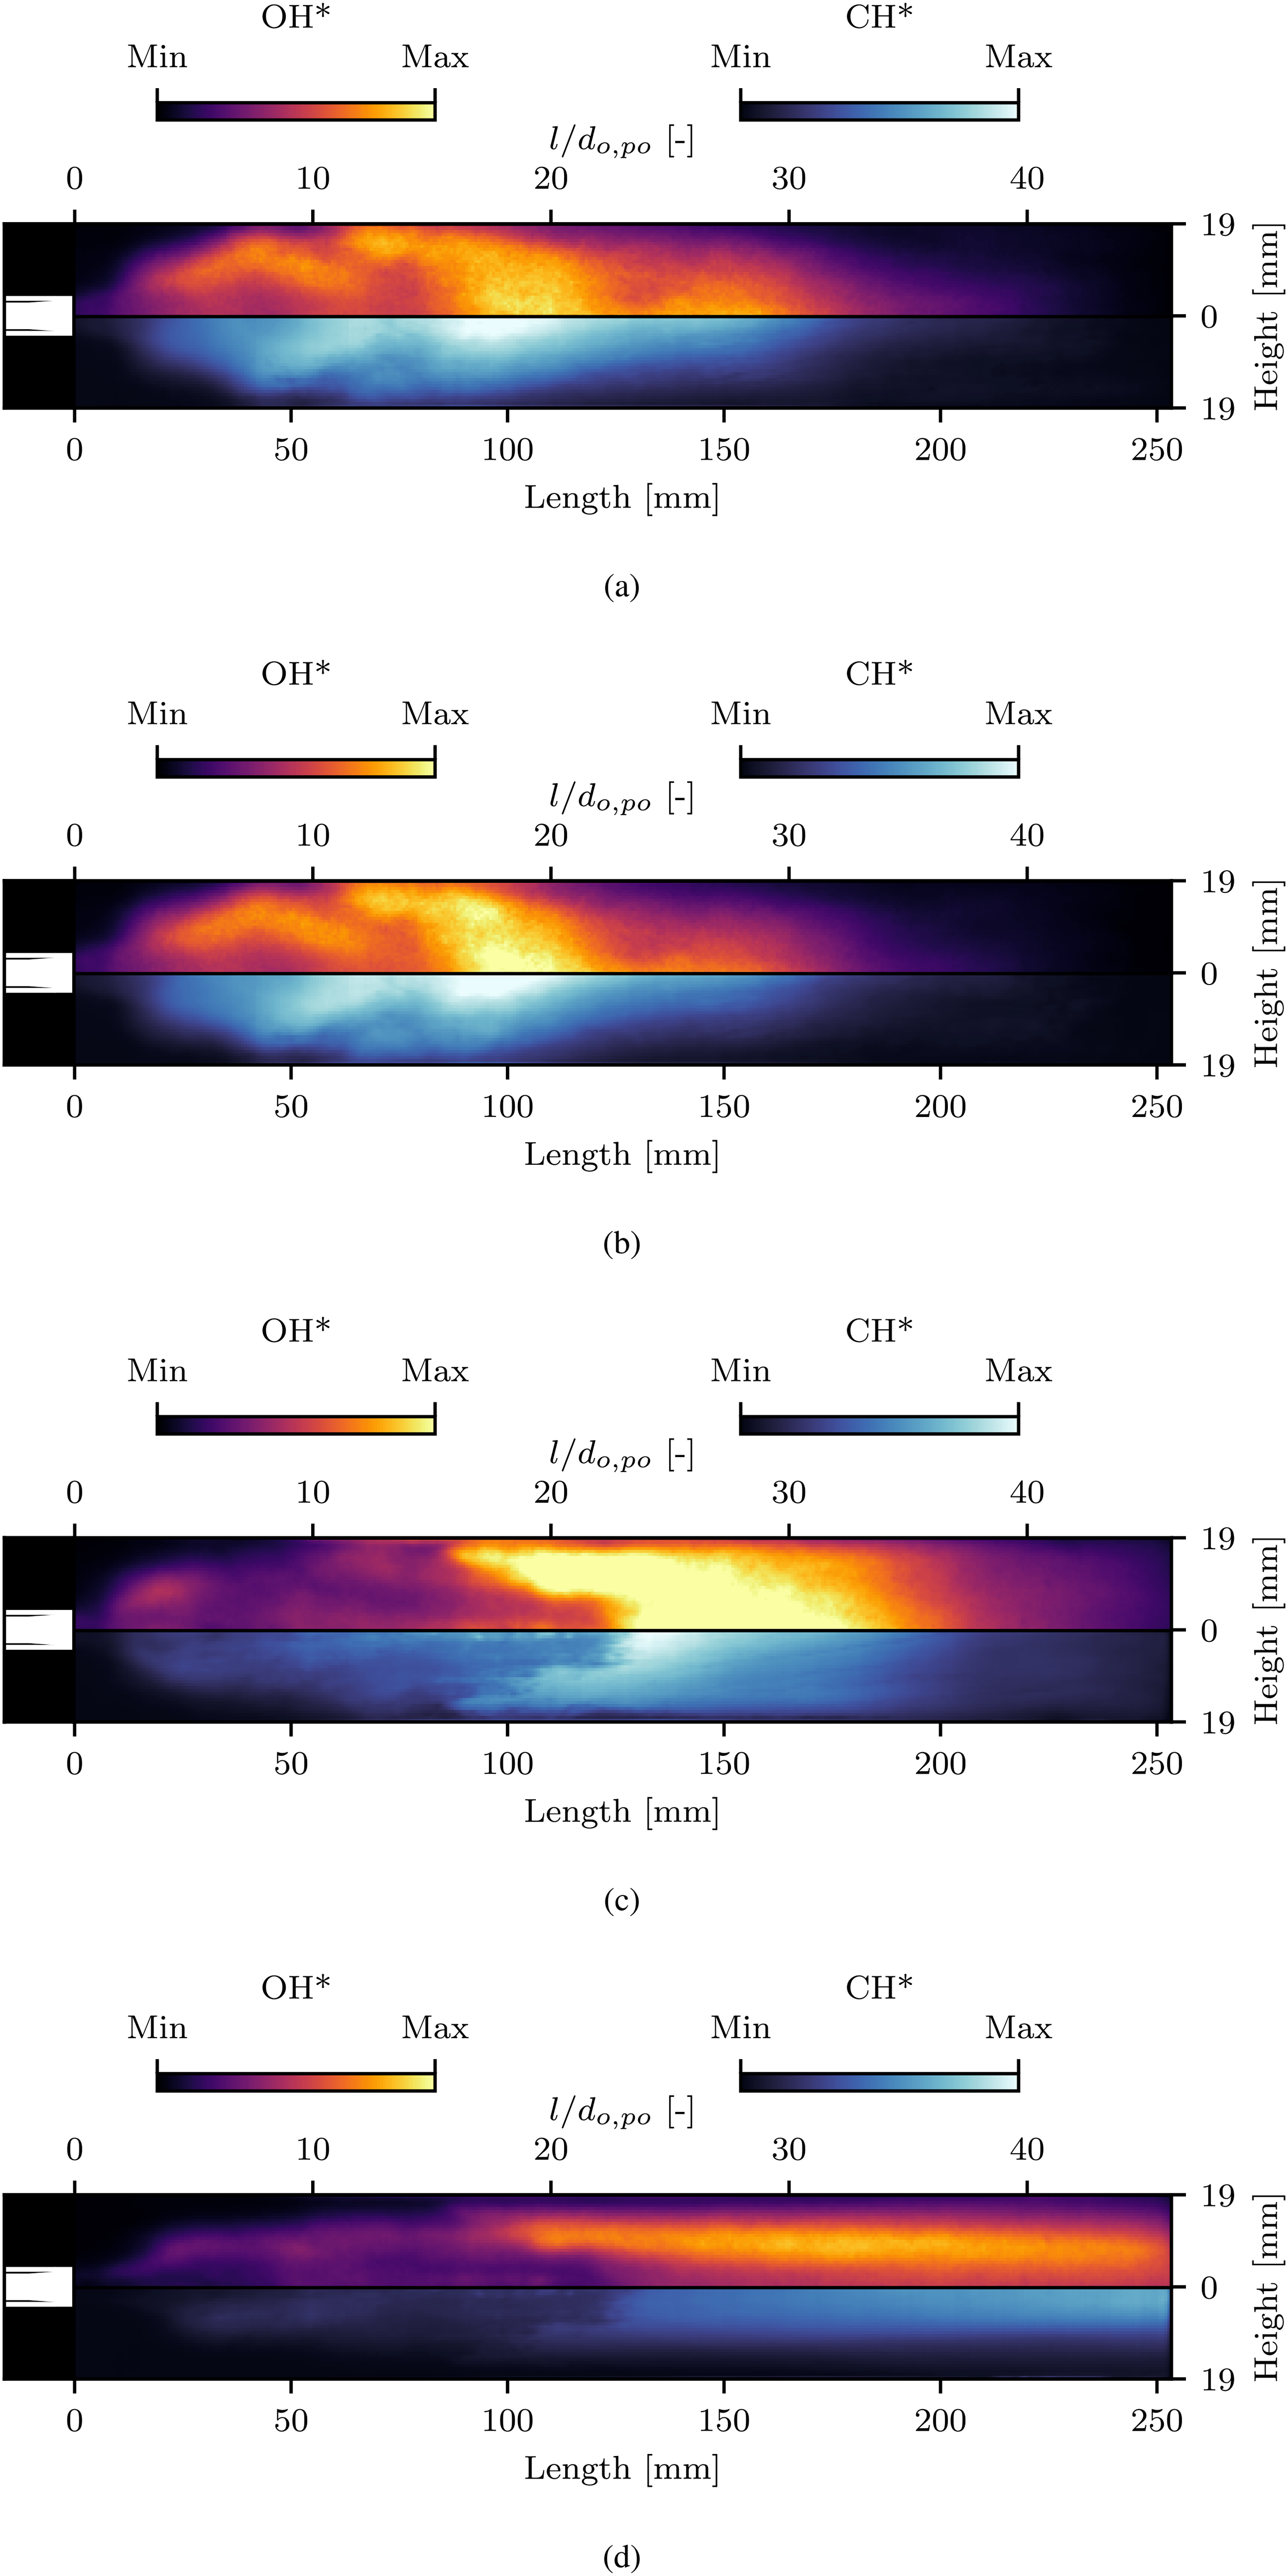
Time-averaged flame radiation imaging (OH*/CH*) (a) LP1,LNG; (b) LP2,LNG; (c) LP3,LNG; (d) LP4,LNG. LP: load point; LNG: liquefied-natural-gas.
The first three LNG LPs are dominated by high-amplitude longitudinal combustion instabilities. This is reflected in the flame radiation imaging, with the high-speed image sequences describing a violent longitudinal pulsation of the flame, undergoing stretching and compression due to entrainment in the acoustic velocity field. The instantaneous snapshots show a significantly shorter flame compared to stable conditions in LP4,LNG. Moreover, the flames are interrupted through their pulsating motion, being pinched and separated into large pockets of combusting propellants from around 60 to 90 mm downstream. Figure 5 visualises this pulsating motion via a sequence of instantaneous snapshots within one acoustic pressure cycle for LP1,LNG. The snapshot at
The time-averaged flame images of the three unstable LPs (Figure 6(a) to (c)) also show the shorter flame in comparison to LP4,LNG (Figure 6(d)). The average images for LP3,LNG and LP4,LNG (Figure 6(c)/(d)) suffer from regions of reduced intensity within the flame around 90–140 mm downstream due to soot deposition onto the surface of the quartz window. The soot contamination affects the CH* radiation intensity more than OH*. The soot contamination is also visible for LP3,LNG and LP4,LNG in Figure 7 illustrating the standard deviation of each pixel. However, differences in the fluctuating radiation intensity between the unstable LP3,LNG and LP4,LNG are still detectable. The OH* radiation measurements for LP3,LNG feature a broad and highly fluctuating intensity within the flame region. LP4,LNG is characterised by weaker OH* fluctuations limited to the shear layer throughout the flame. The comparison between the UV and BR measurements generally emphasises the high self-absorption of OH* radiation. While the OH* measurements mainly fluctuate in the shear layer of the flame high-intensity CH* fluctuations are also taking place towards the centre of the flame. This, again, shows that radiation measurements covering the blue wavelengths are better suited as a marker estimating the line-of-sight integrated heat release rate.
Standard deviation images of flame radiation (OH*/CH*) (a) LP1,LNG; (b) LP2,LNG; (c) LP3,LNG; (d) LP4,LNG. LP: load point; LNG: liquefied-natural-gas.
Figure 8 visualises a sequence of phase-averaged images over LP1,LNG within one acoustic pressure cycle. Generally, the phase-averaged images provide the same information as the previously shown sequence of snapshots. But it can be also seen that the process and location of separation into large pockets of combusting propellants varies slightly within each cycle. In contrast to the sequence of instantaneous snapshots, a low level of averaged intensity can be noticed at locations where in Figure 5, a clear break in the flame is seen.
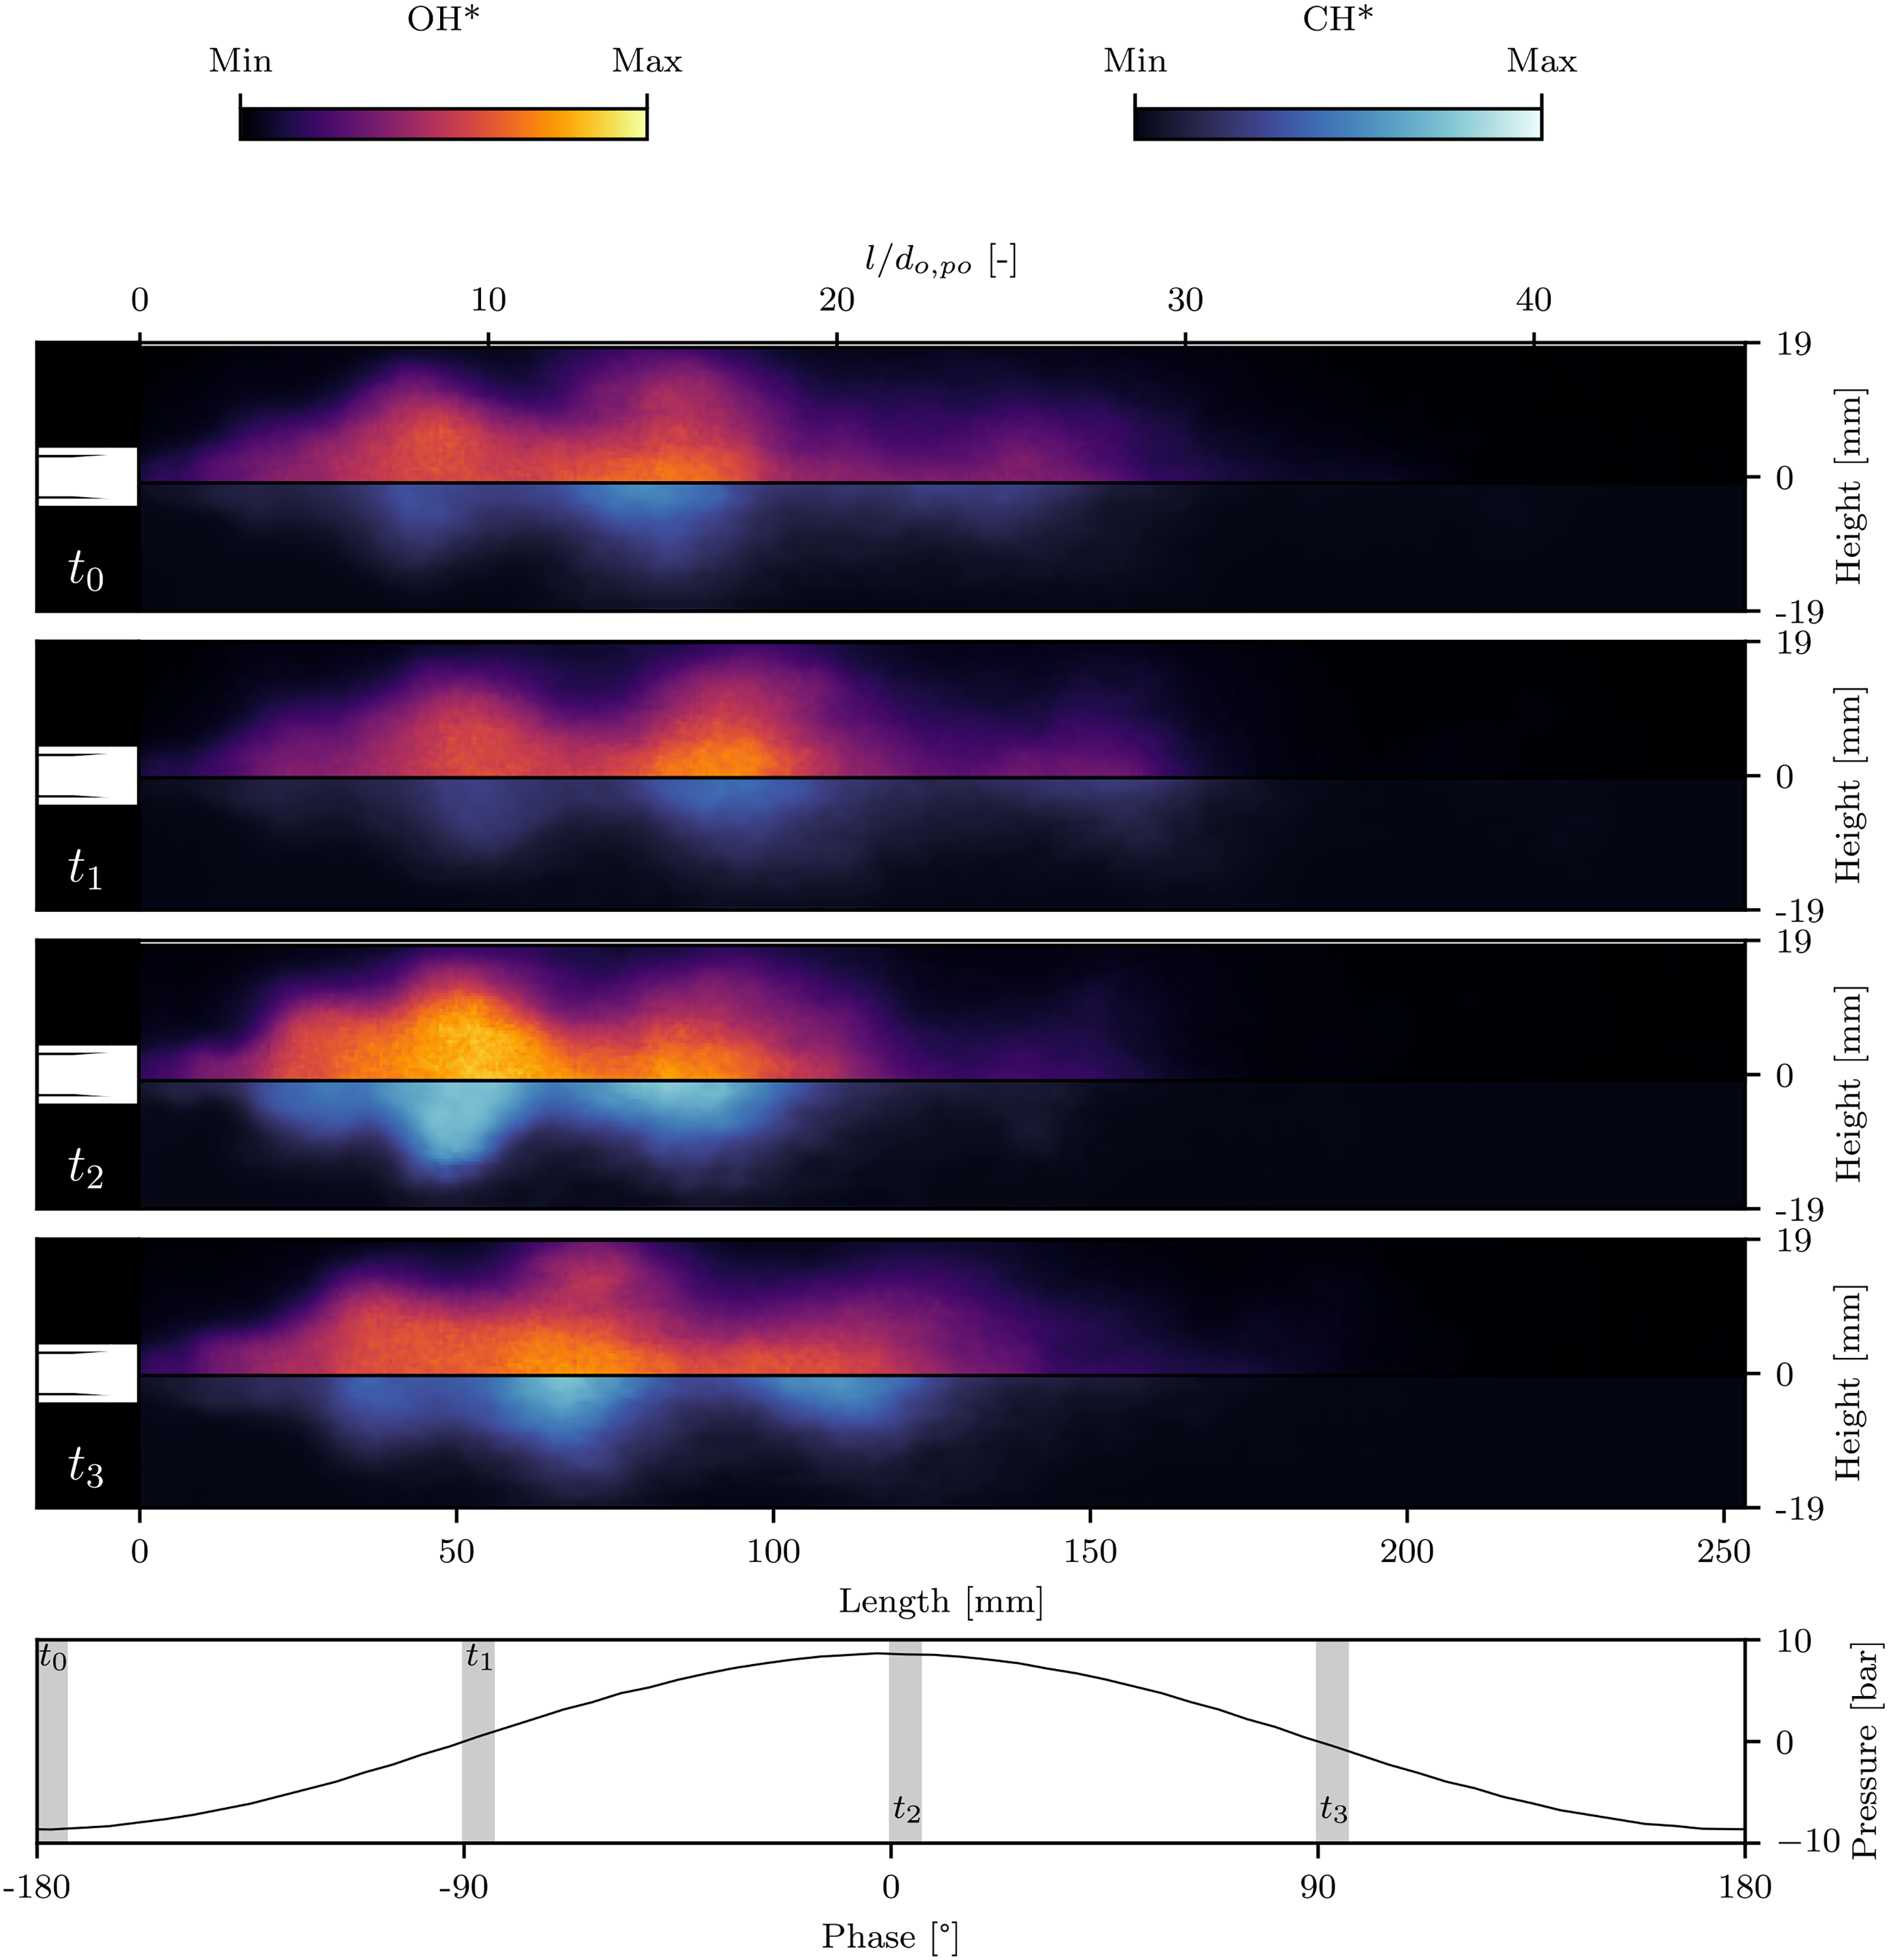
Sequence of phase-averaged flame radiation imaging (OH*/CH*) with respect to bandpass-filtered (at 1L frequency) and phase-averaged unsteady pressure
The hot gas temperature and the structural temperature measurements also reflect the shorter flame due to the combustion instabilities in LP1,LNG–LP3,LNG revealed by the flame imaging. The hot gas temperatures (Figure 9(a)), approximating the adiabatic wall temperature, show a moderate rise of the temperature between the injection plane and the thermocouples at the end of the optical segment for LP4,LNG. In LP1,LNG–LP3,LNG, a steep rise of the measured values is noticeable for the hot gas temperatures in the first 100 mm of the chamber, followed by a decrease from approximately 150 mm. Additionally, the unstable LP1,LNG, LP2,LNG and LP3,LNG feature a higher peak temperature of the axial temperature profile. Due to the high-amplitude instabilities accompanied by high temperatures within the chamber the thermocouples at 84.5, 104.5 and 144.5 mm were damaged during a previous test and thus no measurements are available for LP1,LNG and LP2,LNG.
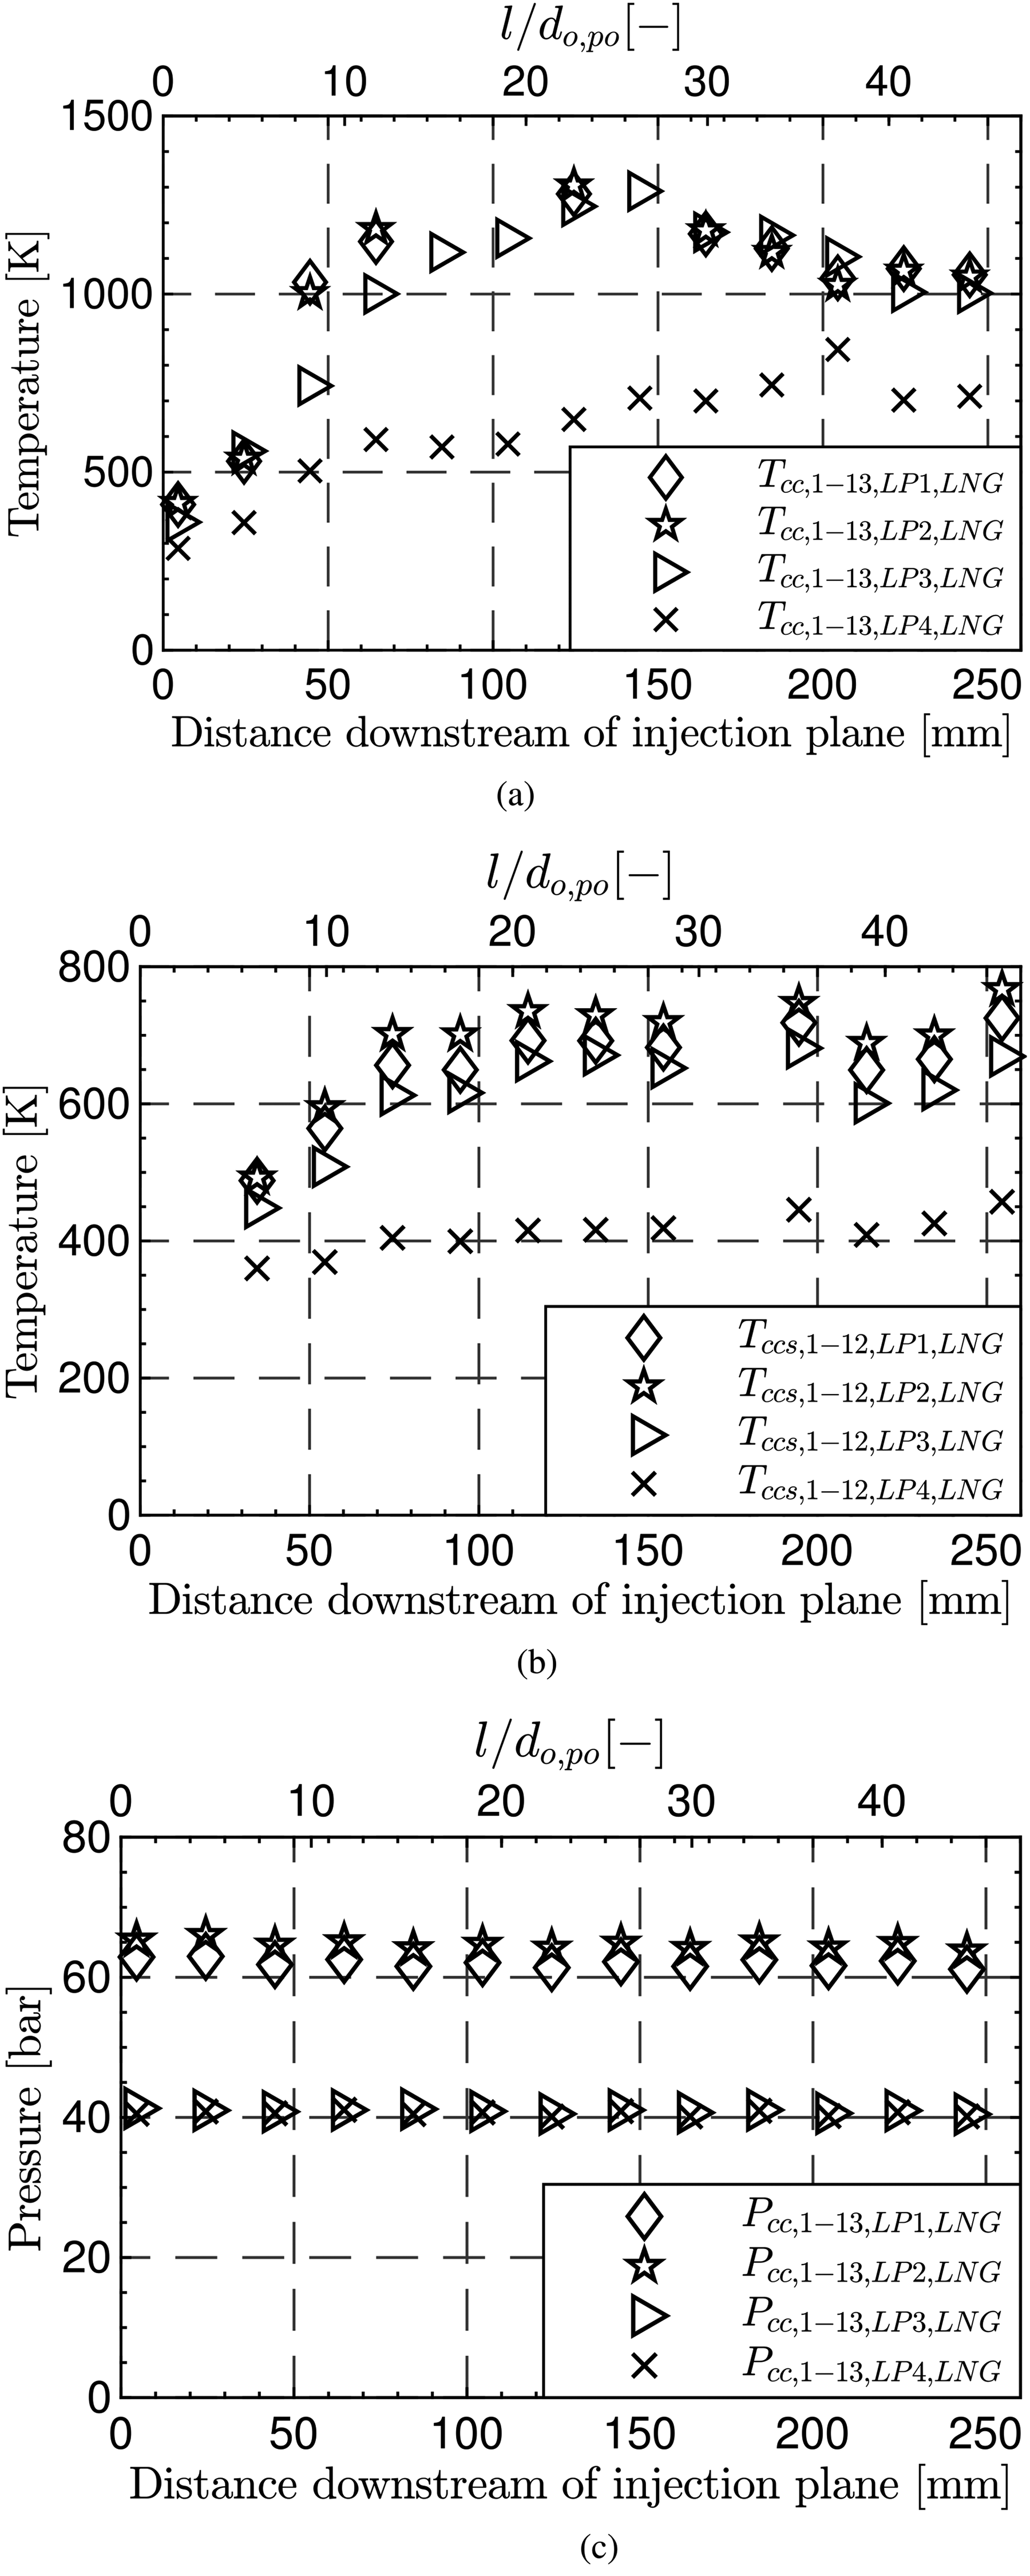
Axial development of conventional measurements for LP1,LNG-LP4,LNG. (a) Hot gas temperature; (b) Wall temperature; (c) Pressure. LP: load point; LNG: liquefied-natural-gas.
The structural temperatures also reach their peak by around 100 mm, as shown in Figure 9(b). However, there is no monotonic decrease after 150 mm as in the gas temperature distribution. The thermocouple at 170 mm was damaged and can be neglected in this plot.
The pressure measurements in Figure 9(c) show only a slight decrease towards the end of the optical segment. This is to be expected due to the long chamber length and high contraction ratio (
In the next section further flame characteristics, flame opening angle, width and length of the presented LPs with the propellants of LOX/LNG will be compared to LPs in previous test campaigns with the same combustion chamber and injection element, but with LOX/H
Acoustic amplitudes and integrated Rayleigh Index with respect to each LP.
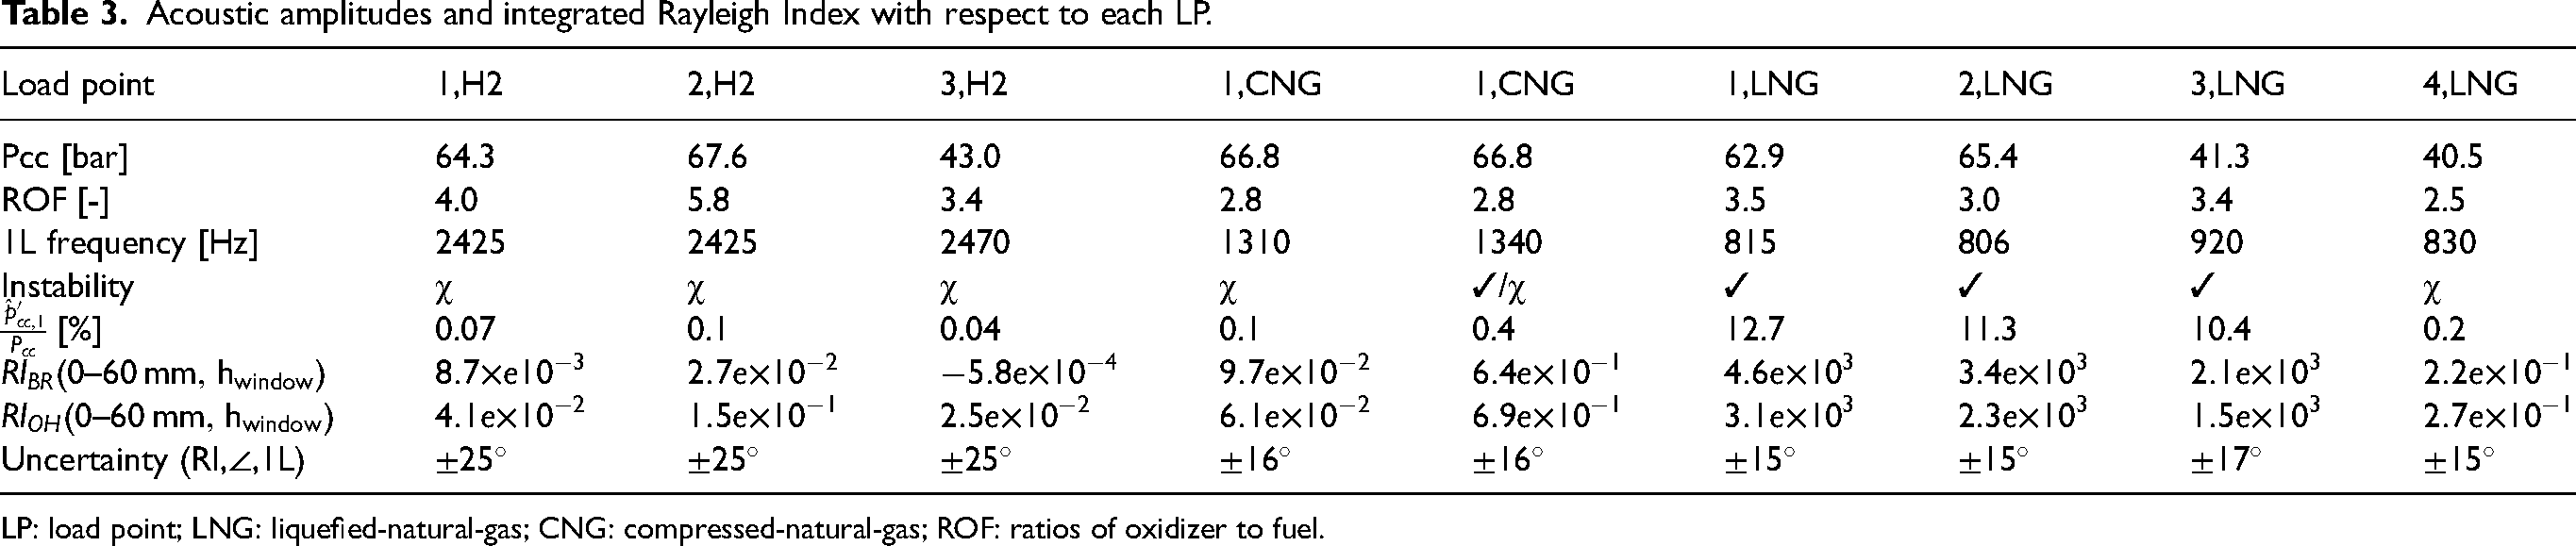
LP: load point; LNG: liquefied-natural-gas; CNG: compressed-natural-gas; ROF: ratios of oxidizer to fuel.
The flame opening angles for the stable H2 and LNG LPs in the blue wavelength regimes, plotted in Figure 10(a), follow the expected trend. Higher opening angles are measured for higher values of VR and
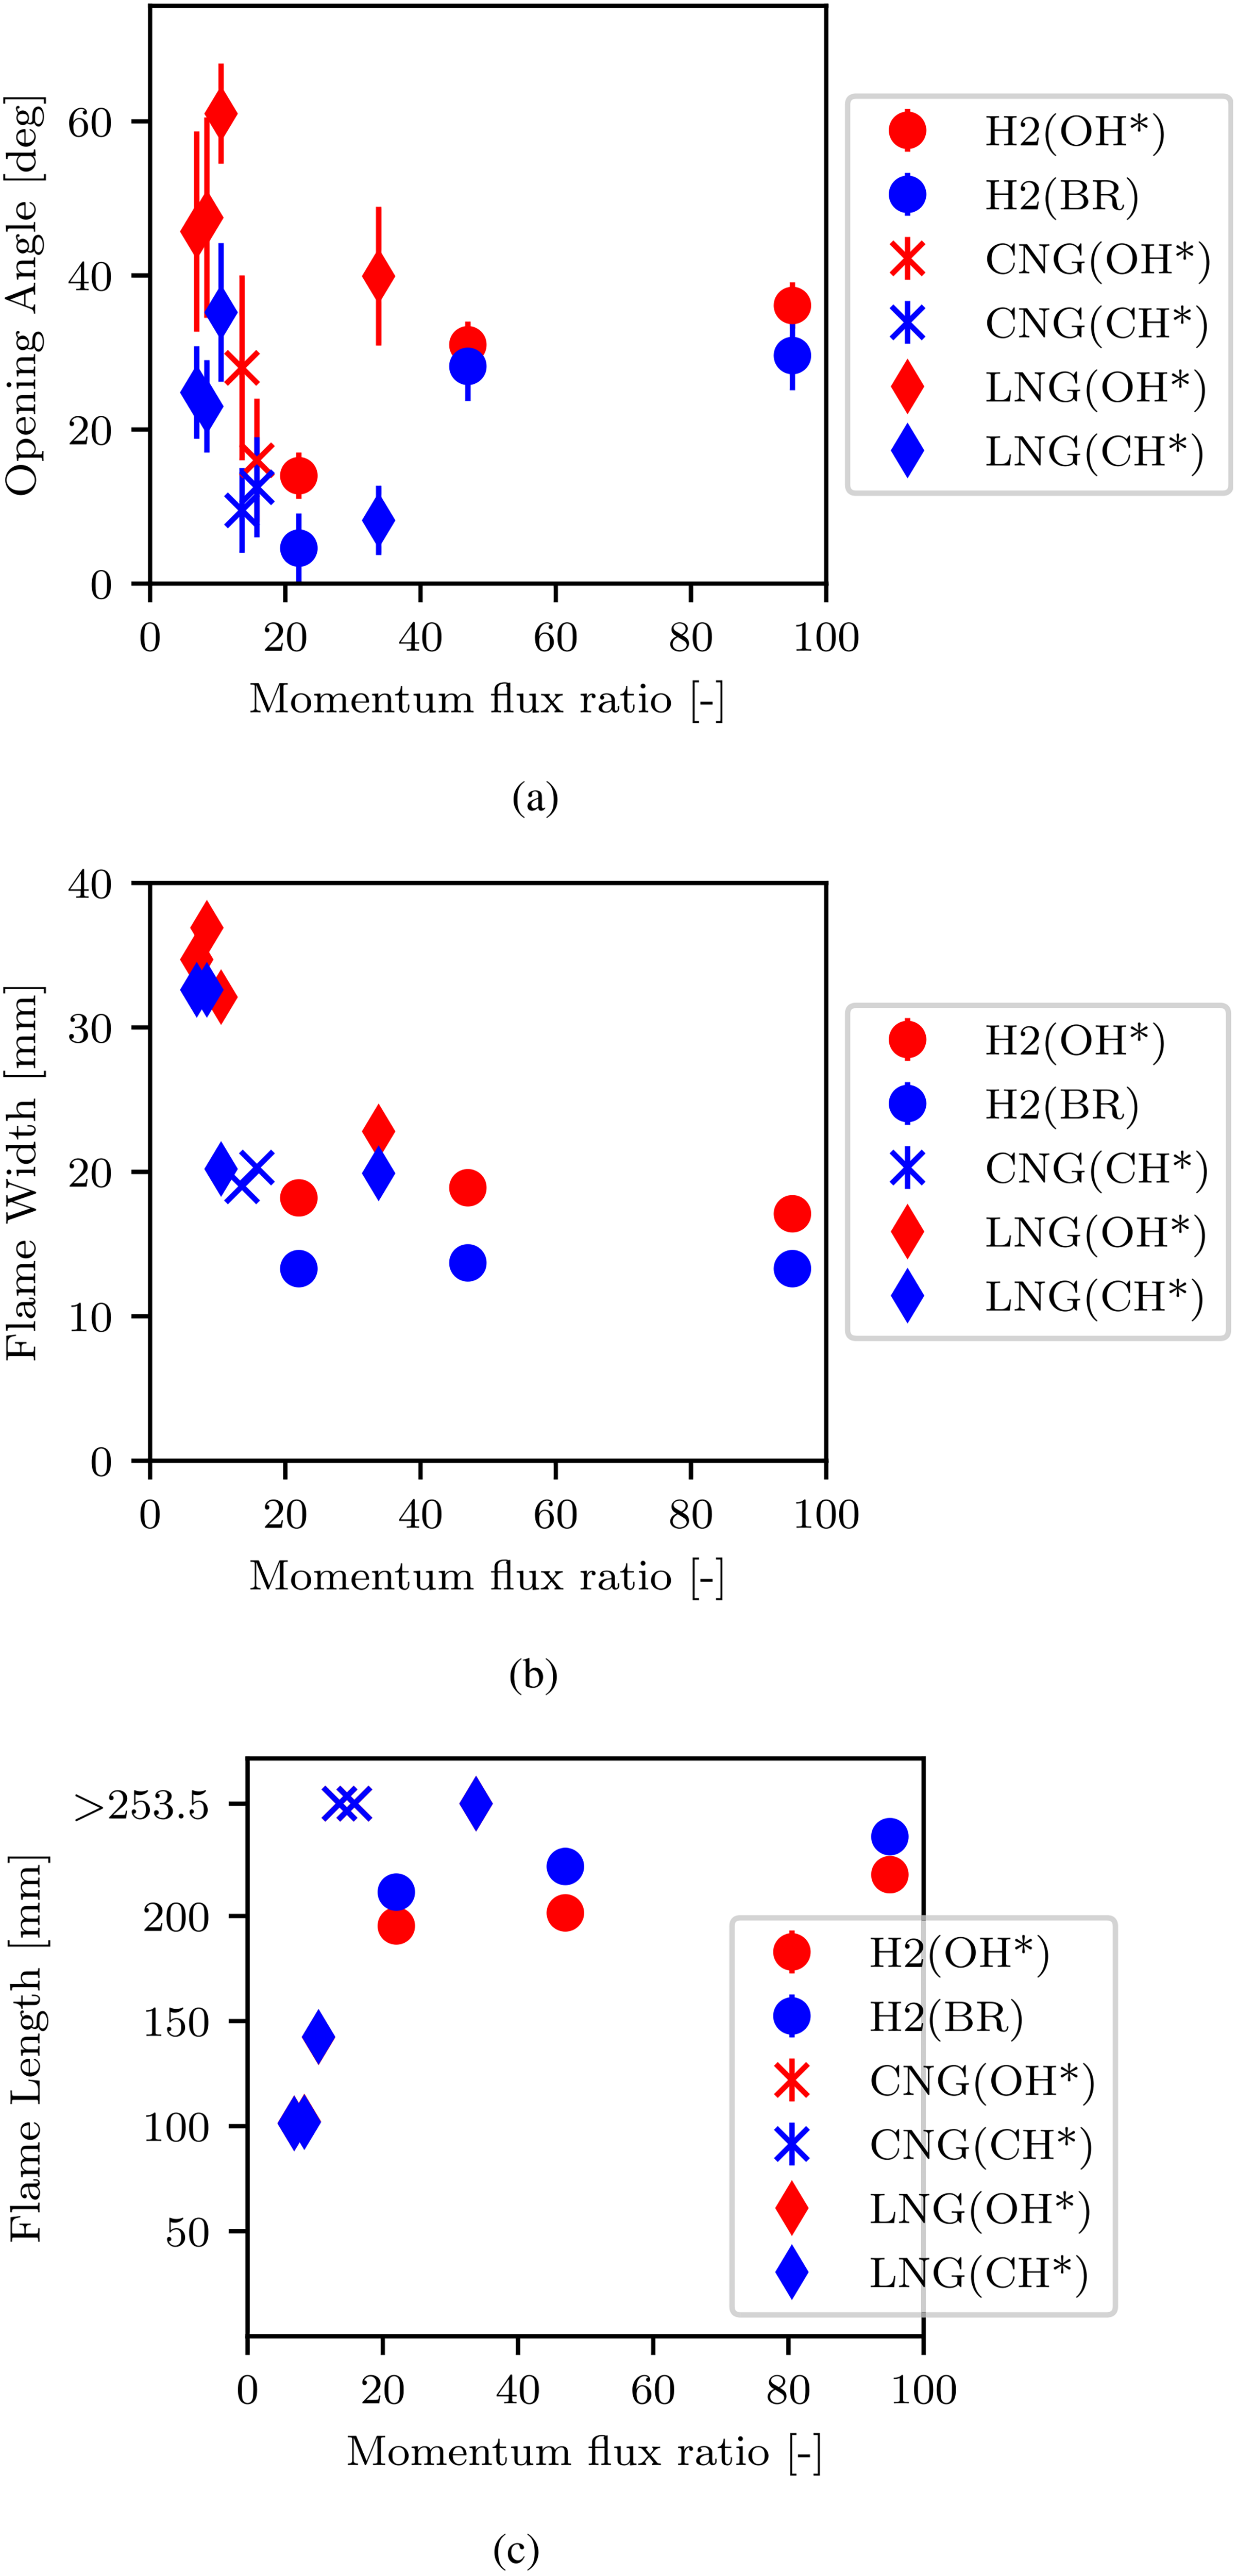
The flame width values plotted in Figure 10(b) are relatively constant for the stable operating conditions with H
Flame length measurements are plotted in Figure 10(c). While for the LOX/H
The flame response in the form of calculated 2D Rayleigh Indices according to equation (2) will now be presented. Recalling that the standard deviation (Figure 7) images revealed a fluctuating intensity throughout the whole flame region for CH* and given that the BR (including CH* for CNG/LNG fuel) has a greater depth of view, 35 more and detailed information about the integral rate of heat release is contained in this measurement. Therefore, only the calculated 2D Rayleigh Indices based on the BR measurements were used for illustration purposes. Within the index distributions, positive (red) values means that the acoustic and intensity oscillations are in phase, while negative (blue) regions show counter-phased dynamics.
First visualisations of the 2D Rayleigh Index for the reconstructed data of the DMD modes containing the chamber 1L frequency will be shown. Figure 11(a) visualises the flame response for stable LOX/H
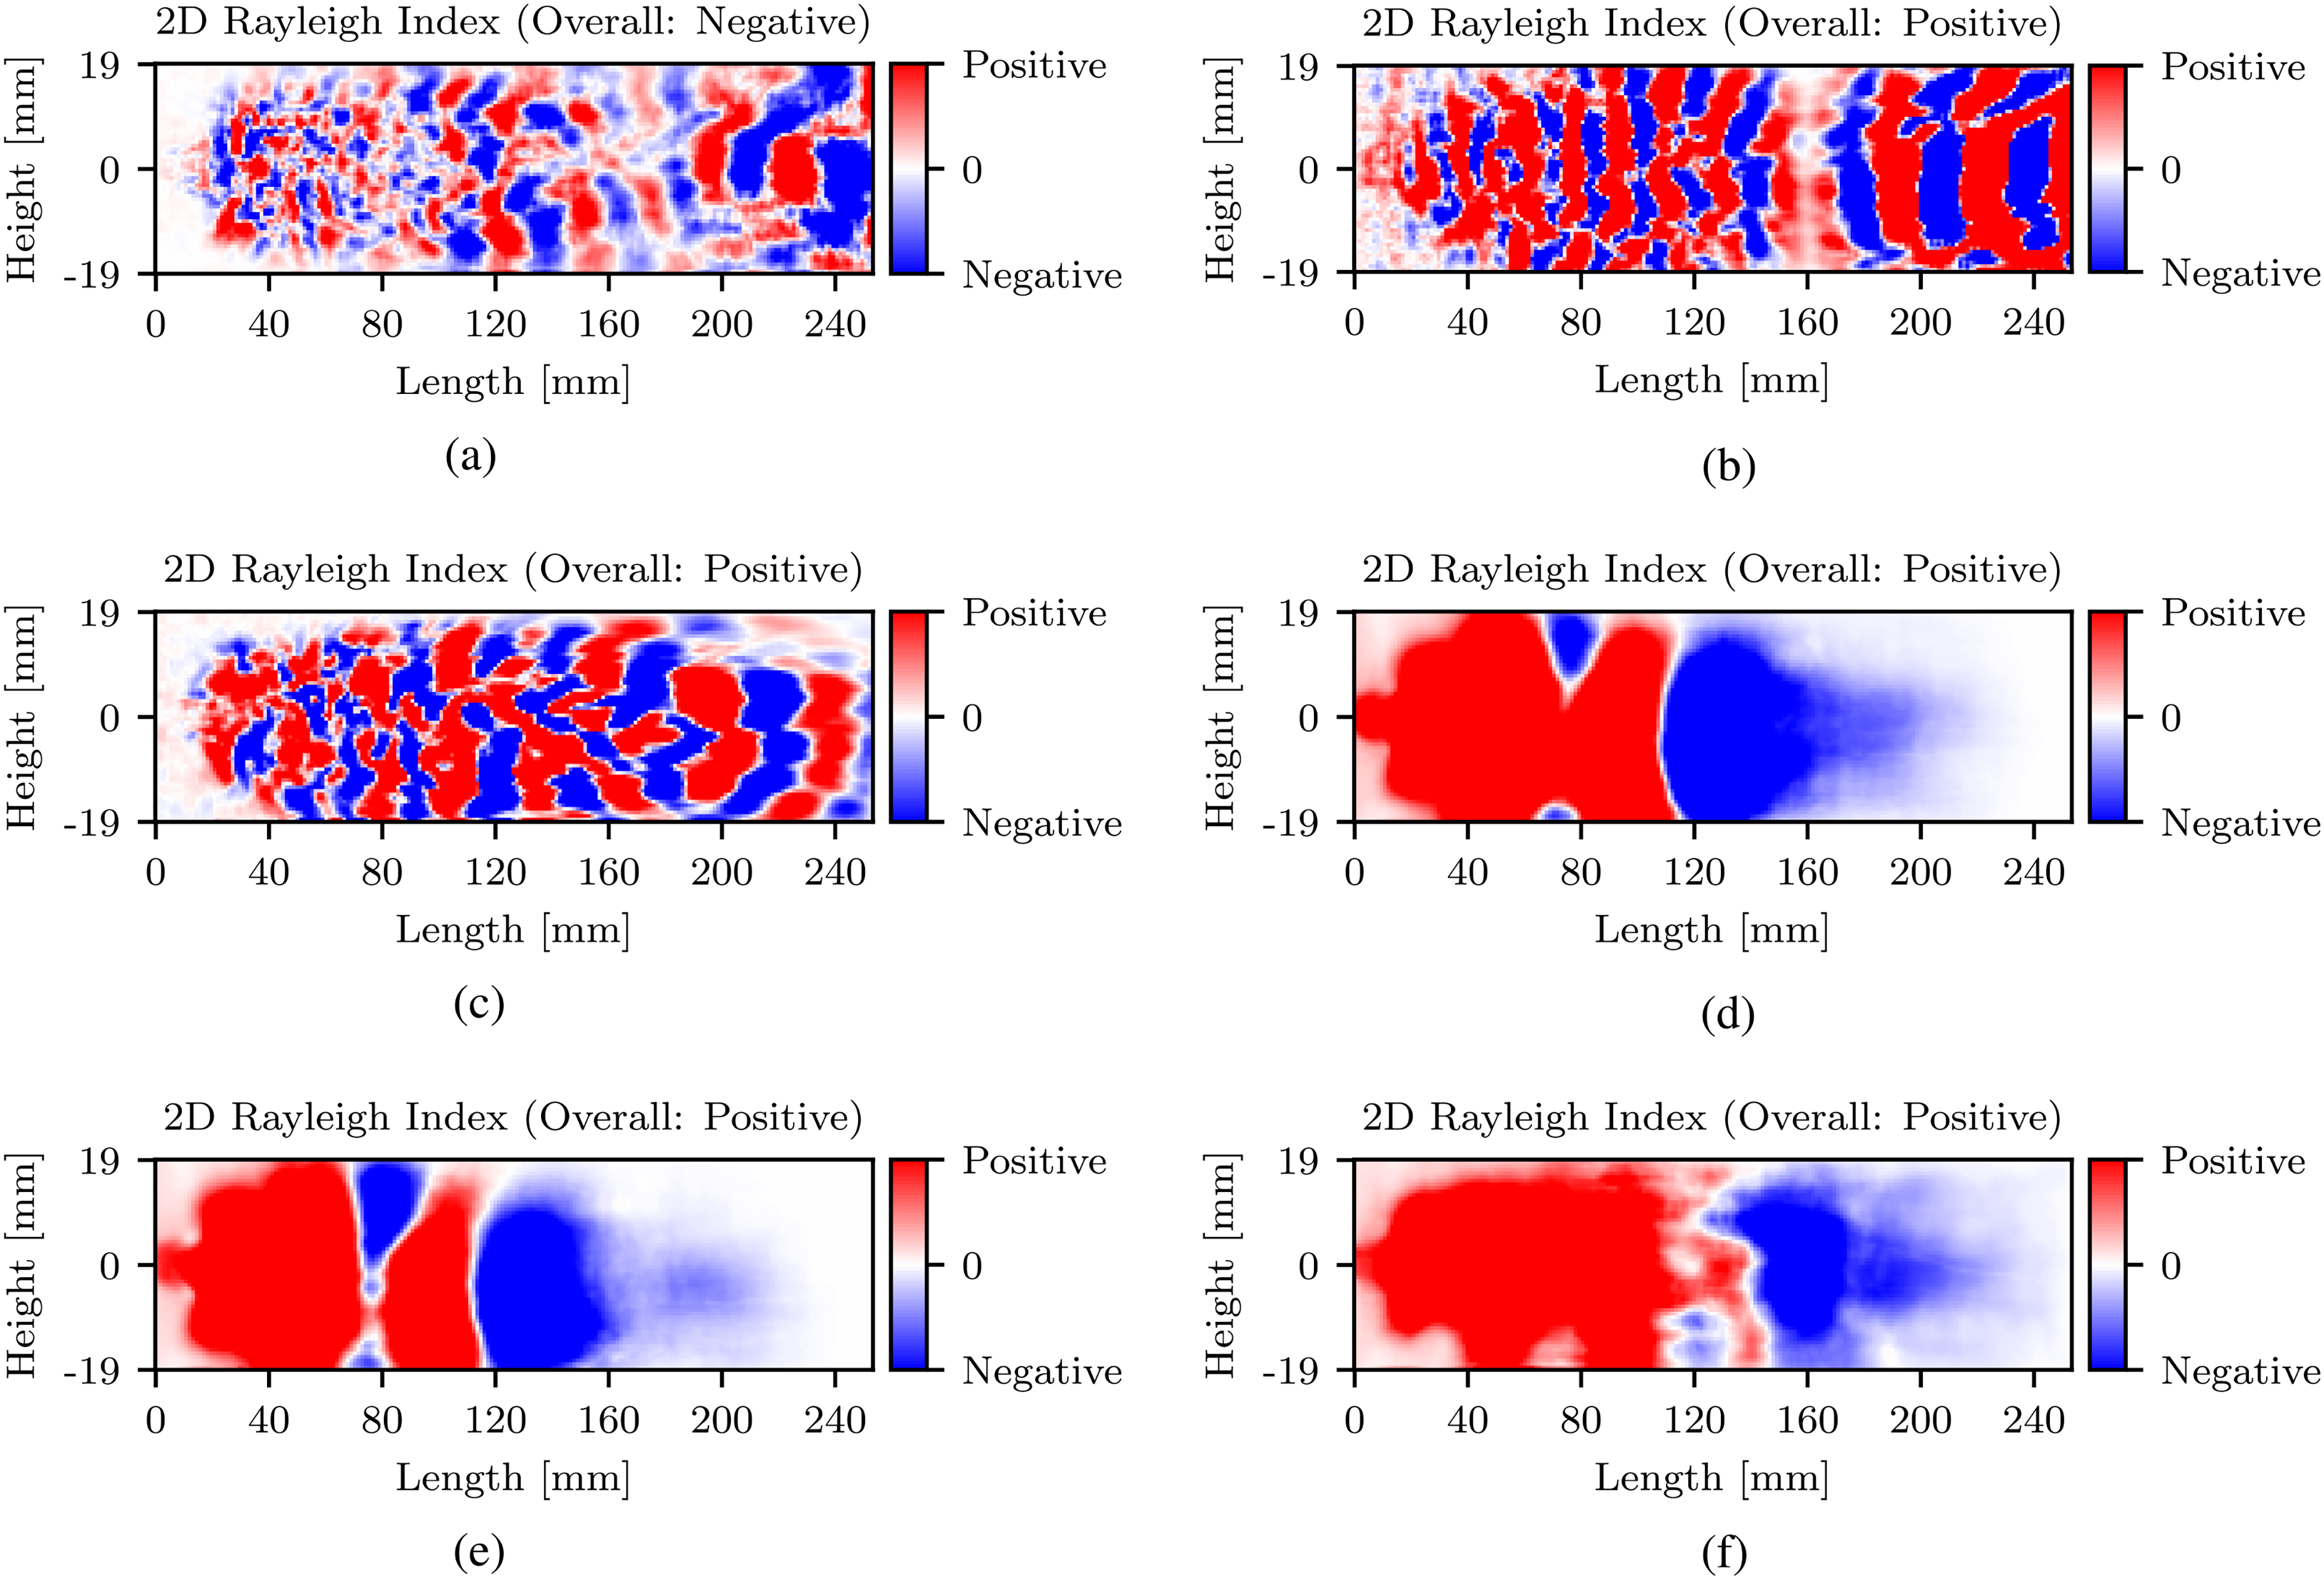
This is not the case for the excited interval of the LOX/CNG load point (LP1,CNG) in Figure 11(b). Here, the overall index is positive. Furthermore, the regions in which the flame couples with the acoustic field form larger (red) structures. The near injector region is known to have a major influence on the stability behaviour of combustion chambers with shear coaxial injectors,36,37 and this region is dominated by positive coupling. A similar but weaker behaviour can be seen for the stable LP4,LNG (Figure 11(c)). Finally, the index distributions of the three unstable conditions (LP1,LNG-LP3,LNG) are shown in Figure 11(d) to (f), and draw a different picture. In addition to a strongly positive overall index, it can be clearly seen that nearly the whole flame zone is positively coupled with the acoustic pressure oscillations. This shows that the reaction rates for the combustion of LOX and natural gas under these operating conditions favour a positive feedback-loop between the pressure oscillations and the heat release fluctuations enabling the thermoacoustic amplitude to grow and to sustain the combustion instabilities.
Table 3 summarises the integrated Rayleigh Index in the first 60 mm of the chamber and compares these values to the acoustic amplitude of
Acoustic amplitude in correlation to the calculated Rayleigh indices from Table 3.
Next, the integral Rayleigh Index (over the whole window area) is plotted in Figure 13 against frequency for the aforementioned H
Integral Rayleigh Index spectra. Note that the y-axis scale is linear below absolute values of 100 and logarithmic above. (a) LP2,H2. 31 ; (b) Excited interval of LP1,CNG. 32 ; (c) LP4,LNG; (d) LP1,LNG; (e) LP2,LNG; (f) LP3,LNG. LP: load point; LNG: liquefied-natural-gas; CNG: compressed-natural-gas.
Four different operating conditions of thermoacoustically unstable and stable combustion in an experimental rocket combustor with large optical access using the propellant combination LOX/LNG were presented in detail in this work. The propellants were injected through a shear coaxial injection element. Simultaneous flame radiation imaging of the ultraviolet and blue wavelength ranges was conducted. In combination with the axial development of temperature and pressure signals, well-defined information on the boundary conditions in the combustion chamber is provided and allows the usage of this dataset as a test case for validating numerical modelling of LOX/methane flames.
Features characterising the flame topology were derived from the time-averaged imaging and compared to previous experiments with the oxidiser-fuel combinations of LOX/CNG and LOX/H
2D Rayleigh Index distributions were calculated using the acoustic field reconstructed from unsteady pressure measurements and the high-speed blue as well as ultraviolet radiation measurements. The distributions and integrated values reflect the observed state of thermoacoustic excitation of the chamber and shows the potential of OH* and especially CH* measurements as a qualitative marker for heat release rate. For the three unstable load points, a strong interaction between flame radiation intensity and acoustic pressure oscillations covering nearly the whole flame zone is determined. Comparison to previous experiments with the propellant combinations of LOX/CNG and LOX/H
The pressure bursts preceding the self-sustaining combustion instabilities in Test 2, in the literature referred to as intermittency, 38 could indicate the operation of the combustor under bi-stable conditions. The changed operating conditions could, therefore, lead to changed boundary conditions in the chamber supporting the transition to self-sustaining, high-amplitude combustion instabilities. The precise circumstances leading to stable, intermittent, or unstable combustion is the subject of the ongoing investigation.
Footnotes
Acknowledgements
The work is associated with the DLR project of Advanced Methods for reusable Aerospace vehicle DEsign Using artificial intelligence and interdisciplinary numerical Simulation (AMADEUS) and Future Fuels. The authors would also like to thank the crew of the P8 test bench. Special thanks to Bernhard Knapp and Stephan General for their support with the optical setup and to Alex Grebe for his assistance in preparing and performing the experiments.
Declaration of conflicting interests
The authors declared no potential conflicts of interest with respect to the research, authorship, and/or publication of this article.
Funding
The authors received no financial support for the research, authorship, and/or publication of this article.