
Abstract
In this study, the flame dynamics of swirl stabilized lean premixed combustion is investigated for kerosene and natural gas operation. A natural gas swirl burner is retrofitted with a twin-fluid nozzle to allow performing all experiments with the identical burner hardware. The mixture preparation complexity is stepwise increased from perfectly premixed natural gas to technically premixed natural gas and lastly technically premixed kerosene combustion. Flame transfer functions (FTFs) for the three configurations are presented and compared with each other. This approach allows to experimentally decompose the FTF and isolate the contributions of equivalence ratio fluctuations and droplet dynamics. Furthermore, FTF data for a systematic variation of equivalence ratio and air mass flow in kerosene operation is presented and the impact of spray quality and convective delay time on the FTF is discussed. For all operation points, stationary flame images are provided and evaluated as basis for the FTF interpretation. Additionally, NO emissions are measured in order to determine the degree of premixing in kerosene operation. Through a systematic FTF comparison, it was found that the frequency range in which droplets react to acoustic forcing can be read from the FTF phase. The spray quality was found to have a significant impact on the FTF whereas a change in the convective delay time does not affect the FTF.
Keywords
Introduction
Modern gas turbine systems have to comply with restrictive emission regulations. Therefore, they are mainly operated under lean premixed conditions. Due to the increased energy density, lean premixed combustion is prone to the development of thermoacoustic instabilities, which arise from a coupling between flame heat release oscillations and acoustic waves in the combustion chamber. The oscillations in pressure and heat release rate can reach high amplitudes and thereby significantly limit the operation range of gas turbines. 1
Previous investigations have revealed that depending on the configuration, either one or more main excitation mechanisms exist. For perfectly premixed combustion where fuel and air are mixed far upstream of the combustion chamber, acoustically induced velocity oscillations act as the main excitation source. Additionally, in swirl stabilized systems, swirl fluctuations that can arise if the acoustic waves impinge on the burner may contribute to the development of instabilities. 2 In previous investigations with the same burner as used in this study, 3 it was shown that the instability formation is influenced by burner geometry and flame structure.
In the case of technical premixing, which is more relevant for industrial application, fuel and air are mixed close to the burner exit. Due to the limited mixing length, equivalence ratio fluctuations can occur, which act as a second source of instabilities. These fluctuations are generated by acoustic perturbations at the fuel injection location, which modulate the air mass flow while the fuel mass flow remains constant. Since flame properties in lean combustion are highly dependent on the equivalence ratio, those fluctuations may lead to large heat release oscillations.4,5
The above-mentioned mechanisms have already been widely investigated for combustion of gaseous fuels. However, in order to reliably supply electrical energy, especially in case of limited primary fuel availability, fuel flexibility becomes a matter of great importance in modern gas turbines. Thus, solutions that allow the combustion of liquid fuels in gas turbine systems are investigated. In the case of liquid fuel combustion, the mixture preparation involves additional sub-processes, namely fuel atomization, droplet-air mixing and fuel evaporation, which may pose additional sources of instability. Recent investigations suggest that the average evaporation quality is only marginally affected by acoustic excitation. However, the different inertia of droplets of different size cause a segregation of small droplets at velocity antinodes whereas bigger droplets remain unaffected by the excitation,6,7 acting as a potential source of instability.8–10 While the research on liquid combustion has mainly focused on aero engines which operate under rich non-premixed conditions,9,11 only little research has been conducted on lean premixed liquid fuel combustion so far.
For low amplitudes, the different contributions are linearly superposed. 12 This motivates an experimental decomposition approach which has already been followed by Bade et al. 13 for natural gas flames and is now extended to liquid fuel combustion in this study. Flame transfer functions (FTFs) are measured in order to characterize the flame dynamics. In the scope of this study the mixture preparation complexity is stepwise increased from perfectly premixed natural gas to technically premixed natural gas and lastly technically premixed kerosene combustion. A comparison of the mixture preparation modes is performed at equal thermal conditions, such that the contribution of the individual mechanisms can be isolated.
For this purpose, a swirl stabilized burner, which is capable of perfectly premixed natural gas operation (NGp) as well as technically premixed natural gas operation (NGt), is retrofitted with a twin-fluid nozzle for liquid operation and used to stepwise increase the mixture preparation complexity without changing the burner geometry.
In order to decompose the flame dynamics, the following sets of comparisons are made in the present paper:
Comparison of the original gas burner and the derived dual fuel burner in order to assess the impact of the applied burner geometry modifications. Comparison of the NGp, NGt and kerosene operation of the dual fuel burner in order to extract the impact of equivalence ratio fluctuations and droplet dynamics. Systematic variation of operation conditions in liquid fuel combustion in order to determine the parameter dependency of the previously identified characteristics.
Except for the first set of comparisons, all experiments are run with the dual fuel burner. While the first and second comparisons are made for one operation point, the third set of comparisons covers the entire operation range which is discussed in the following section. For all operation points, additionally to the FTFs, the stationary flame behaviour is examined to provide a basis for the later interpretation.
The paper is structured as follows. First, the experimental setup is described and the operation range is discussed. After that, the stationary operation behaviour is examined based on OH* flame imaging and emission measurements. Furthermore, the relevant preconditions for the applicability of the comparison approach are discussed and verified. The final section of the paper focuses on FTFs. Here, the concept of FTF and the theoretical background are explained and the associated measurement method is introduced. The FTF decomposition approach is then demonstrated and applied. FTFs are presented for the different fuels as well as for a parameter variation in kerosene operation.
Experimental setup and operation range
Experiments are carried out in the atmospheric single burner test rig depicted in Figure 1. It was designed for studying longitudinal thermoacoustics at atmospheric pressure in a thermal power range between 40 and 65 kW. 14 The test rig allows acoustical and optical measurements under preheat conditions similar to typical gas turbine combustors. Air is electrically preheated at the test rig inlet to maintain a temperature of 573K at the burner inlet. At the outlet of the preheater, natural gas can be introduced into the air flow if the test rig is operated in perfectly premixed natural gas configuration. The flow is split and half is led through a hot gas siren which serves for upstream acoustic excitation while the rest is directly led to the plenum via a bypass. The siren consists of a stator and a rotor disc with double sine-shaped orifices that allow the generation of a harmonic excitation signal. 9 The plenum is a cylindrical tube with a diameter of 124 mm and a length of 1365 mm and provides ports for pressure and temperature measurement. The burner used in this study is a downscaled version of the modular swirl burner described by Sangl et al. 15 . The burner consists of a conical element with tangential slots, by which the airflow flow is swirled, followed by a converging mixing tube. The apex of the conical element is cut off and a head air port at the centre axis allows part of the airflow to pass the burner without passing the swirl slots.
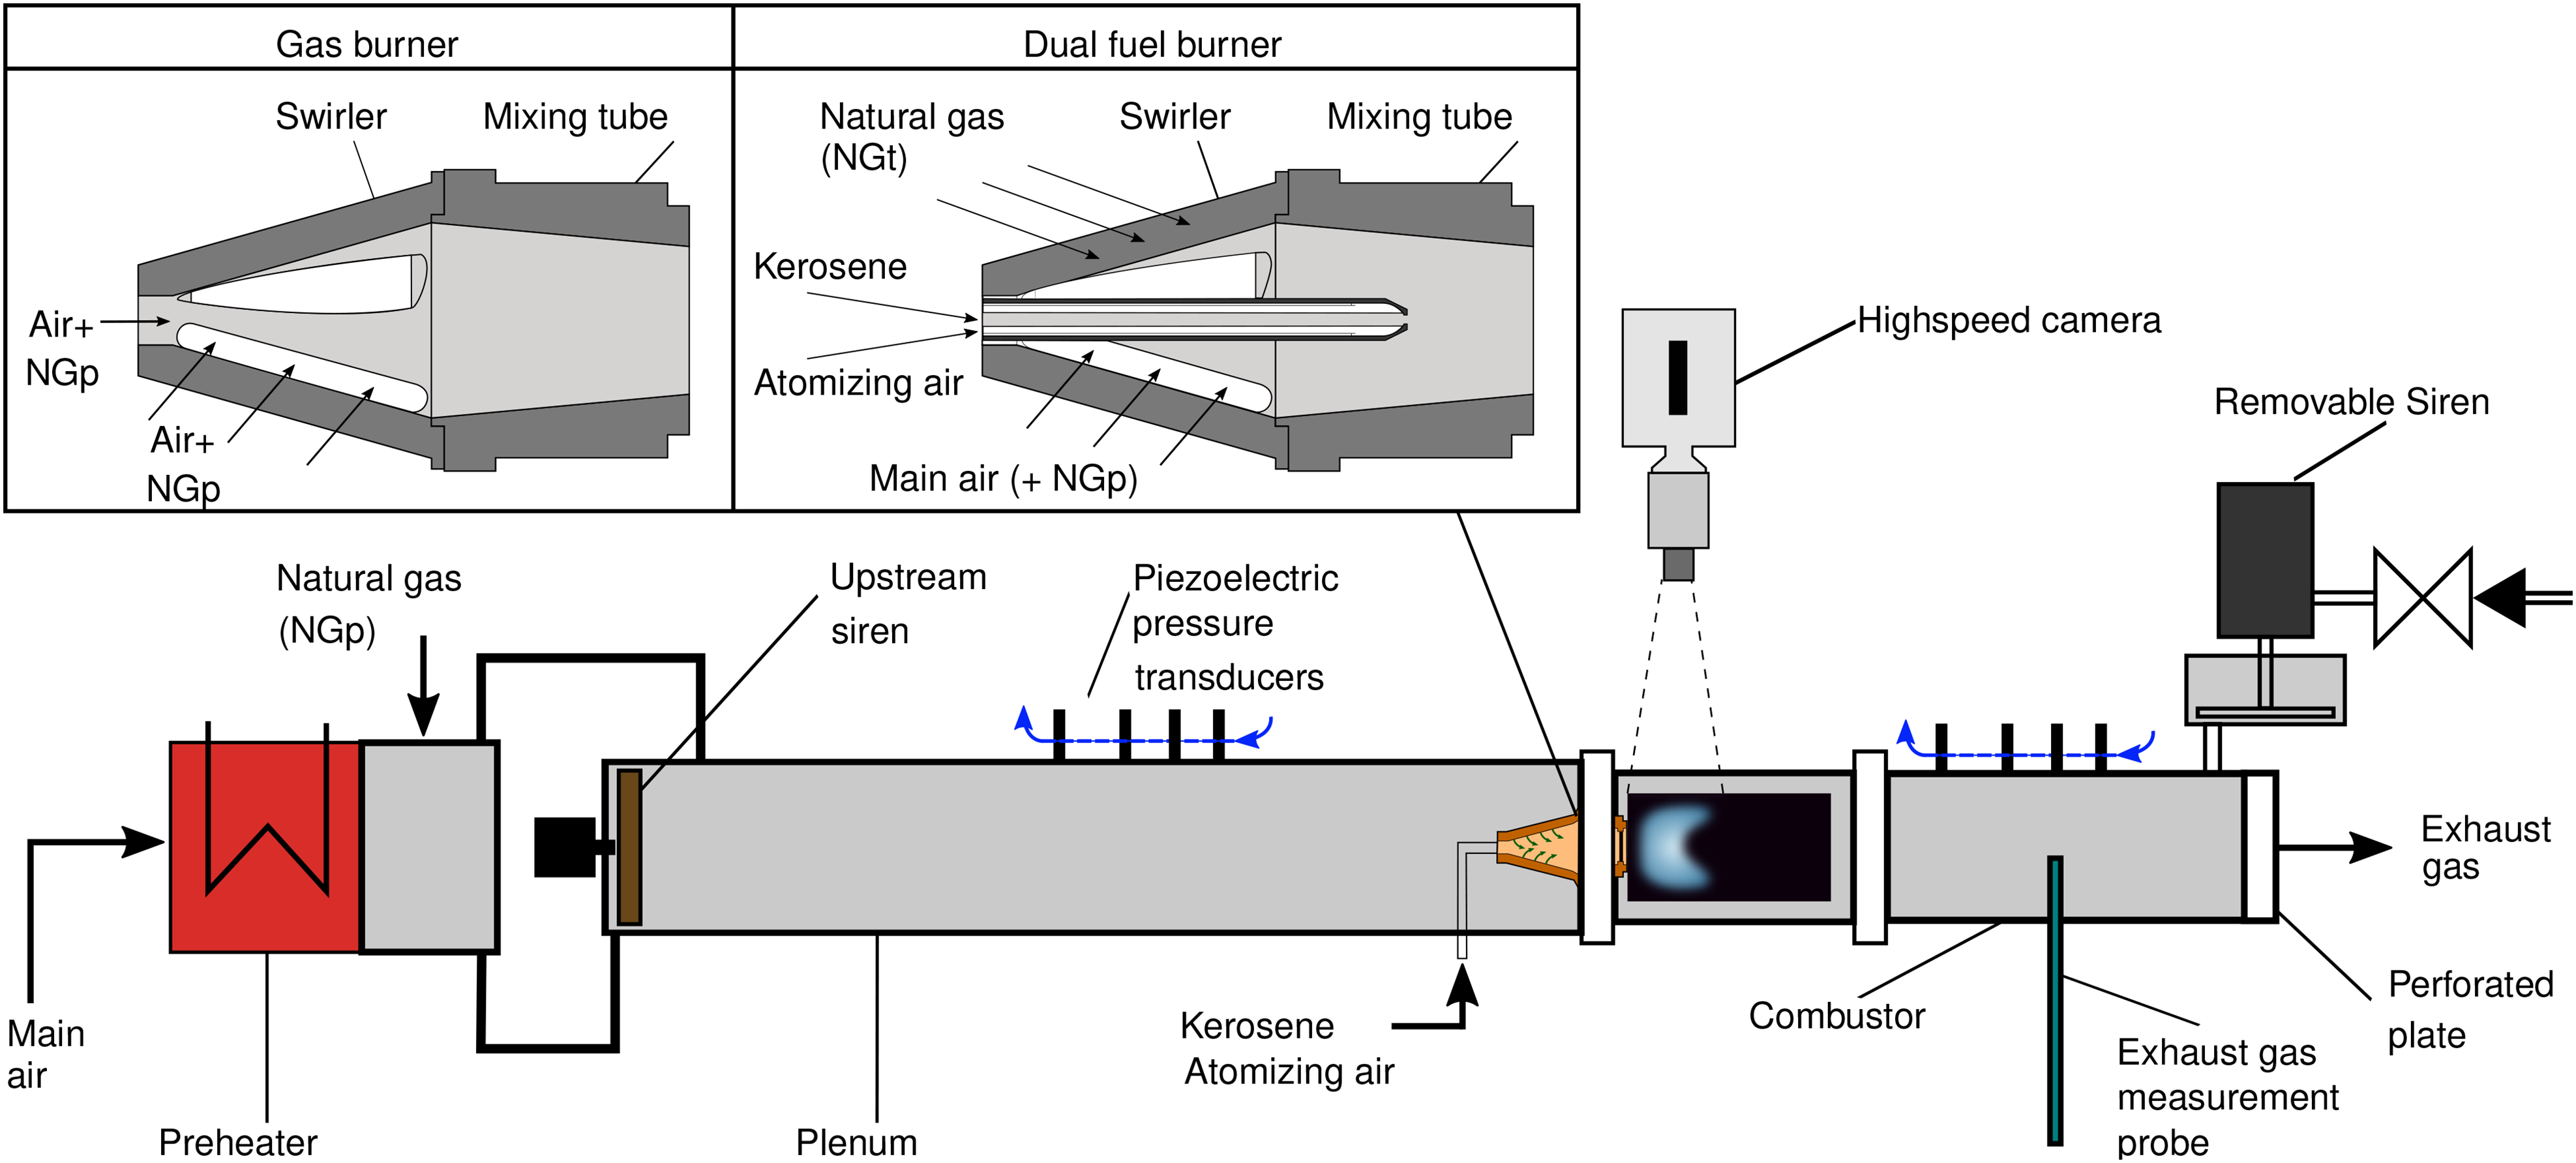
Atmospheric single burner test rig.
For technically premixed natural gas operation, fuel can be injected into the flow through holes in the swirl slots of the burner.
In order to additionally allow liquid operation, the burner is equipped with a two-fluid nozzle which is mounted on the centre axis at the head air port 16 in the dual fuel burner configuration. The lance is fed with kerosene and atomizing air, which are brought into contact at the nozzle exit where the high momentum air flow atomizes the liquid flow. In operation, the nozzle is choked at the exit. The droplet size can therefore be assumed to scale with the ratio of atomizing air and liquid fuel mass flow which is referred to as air-liquid-ratio. 17 Additionally, the droplet quality in the combustion chamber can be influenced by the axial distance between nozzle outlet and combustor. The axial distance is fixed at = 70 mm for the investigations in this study. The rectangular combustion chamber provides optical access to the flame by a quartz glass window. The combustion chamber is extended by another rectangular segment that provides ports for pressure and global emission measurement. The exhaust gas measurement port is located at a distance of 540 mm downstream of the burner exit. The measuring probe for the exhaust gas analysis is kept at a constant temperature of 353 K by a water thermostat. This is necessary in order to quench the extracted exhaust gas mixture and to prevent humidity in the analyzed gas from condensing as this would falsify the measurements. The extracted gas is analyzed in a CLD analyzer ECOphysics CLD700ELht. Downstream of the measuring port section a removable siren 18 can be attached perpendicularly to the flow direction for downstream excitation. The test rig ends with a perforated plate serving as a non-reflecting boundary condition. For acoustic measurements, the test rig is equipped with a total of eight water-cooled PCB 106B piezoelectric dynamic pressure transducers of which four are located in the plenum and the other four in the combustion chamber. More detailed descriptions of the test rig can be found in the work of Stadlmair et al. 19 and Bade. 20
Flame images are acquired using a Photron FastCam SAX-2 high-speed camera equipped with an image intensifier and a band-pass filter to record only the OH* chemiluminescence radiation. In stationary operation, sets of 1000 images are recorded with a frame rate of 125 images per second and averaged in Matlab.
Dynamic pressure is recorded at a sample rate of 65536 samples per second. Time traces of 10 seconds are recorded for each excitation frequency in the range between 20 Hz and 600 Hz at a frequency stepping of 20 Hz. The recorded data is correlated to the excitation signal in the postprocessing in order to extract the amplitude and phase information of the dynamic pressure signal which serve as input for the FTF calculation.
The baseline operation point is at a main air mass flow of = 25 g/s and an equivalence ratio of = 0.675. In kerosene operation, two series of parameter variations are investigated. In the first series, the equivalence ratio is varied between = 0.575 and = 0.775 at a fixed main air mass flow which is equivalent to a fuel mass flow variation at constant air mass flow. In the second series, the main air mass flow is varied between = 20 g/s and = 30 g/s at a constant equivalence ratio. This means a simultaneous variation of fuel and air mass flow under a constant ratio. The ratio between atomizing and main air mass flow is fixed to = 0.035 for the kerosene operation in order to maintain self-similar flow fields over the operation range. The resulting air-liquid ratios at the nozzle exit are in the range between for = 0.575 and for = 0.775.
For the two natural gas configurations with perfectly and technically premixing, only the reference operation point is included in the systematic investigation. Equivalence ratio and main air mass flow are identical to the kerosene case. Because the head air port of the gas burner is blocked by the liquid fuel nozzle (see detail in Figure 1), atomizing air is also required in natural gas operation to stabilize the flame. Flame structure and position are fitted to the kerosene case by adjusting the atomizing air mass flow. Due to the lower injection impulse and higher reactivity of the gaseous fuel, the atomizing air mass flow is increased to = 1.25 g/s for the NGt case and further to = 1.5 g/s for the NGp case.
Stationary operation characteristics
In this section, the stationary combustion characteristics are investigated in order to provide the relevant basis for the subsequent FTF analysis. In a first step, the effect of the head air port blockage on the stationary flame properties is investigated by comparing mean OH* flame images for the original gas burner and the derived dual fuel burner. Subsequently, OH* images for NGp, NGt and kerosene operation in the baseline operation point are compared and the effect of the configuration on the stationary flame is discussed. Finally, the variation of the stationary characteristics over the operation range in kerosene operation is addressed. The flame shape sensitivity towards equivalence ratio and mass flow variations is discussed and the degree of premixing is assessed based on emission measurements. The latter helps to reduce the complexity of the FTF comparisons by eliminating the degree of premixing as a potential influence factor.
Stationary flame imaging
Figure 2 shows the time-averaged OH* intensity distribution images of the gas burner and the dual fuel burner in the NGp baseline operation point. Additionally, the 50% OH* intensity isocontour of the gas burner is included in both images. Since the gas burner is run without atomizing air, the main air mass flow is increased to = 26.5 g/s in order to provide the identical overall air mass flow in the combustion chamber for both cases.
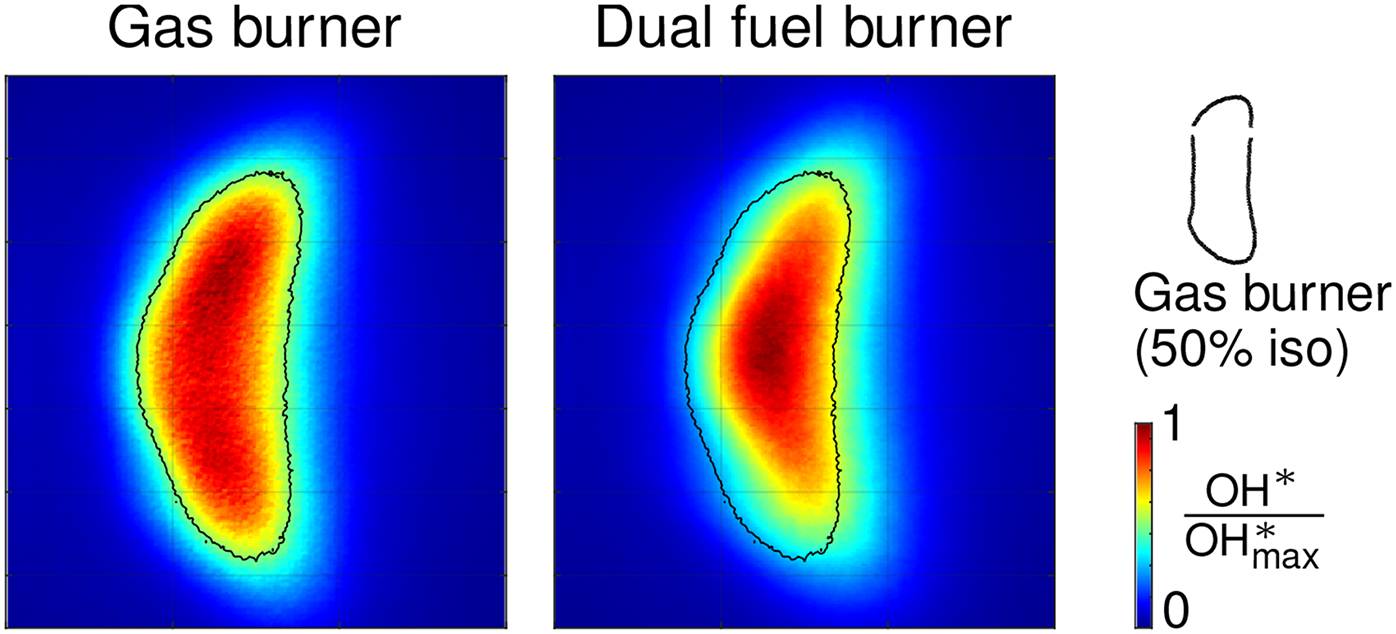
Flame structure comparison for the gas burner and the dual fuel burner in the NGp baseline operation point, = 0.675, = 25 (26.5) g/s.
It can be seen that the flame is moved slightly downstream in the dual fuel burner case. However, this shift is not homogeneous and therefore differences in flame shape and structure are visible between the two cases. The gas burner flame has a moderate radial and low axial extension, similar to previous results obtained with the same burner. 21 The intensity maximum is located halfway to the flame tip. The dual fuel burner flame has a lower radial extension at an increased length, resulting in a more V-shaped flame with the maximum intensity located on the middle axis. This is similar to flame shapes observed for decreased head air in previous work, 21 suggesting that despite the similar axial impulse, the atomizing air mass provides a different flow field than the head air mass flow of the natural burner configuration.
The flame images for kerosene, NGt and NGp combustion are presented in Figure 3 for the baseline operation point in order to illustrate the impact of the configuration on the flame shape. Additionally, the 50% OH* intensity isocontour of the kerosene flame is included in all three images. The two natural gas flames have similar structures, in line with previous observations for the gas burner.15,13 However, despite the efforts of achieving a similar flame structure under all operation configurations, differences between the gas and liquid flame structure remain. The kerosene flame is disc-shaped with an almost constant intensity over a wide radial range. The intensity maximum is located at the middle between the centre axis and the flame tip. The axial position of the kerosene and NGt flame matches very well while the NGp flame is shifted slightly downstream.
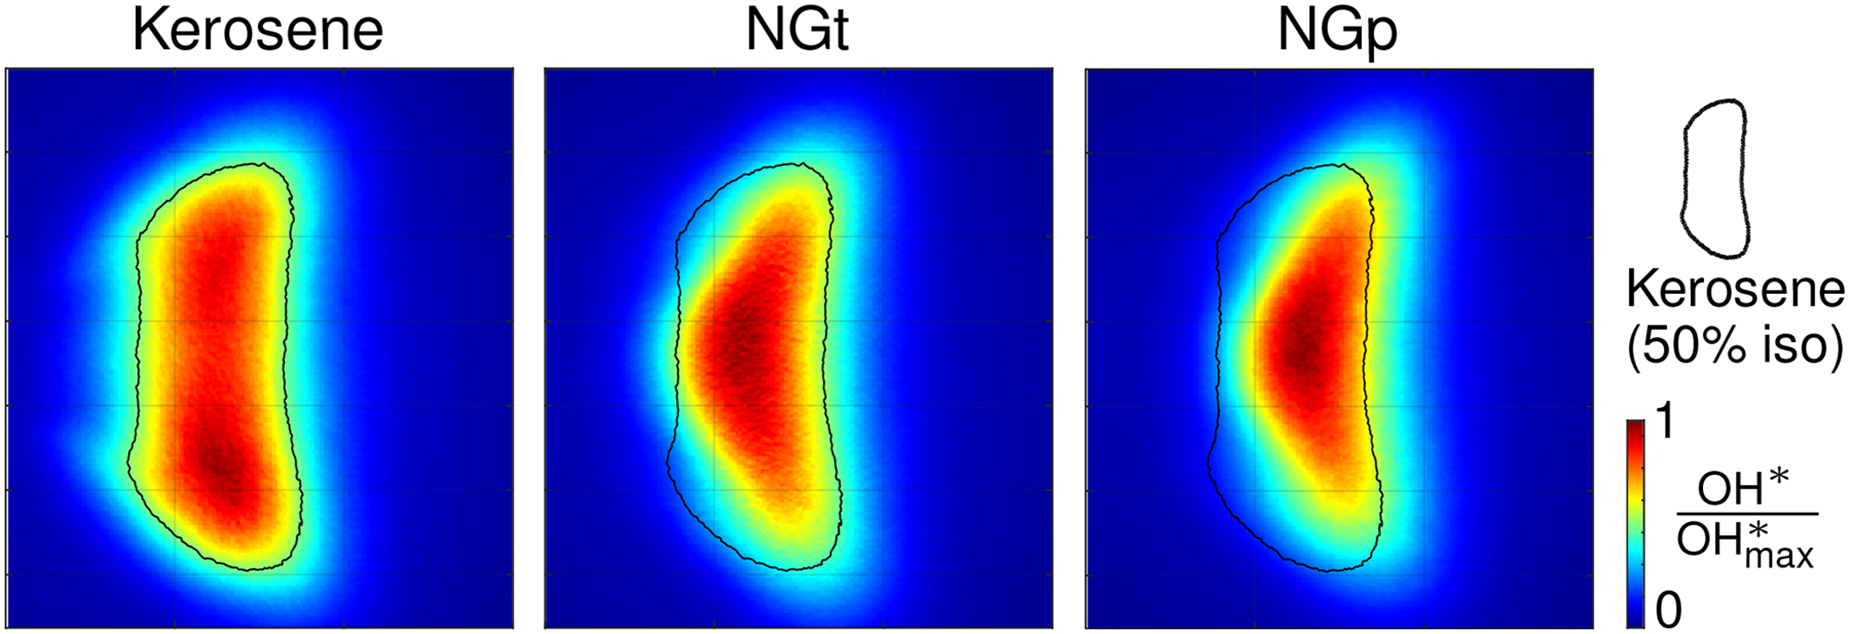
Flame structure comparison for kerosene, NGt and NGp for the baseline operation point, = 0.675, = 25 g/s.
For the rest of this section, only kerosene operation is considered. Figure 4 shows the sensitivity of the flame structure to equivalence ratio variations of , and . It can be seen that similar to previously observed trends for the gas burner, 21 the radial flame extension increases with decreasing equivalence ratio. Furthermore, the flame is shifted downstream due to the decreased reactivity of the mixture in the lean case and upstream in the more reactive rich case. In general, the differences between the lean operation point and the baseline point are higher than between the baseline and the rich case.
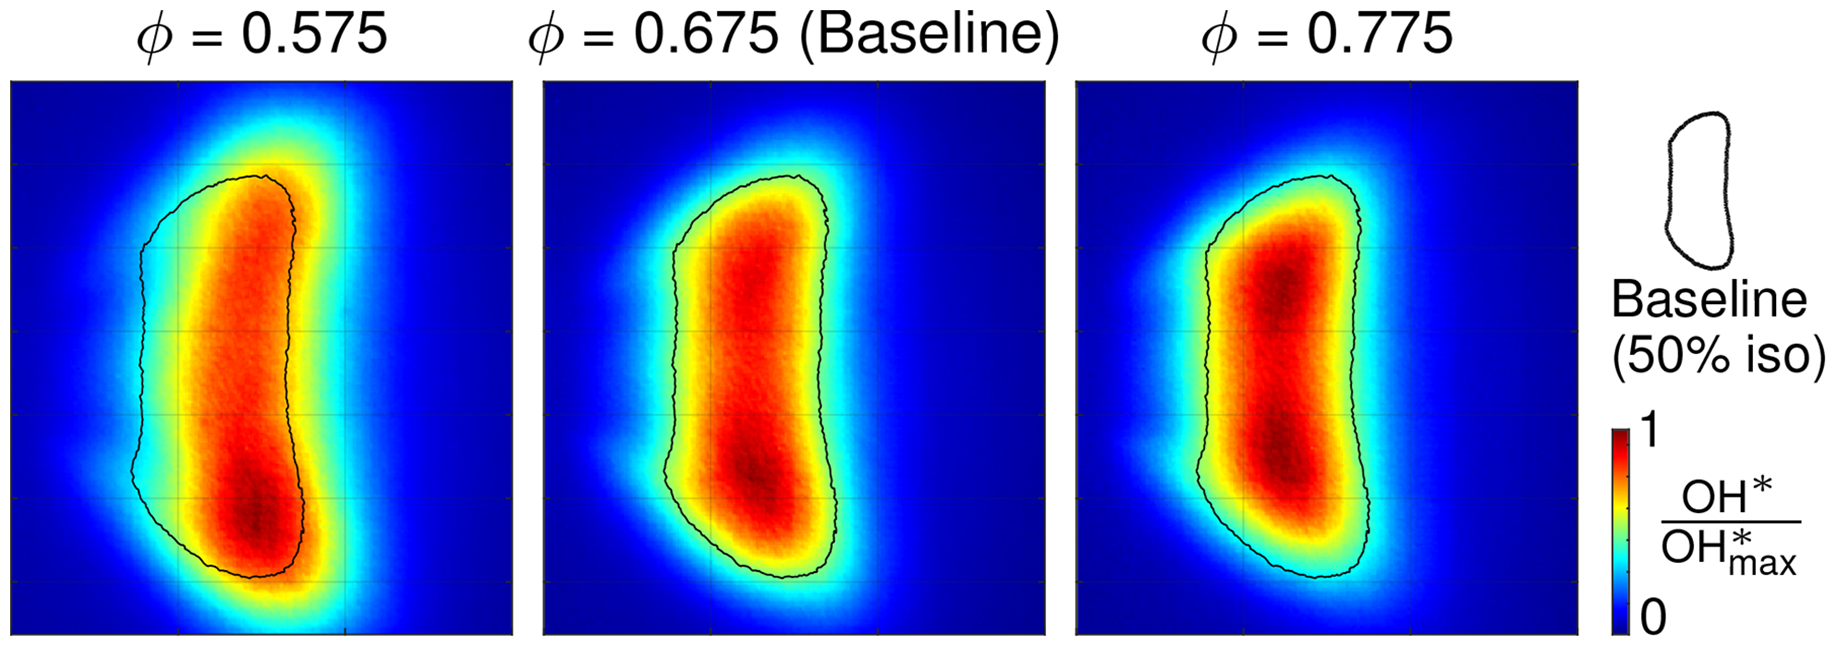
Flame structure comparison for equivalence ratio variation = 0.575, = 0.675, = 0.775 at constant air mass flow = 25 g/s in kerosene operation.
The flame shape sensitivity in response to changes of the mass flow is shown in Figure 5. In contrast to the equivalence ratio variation, the flame structure remains constant over the investigated mass flow range. At constant equivalence ratio, all relevant mass flow rates are varied simultaneously under a fixed ratio and thus the resulting flow field is self-similar and the axial position of the recirculation zone remains constant. Only a marginal downstream shift with increasing air mass flow can be identified.
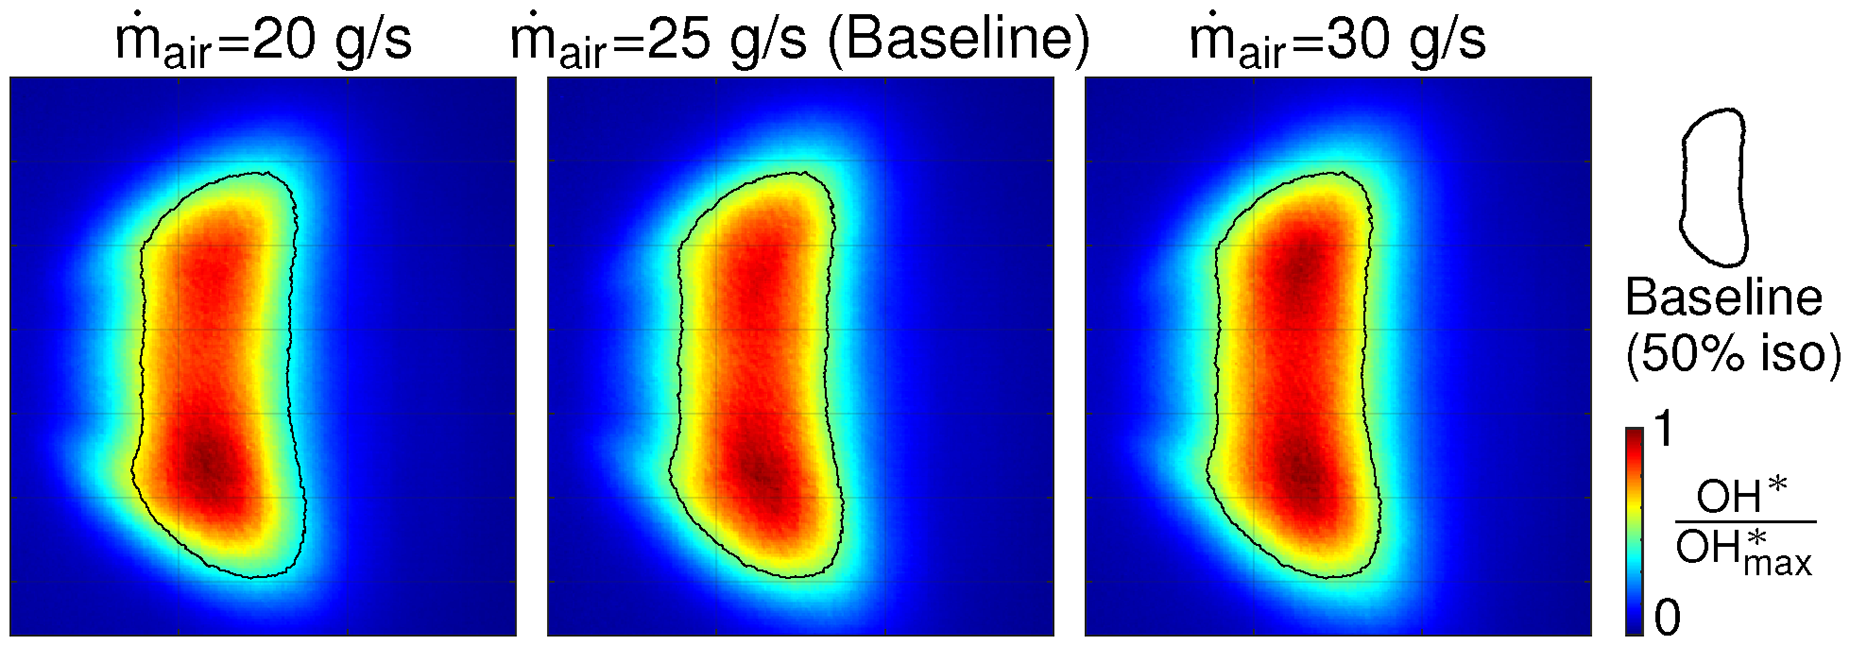
Flame structure comparison for main air mass flow variation = 20 g/s, = 25 g/s, = 30 g/s at constant equivalence ratio = 0.675 in kerosene operation.
emissions
Global emissions serve as measure to assess the degree of premixing in the case of liquid combustion. Since formation exponentially depends on the local combustion temperature,22,23 an increased formation at a constant global equivalence ratio is an indicator of local hotspots. At a globally constant equivalence ratio, these hotspots originate from zones that are richer than the global mixture, thus indicating poor mixing. measurements for perfectly premixed natural gas combustion serve as a reference. Note that, because of the difference in chemical composition, the values for kerosene are slightly higher than those for an identically premixed natural gas case. 24
Figure 6a) shows the corresponding emission curves for kerosene and NGp for a variation of at three different mass flow rates under otherwise constant conditions. All curves show an exponential growth with increasing equivalence ratio and for both fuels, the three curves for the different main air mass flow rates coincide. As expected, the emission values for kerosene are higher than those for natural gas over the entire range. However, the curves are always close together, indicating good mixing of kerosene and air. Figure 6b) shows the emissions for a variation of the atomizing air mass flow at a constant equivalence ratio. The values remain constant over the entire range. The variation of changes the air-liquid ratio and consequently the atomization quality at the nozzle exit. The constant emissions therefore indicate that the mixture quality at the burner outlet is not controlled by the atomization quality at the nozzle outlet, but by turbulent mixing in the mixing tube and that the axial distance between nozzle outlet and flame is sufficiently long for this process to saturate. It can therefore be concluded that the degree of premixing is constant over the operation range and the fuel always enters the flame in a pre-evaporated state.
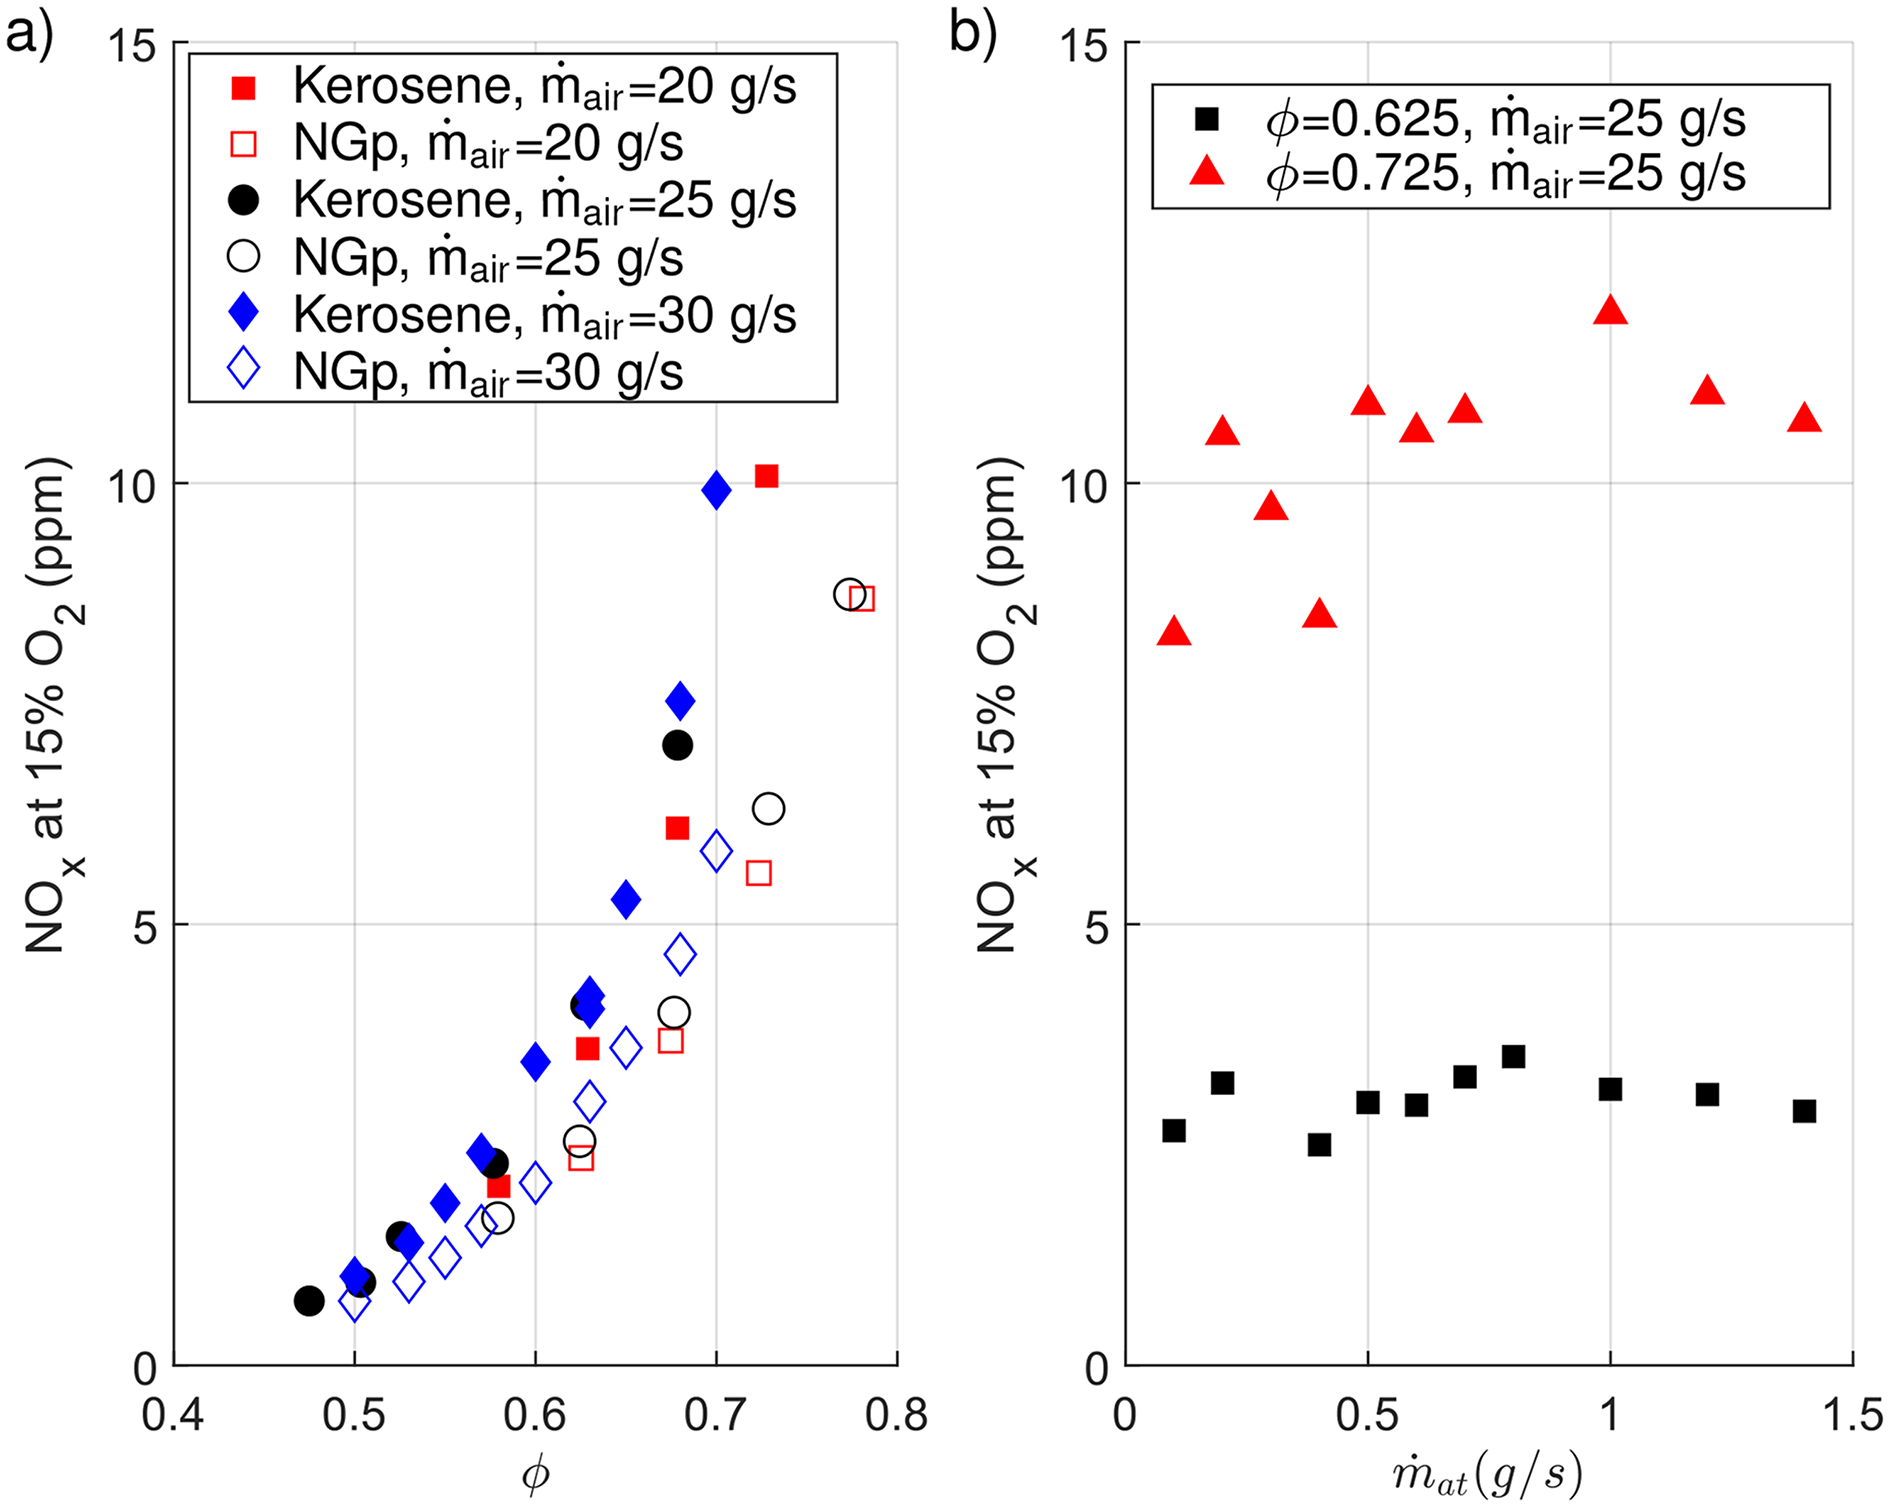
emission curves: a) Comparison of kerosene and NGp for equivalence ratio variations at = 20 g/s, 25 g/s and 30 g/s, b) Atomizing air mass flow variation for kerosene for = 0.625 and = 0.725 at = 25 g/s (ALR=0.09 to 1.26).
Flame transfer function formulation and measurement
In order to quantify flame dynamics FTFs are evaluated. The FTF correlates flame heat release fluctuations to the perturbations of acoustic velocity at the burner exit according to the following equation:
Flame transfer function analysis
In this section, flame transfer functions for the different configurations are presented and discussed. The analysis consists of three sets of FTFs which are systematically compared with each other to reveal the influence of geometry, configuration and operating conditions on the flame dynamics. First, FTFs for the gas and dual fuel burner at the NGp baseline case are shown to quantify the effect of the retrofitted nozzle on the thermoacoustic properties. Second, results for the three different operation modes NGp, NGt and kerosene are compared with each other in the baseline case. The decomposition approach is demonstrated based on the FTF comparison for perfectly premixed and technically premixed natural gas and the method is extended to the kerosene case. In the final part, FTFs for a parametric variation of mass flow and equivalence ratio in the kerosene case are discussed to reveal the influence of spray quality and convective delay time.
Comparison between gas burner and dual fuel burner
Figure 7 shows the FTFs of the gas burner and dual fuel burner in the NGp baseline operation point. The gas burner FTF is denoted by black circles. The dual fuel burner FTF is denoted by red square symbols. Amplitudes in the upper plot and the corresponding phases in the lower plot are given over the Strouhal number of the flame centre of gravity .
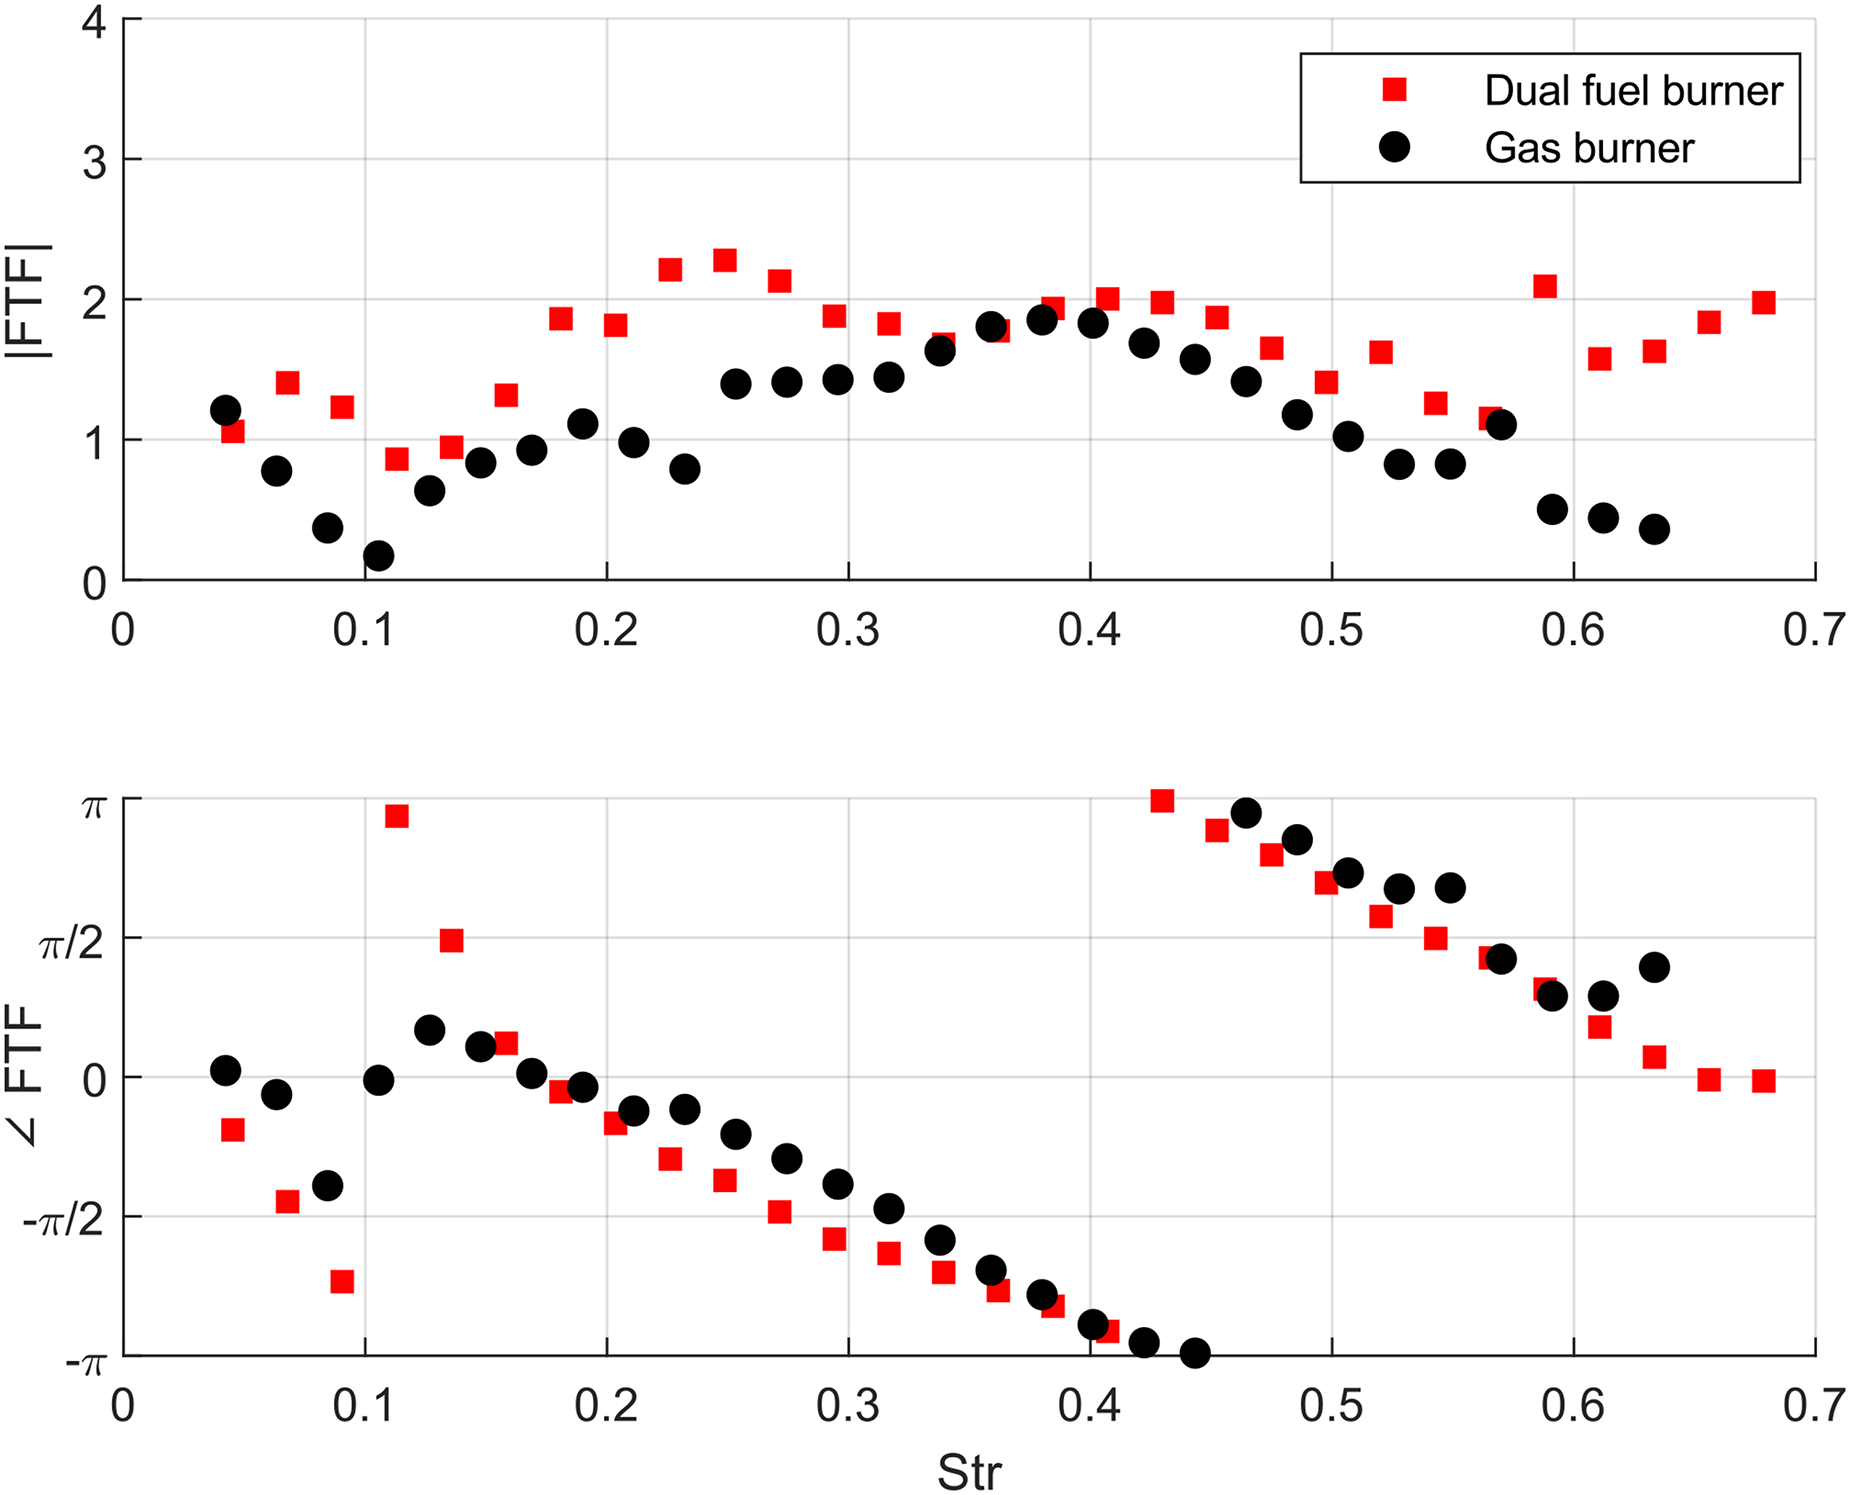
FTF Comparison for the gas and dual fuel burner in the NGp baseline operation point, = 0.675, = 25 (26.5) g/s.
Both curves show the typical features of perfectly premixed FTFs. For low frequencies, the phase extrapolates to at while the amplitude becomes , both indicating the presence of pure quasi-stationary thermal power modulations. The shape of both curves can be interpreted as the superposition of mass flow fluctuation and swirl fluctuation contributions. 13 At both curves have a local minimum of and a jump in the phase function which can be associated with a change in the dominant contribution from mass flow to swirl fluctuations. Except for the jump, the phase slope is linear which represents the constant convective time delay between burner exit and flame.
While the FTF for the gas burner is in very good agreement with data from previous work, 13 the FTF for the dual fuel burner has an increased amplitude between and with a local maximum at . This is very similar to the curves observed for leaner cases with an equivalence ratio of . 13 A possible explanation for this behaviour is that due to the atomizing air injection, the flame exhibits regions that are leaner than the global equivalence ratio at the central axis.
From these observations, two conclusions can be drawn:
The dual fuel burner does provide a typical perfectly premixed thermoacoustic behaviour and the configuration is therefore suitable for the systematic comparisons. The modifications of the burner geometry affect the flow field and thus the thermoacoustic properties of the flame. In order to minimize the number of potential influence factors in the decomposition, the presented approach of performing experiments for different configurations with the identical burner geometry is essential.
Comparison of kerosene, NGt and NGp operation
In Figure 8, FTFs for kerosene, NGt and NGp combustion are presented for the baseline operation point. First, the NGt case, which is denoted by black circles, is discussed and compared to the previously discussed NGp FTF to reveal the influence of the equivalence ratio fluctuations. The equivalence ratio fluctuations are expected to be dominant in the low and medium frequency range. 13 For , the amplitudes of and are close together and the phase is identical, indicating that as expected the equivalence ratio modulations are averaged out by dispersion and turbulent mixing at high frequencies. For the difference between and is significant and can be interpreted as the equivalence ratio fluctuation contribution. The gain of is higher than for the corresponding which indicates that the equivalence ratio fluctuations act as instability driving mechanism. In the low frequency range the phases of the two natural gas FTFs diverge. The NGt FTF has no local minimum and no phase jump at , resulting in a phase difference of between the two cases. The low frequency limit behaviour is and for which indicates the dominance of pure equivalence ratio fluctuations. These observations are in line with previous findings. 13
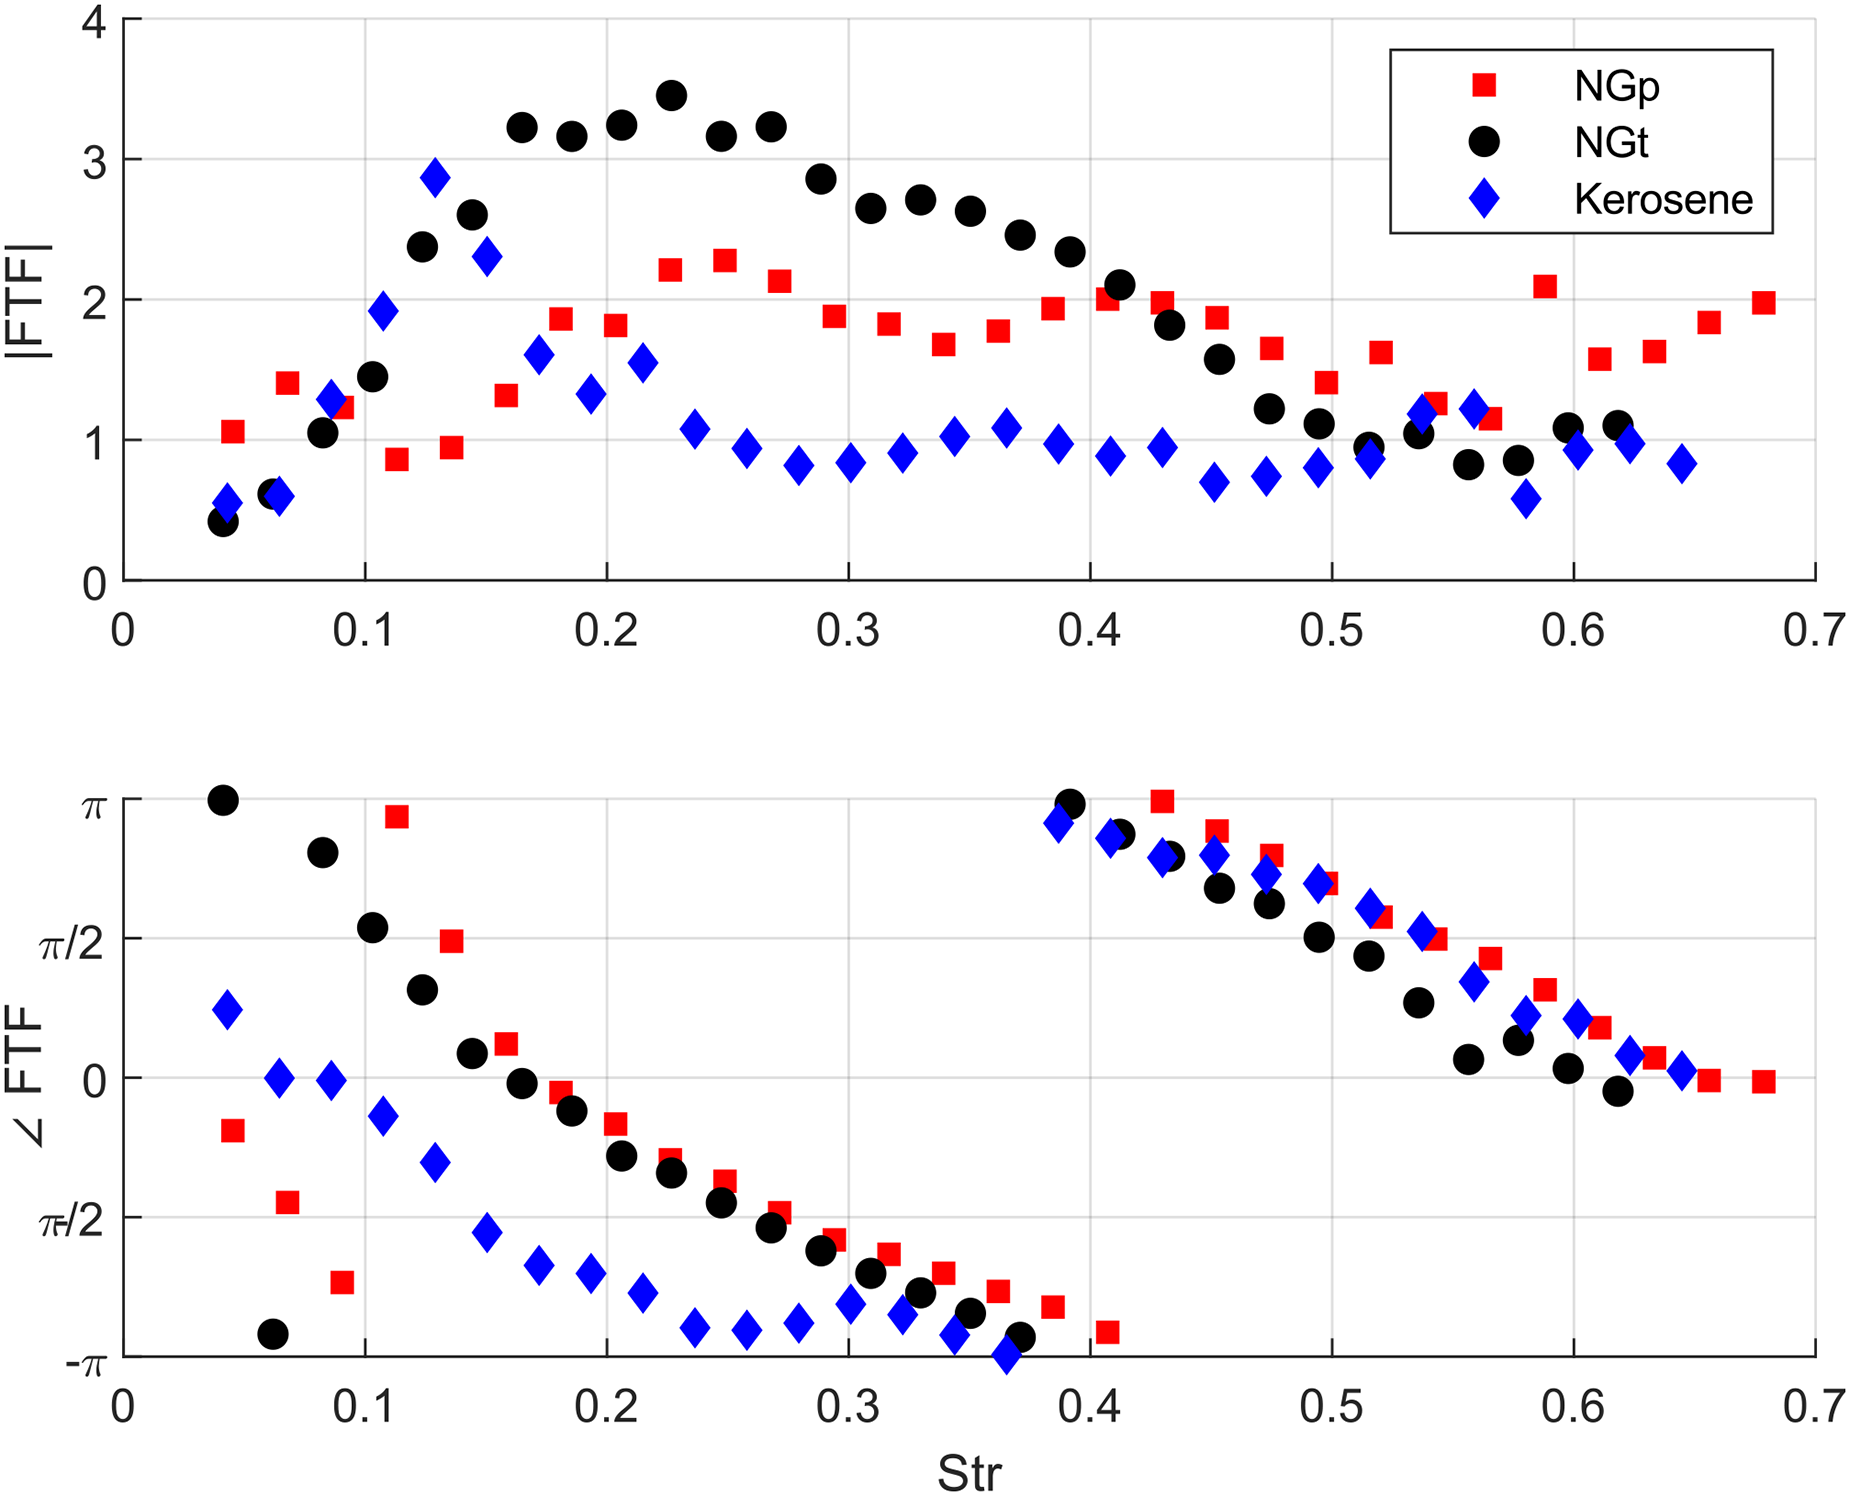
FTF comparison for NGp, NGt and kerosene in the baseline operation point, = 0.675, = 25 g/s.
The FTF for the kerosene baseline case is denoted by blue diamonds in Figure 8. The droplet characteristics can be identified from the phase function. As discussed before, the droplet movement leads to segregation of small droplets in regions with high velocity amplitudes while bigger droplets move with the average flow field and remain unaffected by small scale perturbations. The resulting flow field features equivalence ratio fluctuations as well as heat release modulations resulting in an expected phase function that lies between the NGp and NGt cases described above. As the ability of the droplets to follow the excitation scales inversely with the excitation frequency, the influence of the droplet characteristics is expected to be most prominent for low frequencies. The observed phase slope meets these theoretical expectations. Based on the slope, three different regions can be identified:
In the low frequency range for the phase differs by with respect to the two natural gas cases. For the phase slope therefore lies between the two natural gas cases.
For all three cases converge and, similar to the equivalence ratio fluctuations, no influence of the droplets is recognizable. Here, the droplets cannot follow the excitation.
In the range between and the phase function exhibits a plateau. This can be interpreted as a transition range where with increasing excitation frequency, an increasingly smaller share of the droplets can follow the excitation. Therefore, the FTF contribution driven by the droplet dynamics decays with increasing excitation frequency and the FTF gradually approaches the characteristic gas behaviour.
The kerosene FTF amplitude shows a distinct peak in the range between and which can be explained by a frequency-dependent flame modulation as discussed in the following. Figure 9a) shows the deviation of the excited flame from the stationary mean for the kerosene baseline case. Images are plotted in the range of . The 50% OH* intensity isocontour of the stationary flame is added to all images as a reference. It can be seen that in the frequency range of the observed FTF peak, the OH* intensity in the outer radial regions drops significantly, indicated by blue regions. At the same time, the OH* intensity at the middle axis increases, especially at the flame root. This means that the acoustic excitation leads to a radial contraction and axial upstream movement of the mean flame. The maximum deviation is in the order of 7.5% of the maximum OH* intensity. The flame modulation coincides with a maximum in the relative velocity forcing amplitude which is shown in Figure 9b).
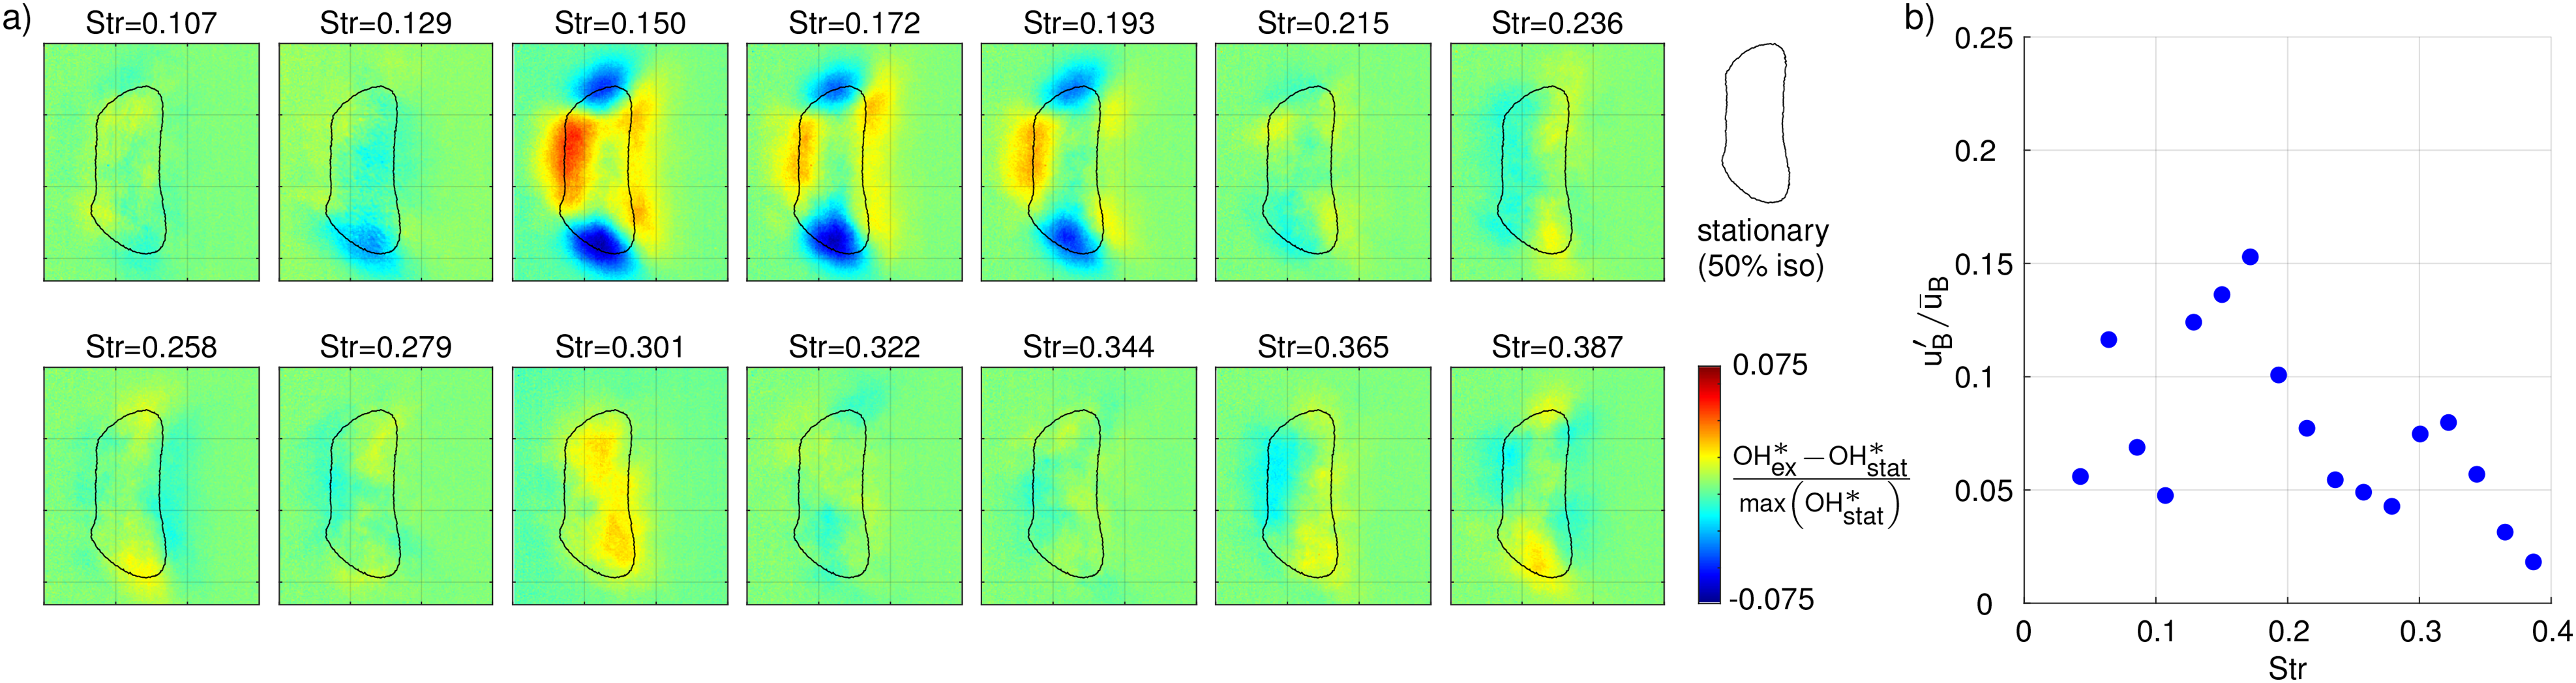
Flame modulation in the kerosene baseline operation point, = 0.675, = 25 g/s: a) Deviation of the excited mean flame images from the stationary mean, b) Relative velocity forcing amplitude.
The effect is not restricted to kerosene flames but is less distinct for flames with a lower radial extension like the two natural gas baseline cases. However, in the lean NGt case, shown in Figure 10, the flame modulation is clearly visible. Note that due to the high acoustic forcing amplitude, the colorbar range of the flame deviation is changed. The flame modulation maximum at again coincides with a maximum in the relative velocity forcing amplitude . The modulation level is even higher than in the kerosene case, proving that the discussed effect depends on the flame structure rather than the fuel type.
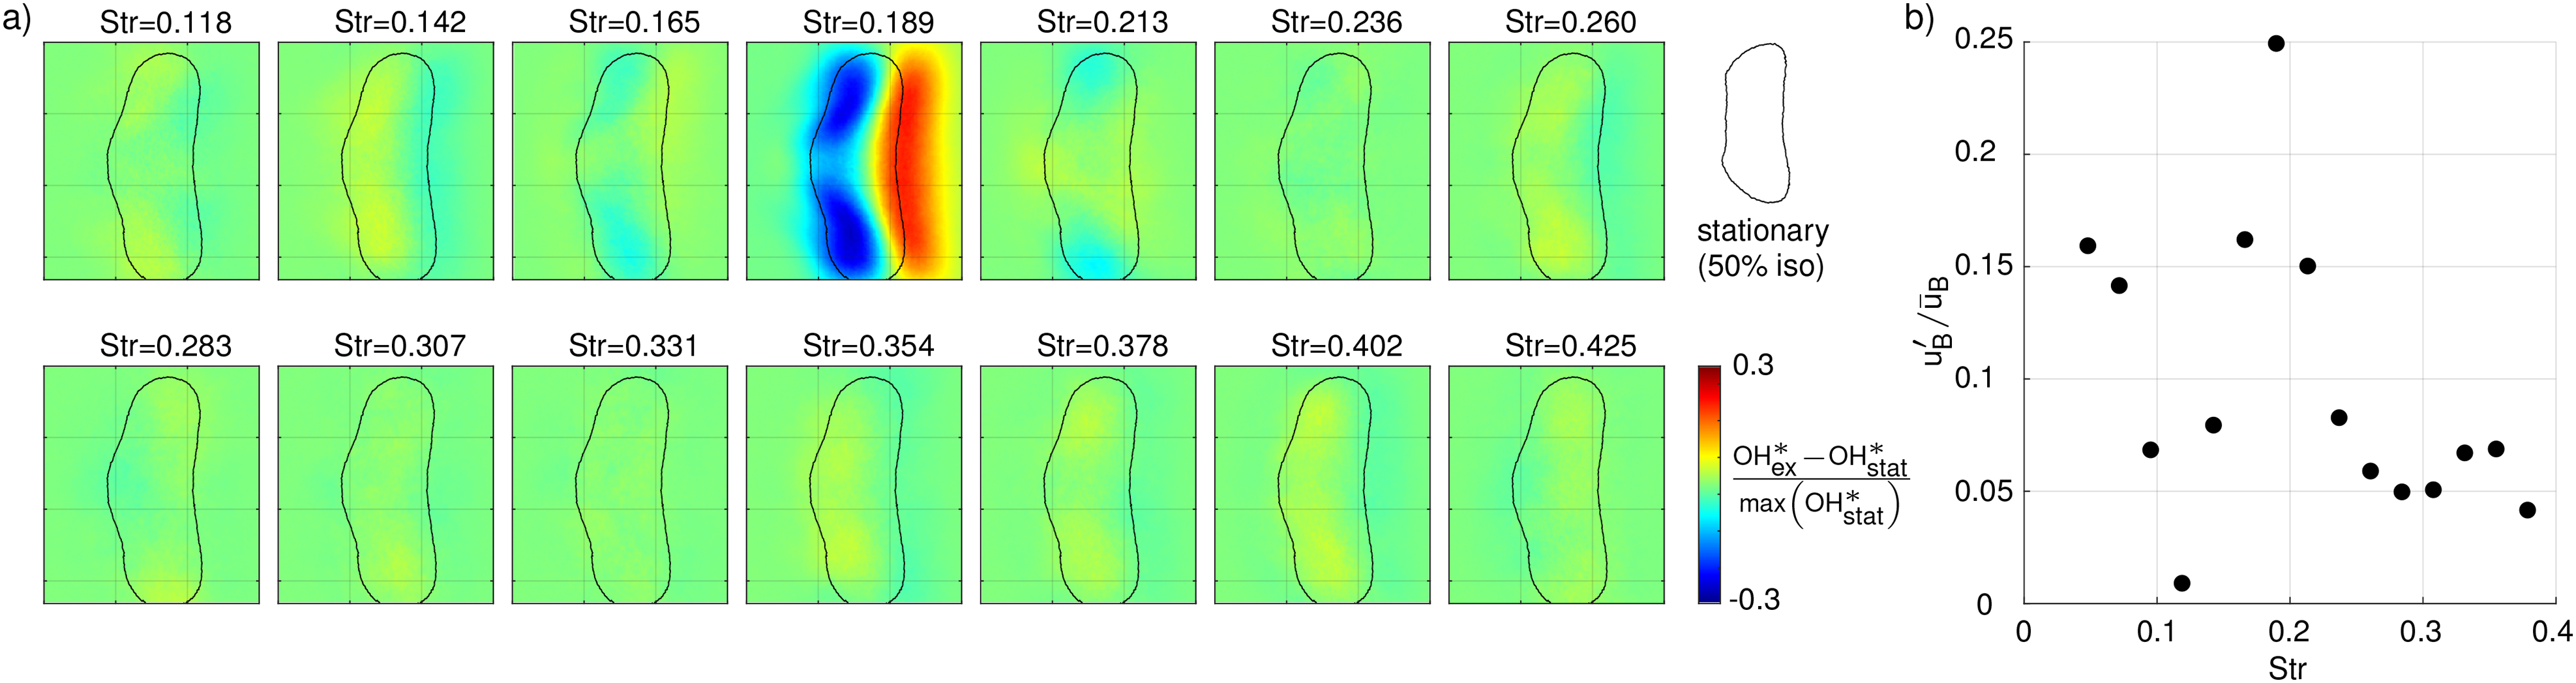
Flame modulation in lean NGt operation, = 0.575, = 25 g/s: a) Deviation of the excited mean flame images from the stationary mean, b) Relative velocity forcing amplitude.
Equivalence ratio and air mass flow variation in kerosene operation
The rest of this section is focused on kerosene operation. FTFs for a parametric variation of equivalence ratio and main air mass flow are presented and the impact of droplet quality and convective time delay on the FTFs is discussed.
Figure 11 shows the resulting FTFs for three different equivalence ratios , and . Because the ratio of main and atomizing air flow is fixed, a variation of the equivalence ratio at constant main air mass flow leads to a change in the evaporation quality at the fuel injection nozzle outlet. The lean case denoted by red squares provides the best atomization quality while the rich case which is denoted by blue diamonds has the lowest atomizing quality and thus provides the biggest droplet size. The influence of the droplet dynamics can therefore be expected to be highest in the blue curve while the red curve is expected to act similar to a technically premixed natural gas flame.
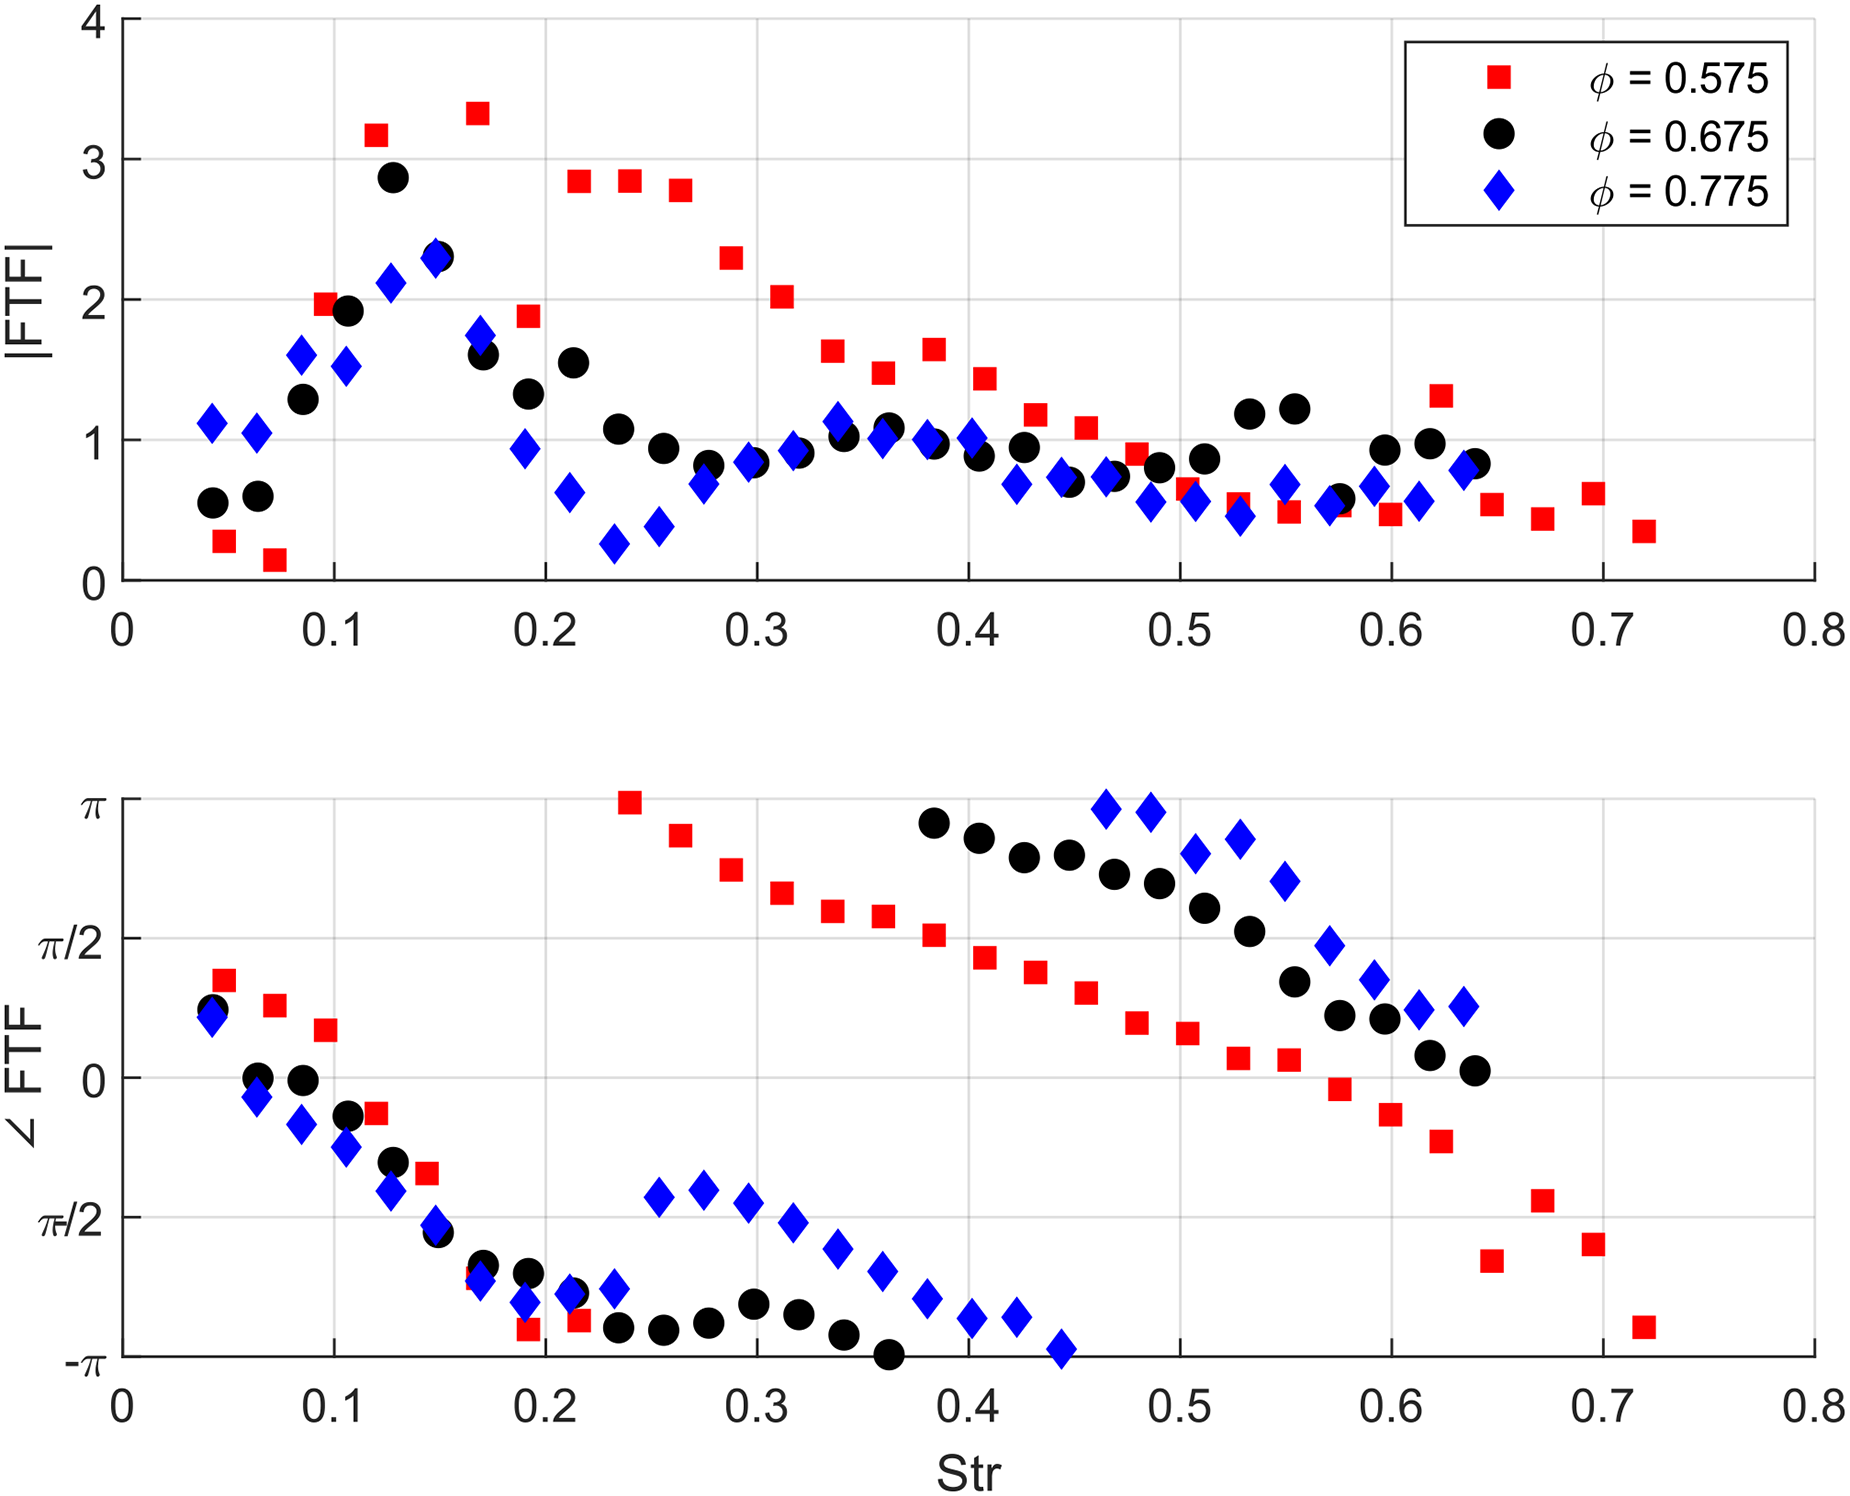
FTF comparison for equivalence ratio variation = 0.575, = 0.675, = 0.775 at constant air mass flow = 25 g/s in kerosene operation.
Both cases are discussed in comparison to the baseline case and the three different regions that were identified in the baseline FTF discussion.
The phase plot of Figure 11 shows that in the low frequency range for all three curves collapse. This indicates that in this region, the droplets react to the excitation identically. Starting from , where the droplet dynamics driven flame response contribution decays, the three curves start to differ. The lowest atomization quality case has a sharp local amplitude minimum associated with a phase jump at . Except for the jump, the phase slope is linear. This indicates that only the high and low frequency range are present and the previously discussed gradual decay of the droplet dynamic contribution has narrowed down to a jump. The finest droplet case has a linear phase loss without jump over the entire frequency range. The amplitude remains at high values and only slowly decays, beginning from , similar to the behaviour of the technically premixed natural gas flame from the baseline case comparison.
When the three cases are compared, it can be concluded that the droplet size has a high impact on the FTF at medium frequencies. Poor atomization leads to an early transition from droplet-dominated to droplet-independent behaviour while for high atomization quality, the FTF is similar to a technically premixed flame over the entire frequency range.
The second investigated variation parameter is the convective time delay between nozzle exit and flame. The main air mass flow is varied at constant equivalence ratio. Because, as discussed in the stationary analysis, the flame position remains constant for the different investigated mass flow rates, an increased convective air mass flow leads to reduced residence times between fuel injection and flame and vice versa. The low air mass flow case provides the longest convection time whereas in the high air mass flow case, the residence times are shortest. However, from the analysis, it is known that the fuel is always pre-evaporated and therefore the convective time delay between nozzle exit and flame exceeds the droplet evaporation time in all cases.
From previous work 13 it is known that for natural gas combustion, the FTFs for a mass flow variation fall together if plotted over . The measured FTFs presented in Figure 12 show that this is also true for the kerosene case. The phases for the three curves fall together over the entire frequency range and do not split up after the transition region between and . The amplitude peak related to the flame modulation is clearly visible in all three cases. For low mass flows, the peak is marginally lower, but for the baseline and high mass flow case, the two curves match very well over the entire frequency range. It can therefore be concluded that a variation of the convective delay time does not have a significant effect on the FTF as long as it exceeds the droplet evaporation time.
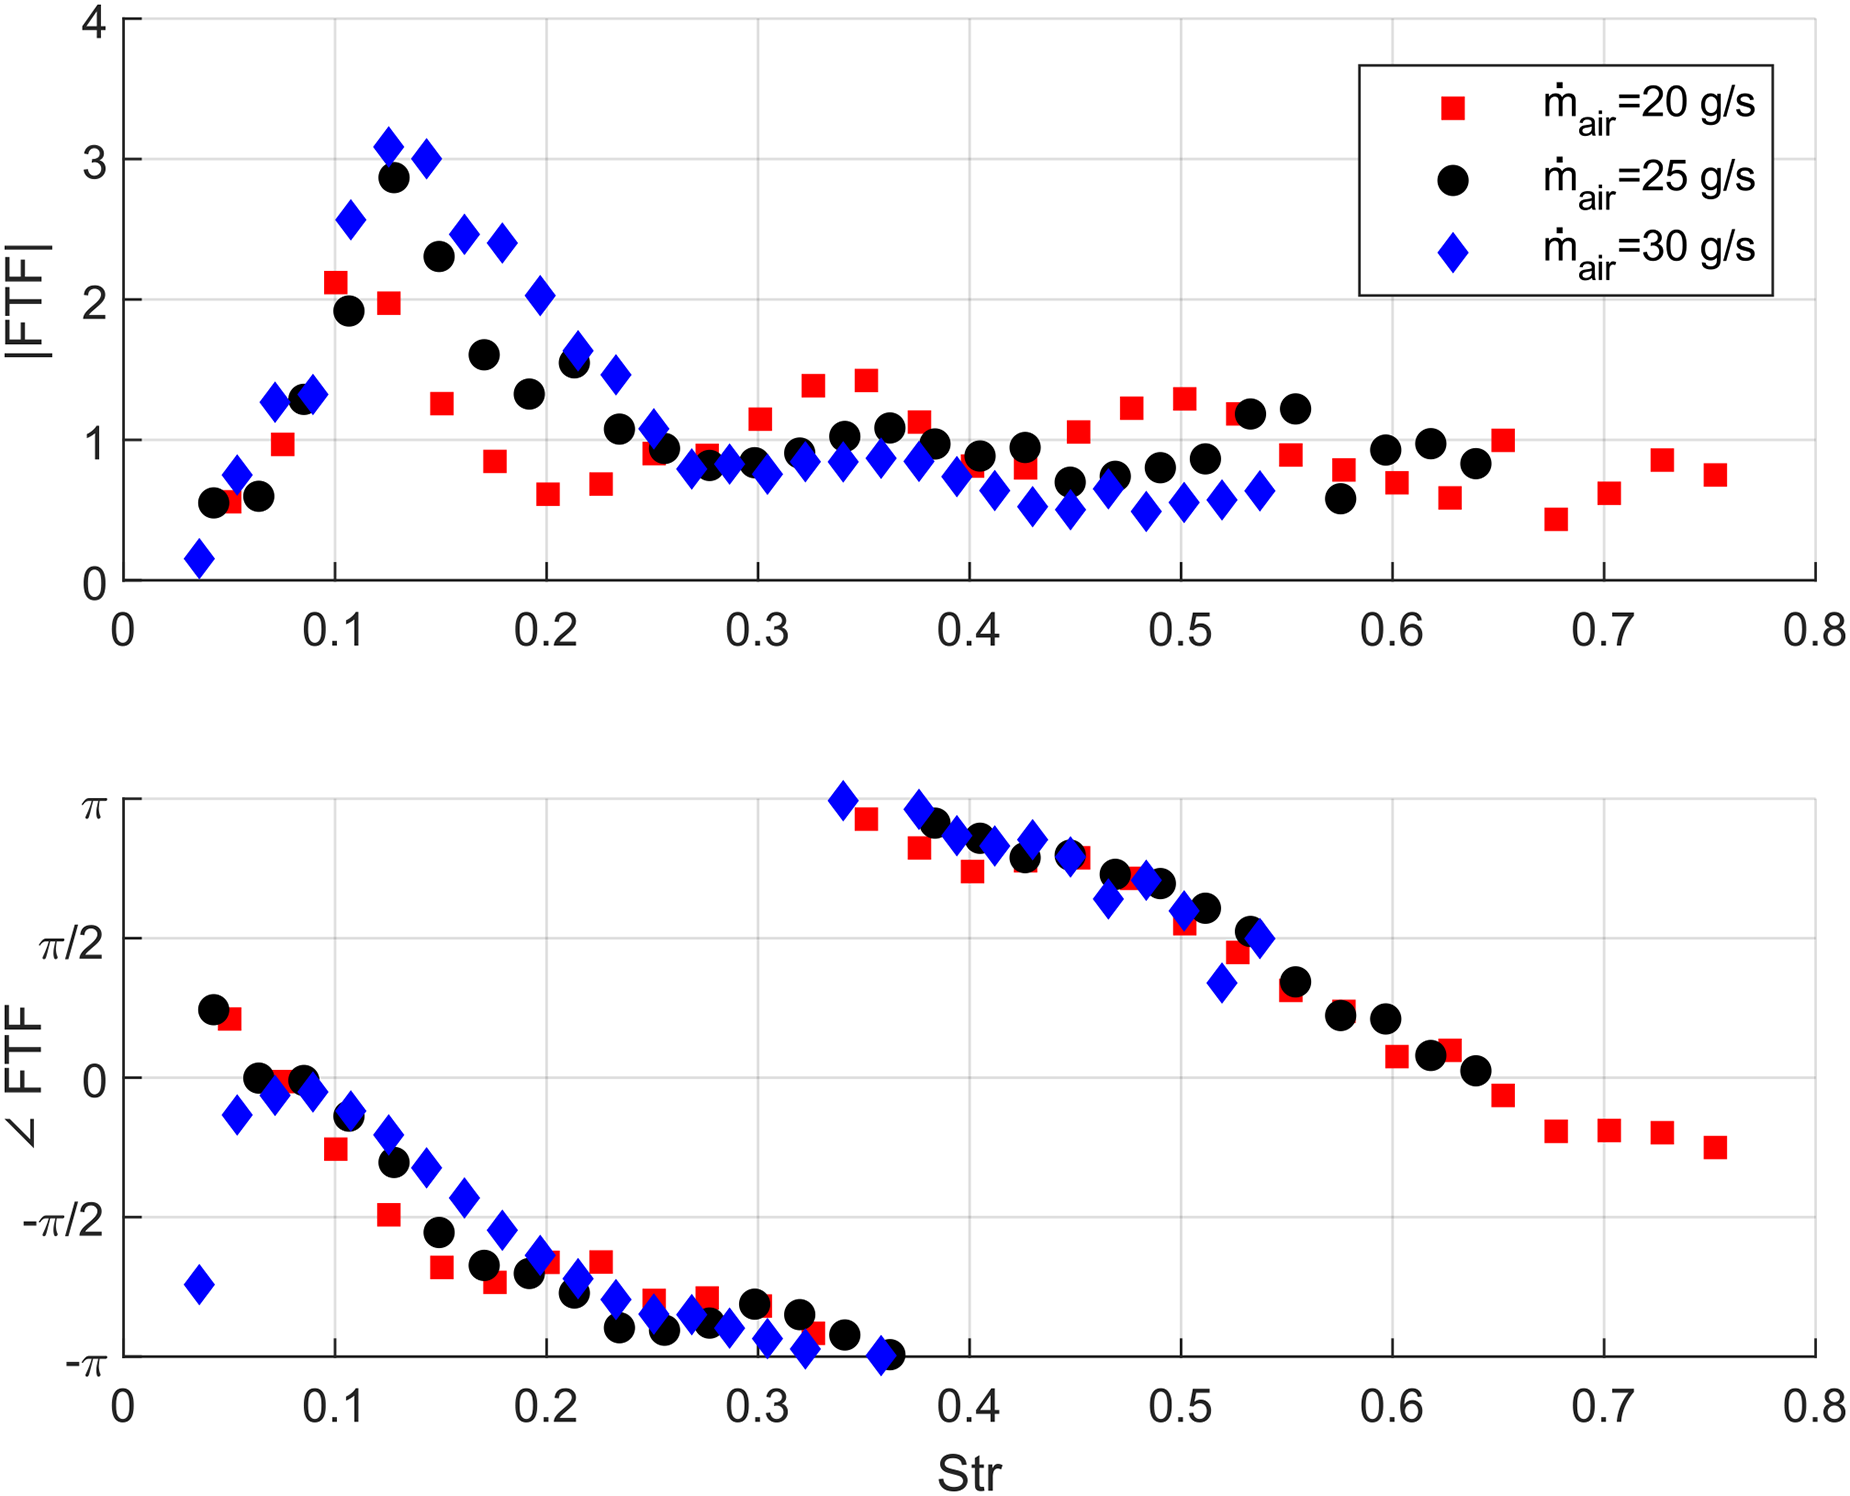
FTF comparison for main air mass flow variation = 20 g/s, = 25 g/s, = 30 g/s at constant equivalence ratio = 0.675 in kerosene operation.
Conclusion and outlook
In the present study, a method for experimentally decomposing the influence factors of flame transfer functions was presented and applied to liquid fuel combustion. By systematically comparing the different FTFs, the influence of equivalence ratio fluctuations and droplet dynamics could be decomposed. The following qualitative conclusions about the influence of droplets on the FTF could be drawn:
Droplets act as a lowpass on the FTF. The frequency range in which the droplets have an impact on the FTF can be identified from the phase slope. The spray quality has a notable impact on the FTF. Coarser sprays lead to an earlier transition from droplet-dominated to droplet-independent behaviour while for finer sprays the FTF is similar to a technically premixed flame. The convective time delay between injection and flame has a negligible effect on the FTF as long as the fuel arrives at the flame in a fully evaporated state.
Future work intends to experimentally determine the droplet size spectrum in order to verify the conclusions drawn in this paper and thereby validate the decomposition approach. Furthermore, measurements with lower acoustic forcing are planned in order to assess the purely linear flame dynamics.
Footnotes
Acknowledgements
The investigations were conducted as part of the joint research programme ECOFlex-turbo in the frame of AG Turbo. The authors gratefully acknowledge AG Turbo and GE Power for their support.
Declaration of Conflicting Interests
The author(s) declared no potential conflicts of interest with respect to the research, authorship, and/or publication of this article.
Funding
The work was supported by GE Power and the Federal Ministry for Economic Afairs and Energy (BMWi) as per resolution of the German Federal Parliament under Grant No. 03ET7071U.