
Abstract
Background:
While prostate biopsy is the standard diagnostic approach for Prostate Imaging-Reporting and Data System (PI-RADS) 4–5 lesions, some of these biopsies yield negative results.
Objective:
To determine the optimal minimum apparent diffusion coefficient (ADCmin) and prostate-specific antigen density (PSAD) threshold and develop a quantitative diagnostic standard that would enhance the diagnostic accuracy.
Design and methods:
The study included 361 patients who met the criteria and had undergone prostate biopsy between January 2021 and December 2024. Comprehensive clinical information was collected. Following the standardization of the region of interest protocol, apparent diffusion coefficient was measured for all PI-RADS 4–5 lesions. Univariate and multivariate logistic regression analyses were employed to identify independent predictors, and diagnostic efficacy was assessed using receiver operating characteristic curves and the area under the curve (AUC).
Results:
Of the 361 patients, 252 (69.8%) were diagnosed with clinically significant prostate cancer (csPCa), and 109 (30.2%) were diagnosed with clinically insignificant prostate cancer and non-prostate cancer. Multivariate analysis revealed PSAD and ADCmin to be independent predictors of csPCa. The AUC values of PSAD and ADCmin for diagnosing csPCa were 0.797 (95% CI: 0.751–0.837) and 0.777 (95% CI: 0.731–0.819), respectively. Applying the criterion of “PSAD ⩾ 0.35 ng/mL2 and ADCmin < 0.575 × 10⁻³ mm2/s” was found to have a high positive predictive value (94.2%) and a high specificity (91.7%) for csPCa in PI-RADS 4–5 lesions. Applying the criterion of “PSAD ⩾ 0.35 ng/mL2 or ADCmin < 0.575 × 10⁻³ mm2/s” substantially increased the negative predictive value for csPCa to 80.0% for PI-RADS 5 lesions.
Conclusion:
The results demonstrate that the ADCmin exhibits high diagnostic accuracy for detecting csPCa in patients with PI-RADS 4–5 lesions. Furthermore, diagnostic criteria were established for patients based on PSAD and ADCmin to aid in clinical decision-making regarding prostate biopsy.
Keywords
Introduction
Prostate cancer (PCa) is the most prevalent malignancy among men and the second leading cause of cancer-related deaths globally in 2024. 1 Current European Association of Urology guidelines recommend prostate biopsy for patients with elevated prostate-specific antigen (PSA) levels or abnormal digital rectal examination (DRE) findings. 2 However, combined DRE and PSA screening detects PCa in only approximately 3% of screened men. 3 Evidence indicates that the Prostate Imaging-Reporting and Data System (PI-RADS) version 2.1, 4 utilizing multiparametric magnetic resonance imaging (mpMRI), significantly improves clinical decision-making for diagnosing clinically significant prostate cancer (csPCa) in patients with suspicious lesions. 5
The PI-RADS steering committee recommends targeted biopsy for lesions categorized as PI-RADS 4 and 5. 6 However, prostate biopsy results exhibit a certain proportion false-positive rates. 7 Research indicates positive predictive values (PPVs) for csPCa confirmed by biopsy of 40% and 69% for PI-RADS 4 and 5 lesions, respectively. 8 This implies that a clinically relevant proportion of patients with elevated PI-RADS scores present with benign pathology. A recent surgical-pathology correlation study reaffirmed the high accuracy of mpMRI for PI-RADS > 3 lesions, while noting that approximately 50% of csPCa foci may be invisible on imaging. 9 These individuals undergo the inherent risks of biopsy procedures. yet to date, clinically validated biomarkers capable of reliably discriminating such cases remain elusive. The apparent diffusion coefficient (ADC), a quantitative metric obtained from diffusion-weighted imaging sequences, 10 indicates the extent to which water molecules are restricted in biological tissues. 11 Studies confirm that minimum ADC (ADCmin), mean ADC (ADCmean), and ADC ratio (ADCratio) contribute to prostate cancer detection. 12 Nevertheless, evidence regarding the diagnostic utility of ADC-derived metrics for discriminating csPCa in PI-RADS 4–5 lesions remains unestablished, partly due to inconsistent region of interest (ROI) delineation standards. Therefore, this study aims to investigate the diagnostic value of ADC parameters in patients with PI-RADS 4–5 lesions.
This study established and validated optimal ADCmin and prostate-specific antigen density (PSAD) cut-off values to develop a diagnostic criterion framework for patients with PI-RADS 4–5 lesions, aiming to optimize the diagnostic value of ADCmin for csPCa in this population.
Methods
Study design and population
This single-center retrospective study analyzed clinical data from 1444 consecutive patients who underwent prostate biopsy at the Urology Department of the First Affiliated Hospital of USTC between January 2021 and December 2024. A total of 1083 patients (75.0%) were excluded. The final cohort comprised 361 patients (25.0%). Inclusion criteria were as follows: (1) underwent biparametric magnetic resonance imaging (bpMRI) examination due to elevated PSA level and/or abnormal digital rectal examination findings; (2) presence of one or more PI-RADS category 4 or 5 lesions as independently assessed by two radiologists according to PI-RADS v2.1 guidelines; (3) subsequent transperineal prostate biopsy with systematic and targeted sampling; and (4) complete clinical records and pathological data available. Exclusion criteria were as follows: (1) no bpMRI performed or bpMRI performed at an external institution with unavailable images for review; (2) poor image quality of bpMRI precluding reliable ADC measurement; (3) repeated prostate biopsy during the study period; (4) serum total PSA level > 100 ng/mL; (5) PI-RADS category 1–3 lesions. This study was reported in accordance with the reporting of studies of diagnostic accuracy (STARD 2015) guidelines. 13
bpMRI and PI-RADS assessment
bpMRI was performed using two 3.0 T Siemens Healthineers scanners (Magnetom Vida and TrioTim; Erlangen, Germany), following protocols detailed in our prior publication. All examinations utilized a body phased-array receiver coil without endorectal coil assistance. Standardized sequences included sagittal, coronal, and axial T2-weighted imaging (T2WI); axial T1-weighted imaging (T1WI); and axial diffusion-weighted imaging (DWI) with ADC maps (b-values: 50, 800, and 1500 s/mm2). Two radiologists with over 5 years of experience in PCa diagnosis reviewed all images independently. Unaware of any clinical information, the reviewers assessed the same set of magnetic resonance imaging (MRI) images at different times to assign PI-RADS scores to lesions. Using the PI-RADS v2.1 guidelines, they assessed lesions on a five-point scale for csPCa correlation, with consensus resolution for discrepant interpretations. 14
Quantitative analysis of ADC metrics in bpMRI
Abnormal prostate lesions were initially identified through comprehensive assessment of T2WI, DWI, and ADC maps (Figure 1). This study exclusively enrolled patients with PI-RADS 4–5 lesions. For cases with multiple lesions, the index lesion was selected based on the highest clinical significance, defined as either the lesion with the maximal PI-RADS score or largest cross-sectional diameter. Prostate volume (PV) was calculated using the ellipsoid formula: volume = (anteroposterior diameter × longitudinal diameter × transverse diameter) × 0.52. 14 Lesions were classified as peripheral zone or transition zone. ADC values were quantified using a monoexponential model with b-values of 50 and 800 s/mm2. For ADCmean, lesion boundaries were manually delineated using polygonal ROIs on ADC maps, carefully aligned with the inner margin to exclude adjacent normal tissue. ADCmin and ADCmax were measured by placing circular ROIs (10–30 mm2) in areas of lowest and highest signal intensity within lesions, respectively. Normal ADC values were obtained from mirror elliptical ROIs in contralateral normal-appearing tissue matching lesion size. Derived parameters included ADCratio (ADCmean/ADCnormal) and ADCrange (ADCmax − ADCmin). 15

Measurements of different ADC values. (a) T2WI maps, (b) DWI maps, and (c) ADC maps and measurements of different ADC values, including ADCmean (green circle), ADCmin (orange circle), ADCmax (cyan circle), and ADCnormal (blue circle).
Prostatic biopsy, diagnostic benchmark, and study endpoints
Transperineal prostate biopsy was performed under transrectal ultrasound guidance. The procedure comprised two components: systematic biopsy in all patients followed by cognitive fusion-targeted biopsy of MRI-suspicious lesions. Histopathological evaluation employed the 2014 International Society of Urological Pathology (ISUP) revised Gleason grading system. 16 Biopsy pathology served as the diagnostic reference standard. The primary endpoint was csPCa, defined as Gleason score ⩾3 + 4 (ISUP grade ⩾2). Any grade prostate cancer (agPCa) was defined as Gleason score ⩾ 3 + 3 (ISUP grade ⩾ 1). Clinically insignificant prostate cancer (cisPCa) was defined as Gleason score = 6 (ISUP grade = 1).
Statistical analysis
Continuous variable normality was evaluated via the Shapiro–Wilk test. Variables conforming to normal distribution appeared as mean ± standard deviation (SD), with between-group analyses executed through Student’s t-test. For non-normally distributed continuous variables, median and interquartile range (IQR) were reported, while Mann–Whitney U testing examined intergroup differences. Categorical variables are appeared as frequencies (percentages), compared via chi-square testing. Correlation coefficients were derived from Spearman’s rank analysis. Independent predictors of PCa diagnosis were identified through univariate and multivariate logistic regression, with odds ratios (OR) and 95% confidence intervals (CIs) computed for all variables. Receiver operating characteristic (ROC) curve analysis evaluated diagnostic performance, incorporating area under the curve (AUC) calculations. Optimal thresholds were established using the Youden index. Performance metrics for diagnostic criteria including sensitivity, specificity, PPV, and negative predictive value (NPV) were quantified. IBM SPSS 25.0 (Armonk, NY, USA) facilitated statistical procedures, while MedCalc 18.9.1 (Ostend, Belgium) generated and compared ROC curves. Statistical significance thresholds were set at p < 0.05 (two-tailed).
Results
Characteristics of 361 patients
Among 1444 consecutive patients undergoing prostate biopsy between January 2021 and December 2024, 361 met inclusion criteria (Supplemental Figure 1). The cohort comprised 252 (69.8%) csPCa cases and 109 (30.2%) with cisPCa or benign pathology (non-csPCa group). Significant intergroup differences emerged (Table 1): total prostate-specific antigen (tPSA; non-csPCa: 11.74 vs csPCa: 21.43 ng/mL; p < 0.001), PV (44.54 vs 36.34 mL; p < 0.001), and PSAD (0.26 vs 0.64 ng/mL2; p < 0.001). ADC parameters also differed significantly: ADCmin (0.668 vs 0.489 × 10⁻³ mm2/s; p < 0.001) and ADCratio (0.579 vs 0.504; p = 0.001). Among the 361 patients, 159 (44.0%) were classified as PI-RADS 4 lesions, and 202 (56.0%) as PI-RADS 5 lesions. Subsequent analysis revealed statistically significant disparities in tPSA, PV, PSAD, and ADC-related parameters between the total population and the PI-RADS 4 and 5 lesions subgroups (Supplemental Table 1).
Characteristics of the 361 eligible patients with different diagnoses.
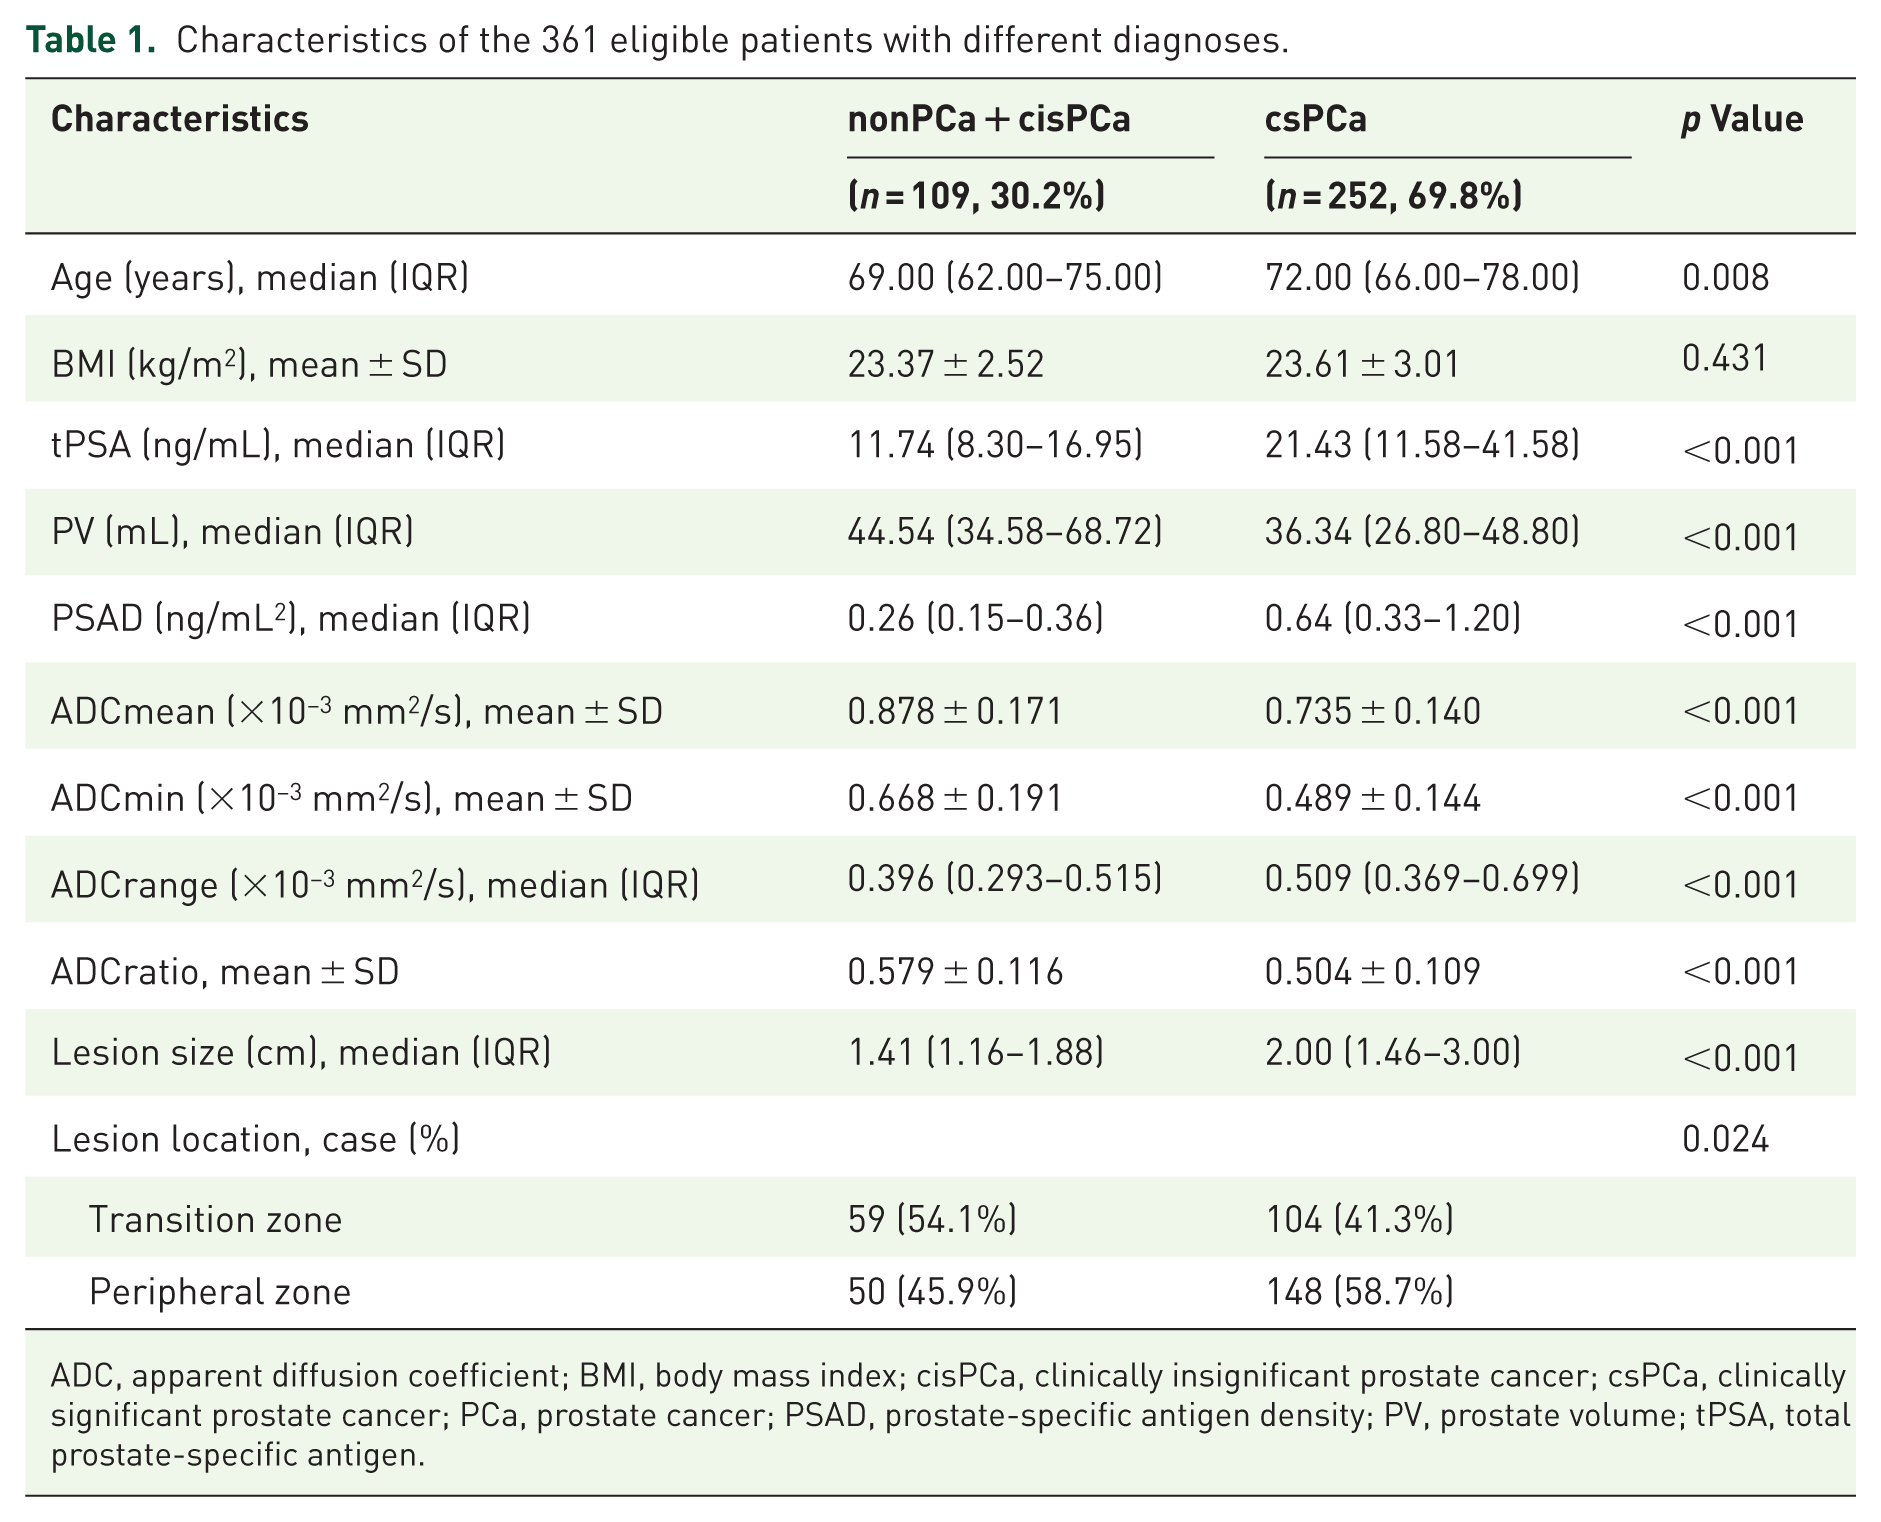
ADC, apparent diffusion coefficient; BMI, body mass index; cisPCa, clinically insignificant prostate cancer; csPCa, clinically significant prostate cancer; PCa, prostate cancer; PSAD, prostate-specific antigen density; PV, prostate volume; tPSA, total prostate-specific antigen.
Efficacy of clinical factors in the diagnosis of csPCa
ROC curves evaluated the diagnostic performance of tPSA, PV, PSAD, ADCmean, ADCmin, and ADCratio for detecting csPCa in the overall cohort and PI-RADS 4/5 subgroups (Figure 2). In the total population, PSAD demonstrated the highest diagnostic accuracy (AUC = 0.797, 95% CI: 0.751–0.837), with 73.81% sensitivity and 74.31% specificity. ADCmin showed comparable efficacy (AUC = 0.777, 95% CI: 0.731–0.819; sensitivity 74.6%, specificity 70.6%), outperforming tPSA (AUC = 0.722, 95% CI: 0.673–0.767), PV (AUC = 0.654, 95% CI: 0.602–0.703), ADCmean (AUC = 0.746, 95% CI: 0.698–0.790), and ADCratio (AUC = 0.695, 95% CI: 0.644–0.742; Table 2). In the subgroups of patients with PI-RADS 4 lesions and PI-RADS 5 lesions, ADCmin demonstrated a favorable capacity for detecting csPCa, with AUC values of 0.698 (95% CI: 0.620–0.768) and 0.805 (95% CI: 0.744–0.858) in patients with PI-RADS 4 and 5 lesions, respectively (Supplemental Tables 2 and 3). PSAD demonstrated comparable diagnostic efficacy, with AUC of 0.754 (95% CI: 0.680–0.819) and 0.754 (95% CI: 0.689–0.812), respectively. These results suggest that PSAD and ADCmin exhibit favorable diagnostic performance for csPCa.

ROC curves comparing different diagnostic parameters for the detection of csPCa. (a) ROC curves for csPCa detection showing the diagnostic performance of tPSA (black line), prostate volume (green line), PSAD (orange line), ADCmean (yellow line), ADCmin (pink line), and ADCratio (blue line). (b) ROC curves for csPCa detection in patients with PI-RADS 4 using the same parameters. (c) ROC curves for csPCa detection in patients with PI-RADS 5 using the same parameters.
Diagnostic performances of the clinical variables for csPCa.

ADC, apparent diffusion coefficient; AUC, area under curve; BMI, body mass index; CI, confidence interval; csPCa, clinically significant prostate cancer; NA, not applicable; PSAD, prostate-specific antigen density; PV, prostate volume; tPSA, total prostate-specific antigen.
The role of lesion location in the diagnostic evaluation
To evaluate whether lesion location influenced diagnostic efficacy, we performed subgroup analysis that revealed distinct diagnostic performance for PSAD and ADCmin in detecting csPCa (Figure 3). Overall, PSAD demonstrated consistently high and stable diagnostic performance across both peripheral zone (PZ) and transition zone (TZ) lesions (Supplemental Tables 4 and 5), with AUCs of 0.788 and 0.797, respectively, indicating its reliability as a universal marker independent of anatomical location. In contrast, ADCmin showed superior diagnostic efficacy in the PZ (AUC 0.827) compared to the TZ (AUC 0.730). Within PI-RADS subgroups, PSAD maintained robust and comparable AUCs in both zones for both PI-RADS 4 (PZ 0.748, TZ 0.760) and PI-RADS 5 lesions (PZ 0.743, TZ 0.761). ADCmin, however, exhibited notable variation: it performed excellently in PZ lesions across all PI-RADS categories, particularly in PI-RADS 5 where its AUC reached 0.875, but its performance was more modest in TZ lesions, especially for PI-RADS 4 where the AUC decreased to 0.639.

ROC curves comparing the diagnostic performance of PSAD and ADCmin for the detection of csPCa in different prostate zones. (a–c) Diagnostic performance of PSAD and ADCmin for csPCa in the peripheral zone: all patients, PI-RADS 4 lesions, and PI-RADS 5 lesions and (d–f) diagnostic performance of PSAD and ADCmin for csPCa in the transition zone: all patients, PI-RADS 4 lesions, and PI-RADS 5 lesions.
Independent predictors for the detection of csPCa
Univariate and multivariate logistic regression analyses identified significant predictors of csPCa (Table 3). Univariate analysis revealed associations between csPCa and tPSA, PV, PSAD, ADCmean, ADCmin, ADCrange, ADCratio, lesion size, and lesion location (p < 0.05). Age and body mass index (BMI) showed no significant association (p > 0.05). Before multivariate analysis, Spearman’s correlation analysis demonstrated significant collinearity: PSAD correlated with tPSA (p < 0.001, r = 0.818) and PV (p < 0.001, r = −0.432), while ADCmin correlated with ADCmean (p < 0.001, r = 0.784), indicating collinearity issues among the variables (Supplemental Figure 2). Given that the AUC of PSAD was higher than those of tPSA and PV in patients with csPCa, the AUC of ADCmin was higher than ADCmean. Based on the collinearity assessment and their lower individual diagnostic performance, tPSA, PV, and ADCmean were excluded from the final multivariate model. Multivariate analysis identified PSAD (OR: 8.391, 95% CI: 3.312–21.262, p < 0.001) and ADCmin (OR: 0.008, 95% CI: <0.001–0.090, p < 0.01) as independent csPCa predictors. ADCrange, ADCratio, lesion size, and location lost significance in the multivariate model. Subgroup analyses confirmed PSAD and ADCmin as consistent independent predictors across PI-RADS 4 and 5 cohorts (Supplemental Tables 6 and 7).
Univariate and multivariate analysis for screening the independent predictors of csPCa.
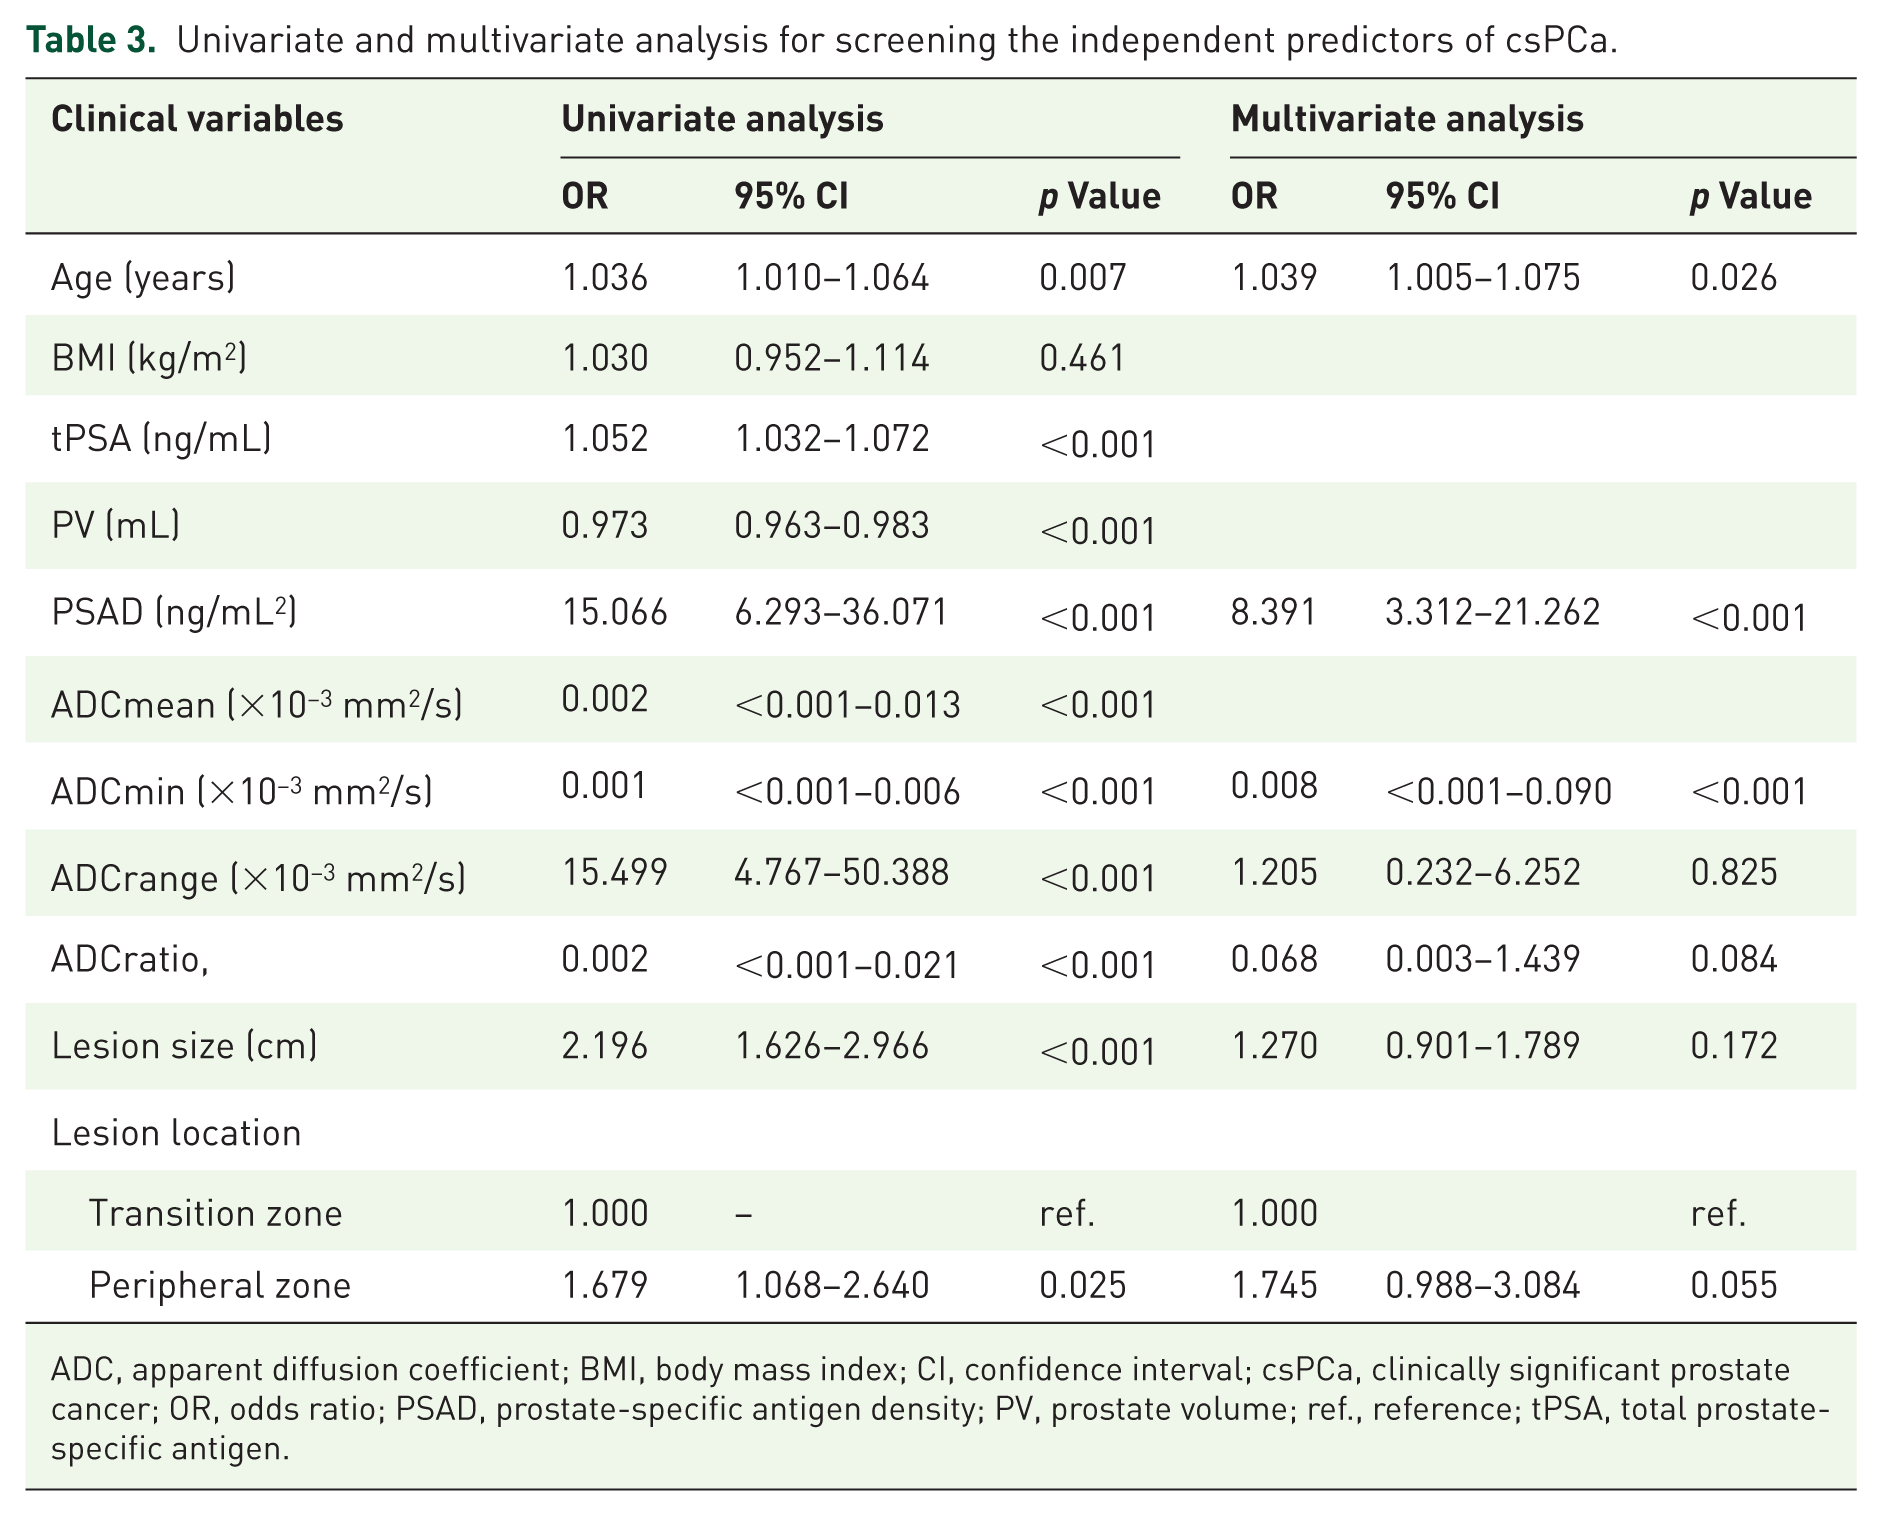
ADC, apparent diffusion coefficient; BMI, body mass index; CI, confidence interval; csPCa, clinically significant prostate cancer; OR, odds ratio; PSAD, prostate-specific antigen density; PV, prostate volume; ref., reference; tPSA, total prostate-specific antigen.
Ideal threshold value determination and diagnostic evaluation
The diagnostic performance of PSAD and ADCmin in patients with PI-RADS 4–5 lesions was examined, and it was confirmed that PSAD and ADCmin are independent predictors of csPCa. Youden index analysis established optimal thresholds: PSAD = 0.35 ng/mL2 and ADCmin = 0.575 × 10⁻³ mm2/s. Consequently, two diagnostic criteria were defined: Criterion 1: “PSAD ⩾ 0.35 ng/mL2 and ADCmin < 0.575 × 10⁻³ mm2/s”; Criterion 2: “PSAD ⩾ 0.35 ng/mL2 or ADCmin < 0.575 × 10⁻³ mm2/s.” The diagnostic efficacy of these markers for csPCa and agPCa was evaluated based on the established diagnostic criteria (Table 4). Criterion 1 achieved: 94.2% PPV and 91.7% specificity for csPCa in PI-RADS 4–5 lesions; 99.1% PPV and 94.1% specificity for agPCa in PI-RADS 5 subgroup. Criterion 2 significantly enhanced NPV: 68.7% for csPCa in PI-RADS 4–5 lesions; 80.0% for csPCa in PI-RADS 5 lesions. In summary, this study proposes a criterion based on PSAD and ADCmin, which can be used for csPCa risk assessment in patients with PI-RADS 4–5 lesions indicated by bpMRI. For patients meeting Criterion 1, diagnostic accuracy for csPCa may be significantly enhanced. For those fulfilling Criterion 2, improved NPV for csPCa could be achieved. As illustrated in Figure 4, there are two cases outside of Criterion 2 that yielded negative biopsy results.
Diagnostic performance of csPCa and agPCa by the criteria combined ADCmin and PSAD.
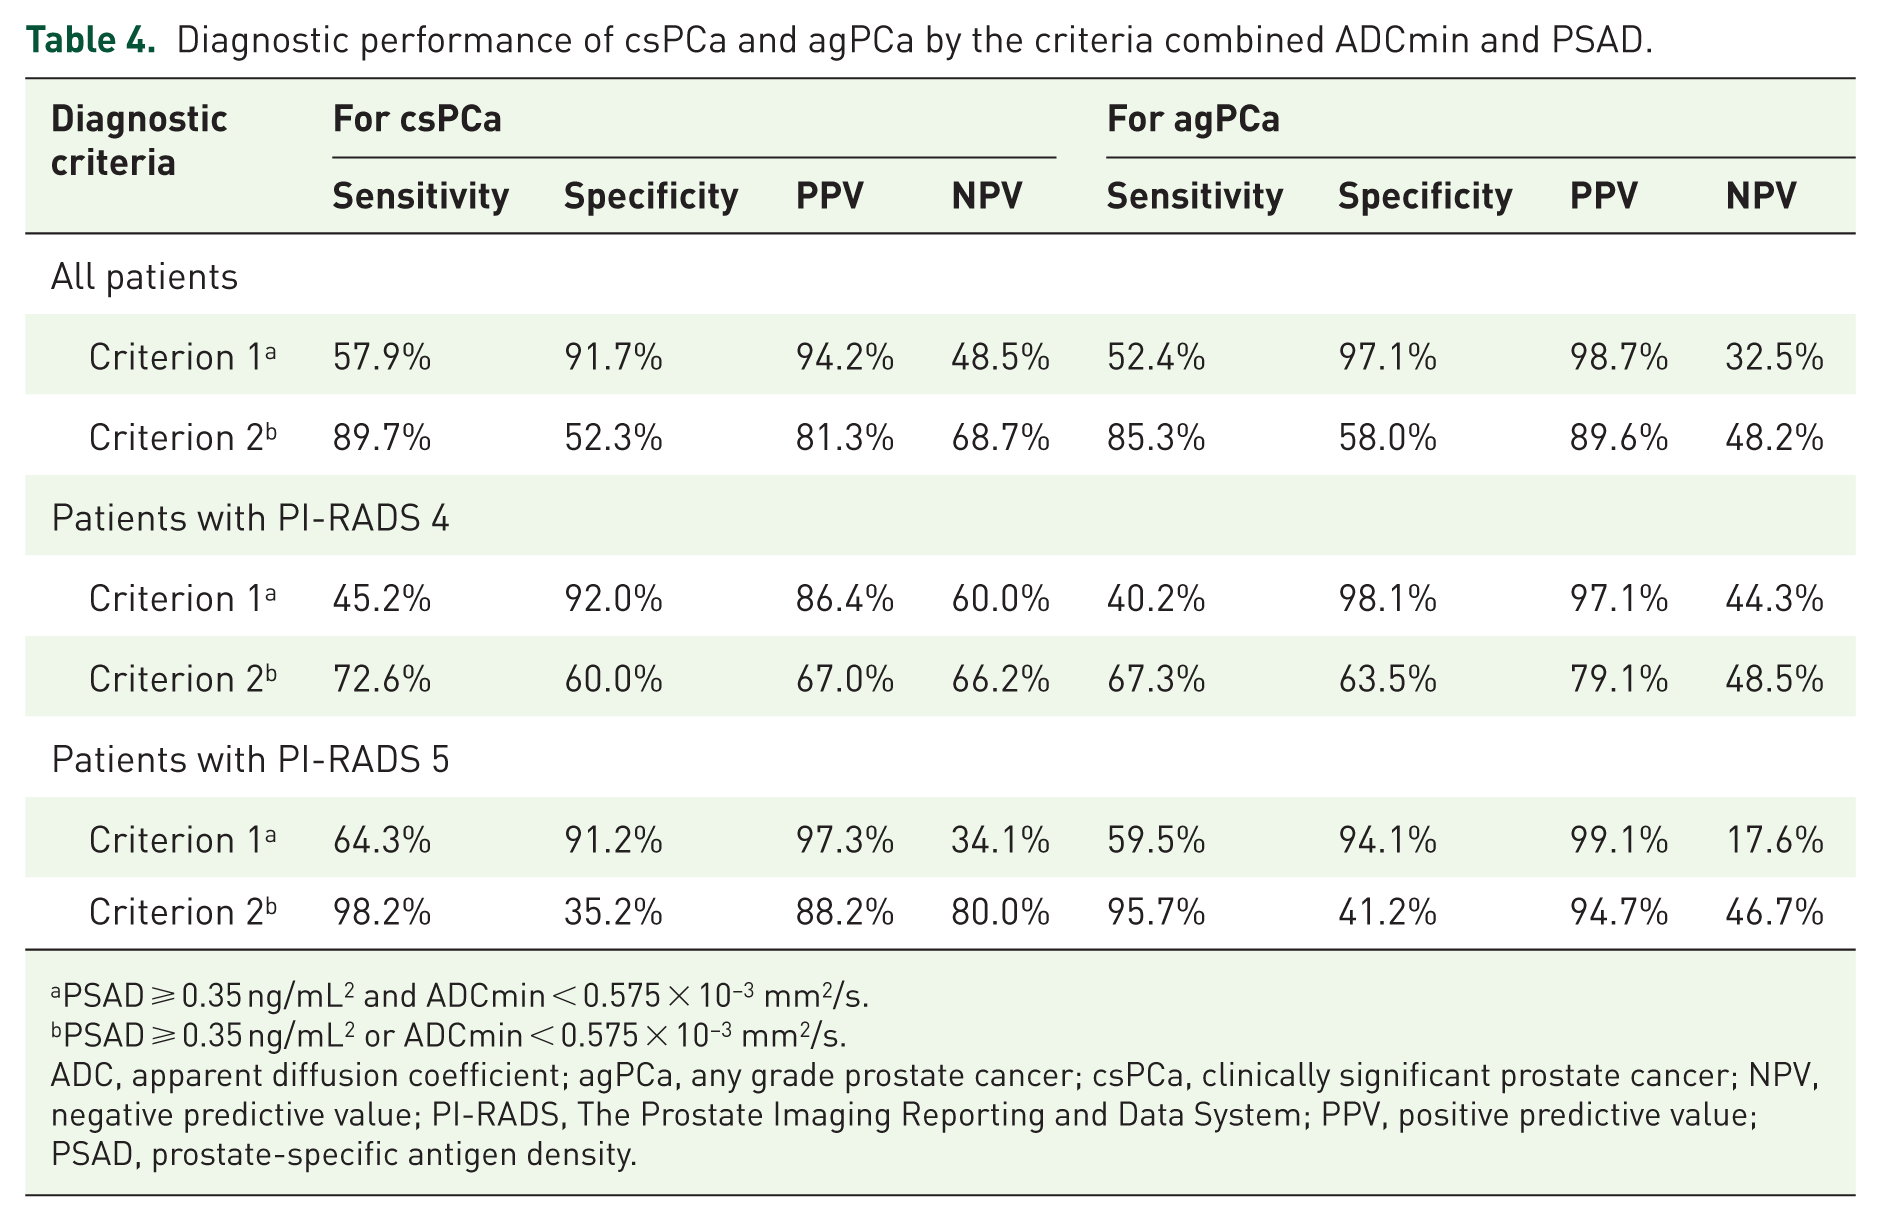
PSAD ⩾ 0.35 ng/mL2 and ADCmin < 0.575 × 10⁻³ mm2/s.
PSAD ⩾ 0.35 ng/mL2 or ADCmin < 0.575 × 10⁻³ mm2/s.
ADC, apparent diffusion coefficient; agPCa, any grade prostate cancer; csPCa, clinically significant prostate cancer; NPV, negative predictive value; PI-RADS, The Prostate Imaging Reporting and Data System; PPV, positive predictive value; PSAD, prostate-specific antigen density.

Two cases outside Criterion 2 with negative biopsy results. (a–c) Patient 1 PI-RADS 4: tPSA: 15.34 ng/mL; prostate volume: 114.65 mL; ADCmean: 1.079 × 10⁻³ mm2/s; ADCmin: 0.868 × 10⁻³ mm2/s; (d–f) Patient 2 PI-RADS 5: tPSA: 5.39 ng/mL; prostate volume: 63.77 mL; ADCmean: 1.068 × 10⁻³ mm2/s; ADCmin: 0.928 × 10⁻³ mm2/s.
Discussion
Patients with PI-RADS 4–5 lesions on multiparametric MRI typically require prostate biopsy; however, a certain proportion are found to have benign pathology. Currently, there are no established criteria to reliably identify these patients prior to biopsy, resulting in unnecessary procedures,17,18 and existing approaches have limitations, including low specificity (41%) leading to false-positive classification of benign lesions as high-risk cancer, 19 and the absence of definitive biomarkers for PI-RADS 4–5 lesions. 20 This study addresses these gaps by establishing quantitative diagnostic benchmarks for csPCa in high-risk (PI-RADS 4–5) populations. We demonstrate that: PSAD ⩾ 0.35 ng/mL2 and ADCmin < 0.575 × 10⁻³ mm2/s are reliable discriminators of csPCa. Criterion 1 (PSAD ⩾ 0.35 ng/mL2 and ADCmin < 0.575 × 10⁻³ mm2/s): achieved a 94.2% PPV and 91.7% specificity for csPCa in PI-RADS 4–5 lesions; 99.1% PPV for agPCa in PI-RADS 5 lesions. Criterion 2 (PSAD ⩾ 0.35 ng/mL2 or ADCmin < 0.575 × 10⁻³ mm2/s) provides substantial NPV (80.0%) for csPCa exclusion in PI-RADS 5 lesions. This biomarker-stratified approach significantly enhances personalized risk assessment for PI-RADS 4–5 lesions.
Our findings corroborate emerging evidence supporting ADC metrics as prostate cancer biomarkers.15,21 In our previous study on PI‑RADS 3 lesions, patients with prostate volume ⩾50 mL and ADCmin ⩾0.65 × 10⁻³ mm2/s showed a low probability of clinically significant cancer, suggesting they might be considered for biopsy deferral. 22 In an analysis investigating multiparametric MRI combined with radiomics for differentiating benign and malignant PI-RADS 4–5 prostate lesions, the study demonstrated that the ADC values were 0.791 ± 0.149 × 10⁻³ mm2/s for benign lesions versus 0.612 ± 0.110 × 10⁻³ mm2/s for malignant lesions, with an optimal diagnostic threshold of 0.712 × 10⁻³ mm2/s; the AUC performance was 0.870 in the training cohort and 0.772 in the validation cohort. 23 A study of PI-RADS 3–5 lesions revealed that ADCmin demonstrated a sensitivity of 70.3% and a specificity of 84.9%, resulting in an AUC value of 0.77. In comparison, the corresponding values for ADCratio were 64.9% and 86.9%, yielding an AUC of 0.75. 24 Research has shown that including PSAD improves PI-RADS’s predictive capacity for prostate cancer. 25 This aligns with emerging clinical frameworks that integrate PSAD into structured diagnostic pathways. For instance, a recent proposal for organized prostate cancer screening in Europe recommends that men with PI-RADS 3 lesions and PSAD ⩾ 0.15 ng/mL/cc, as well as all men with PI-RADS 4–5 lesions, should proceed to biopsy, highlighting the role of PSAD in triaging MRI-positive cases. 26
The PSAD and ADCmin thresholds established in this study (PSAD ⩾ 0.35 ng/mL2, ADCmin < 0.575 × 10⁻³ mm2/s) are higher and lower, respectively, than some commonly cited values in the literature. This discrepancy warrants explanation and is likely multifactorial. Primarily, subgroup analysis confirmed that while both PSAD and ADCmin are outstanding diagnostic tools, PSAD serves as a robust, location-agnostic benchmark, whereas ADCmin is a premier imaging biomarker particularly potent for PZ lesions. For TZ lesions or cases with indeterminate imaging (PI-RADS 4), combining PSAD with ADCmin could optimize diagnostic accuracy. However, their optimal diagnostic thresholds differed between zones. This supports the potential need for zone-specific cut-offs in clinical application. Future validation of these adjusted thresholds is warranted to optimize risk stratification. Furthermore, technical parameters influence ADC values. Our ADCmin was measured using a specific bpMRI protocol (3.0 T, b-values 50/800/1500 s/mm2) and a standardized ROI method. ADC absolute values are known to vary with magnetic field strength, b-value selection, and ROI placement, making direct numerical comparisons with studies using different protocols problematic. 22 Finally, future research could also attempt to explore the relationship between ADC metrics and cisPCa, which might avoid the detection of low‑risk prostate cancers and thereby prevent potential harms, such as sexual dysfunction or urinary incontinence following radical prostatectomy. 27
Limitations
This study has several limitations. First, the sample size was not determined by a prospective power calculation but was defined by the consecutive cohort available during the study period, as a retrospective analysis. It is susceptible to selection bias. The stringent exclusion criteria applied to ensure data quality—such as excluding patients with poor MRI image quality, incomplete clinical records, or imaging performed at external institutions—may have selected a cohort with more definitive imaging and clinical features. Thus, the exclusion of a large portion of the initial sample may limit the applicability of our results to all patients presenting with PI-RADS 4–5 lesions. Second, the use of bpMRI without dynamic contrast enhancement (DCE) may limit the assessment of some lesions, particularly those in the peripheral zone where DCE plays a complementary role in PI-RADS scoring. 28 Third, the diagnostic accuracy of both PI-RADS scoring and ADC quantification is highly dependent on underlying MRI image quality, which itself varies across institutions and studies, contributing further to inter-study variability in reported thresholds. 29 DWI serves as the primary determinant for PI‑RADS scoring in the PZ but a secondary one in the TZ. This fundamental difference in image interpretation likely contributes to the observed variation in optimal ADCmin thresholds and underscores the challenge of applying a single ADC‑derived cut‑off across both zones. Finally, prostate volume was calculated using the ellipsoid formula, which is less accurate than planimetric volumetry based on ultrasound fusion software. This inherent inaccuracy in volume measurement directly impacts the precision of PSAD values and may contribute to the discrepancies observed between our PSAD threshold and those reported in studies employing more precise volumetric techniques.
Conclusion
This study demonstrates that combining PSAD and ADCmin significantly improves the prediction of csPCa in patients with bpMRI-identified PI-RADS 4–5 lesions. Patients meeting the criterion of “PSAD ⩾ 0.35 ng/mL2 and ADCmin < 0.575 × 10⁻³ mm2/s” exhibit high csPCa probability (PPV 94.2%). The criterion of “PSAD ⩾ 0.35 ng/mL2 or ADCmin < 0.575 × 10⁻³ mm2/s” enhances (NPV 80.0% in PI-RADS 5). This dual-threshold strategy leverages quantitative imaging and biochemical biomarkers to optimize diagnostic accuracy, providing an objective framework for biopsy decisions.
Supplemental Material
sj-docx-2-tau-10.1177_17562872261442021 – Supplemental material for Diagnostic performance of apparent diffusion coefficients for prostate cancer in patients with PI-RADS 4–5 lesions: a retrospective analysis
Supplemental material, sj-docx-2-tau-10.1177_17562872261442021 for Diagnostic performance of apparent diffusion coefficients for prostate cancer in patients with PI-RADS 4–5 lesions: a retrospective analysis by Xiaoyu Bai, Yuhan Chen, Lei Yuan, Shengjun Xu, Zhengxia Zhu, Wenya Mo, Jun Xiao and Changming Wang in Therapeutic Advances in Urology
Supplemental Material
sj-pdf-1-tau-10.1177_17562872261442021 – Supplemental material for Diagnostic performance of apparent diffusion coefficients for prostate cancer in patients with PI-RADS 4–5 lesions: a retrospective analysis
Supplemental material, sj-pdf-1-tau-10.1177_17562872261442021 for Diagnostic performance of apparent diffusion coefficients for prostate cancer in patients with PI-RADS 4–5 lesions: a retrospective analysis by Xiaoyu Bai, Yuhan Chen, Lei Yuan, Shengjun Xu, Zhengxia Zhu, Wenya Mo, Jun Xiao and Changming Wang in Therapeutic Advances in Urology
Footnotes
Acknowledgements
We sincerely appreciate assistance from Medical Research Center of Anhui Provincial Hospital (Hefei, China) in providing convenient conditions.
Declarations
Supplemental material
Supplemental material for this article is available online.
References
Supplementary Material
Please find the following supplemental material available below.
For Open Access articles published under a Creative Commons License, all supplemental material carries the same license as the article it is associated with.
For non-Open Access articles published, all supplemental material carries a non-exclusive license, and permission requests for re-use of supplemental material or any part of supplemental material shall be sent directly to the copyright owner as specified in the copyright notice associated with the article.