
Abstract
Radiomics and artificial intelligence (AI) may increase the differentiation of benign from malignant kidney lesions, differentiation of angiomyolipoma (AML) from renal cell carcinoma (RCC), differentiation of oncocytoma from RCC, differentiation of different subtypes of RCC, to predict Fuhrman grade, to predict gene mutation through molecular biomarkers and to predict treatment response in metastatic RCC undergoing immunotherapy. Neural networks analyze imaging data. Statistical, geometrical, textural features derived are giving quantitative data of contour, internal heterogeneity and gray zone features of lesions. A comprehensive literature review was performed, until July 2022. Studies investigating the diagnostic value of radiomics in differentiation of renal lesions, grade prediction, gene alterations, molecular biomarkers and ongoing clinical trials have been analyzed. The application of AI and radiomics could lead to improved sensitivity, specificity, accuracy in detecting and differentiating between renal lesions. Standardization of scanner protocols will improve preoperative differentiation between benign, low-risk cancers and clinically significant renal cancers and holds the premises to enhance the diagnostic ability of imaging tools to characterize renal lesions.
Introduction
Renal cell carcinoma (RCC) is placed sixth in the diagnosed type of cancer in men and is at the 10th place in women.1,2 In recent decades, the growing availability of non-invasive advanced radiological techniques to investigate non-specific abdominal and musculoskeletal pain has led to a steady increase of incidental kidney lesions, which are more frequently small, asymptomatic, and clinically localized; indeed, up to 50% of all diagnosed renal lesions are considered small renal masses (SRMs; i.e. ⩽4 cm in diameter).3–5 Moreover, up to 30% are benign at final histology (i.e. after radical or partial nephrectomy),6–8 while a non-negligible proportion of these lesions have slow grow rate. In these cases, any treatment might result in an overtreatment. 9
The current diagnostic work-up with standard imaging tools (ultrasound, computed tomography (CT), and magnetic imaging resonance (MRI) 10 is still hampered by a suboptimal ability to correctly distinguish RCC from all benign lesions in the pre-operative setting.11–13 Tissue sampling by renal lesion biopsy has shown high diagnostic accuracy for RCC; however, it is an invasive procedure and difficult to perform in some lesion localization.10,14 Renal lesion biopsy has a high non-diagnostic rate (approximately 15% and erroneous diagnoses (approximately 10%). This is somehow related to tumor heterogeneity.15–17 Computer-aided diagnosis (CAD) using artificial intelligence (AI) and its subset machine learning (ML; and state-of-the-art ML approach deep learning (DL)) are a new area of interest in medical research. 18 Radiomics aims to help clinicians to improve the work-up and treatment of several oncological diseases, by mixing the qualitative features quantitative data obtained through imaging tools.19–23 Radiomics combines and analyses the mix of these features and data from radiographic digital images, 23 develop descriptive and predictive models, combining image features and phenotypes with gene and protein signatures.23,24 Specifically for kidney lesions, radiomics, by capturing subtle features that might escape human identification, has shown to enhance the diagnostic, prognostic, and predictive power of conventional radiological techniques.6,10,14,25,26 Aim of this comprehensive literature review is to provide a holistic overview of the actual role of radiomics in kidney lesions assessment and to identify the future opportunities in preoperative diagnosis of renal lesions.
Materials and methods
PubMed–Medline database and clinicaltrials.gov were used to identify relevant, original studies from the last 7 years (until July 2022) on the topic. We had identified 93 research articles, of which 49 were published in the last 7 years. Earlier six studies has also been included in the analysis to reflect the data from leading studies. Data from seven ongoing clinical trials were also evaluated. In Figure 1, we have summarized the search methodology performed using the Preferred Reporting Items for Systematic Reviews and Meta-Analyses (PRISMA) guidelines. 27

PRISMA methodology for identification of radiomics and renal lesions studies.
Terms used for search were: kidney neoplasms, renal cell carcinoma, AI, ML, DL, and radiomics, evaluation, differentiation, characterization, and assessment. Inclusion criteria were: (1) studies applying radiomics for the study of renal masses, (2) articles written in English language, and (3) studies with a well-documented methodology to allow replication. Articles not related to kidney tumors and non-original articles (review publications, editorials, and replies to comments) were excluded from the analysis. Following the PRISMA guidelines, we have evaluated the identified studies. Published articles were analyzed if population of patients were with kidney tumors; intervention was the evaluation with CT, MRI, positron emission tomography (PET-CT) and contrast-enhanced ultrasound (CEUS)-based radiomics. The comparator was the radiologists’ subjective image assessment. The aim was to analyze the role of radiomics and to assess the clinical aspects of radiomics in kidney tumors. Data were extracted after careful evaluation of the full text of the articles for this analysis. The data used in our review have been identified from each research: author, clinical outcomes and gold standard, the radiological modality, the prospective or retrospective design, the patients involved, radiomics method and results.
Results
The search of online databases yielded results on the topic on radiomics and kidney cancer that could be classified in studies that searched the differentiation of benign and cancerous tissue, of angiomyolipomas (AMLs) from RCC, of oncocytoma from RCC, between different subtypes of RCC. Also the prediction of Fuhrman grade, response to therapy, and prediction of gene mutations of molecular biomarkers have been identified. AI offers the unique opportunity to handle the huge volume of data being created by radiomics features extraction from kidney imaging and to combine these with clinical and pathological variables to provide even more accurate prediction of the outcome discussed in previous paragraphs. Figure 2 briefly depicts the process of radiomics research.
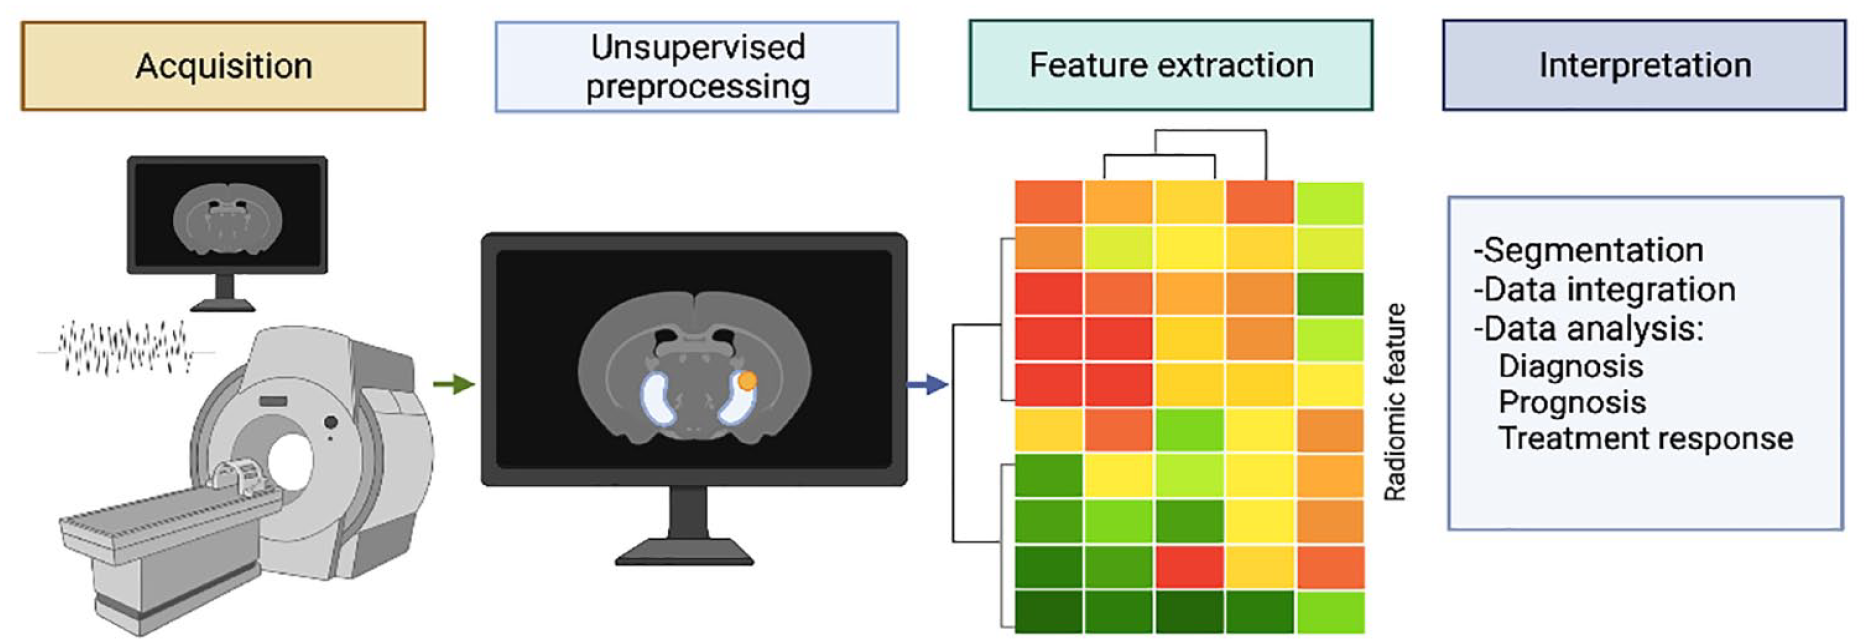
Radiomics flow analysis.
Differentiation of benign from cancerous kidney tumors
Radiomics in renal malignancy aimed to improve the accuracy in distinguishing malignant versus benign histology and in case of renal malignancy, of different subtypes, to provide the best and tailored management. The possibility to obtain an abundance of quantitative features such as histograms, textures, and shapes extracted via high-throughput data from CT and MRI has surely influenced the recent research toward this direction.6,28
One of the first studies to assess CT radiomic features and texture analysis in renal tumors was performed by Yu et al. 29 on a total of 119 patients. Utilizing histogram-based features of skewness and kurtosis, the authors reported an area under the curve (AUC) of 0.91 and 0.93, respectively, in differentiating renal cancer from oncocytoma (ONC) with AUC of 0.92 in differentiating ONC from other tumors.14,29 Analogously, Coy et al. 30 reported, for 200 patients with 200 unique masses, an AUC of 0.85 of CAD in discriminating malignant versus benign lesions. Despite the limitations of only comparing clear cell (cc) RCC and ONC and using two different contrast agents, the study uncovered the high potential of radiomics and ML in analyzing several texture-analysis features to distinguish malignant from benign kidney lesions. 31 A further study by Erdim et al. 32 aimed to investigate the possibility to identify benign from cancerous masses through CT and ML texture analysis on a total of 79 patients with 84 renal masses (21 benign and 63 malignant). With a total number of 198 features for unenhanced CT and 244 for contrast-enhanced CT, ML based on random forest (RF) algorithm radiomics, yielded an accuracy in distinguishing renal cancer from other benign renal masses 90.5% with an AUC of 0.915, which, eliminating collinear features, increased to 91.7% and 0.916, respectively. 32 Zhou et al. 33 reported, in 192 patients with renal cancer analyzed via the InceptionV3 model, a DL radiomics model, an AUC of 0.97 for region of interest (ROI) data set and 0.93 for rectangular box region (RBR) data set. In a larger cohort of 290 renal lesions, Sun et al. selected 57 features to provide a classification model of RCCs versus other subtypes versus angiomyolipomas and ONCs. The resulting radiomic ML model yielded an AUC of 0.93–0.94 in differentiating RCCs from fat–poor benign renal lesions.34,35 Uhlig et al. proposed a radiomic approach using CT features to discriminate malignant and benign clinical T1 renal masses, involving 94 patients for a total of 76 malignant lesions and 18 benign lesions. The best ML algorithm was the RF, which achieved the highest AUC, with 0.83 when compared with radiologists’ assessment (AUC = 0.68). Interestingly, this result was obtained with 18 different CT scanners, confirming the role of radiomics in limiting the inter-observer and inter-machine variability and providing good results even in a pragmatic scenario. 36 In another study by Nassiri et al., 37 performed on 684 patients with renal masses confirmed at CT imaging, two radiomics predictive models, the REAL AdaBoost and the RF, reported the best predictive performance with an AUC of 0.84 and 0.77, respectively, to distinguish benign from cancerous lesions overall and for SRMs when coupled with clinical variables. Finally, a large retrospective study by Yap et al. 38 involving 735 patients, showed, for different radiomic features (shape-only models, texture-only models, and combined models) increasing AUC from 0.67 to 0.75 in distinguishing malignant from benign renal tumors.
Similar studies have reported the efficacy radiomics using MRI in discriminating benign from malignant masses, utilizing the differences in contrast enhancement, heterogeneity, presence of cystic components, and signal intensity at T1, T2, and apparent diffusion coefficient (ADC) map signal. Xi et al. showed, analyzing 1162 renal lesions, a variable AUC for different clinical radiomics features that ranged from 0.52 to 0.76 of the ensemble DL model. Compared with expert radiologists, this predictive model reported higher accuracy, sensitivity, and specificity with, respectively, 0.70 versus 0.60, 0.92 versus 0.80, and 0.41 versus 0.35. 39 A smaller study by Said et al. involving 125 patients, reported, among significant qualitative and quantitative radiomic features, an AUC that ranged between 0.62 and 0.90, taken singularly. The related ML model reported instead, on validation sets, an AUC of 0.73 to differentiate RCC from benign lesions. 40 More recently, in a 2022 study performed by Xu et al. 41 on 217 patients, retrospectively analyzed, three DL models, created with ResNet-18 model, were evaluated using RF based on T2 weighted-imaging (T2WI) alone, diffusion-weighted imaging (DWI) alone, and an overlapping of the two image data sets to differentiate benign from malignant renal masses, yielding an AUC of 0.906 for T2WI, 0.846 for DWI and 0.925 for the combined model. Analogously, Massa’a et al. 42 investigated whether a high number of ML algorithms in 160 patients retrospectively analyzed, reporting the best results for the support vector machine (SVM) trained on T2WI (AUC = 0.79). Similar results were obtained for T1WI 4-min delayed features. Interestingly, the combination of radiomics features in this study did not raise the performance of the ML models. A summary of current studies that aimed to differentiate normal tissue from cancerous tissue is incorporated in Table 1.
Radiomics in studies differentiating benign from malignant kidney lesions.

3D, three-dimensional; ACC, accuracy; AML, angiomyolipoma; AUC, area under the curve; ccRCC, clear cell RCC; chRCC, chromophobe RCC; CNN, convolutional neural network; CT, computed tomography; DL, deep learning; DWI, diffusion-weighted imaging; ML, machine learning; MRI, magnetic resonance imaging; papRCC, papillary RCC; RBR, rectangular box region; RCC, renal cell carcinoma; RF, random forest; ROI, region of interest; SENS, sensitivity; SPEC, specificity; SVM, support vector machine; T2WI, T2-weighted image; VOI, volume of interest.
Differentiation of AML from RCC
AML accounts for 40–55% of resected benign renal tumors and is characterized by the identification at the imaging of macroscopic fat surrounding and ‘stuffing’ the lesion. 43 Despite this peculiar characteristic, some AMLs could contain low intra-tumor fat that could not be detected by imaging. 44 The accurate characterization of those masses is, therefore, crucial due to the benign course and favorable prognosis of AML. 45 Quantitative approaches have been developed with the aim of detecting minor alterations in AML compared with RCC. One of the first studies to utilize a radiomics approach for this differentiation was performed by Feng et al., which evaluated the capabilities of 42 CT-extracted features in a limited sample of 58 patients. In particular, 16 features were characterized by a significant intergroup difference in correctly diagnosing AML. The best features were selected via the SVM recursive feature elimination that reached an AUC of 0.939. 46 A similar study involved 95 patients for a total of 171 histopathological results from a single institution. 47 Features were obtained from three phases, which included the pre-contrast, the corticomedullary, and the nephrographic exposures. 47 Successively, an SVM algorithm has been developed to find the best classifiers for distinguishing AML and RCC. The best ML classifier reported an AUC of 0.96 for this purpose, significantly higher than that for differentiating AML from non-RCC. 47 With the increasing capabilities of radiomics in discriminating AML from RCC, other studies enriched the experience with this novel technology. Yang et al., 48 for example, extracted 774 radiomics features from CT pictures to obtain the most discriminative model, reporting an AUC of 0.917, with a sensitivity of 0.66 and a specificity of 0.1, while Ma et al. 49 similarly constructed four single radiomics analysis logistic classifiers (which included five to seven features each one), to verify the proper diagnosis on 84 patients (22 with AML and 62 with RCC), reporting AUCs from 0.839 to 0.950. Analogous results have been obtained by Nie et al. developing a radiomics nomogram for the preoperative discrimination of AML from RCC. The built radiomics signature obtained promising results in the training data set (reaching an AUC of 0.879), which were confirmed in the validation set (AUC = 0.846) and four in the radiomics nomogram (AUC = 0.896–0.949). Also in this case, the number of features extracted were culled off from a massive number of CT-based features (over 2800). 50 Interestingly, in a retrospective study on 163 patients (118 RCC and 45 AML), digital picture features extracted from the unenhanced phase and fed into an ML model were similarly able to accurately discriminate between AML and RCC, reaching an AUC of 0.90. 51 Another radiomics approach considered the role of tumor and mini-peritumor features to differentiate AML from RCC in a study performed by Ma et al. on 230 patients, for a total of 58 AML and 172 RCC. With 396 radiomics features extracted, the best results were obtained for the nephrographic phase with an AUC of 0.726, followed by the corticomedullary phase (AUC = –0.694). This approach overcame the problem related to the accurate delineation of tumoral volume of interest (VOI). 52 The same authors provided, in addition, a radiomics CT nomogram for discriminating AML from RCC, 53 built using selected features reaching an AUC, for this nomogram, of 0.968. 54 More recently, Han et al. performed a retrospective research in 58 patients with AML and 140 with RCC, pathologically confirmed, to evaluate the prognostic value of CT radiomics in distinguishing AML from RCC. Five classifiers were used, for a total of 1029 features. The corticomedullary phase and nephrographic phase achieved an adequate performance (AUC = 0.767 and 0.783, respectively). 55 Similarly, Kim et al. 56 assessed the predictive role of CT radiomics in 28 AML and 56 RCC, reporting an AUC of 0.89, close to those of experienced radiologists (AUC = 0.78; Table 2).
Radiomics in studies differentiating angiomyolipoma (AML) from RCC.

ACC, accuracy; AML, angiomyolipoma; AUC, area under the curve; ccRCC, clear cell RCC; chRCC, chromophobe RCC; CT, computed tomography; DWI, diffusion-weighted imaging; ML, machine learning; MRI, magnetic resonance imaging; papRCC, papillary RCC; RBR, rectangular box region; RCC, renal cell carcinoma; ROI, region of interest; SENS, sensitivity; SPEC, specificity; sRBFNN, sparse radial basis function neural network; SVM, support vector machine; T2WI, T2-weighted image; VOI, volume of interest.
For MRI, similar results were obtained. Razik et al., 57 performed an MRI analysis to distinguish AML, RCC, and ONC, reporting in an MRI-based radiomics, an AUC > 0.8, with best performing parameter based on the mean of positive pixels (MPP) on DWI (AUC of 0.891). Jian et al. 53 instead, evaluated the combined use of MRI radiomics plus urinary creatinine for this purpose in a preliminary study, reporting the best AUC for the T2WI model (0.874), which increased up to 0.919 when combined with urinary creatinine, proposing the addition of other variables to radiomics approach to improve the diagnostic capabilities. Matsumoto et al. 58 demonstrated instead that the ADC map was enough in differentiating AML from RCC via a radiomics MRI-based approach, reporting good AUC (0.87) in the validation group.
Differentiation between oncocytoma and RCC
Renal ONC is usually a benign solid kidney neoplasm, which accounts for about 3–7% of all renal tumors. 59 Despite its benign natural history and excellent prognosis, ONC is usually treated with surgical resection due to the imaging available tools to properly distinguish it from RCC. 5 Indeed, due to the substantial overlap in imaging findings, differentiation of chromophobe RCC (chRCC) and clear cell RCC (ccRCC) subtypes through imaging modalities has traditionally been challenging.60,61 Percutaneous biopsy represents a method to differentiate ONC from RCC with the risks of false-negative results, as well as the difficulty to consistently discriminate between RCC and ONC on pathology.5,17 As a result, especially given the importance of distinguishing these two entities with such a difference in prognosis and tumor behavior, and to potentially avoid many unnecessary surgeries for benign lesions, a reliable non-invasive method that could properly differentiate ONC from RCC before surgery would be of particular clinical value. Several radiomic approaches have been proposed to this aim, showing promising results. Table 3 summarizes studies evaluating radiomics approaches for the differentiation of ONC from RCC.
Radiomics in studies differentiating oncocytoma from RCC.

2D, two-dimensional; 3D, three-dimensional; ACC, accuracy; ADC, apparent diffusion coefficient; AML, angiomyolipoma; AUC, area under the curve; ccRCC, clear cell RCC; chRCC, chromophobe RCC; CECT, contrast-enhanced computed tomography; CNN, convolutional neural network; CT, computed tomography; DL, deep learning; DWI, diffusion-weighted imaging; IQR, inter-quartile range; LASSO, least absolute shrinkage and selection operator; ML, machine learning; MRI, magnetic resonance imaging; ONC, oncocytoma; papRCC, papillary RCC; PPV, positive predictive value; RCC, renal cell carcinoma; RF, random forest; ROC, receiver operator characteristics; ROI, region of interest; SD, standard deviation; SENS, sensitivity; SPEC, specificity; SVM, support vector machine; VOI, volume of interest; WL, whole lesion.
Baghdadi et al. 62 aimed to design and evaluate a semi-automated method with the help of AI and image processing. To differentiate CD117-positive ONCs from chRCC, the authors used convolutional neural networks (CNNs) on CT obtained images. Tumor-to-cortex peak early-phase enhancement ratio (PEER) evaluation had an ACC of 95% in tumor type classification (100% SENS and 89% SPEC) compared with the histopathology results.
Chen et al. 64 evaluated the clinical utility of voxel parameters of whole lesion (WL) from CECT scans to differentiate ccRCC from kidney ONC. When compared with single ROI-based enhancement, WL enhancement did not perform well to distinguish ccRCC from ONC (AUC of 0.78 and 0.72, respectively). A combination with histogram parameters (AUC of 0.86) performed better. According to these results, authors concluded that the use of this method is probably not justified to be further studied to be clinically implemented.
Coy et al. 5 explored the performance of a DL lesion classifier, using a software library from Google (i.e. TensorFlow™ Inception), for the differentiation of ccRCC from ONC on CT images. 25 In this pilot study, 13 classification methods were tested, and the best performance was obtained using the excretory phase obtaining an accuracy of 74.4%, sensitivity of 85.8%, and positive predictive value (PPV) of 80.1%. The software used showed the potential of ML to discriminate the cancerous ccRCC from ONC. The experienced radiologists seemed to be able to properly classify an ONC better than the DL method. 25
In their study on the distinction of RCC from benign tumors, Deng et al. 65 used histogram features to distinguish ONC from chRCC. Entropy seems to be a good prognosticator to differentiate ONC from chRCC. 25
Li et al. 66 investigated the role of ML and CT image features to distinguish chRCC from ONC. In this analysis of 61 cases, five classifiers were trained to build a model. All radiomics models showed good diagnostic results (all AUC values > 0.85), with SVM being the best (AUC 0.96, SENS 0.99, SPEC 0.80, and ACC 0.94), indicating that accurate preoperative distinction of ONC from chRCC might be eased by applying ML to CT imaging features.
Raman et al. 67 evaluated the possibility of differentiating common renal masses (i.e. ONC, ccRCC, cysts, and papillary RCC (papRCC)) using CT quantitative texture analysis and RF methods to construct a model. Analyzing CT scans from 99 patients, this approach demonstrated that 90% of oncocytomas and ccRCC could be identified with a sensitivity of 89% and a specificity of 99%, suggesting that data acquired from CT images can be used to accurately categorize different renal lesions, including oncocytomas.
Sasaguri et al. 68 searched to identify the role of biphasic CECT for the differentiation of SRM from RCC. The diagnostic performance of the proposed model achieved AUCs of 0.82, 0.95, and 0.84 for differentiating ONCs from ccRCCs.
Varghese et al. 35 explored the accuracy of quantitative features obtained from CT scans. The lipid content of lesions and the cancerous kidney tissues were studied. According to their analysis–which comprised 31 texture metrics derived with 6 texture methods, the histogram analysis did not perform well (74% of differences could be identified). The addition of Fourier analysis improved the results of the combined model (AUC of 0.90). The combined model had AUC values of 0.87, 1.00, 0.91, and 0.94 (p < 0.05) for differentiating ONC from cancerous kidney lesions.
Varghese et al. 69 in a retrospective series of 156 patients, fast Fourier transform (FFT) has been found to be in ONC versus ccRCCs, in the excretory phase. The heterogeneity of gray zone texture seems to be high in ccRCC when compared with ONC.
Yu et al. 29 assessed how texture analysis of images obtained from CECT can discriminate RCC subtypes from ONC. In this case series of 119 patients, histogram feature can differentiate ONC from other tumors (AUC of 0.92), and the ML combined model did not perform better (AUC of 0.86).
Hoang et al. 70 using quantitative texture parameters extracted from MRI aimed to discriminate benign and cancerous SRM. In this cohort of 41 patients, 45 imaging features were extracted, comprising 5 global (intensity histogram) and 40 texture features. Histogram of features could differentiate ONC from papRCC and ccRCC (accuracy 77.9%, sensitivity 64.7%, and specificity 85.9%). These suggest that analysis of features drawn from MRI can better characterize kidney tumors subtypes.
Paschall et al. 71 tested objective volumetric WL on ADC map to improve the conventional measurements using ROI to discriminate type I papRCC from ccRCC and ONC. In this case series of 55 patients, WL ADC values between papRCC and ONC were significantly different (p < 0.001); ROC AUC of 67.6 for ONC versus ccRCC and 95.8 for ONC versus papRCC (sensitivity of 100.0%, specificity of 10.3%, and sensitivity of 88.5%, specificity of 93.1%, for ONC versus ccRCC and versus papRCC, respectively), highlighting the utility of this objective methodology in providing information on lesion heterogeneity and reducing observer bias.
Differentiation of different subtypes of RCC
RCC involves three major subtypes (i.e. ccRCC, papRCC, and chRCC), which differ in spatial distribution of cellularity and vascularity at histopathology. 72 The ccRCC is an aggressive and lethal carcinoma (75% of all RCCs), and has a potential to metastasize, while the papRCC and chRCC subtypes are less common – accounting for about 10–15% and 5% of all RCCs, respectively – and show better survival rates. 73 As a consequence, RCC subtyping has clinically implications, and the use of molecular targeted drugs will improve the differentiation of RCC subtypes. The application of radiomics to RCC subtyping has been reported by several studies, and summarized in Table 4.
Radiomics in studies differentiating different subtypes of RCC.

2D, two-dimensional; 3D, three-dimensional; ACC, accuracy; ADC, apparent diffusion coefficient; AML, angiomyolipoma; ANN, artificial neural network; AUC, area under the curve; ccRCC, clear cell RCC; chRCC, chromophobe RCC; CECT, contrast-enhanced computed tomography; CT, computed tomography; DL, deep learning; DWI, diffusion-weighted imaging; FOV, field of view; IQR, inter-quartile range; LASSO, least absolute shrinkage and selection operator; ML, machine learning; MRI, magnetic resonance imaging; mRMR, minimum redundancy maximum relevance; ONC, oncocytoma; papRCC, papillary RCC; PPV, positive predictive value; RCC, renal cell carcinoma; RF, random forest; ROC, receiver operator characteristics; ROI, region of interest; SD, standard deviation; SENS, sensitivity; SPEC, specificity; SVM, support vector machine; VOI, volume of interest; WL, whole lesion.
Kocak et al. 74 aimed to extend the validity of their results to externally validate, to allow replication of models and the possible generalization of algorithms. This used CT images and features in combination with ML algorithms. The best performance was achieved by the ANN classifier with adaptive boosting, showing an accuracy of 84.6% for differentiation of ccRCCs from other tumor types. The SVM classifier performed best (ACC = 69.2%) to differentiate ccRCC from papRCC and chRCC. The best performance was found to be related to the differentiation of papRCC from other RCCs, while they exhibited rather poor performance in differentiating ccRCC or chRCC from others.
Similarly, Han et al. 75 aimed to exploit reproducible and generalizable models to differentiate the ccRCC, papRCC, and chRCC using CT images along with an ML algorithm. In their cohort of 169 biopsy-proven RCC cases, the DL neural network achieved an AUC of 0.9 no matter the identified subtype (specifically, 0.93 for ccRCC, 0.91 for papRCC, and 0.87 for chRCC), showing promising performance in classification of RCC – although with worse performance for chRCC subtyping.
Li et al. 76 evaluated a CT radiomics model to differentiating ccRCC from other tumor subtypes and to evaluate radiogenomics potential combining the imaging features and the von Hippel-Lindau (VHL) mutation gene. Among 156 texture features extracted for each tumor, the eight most relevant from the corticomedullary phase were used to build the model, which had a good AUC (0.95; ACC of 92.9%); moreover, five out of eight had a strong association with VHL mutation gene.
Raman et al. 67 sought to assess the possibility of differentiating common renal masses (i.e. ONC, ccRCC, cysts, and papRCC) using CT texture analysis features embedded into a model. The model used was RF. This model correctly categorized ccRCCs in 91% of patients (SENS 91% and SPEC 97%), and papRCCs in 100% of patients (SENS 100% and SPEC 98%), suggesting CT texture analysis, in conjunction with RF modeling, might demonstrate a potential method to characterize renal masses.
Leng et al. 77 in their study exploring the effect of denoising heterogeneity scores. The aim was to distinguish AML from different subtypes of RCC. The authors found that, with regards to ccRCC and papRCC differentiation, the heterogeneity scores could discriminate these two subtypes, and that further reduction in noise improved AUC.
Yan et al. 78 investigated the diagnostic performance of texture analysis for the discrimination of AML with minimal fat, ccRCC, and papRCC on images obtained from CT scans. According to their analysis, excellent classification results in terms of discrimination between ccRCC and papRCC were obtained with nonlinear discriminant analysis (error of 0.0–9.3%), no matter which phase was used; on comparison with the three scanning phases, a trend toward better lesion classification was observed with corticomedullary and nephrographic phases images.
Hoang et al. 70 assessed if quantitative texture parameters obtained from MRI could potentially differentiate between common subtypes of RCC (i.e. ccRCC versus papRCC) in SRMs (i.e. < 4 cm). Among the 45 imaging features extracted, textures helped to differentiate between subtypes of RCCs; papRCCs were differentiated from ccRCCs with an accuracy of 77.9% (sensitivity 65.5% and specificity 88%).
Li et al. 79 used volumetric histogram analysis from ADC maps to characterize SRMs. Combination of mean ADC and histogram values achieved the best AUC (0.851 with SENS of 80.0% and SPEC of 86.1%) and these results show that the volumetric analysis could potentially differentiate between certain types of kidney masses.
Paschall et al. 71 explored the volumetric WL ADC parameters could identify RCC. The differentiation was studied for type I papRCC from ccRCC and ONC. In their study, WL ADC could distinguish between papRCC and ccRCC (p < 0.001), with AUC of 95.2 (SENS of 84.5% and SPEC of 93.1%).
Fuhrman grade prediction
Fuhrman grade is an important pathological risk factor impacting on patients’ oncological outcomes, especially the risk of recurrence. 80 Indeed, despite this information might be achieved through renal mass biopsy, this procedure is invasive and not devoid of complications and suffers from several limitations.17,81 Therefore, being able to preoperatively predict a renal mass nuclear grade differentiation, directly by imaging, could be of outmost importance to address the patient to the best treatment.
With the introduction of ML, a branch of AI-developing algorithm able to both learn and improve by analyzing data sets, one of the main imaging parameters adopted is texture analysis.82,83 This post-processing technique, which can be applied either to CT or MRI, allows quantifying tumor heterogeneity assessing several parameters.
Shu et al. compared radiological features of different Fuhrman grade ccRCC and extracted 1029 radiomics features from corticomedullary and nephrographic CT scans. The authors found that 11 and 24 features correlated with Fuhrman grades. This investigational analysis confirmed that radiomics can assess preoperatively the Fuhrman grade of kidney lesions. 84 Again, a retrospective study on 290 patients with histologically confirmed 298 RCCs evaluated the levels of entropy and texture quantification within renal tumors at CT imaging. The authors found a significant increase of entropy value both in clear cell carcinoma and higher Fuhrman grade. 85
Recent evidence from studies that looked at the role of ML also analyzed texture in MRI imaging as well. T2 and DWI windows are usually used and a study on 34 RCC masses demonstrated entropy at spatial scaling factors (SSF) on DWI, on corticomedullary phase and on nephrographic phase to be best parameters to assess RCC grading. 86 Accordingly, Stanzione et al. 87 developed five algorithms including different MRI features to predict tumor grading achieving accuracy greater than 90%.
Yin et al. developed and tested an ML model and images from CECT to predict Fuhrman grade of ccRCC. In 25 patients, SVMRadial, RF and Bayesian models had the best prognostic ability to predict Fuhrman grade of ccRCC using radiomics from CECT images. 88
Finally, semantic segmentation is gaining popularity 89 and promising results have been achieved to differentiate different RCC subtypes. 90 Nevertheless, studies able to underline the role of semantic segmentation to differentiate nuclear grading are still based on the pathological sample. 91
Prediction of gene mutation molecular biomarkers through radiomics
Radiogenomics integrates multi-scale genome data, with the help of refined CAD systems to develop imaging possibilities to assess the combination of imaging data with genome-related cellular data.92–96
Lee et al. 97 evaluated 58 kidney cancer patients (including 12 patients with metastatic disease) using a radiomics algorithm with images from CT scans assessing progression of pT1 RCC. Combining radiomics parameters with gene expression data gathered from whole transcriptome sequencing (WTS). Four radiomic features, which included histogram features, gray-level co-occurrence matrix (GLCM), and the ratio of voxels from ROIs, were trained to prognose metastasis of patients. In addition, heterogeneous gene signatures correlated with these radiomics features were identified. These findings barred out the use of radiogenomics to highlight patients who could have an additional benefit from adjuvant therapy or metastases in pT1 RCC.
Two retrospective studies assessed more granularly specific mutations and CT-based texture radiomics, such as BAP1 mutations. The first, reported an AUC of 0.77 highlight BAP1 mutation. 98 The second study assessed radiomics features extracted from CT scans of 65 ccRCC tumors, achieved a SENS, SPEC, and ACC of 90.4%, 78.8%, and 81% to predict BAP1 mutation (AUC = 0.89). 99 The gene encoding the protein polybromo-1 (PBRM1) mutation has been investigated with radiomics analysis with a good AUC of 0.925. 100 Previously, one trial studying ccRCC tumors found an AUC of 0.85 for VHL, PBRM1, and BAP1 genes. 101 Gene mutations BAP1 has been investigated in 78 tumors from The Cancer Genome Atlas, (AUC = 0.71 for prediction of BAP1 within the CT nephrogenic scan images. 102
Studies investigating treatment response of renal masses using radiomics
Assessing the prediction of response to target therapies is paramount for clinical decision-making in metastatic RCC (mRCC) patients. Targeted therapies and immunotherapies have demonstrated a promising efficacy in mRCC, yet it remains challenging to delineate subgroups of responsive patient, despite the existence of several scores (e.g. International Metastatic RCC Database Consortium [IMDC] risk score) and biomarkers (e.g. PBRM1).26,103,104 A deeper knowledge and evaluation of response/resistance status would lead to personalized algorithms, which can potentially avoid adverse events of unnecessary treatments – with a subsequent positive effect on patients’ quality of life – optimize resources, save time (e.g. unresponsive patients to certain therapies could be switched earlier to other treatments) to improve survival outcomes.
Antunes et al. 105 attempted to test how well radiomics analysis perform on integrated positron emission tomography/magnetic resonance imaging (PET/MRI) in the assessment of metastatic RCC and response to Sunitinib. Their findings suggests that radiomics from PET/MRI have a potential to identify structural and functional modifications that can influence the response to tyrosine kinase inhibitor (TKI) therapy, thus identifying radiomics analysis as a modality for characterization and evaluation through PET/MRI.
Bharwani et al. 106 sought to explore whether TKI therapy (i.e. Sunitinib) can influence sequential gene changes in mRCC patients and its correlation with overall survival (OS), by prospectively assessing DWI and multiphase contrast-enhanced MRI as biomarkers of outcomes. In this case series of 20 patients, 47% of patients had a modification mean ADC following treatment, despite no correlation with outcome was found. Patients with higher baseline AUC (low; i.e. proportion of the tumor with ADC values < 25th percentile of the ADC histogram) and greater-than median AUC-low increase, reported a reduced OS (hazard ratio (HR) = 3.67, 95% confidence interval (CI) = 1.2310.9; p = 0.012 and HR = 3.72, 95%CI = 0.98–14.21; p = 0.038, respectively), indicating that DWI-MRI can be a possible biomarker for OS. 106
Boos et al. 107 evaluated median versus mean attenuation gathered from histograms of 19 RCC patients receiving Sunitinib or Sorafenib response assessed by CT scans. Authors found that distribution curves correlated themselves with outcomes (RECIST criteria were employed); lesions with –44 Hus, had a partial tumor response while those greater than –41 Hus, reported tumor progression. 35
The study by Goh et al. 108 aimed to evaluate tumor textures on CT images correlation with PFS in 39 patients with mRCC – different sub-types – who received multiple TKIs (i.e. Sunitinib, Cedirinib, Pazopanib, or Regorafenib). By analyzing 87 metastatic lesions prior and after therapy, authors have found a lower texture entropy and higher uniformity after immunotherapy. Texture uniformity has been shown to be an independent predictor of progression (p = 0.005). According to these data, authors suggested that tumor heterogeneity could have the potential to be assessed as predictive radiomics marker of response to therapy.
Haider et al. 109 performed a retrospective assessment of combined biomarkers and CT images to prediction survival in mccRCC patients receiving immunotherapy. Specifically, measurable lesions from different selection respected RECIST criteria, prior and after therapy. The evaluation of IMDC score plus texture parameters was also performed. Size normalized standard deviation (nSD) before and after therapy is a predictor of OS (p = 0.01 and 0.01); entropy is also a significant predictor of OS before and after therapy (p = 0.02 and p = 0.04). Same results were obtained for PFS at (p = 0.01 and p = 0.003) concluding that nSD correlates with OS and PFS.
Mains et al. 110 aimed to identify which DCE-CT functional parameters and models had the optimal correlations with OS and PFS in mRCC patients. According to these analyses, the best associations were spotted for blood volume, blood flow, and standardized perfusion values, calculated using deconvolution at baseline and during early treatment period (p < 0.05).
The study by Khene et al. 111 studied response to TKIs treatment on a model relying on k-nearest neighbor, RF, logistic regression, and SVM approaches with the worse ACC and AUC for RF and the best for logistic regression. Table 5 summarizes studies investigating radiomics and treatment response.
Radiomics in studies investigating treatment response in metastatic RCC undergoing TKIs or T-cell immunotherapy.

ACC, accuracy; ADC, apparent diffusion coefficient; AUC, area under the curve; CAD, computer-aided diagnosis; CECT, contrast-enhanced computed tomography; CT, computed tomography; DWI, diffusion-weighted imaging; FLT-PET/MRI = F18 fluorothymidine-positron emission tomography/MRI; HR, hazard ratio; HU, Hounsfield unit; MASS, morphology, attenuation, size, and structure; MRI, magnetic resonance imaging; nSD, size-normalized SD; OR, odds ratio; OS, overall survival; PFS, progression-free survival; RCC, renal cell carcinoma; RECIST, response evaluation criteria in solid tumors; RF, random forest; ROI, region of interest; SD, standard deviation; SVM, support vector machine; T2w, T2-weighted; TKI, tyrosine kinase inhibitor; VOI, volume of interest; WL, whole lesion.
Table 5 summarizes studies investigating treatment response in mRCC patients.
Ongoing studies evaluating the radiomic value in kidney lesions
Radiomics has been heavily studied lately to assess its potential to individualize treatment. The correlative radio-genomics and theranostics could hold the promise to provide useful information for the detection, prediction, treatment, and how the kidney tumor reacts to oncological treatment. 23 The specific field of radiomics applied to kidney lesions for different purposes is currently moving at an unprecedented pace. Indeed, several ongoing trials are assessing new imaging techniques for RCC management – mainly in terms of characterization and staging – using different modalities and tracers. Table 6 summarizes main ongoing trials exploring radiomics and its ability to establish the stage and grade of RCC.
Radiomics in ongoing trials investigating kidney lesions.
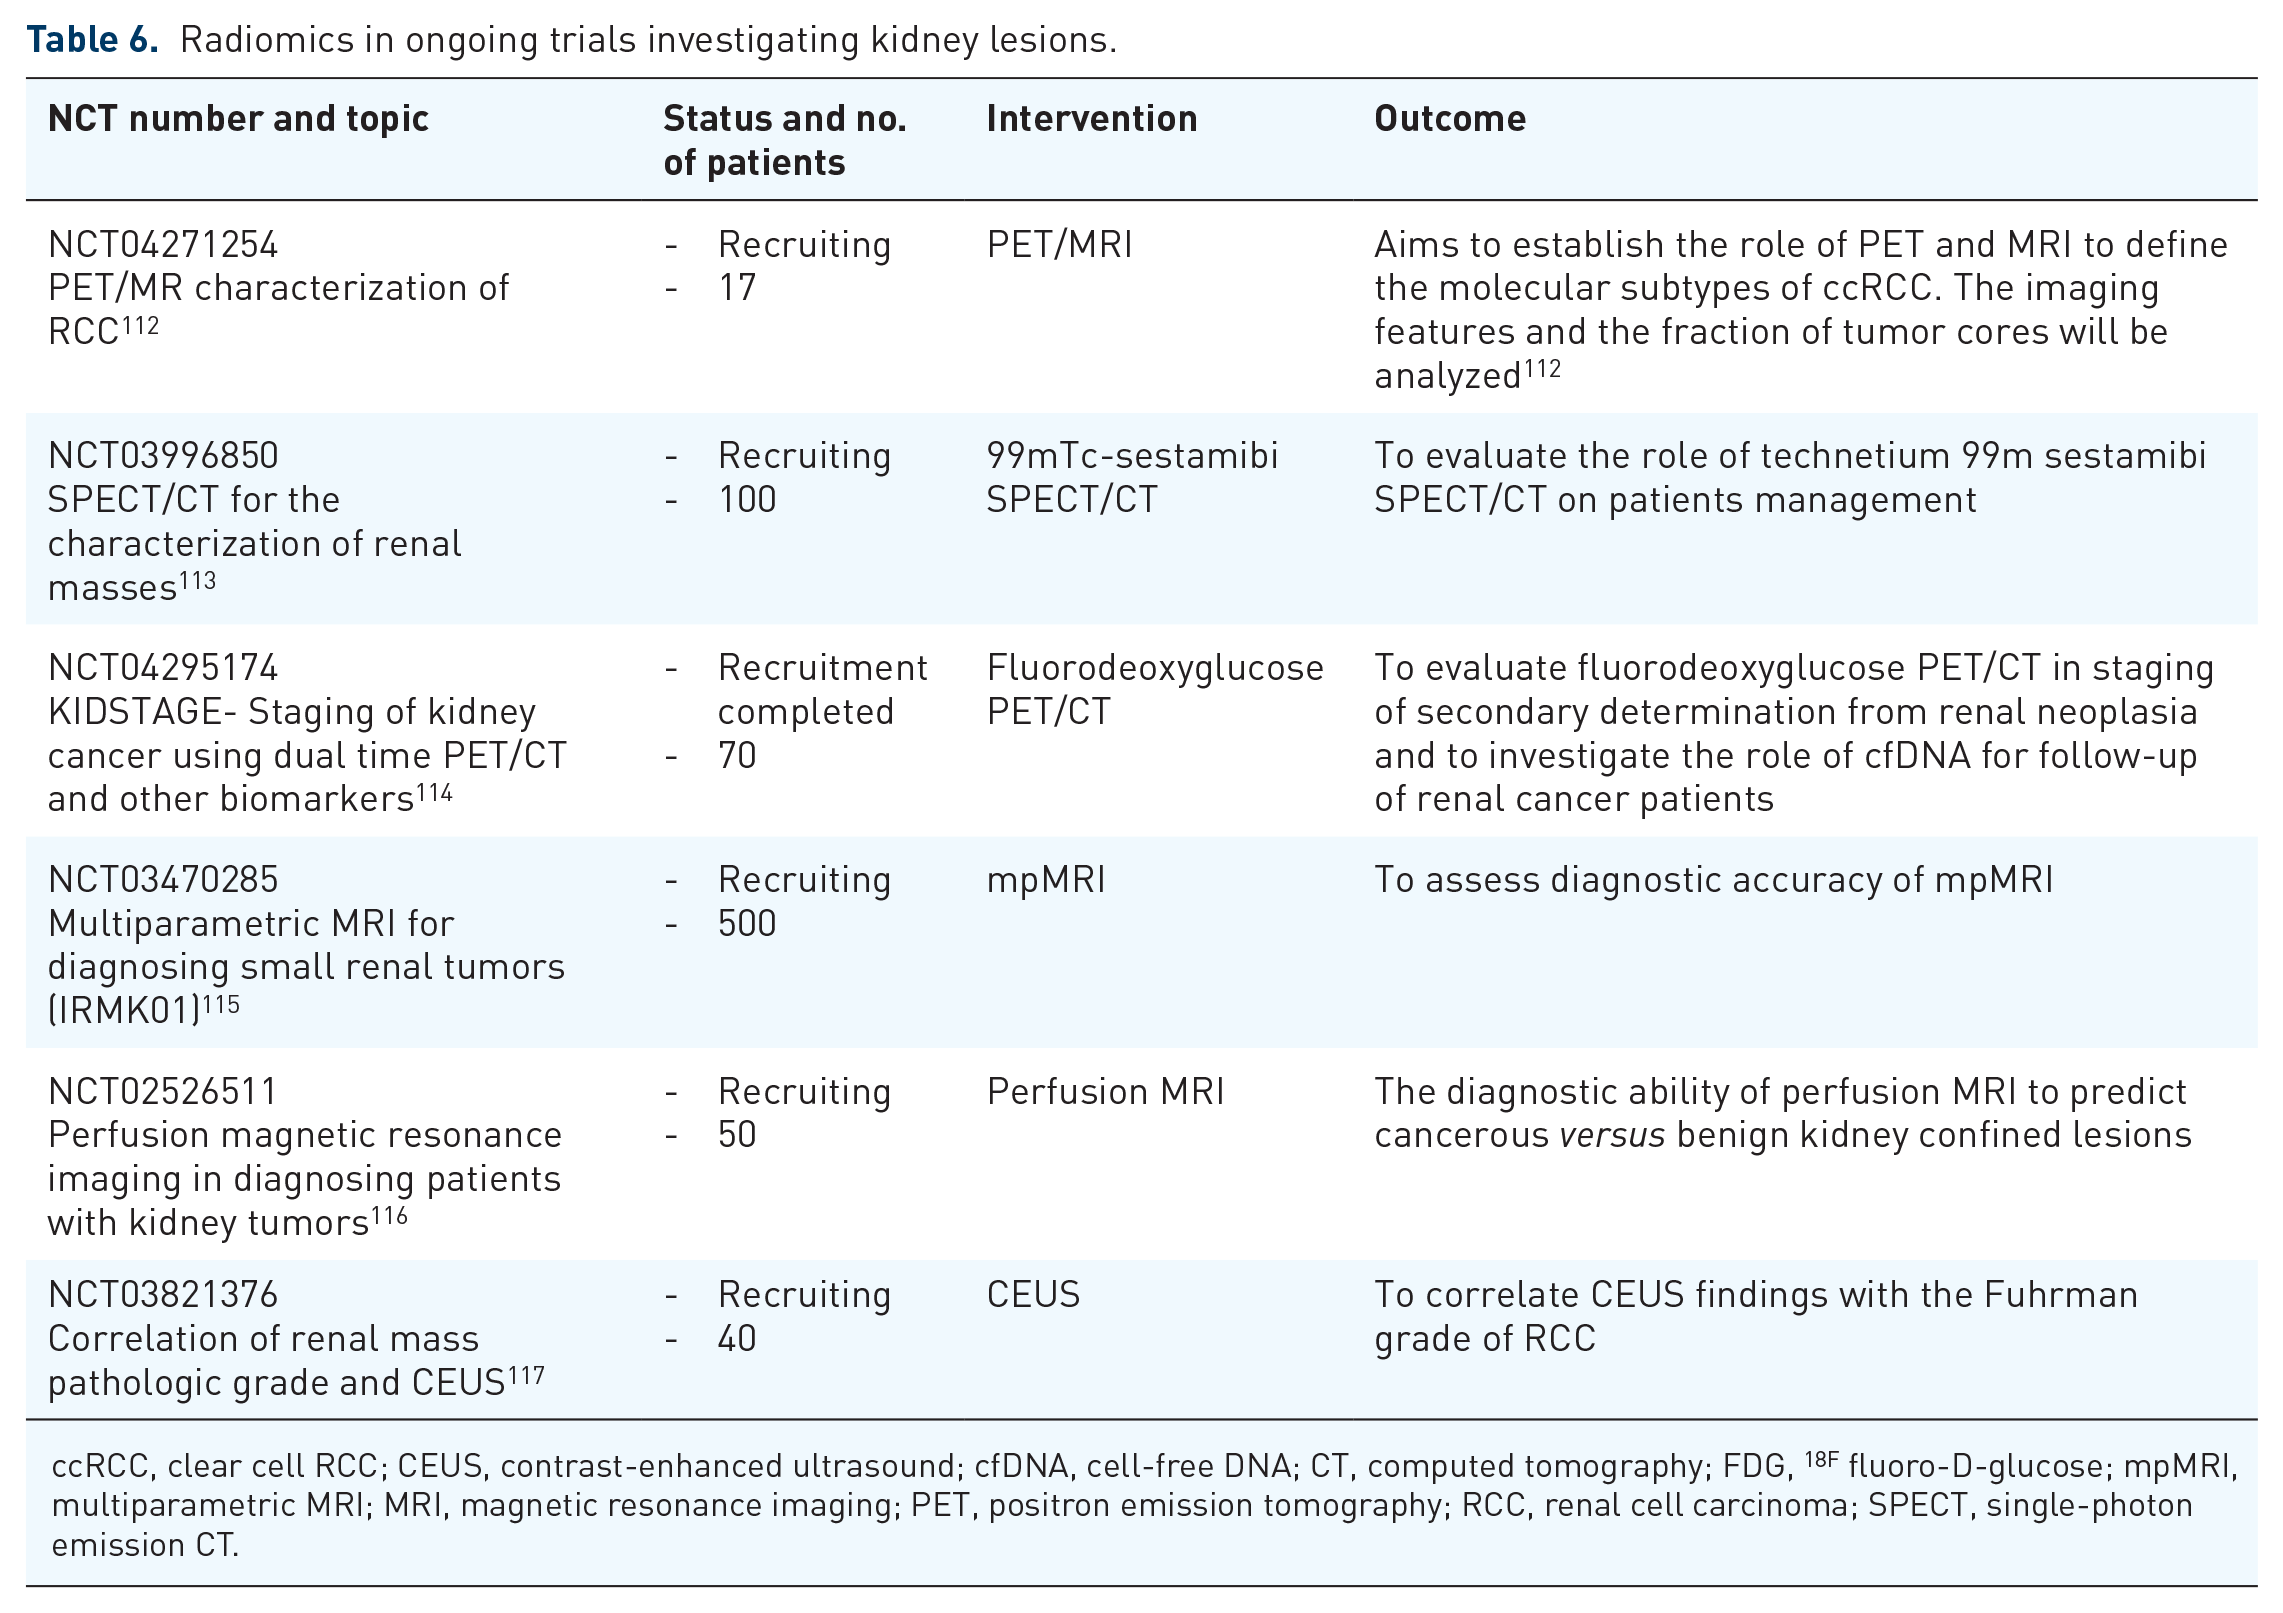
ccRCC, clear cell RCC; CEUS, contrast-enhanced ultrasound; cfDNA, cell-free DNA; CT, computed tomography; FDG, 18F fluoro-D-glucose; mpMRI, multiparametric MRI; MRI, magnetic resonance imaging; PET, positron emission tomography; RCC, renal cell carcinoma; SPECT, single-photon emission CT.
Comparison of AI algorithms used in radiomics studies
AI algorithms are defined as mathematical models of computers that allow the hardware to learn and work independently. 118 The ML algorithms are classified into four major categories: supervised, unsupervised, semi-supervised, and reinforcement learning. 119 Supervised learning uses labeled data and collection training data to accomplish a task. 120 Decision tree, random forest, SVM, naïve Bayes, linear regression, and logistic regression are most frequently used in medical application area. 119 Unsupervised learning performs clustering, which means they sort the unlabeled data points into pre-defined clusters. The data point has to belong to one cluster with no overlap. There can be more than one data point in any given cluster, but a data point cannot belong to more than one cluster, without human intervention.119,121 K-means clustering and Gaussian mixture model are the most common employed learning methods that uses unlabeled data to develop models and to extract generative features, groupings in results, and exploratory purposes.119–121 Both supervised and unsupervised algorithms, such as K-nearest neighbor, neural networks, and reinforcement learning algorithms are being used in the evaluation of medical images. In this study, the identified articles used supervised ML algorithms. Furthermore, we will summarize the results and comparison derived from these studies. Some studies did not use any ML algorithms to analyze the variables obtained.64,71,77–79,105–108 SVMs are identified as the most used algorithms used for classification in the analyzed studies.34,36,42,46,47,51,55,66,74 When trained, the learning process searches to differentiate between two data sets (for example, benign from malignant kidney tumors or to differentiate between certain tumor types and some of them to predict gene mutation or response to therapy). The data used to train and learn SVMs are not entirely used for this purpose. Just the closest data between two support vectors, which makes it a linear algorithm, that is useful when the two data sets are clearly separated. When data are perturbed, the performance is reduced.122,123 The latest developed AI algorithms are artificial neural networks (ANNs) that modulate the human brain functions. 124 ANNs were developed and used in several renal radiomics studies for the differentiation of chRCC and oncocytomas 66 and with adaptive boosting for differentiating non-cc-RCCs from cc-RCCs. 74 ANNs have artificial nodes, in layers that can have different transfer functions. The performance is good when data are of great quantity, as in real life and have the ability to identify and model complex relationship among data. The drawbacks are represented by the training that results in relative minimum and not absolute minimum of the error function and the overfitting of data because it lacks the ability to generalize data (it is relatively easy to observe their effect when the performance of training and test data sets starts to split in opposite directions). 125 Two studies used ANNs66,74 achieving best results in AUC along with SVMs, and two used CNNs62,75 having the advantage of not using hand-crafted features from experts. RFs algorithms combine predictive data of decision trees (forests) in one model. Each decision tree learns from data that are chosen randomly and calculates the average of the predictions as the final result. 126 RF has advantage of dealing with nonlinear data and can reduce the variables space to emphasize the value of each feature. 127 It has been used in vast number of studies that analyzed radiomics and kidney tumors. RFs obtained the best AUC in the articles published on radiomics and kidney lesions.32,36,38 Lasso regression (least absolute shrinkage and selection operator regression) is one of the algorithm models that modify and push regression coefficients to the nil value and improves the interpretability and can select important predictors for the studied pathology.128,129 In the renal lesions, radiomics studies were used to reduce overfitting with good results.49–53,55,70,111
The advancements in the study of radiomics and ML algorithms are huge, but still approximately 30% of studies used traditional algorithms for comparison.51,66,101,130–132 Therefore, direct comparisons have not been published in the literature so far. More data are required for a more precise evaluation and generalization of the best ML algorithms to be used in radiomics research.
Current limitations and the future of AI and radiomics
Generally, when researchers develop AI models that can be applied to the analysis of radiomic features extracted from images, 133 they must consider the robustness and standardization of the proposed model. 134 We have found that a rather high number of researches have been performed using non-robust features. 135 Current imaging methods are not standardized, whether we talk about CT or MRI. All technical specifications of using different CT phasing, contrast enhanced or not, and also the classifiers used to discriminate between different radiomics features applied to analyze the gray zone levels of the studied renal lesions (SVM, histograms, and others) are not validated independently. Currently, the lack of internal and external validation of the proposed models cannot lead to the generalizability of these methods.
The reason of dimension reduction in radiomics is a method to increase the modeling performance using the highly relevant, robust, or uncorrelated features. This can lead to data perturbations 136 and contamination 137 and add bias to validation purposes. ML classifiers can select features during model development 67 and limit the biases of validation techniques. DL uses end-to-end automatic pipelines and in radiomics, the robustness and selection of features is not properly understood. The currently used ML models did not make it clear as to which one of those are better to be used or what combination of imaging methods should be used (contrast enhanced or not). In depth, analysis of the most appropriate AI method to be applied (or combinations) should be studied further. MRI seems to have less ability to provide a good evidence for the use in radiomics. The DL methods provide good evidence that support further research for clinical use especially with its combination with genomics data (radiogenomics). 33 Only a few studies assessed the comparison between traditional biomarkers and radiomics in terms of clinical validity.47,51,99,101,130,131 Radiomics is able to evaluate large data sets, but the manual predefinition of metrics limits its performance.
Discussion
The novelty that radiomics can provide more objective interpretation of images to limit the subjective image interpretation of radiologists with the aim of improving renal tumor diagnostic accuracy 14 is gathering more followers and this research is keen to provide deeper insights on the possible use and clinical practice translation. There is an important percentage of renal lesions (up to 30%) 9 that are benign at histopathology result for patients that underwent partial or radical nephrectomy and this is one of the reasons that radiomics is seen with the potential to improve the preoperative detection of benign tumors. AI and its subset ML is increasingly used in radiomics analysis for assessing renal lesions. Being a new area of research and development, there are still a lot of challenges that limit the implementation in current practice. When we look at the studies that analyzed the role of radiomics in differentiating benign from cancerous tissues, we see that all identified articles have retrospective design, and another limitation is due to the small number of images or patients included in studies, that also still need manual delineation and contouring of ROIs or VOIs, and having semi-automated method of analysis. Also using different scanners, protocols for obtaining images, AI software for texture, shapes, and volumetric or geometrical analysis of big data limits the possibility of properly defining gray zone features. AI through ML and DL may even go few steps further and may help to automize the acquisition and reporting of ultrasound, CT scans, and MR images. The first step in the process of reducing the workload and costs was kidneys volumetric analysis, which, for instance, can now be completely performed by DL algorithms both on ultrasound138,139 and CT scans.140,141 This can improve the accuracy of images pre-processing for subsequent radiomics features extraction. 141 Moreover, accurate volumetric segmentation of kidneys and tumor is pivotal when nephron sparing surgery is planned in patients with kidney cancer. 142
Models trained and validated indicate a roughly big difference in AUCs obtained from these studies (from 0.64 to 0.97). These can lead to the conclusion that by using different AI algorithms and mathematical models for statistical analysis (most used: RF, SVM, logistic regression, and linear discriminant analysis) show that radiomics still is an area of intense research and has limitations in understanding the fundamentals of how AI and ML can improve the outcomes of studies. The comparison of the AI models with expert radiologist need to be further improved in prospective studies and we believe that future result will show the ability, especially of DL algorithms, to ease the clinical embrace of radiomics and AI. AI may be the key to provide fast, reliable reports from all radiologists, reducing inter-reader variability, and to obtain improved reading accuracy. Conclusions are indeed subjective due to the radiologist’s interpretation and experience.143,144 Toda et al. 145 demonstrated that DL algorithms in contrast-enhanced CT have high accuracy for the diagnoses of SRMs with both internal and external validation. Manual or semi-automated segmentation have been used in most of the studies (either on CT or MRI platforms); Kart et al., 146 using national databases of whole-body MR imaging from United Kingdom and Germany, developed and trained an automated segmentation DL model for abdominal organs; and Zhao et al. 147 clinically assessed assisted compressed sensing technology in renal MRI imaging with an AI algorithm that can adjust scanner settings to improve image acquisition and automatically adjust images to patients’ movements, and can allow ultra-fast MR imaging acquisition.
Good accuracies have been reported5,33 and one author 39 implemented a DL method to study a variety of kidney lesions to mimic the real world and clinical practice setting. ccRCC tumors have a poorer prognosis than other types of renal tumors, such as papillary RCC or chRCC. Therefore, the preoperative differentiation of related tumors using ML-based radiomics interpretation could lead to differentiation of non-ccRCCs from ccRCCs, 74 and could achieve an accuracy of up to 89.9%. 34 Grading of tumors assessed by radiomics and AI studies can be affected by sarcomatoid features, but nonetheless studies developed to differentiate this aspect with poor accuracy of only 55%. 132 Due to recent advancements in genomics and radiomics, radiogenomics could improve the identification of aggressive tumors and hence establishing tailored treatment. The encountered genomic alterations in ccRCC could be heavily studied due to the rarity of mutations and the stability of sample and radiomics and AI models. 148 Studies showed good AUCs, specificity, sensitivity and accuracy, especially for RF algorithm but in the evaluation of biologic aggressiveness.99,100 Many of the studies were not externally validated, AI systems will need further training and independent validation to limit the risk of low generalizability.149,150 DL provides good evidence that support further research for clinical use (ROI data set reported ACC of 0.97 while RBR had an accuracy of 0.93). 33 Despite the interesting results highlighted in this review, it is worth noting that due to some main issues – mostly related to the paucity of trials, the lack of homogeneity of data, especially with regard to ROI and end-points of these studies – evidence on the ability of radiomics in the evaluation of response to TKIs is premature for its integration into routine clinical practice at the present time. Summarizing the evidence, we can state that the imaging methods are not standardized, either CT or MRI, including all specifications of using different CT phasing, contrast enhanced or not, and also the classifiers used to discriminate between different radiomics features applied to analyze the gray zone levels of the studied renal lesions. The ML models will have to be better trained with vast amounts of data, and which is better to use will have to be determined by future studies. In depth analysis of the most appropriate AI method to be applied (or combinations) should be studied further. MRI seems to not have the ability to provide reliable evidence for the use of radiomics.
Conclusion
AI evidence so far indicates a strong association with improved sensitivity, specificity, accuracy in detecting and differentiating between renal lesions, and its algorithms that can adjust scanner settings to improve image acquisition (especially the gray zone levels) and standardization of scanner protocols between institutions will improve preoperative differentiation between benign, low-risk cancers and clinically significant renal cancers. Radiomics holds the premises to enhance the diagnostic ability of imaging tools to characterize renal lesions, but integration in clinical practice will have to be preceded by standardized radiomics models and methodology, and future prospective external validation of obtained data and their comparison with existing traditional, well-validated tools, will have to be performed prior to further integration in current practice.