
Abstract
Aim:
Many studies support an inverse relationship between benign prostate hypertrophy (BPH) size and incidence of prostate cancer (PCa), but the causal link between these conditions is poorly understood. Recent studies suggest that a growing transition zone (TZ) in the prostate may induce pressure on the outer peripheral zone (PZ), leading to atrophy of the glandular tissue where PCa often originates, providing a possible explanation for this interaction. To further investigate this phenomenon, our pilot study uses magnetic resonance imaging (MRI) to examine quantitative zonal changes in a consecutive cohort of prostates.
Methods:
MRI scans of male patients [n = 204, 61.57 ± 13.90 years, average body mass index (BMI) 29.05 kg/m2] with various prostate sizes were analyzed statistically to identify possible associations between prostate parameters, such as total prostate volume (TPV) and peripheral zone thickness (PZT).
Results:
TPV and PZT demonstrated a weak, inverse correlation (r = −0.21, p = 0.002). However, when examining the plotted data, the relationship between TPV and PZT was significantly different when the cohort was divided into two groups; lower TPV: ⩽87.5 ml (n = 188, TPV xˉ = 36.01 ± 18.18 ml), and higher TPV: >87.5 ml (n = 17, TPV xˉ = 125.69 ± 41.13 ml). Average PZT differed significantly between these groups (z = −3.5554, p = 0.0004).
Conclusions:
PZT was significantly different for patients with lower versus higher TPVs, suggesting that, above a certain point of BPH growth, the PZ is unable to withstand pressure from an expanding TZ, supporting the notion that growing BPH causes compression of the PZ glandular tissue, and, therefore, BPH may be protective against PCa.
Introduction
The two most common urologic diseases in elderly men are benign prostatic hyperplasia (BPH) and prostate cancer (PCa). Histological evidence of BPH is found in over half of the population of men over 50 years, and PCa is one of the most common types of cancer in males. 1 Both disease entities are growth related, and their interaction is not well understood. 2 Recent epidemiological and clinical studies indicate an inverse relationship between BPH and PCa incidence, implying that BPH may be protective against PCa.3,4 The causal factor in this relationship is poorly understood, and further analysis of the zonal changes within the prostate could provide more insight into the dynamic interactions between BPH and development of PCa.
The prostate contains three unique zones: a central zone (CZ), a transition zone (TZ), and a peripheral zone (PZ). 5 It is well documented that TZ expansion is the major contributor of an aging, growing BPH prostate, whereas the peripheral zone volume (PZV) has a weak correlation with age.4,6,7 While PCa can originate in other regions of the prostate, it is well documented in the literature that the majority of PCa (around 80%) originates in the PZ.8,9 Increased capsule thickness and atrophy of PZ glands have been correlated with large BPH prostates. 5 This suggests that the expanding TZ could be applying pressure on the outer PZ against its capsule, providing a potential explanation for the inverse relationship between PCa and BPH.10,11
In this context, magnetic resonance imaging (MRI) is a noninvasive imaging technique to visualize the different prostate zones and the data may be useful in studying this relationship between prostate zones.12,13 In diagnostic procedure, the quality of MRI scans is critical for PCa detection, and recent literature has even investigated possible quantification methods of prostate scan quality. 14 Additionally, studies have indicated that a movement toward a standardized assessment criterion is becoming necessary for diagnostic MRI reading, as reporting and interpretation of images as well as proper training is thought to be crucial to accurately read prostate scans. 15 Therefore, MRI quality was an important consideration in this study to eliminate measurement error, and our investigating radiologist contemplated the aspects above during selection of what we refer to as reliable scans.
The current literature is lacking an explanation for the inverse correlation of BPH and the incidence of PCa. To our knowledge, this is the first study using MRI to collect quantitative zonal prostate measurements in order to investigate any dynamic anatomical changes of the different prostate zones as a response to BPH growth.
Materials and methods
After obtaining Institutional Review Board approval by Texas Tech University Health Sciences Center (HSC) (#L20-147), a retrospective consecutive study was conducted measuring the different zonal dimensions of the prostate using MRI imaging. The IRB waived the need to obtain informed consent.
Participants
Male patients (n = 204, 61.57 ± 13.90 years old) who underwent pelvis MRI screenings at the University Medical Center in Lubbock, Texas between 29 April 2019 and 1 March 2020, were included in a consecutive cohort, in order to avoid any bias. The study inclusion criteria were: (a) males aged between 18 and 89 years, and (b) reliable pelvic MRI scans acquired on a 3 Tesla Magnet showing the prostate specific region. Exclusion criteria were: (a) known malignancy of the pelvis other than PCa; (b) prior androgen deprivation/hormonal therapy and/or radiation therapy of the pelvis, and/or prior surgical treatment of the prostate (including transurethral resection of the prostate); and (c) poor imaging technique. The descriptive characteristics of the study population are shown in Table 1.
Patients’ characteristics by TPV.

Values are expressed as column frequencies (%) or means ± SD.
BMI, body mass index; CGH, central gland height; CGL, central gland length; CGV, central gland volume; CGW, central gland width; NS, not statistically significant; PSA, prostate-specific antigen; PZV, peripheral zone volume; PZT, peripheral zone thickness; SD, standard deviation; TGH, total gland height; TGL, total gland length; TGW, total gland width; TPV, total prostate volume.
Measures
From the MRI scans, the investigating radiologist compiled a wide range of parameters for each patient: central gland length (CGL), width (CGW), and height (CGH) to determine central gland volume (CGV); total gland length (TGL), width (TGW), and height (TGH); peripheral zone volume (PZV); PZT measured at 4:00, 6:00, and 8:00 positions determined average PZT; capsule measurements taken at the 4:00, 6:00, and 8:00 positions determined average capsule thickness (ACT). These measurements at 4:00, 6:00, and 8:00 positions were done at the mid-prostate level (also called equatorial level) as recommended in previous histo-anatomical studies and considered as the most representative area for the PZ. 5 Serum prostate-specific antigen (PSA) levels were collected from blood samples.
TPV was calculated from the addition of CGV and PZV. Additionally, refer to Table 2 for an expanded MRI protocol used for the assessment of our subjects.
MRI protocol.

BW, bandwidth; DCE, dynamic contrast-enhanced; DWI, diffusion weighted imaging; FOV, field of view; FSE, fast spin echo; MRI, magnetic resonance imaging; NEX, number of excitations B values for DWI: 50 and 800 temporal resolution for DCE: 5 s plane resolution for scans: 3 mm; SE-DW-EPI, spin-echo diffusion-weighted echo planar-imaging; SPGR, spoiled gradient echo; TE, echo time; TR, repetition time.
Statistical analysis
We first examined the relationship between TPV and our primary outcome: PZT. Upon plotting the data, the relationship between TPV and PZT (depicted in Figure 1) demonstrated a potentially significant discrepancy for PZT between those patients whose TPV was at or below 87.5 ml (IQR range for PZT: 5.83–9 ml) and those greater than 87.5 ml (IQR range: 3.97–6 ml).

Scatterplot of total prostate volume (ml) and PZT (mm). Each blue dot represents a patient’s measurement. The red line denotes the stratification line (87.5 ml) where patient’s PZT appeared, on average, significantly lower after 87.5 ml.
Therefore, patients were stratified TPV at or below 87.5 ml (lower TPV: n = 188, TPV xˉ = 36.01 ± 18.18 ml) and above 87.5 ml (higher TPV: n = 17, TPV xˉ = 125.69 ± 41.13 ml). To determine if there was a significant difference between PZT for patients between these groups, a Mann–Whitney U test was conducted; t tests were performed to determine if there was a significant difference between all other parameters by groups; results can be found in Table 1. The Spearman correlation (performed for TPV and PZT) and Pearson correlations were conducted to examine the correlations between TPV and secondary outcomes: CGL, CGW, CGH, CGV, TGL, TGW, TGH, PZV, ACT, age, PSA, body mass index (BMI; available only for 127 patients) and race (available only for 183 patients). A significance level of p < 0.05 was deemed statistically significant. We conducted all analyses using Statistical Analysis Software (SAS) Version 9.2 (SAS Institute Inc., Cary, NC, USA).
Results
The Mann–Whitney U test results indicated a significant difference (z = −3.5554, p = 0.0004) between the average PZT in the lower and higher TPV groups. In addition, significant differences were found for the following parameters between lower and higher TPV groups: age, CG and TG length, width and height, CGV, TPV, and PZV. Results from the Spearman’s correlation indicated a weak, yet statistically significant, negative correlation between TPV and PZT (−0.21, p = 0.002). However, when grouped by lower and higher TPV, neither sub-cohort was significantly correlated with PZT. Strong positive significant correlations were found between TPV and CGL (r = 0.90, p < 0.0001), CGW (r = 0.85, p < 0.0001), CGV (r = 0.96, p < 0.0001), TGL (r = 0.89, p < 0.0001), TGW (r = 0.81, p < 0.0001), and TGH (r = 0.89, p < 0.0001). A positive correlation was also seen between TPV and age (r = 0.35, p < 0.0001). The correlations are reported in Table 3.
Correlation table for prostate parameters in the study.
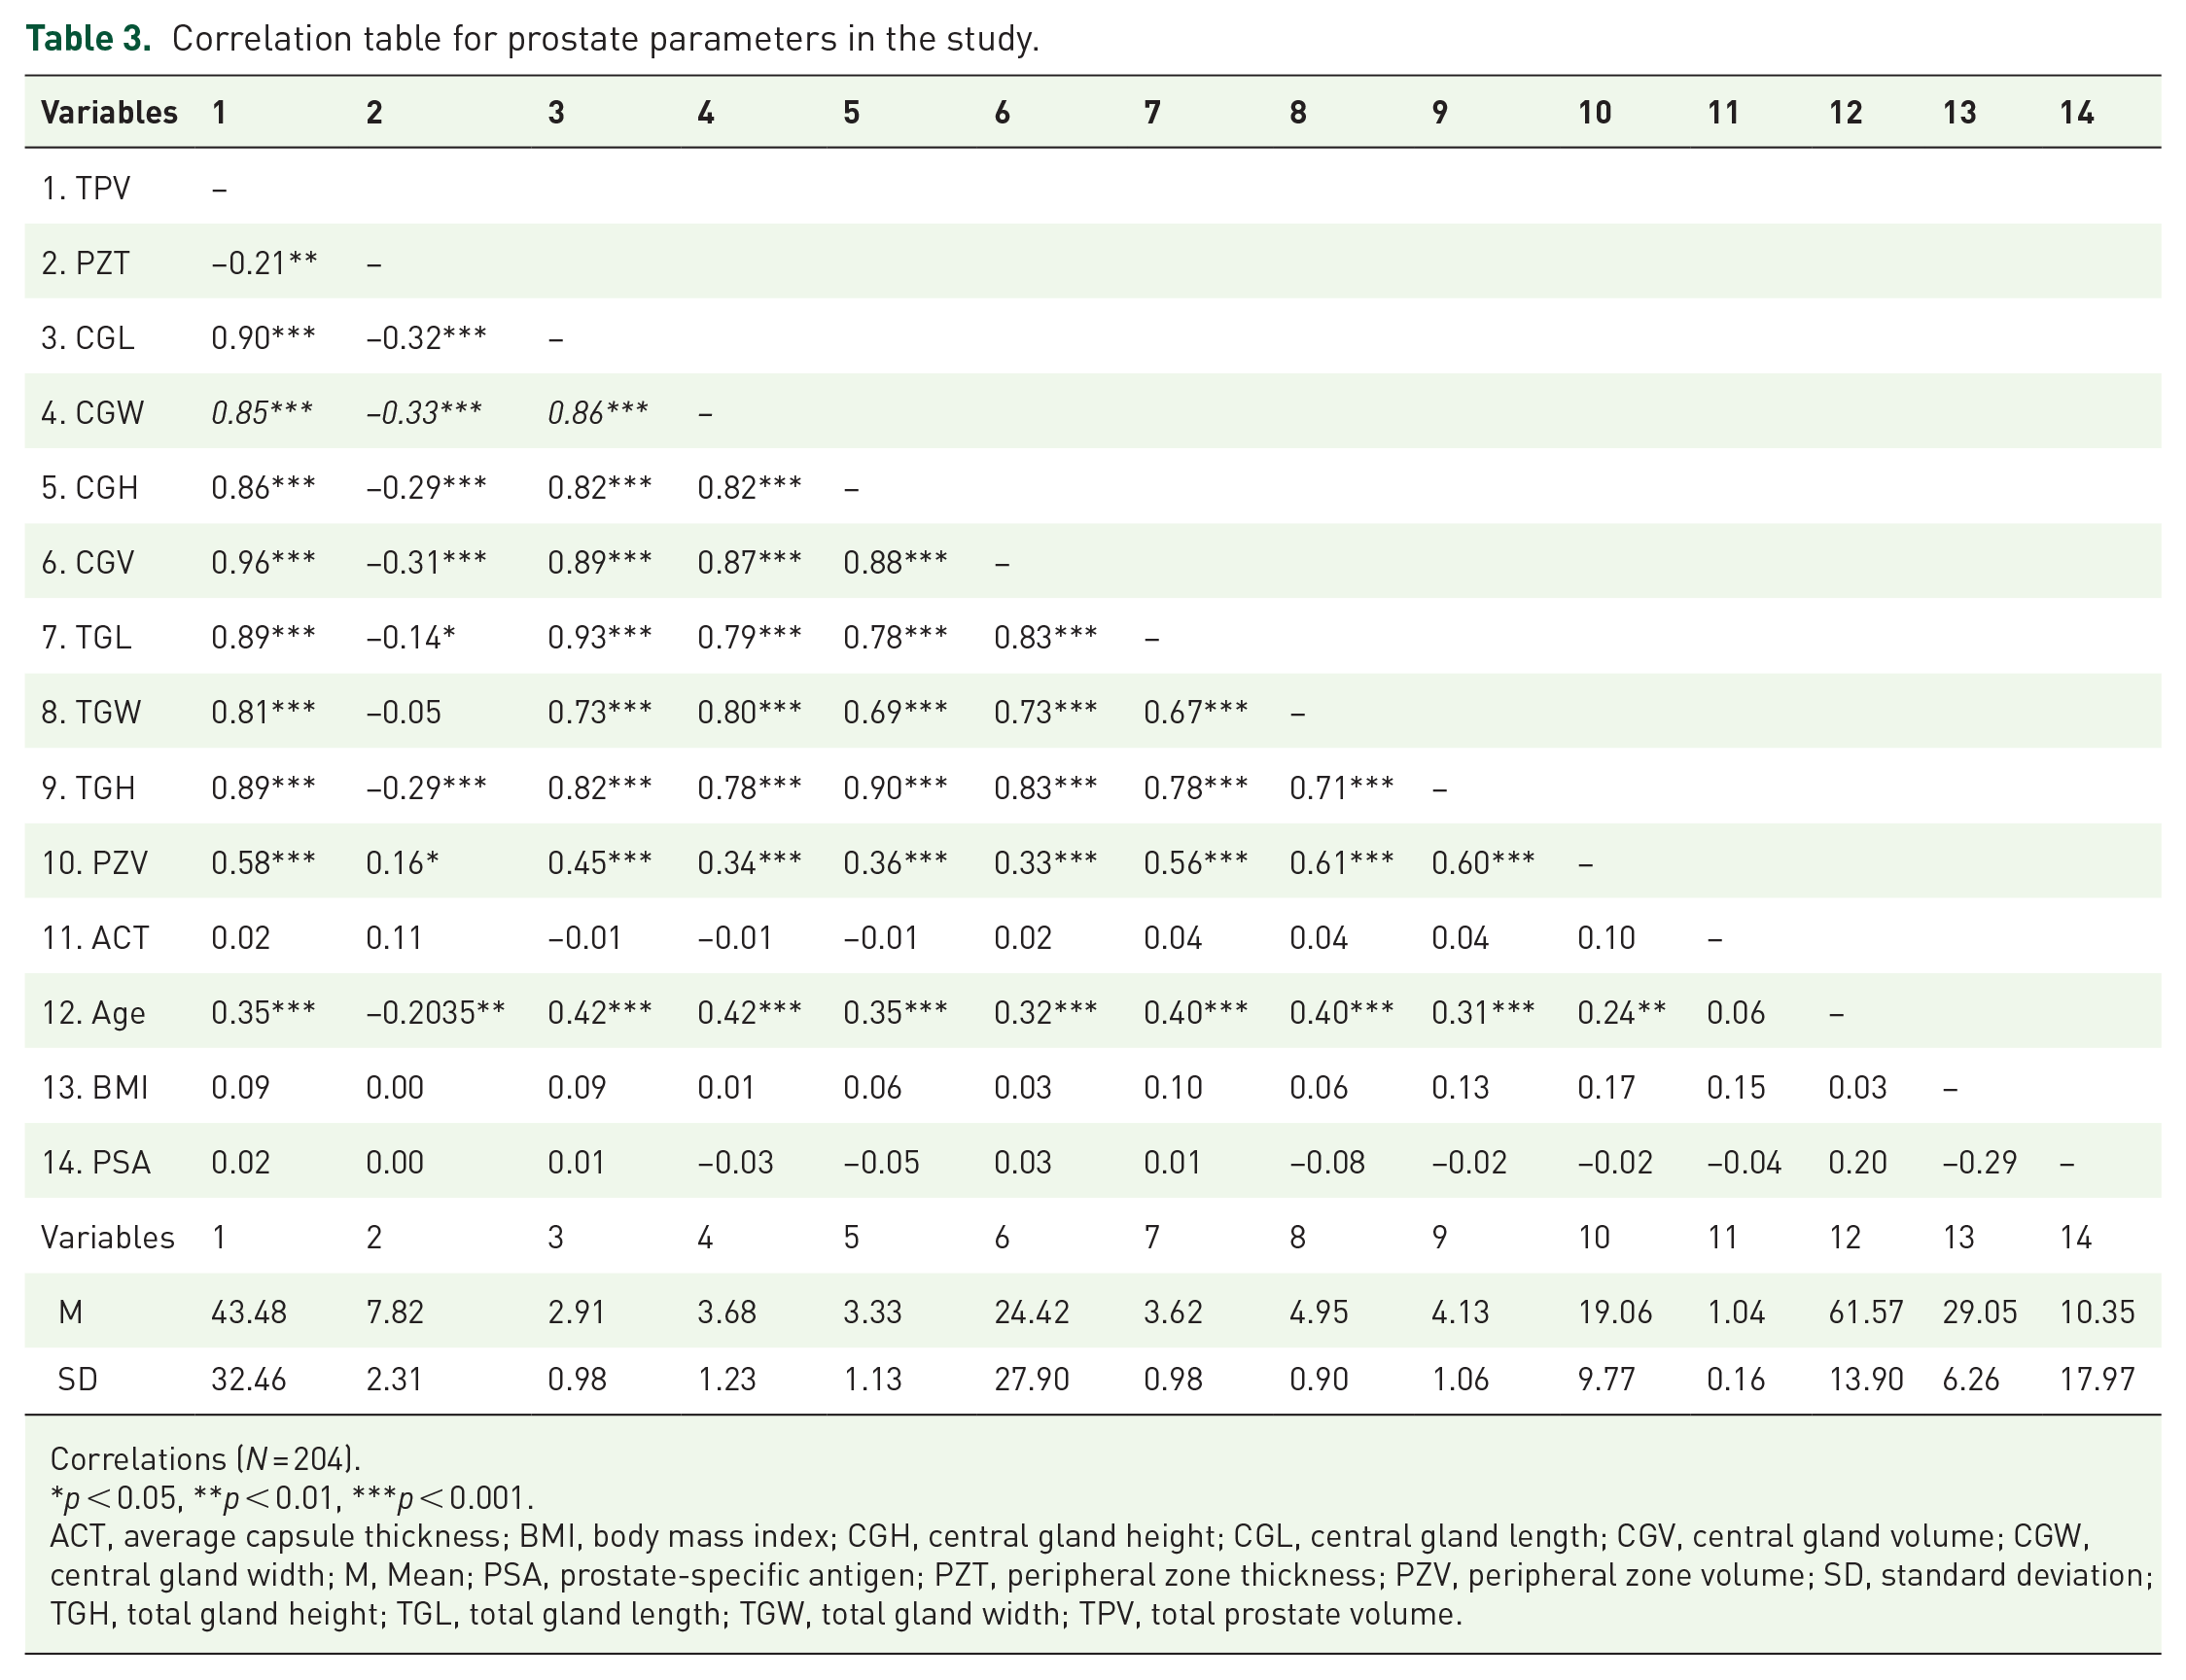
Correlations (N = 204).
p < 0.05, **p < 0.01, ***p < 0.001.
ACT, average capsule thickness; BMI, body mass index; CGH, central gland height; CGL, central gland length; CGV, central gland volume; CGW, central gland width; M, Mean; PSA, prostate-specific antigen; PZT, peripheral zone thickness; PZV, peripheral zone volume; SD, standard deviation; TGH, total gland height; TGL, total gland length; TGW, total gland width; TPV, total prostate volume.
Discussion
Numerous clinical studies have demonstrated an inverse relationship between BPH prostate volume and the incidence and aggressiveness of PCa: as prostate volume increases, incidence of PCa decreases.10,12,16–18 Furthermore, patients with cancer in larger prostates show a better prognosis. Schroeder and an international group of co-authors published an extensive review addressing this phenomenon. 1 These findings are well established and have not been challenged in the literature. For instance, in one study, the incidence of PCa was reduced by 40% in larger prostates with a volume greater than 65 ml when compared with smaller prostates with a volume less than 35 ml. 16 However, more studies are needed to elucidate potential explanations for the relationship between BPH and the development of PCa.
In young males, a thin capsule composed of only smooth muscle layers and an outer collagenous layer surround the posterior and lateral, but not the anterior part of the prostate.19,20 Therefore, this capsule is often described as a “false capsule” not covering the entire organ.21,22 With enlargement of the TZ in BPH prostates, the capsule thickens by developing additional fibrotic layers adjacent to the anatomical capsule, creating a plane of dissection that makes it surgically easier to peel out the BPH component when performing open or laparoscopic BPH prostatectomy. This thickened fibrotic layer is sometimes referred to by experienced urologists as the “surgical capsule”.17,18 This build-up of fibrotic and collagenous material within the PZ adjacent to the true capsule caused by BPH growth is associated with development of atrophic epithelial cells and glands within the PZ, which may explain the reduced incidence of PCa in large BPH prostates – a phenomenon that is well-documented in the literature, as outlined above. Histological (histo)-anatomical studies have also demonstrated that BPH growth within the TZ causes compression-related stress on the PZ. 5 These described histo-anatomical changes are confirmed by a mathematical model demonstrating that “BPH produces the volumetric expansion of the prostate in the perpendicular direction” to the area of the PZ. 8 Besides direct pressure-related tissue injury, reduced blood flow to the PZ may be another permeating factor for glandular atrophy within the PZ.
This disease process and changes of the zonal anatomy within the prostate caused by BPH are illustrated in Figures 2 and 3.

Schematic diagrams of a transverse view of the mid-prostate. Arrows demonstrate compression of the PZ caused by expansion of the TZ.

Examples of prostate specimen slides: H&E stained at 50× magnification. (a) Small prostate specimen (24 g). The external, posterior margin is inked and marked with an asterisk. A decent number of hyperplastic glands (as indicated by arrows) are present and easily visible in the PZ (black line) close to the thin capsule. (b) Large prostate specimen (100 g). The external, posterior margin is also inked and marked with an asterisk. The arrow indicates an atrophic gland within the extended fibrotic layer/surgical capsule (black line). This capsule is much thicker in comparison with (a), and no hyperplastic glands are present. Reprinted from Guzman et al. with permission by Dove Medical Press Limited. 26
In these histo-anatomical studies, most of the large prostates with a volume above 80 ml showed a thickened surgical capsule of 10 mm or more. 5 As a significant limitation of these studies, the boundary between the TZ and the PZ cannot be identified, and therefore histo-anatomical specimens are not suitable for measuring zonal thickness within the prostate, and these studies leave the question unanswered whether the PZT stays unchanged, grows, or shrinks in growing BPH prostates.
MRI is a useful imaging technique in determining specific measurements of the different prostate zones that histological-anatomical studies lack. On MRI scans, the exact boundary between the TZ and the PZ is well identified, much better than by ultrasound (where results are also operator-dependent).23–25 Very few studies using MRI to address the ‘fate’ of the PZ in BPH prostates exist in the literature. To our knowledge, this is the first MRI study addressing the TZ and PZ changes in BPH patients and their possible clinical implications for PCa. According to the data presented, once a TPV of 87.5 ml was reached, a noticeable drop in average PZ thickness was detected. A possible interpretation of this finding may be that the PZ is able to resist pressure from TZ growth to a certain point (in our study 87.5 ml TPV). After this level of TZ volume expansion, the PZ may be subjected to thinning, as seen by the significant decrease in average PZT in prostates with TPV above 87.5 ml. This data supports the hypothesis that TZ growth secondary to BPH leads to thinning of the PZ. Considering that 80% of PCa originates in the glandular epithelial cells of the PZ, and with increasing BPH volume, the PZ gets thinner as the glands within become increasingly atrophic and fibrotic, BPH may be protective against prostate cancer.8,9
This pilot study is limited and needs further verification. One specific limitation of these findings is the use of a single MRI reader. Including a larger number of radiologists reading the MRI data could eliminate any subjective bias and decrease personal error when interpreting the multiple scans. Furthermore, this entire study was conducted with subjects from one institution. This is important when considering the generalizability of these findings, as they may not directly reflect populations found in other locations. Another limitation of our study is the characteristics regarding the groups of subjects used when studying the relationship between TPV and PZT in the plotted data. Specifically, a small population is seen in the higher TPV group (>87.5 ml) relative to the lower TPV group (⩽87.5 ml), as the higher TPV group contained 17 subjects, and the lower TPV group contained 188 subjects. Additionally, the higher TPV group subjects were older than the lower TPV group, indicating a possible selection bias that could have affected our results. Enhanced uniformity between these groups could provide a more reliable view of our data. Finally, we recognize this research as a pilot study, and the inclusion of an increased total number of subjects could elevate the power of our data.
We see this study in the context of results reported over recent years to provide insight and understanding of possible interactions between BPH and PCa. More studies are necessary to support the evolving hypothesis of the mechanism for possible BPH protection against PCa. The histo-anatomical and imaging studies suggest explanations for the well-documented inverse association between BPH volume and the incidence of PCa. One main purpose of our study is to encourage other clinicians and investigators to further explore this interaction between BPH and PCa in order to better understand this phenomenon. If this hypothesis should be confirmed, it will transform diagnostics and treatment of BPH and PCa in the future.
Conclusion
The inverse correlation between BPH and PCa is well-documented and consistent in the literature. This is the first detailed MRI study focusing on the dynamic interaction of the different zones within BPH prostates. The data reported support the hypothesis that the growing TZ in BPH compresses the PZ against the prostatic capsule. Previous histo-anatomical studies showed as the TZ grows in BPH patients, volume and glandular density of the PZ as well as the prostate capsule, undergo significant changes causing secondary atrophy, apoptosis, and necrosis of the glandular tissue of the PZ, which may explain the possible protection of BPH against PCa. The outlined discussion should encourage further studies in exploring the relationship between prostate volume and the incidence and aggressiveness of PCa, in order to better understand this phenomenon. If this disease process of BPH-induced changes of the PZ and its subsequent protective potential against PCa is confirmed in future studies, it will have relevant clinical implications on diagnostics and treatment of BPH and PCa.
Footnotes
Author contributions
Werner TW de Riese, Jake Sellers, Rachel G. Wagstaff, and Naseem Helo contributed to the study conception and design. IRB approval, material preparation, data collection, and analysis were performed by Jake Sellers, Rachel G. Wagstaff, Werner TW de Riese, and Naseem Helo. The first draft of the manuscript was written by Jake Sellers and Rachel G. Wagstaff, the revisions of the manuscript were done by Werner TW de Riese, Jake Sellers, Rachel G. Wagstaff, and Naseem Helo. All authors read and approved the final manuscript.
Conflict of interest statement
The authors declare that there is no conflict of interest.
Funding
The authors received no financial support for the research, authorship, and/or publication of this article.
Ethics statement
This study was reviewed and approved by the Institutional Review Board of Texas Tech University HSC, Lubbock, Texas (approval #: L20-147).
Availability of data and materials
The data analyzed for this study are available from the corresponding author.