
Abstract
Background:
Changes in prostate cancer apparent diffusion coefficient (ADC) derived from diffusion-weighted magnetic resonance imaging (MRI) provide a noninvasive method for assessing radiotherapy response. This may be attenuated by neoadjuvant hormone therapy (NA-HT). We investigate ADC values measured before, during and after external beam radiotherapy (EBRT) following NA-HT.
Methods:
Patients with ⩾T2c biopsy-proven prostate cancer receiving 3 months of NA-HT plus definitive radiotherapy were prospectively identified. All underwent ADC-MRI scans in the week before EBRT, in the third week of EBRT and 8 weeks after its completion. Imaging was performed at 1.5 T. The tumour, peripheral zone (PZ) and central zone (CZ) of the prostate gland were identified and median ADC calculated for each region and time point.
Results:
Between September and December 2014, 15 patients were enrolled (median age 68.3, range 57–78) with a median Gleason score of 7 (6–9) and prostate-specific antigen (PSA) at diagnosis 14 (3–197) ng/ml. Median period of NA-HT prior to first imaging was 96 days (69–115). All patients completed treatment. Median follow up was 25 months (7–34), with one patient relapsing in this time. Thirteen patients completed all imaging as intended, one withdrew after one scan and another missed the final imaging. PZ and CZ could not be identified in one patient. Median tumour ADC before, during and post radiotherapy was 1.24 × 10⁻³ mm2/s (interquartile range 0.16 × 10⁻³ mm2/s), 1.31 × 10⁻³ mm2/s (0.22 × 10⁻³ mm2/s), then 1.32 × 10⁻³ mm2/s (0.13 × 10⁻³ mm2/s) respectively (p > 0.05). There was no significant difference between median tumour and PZ or CZ ADC at any point. Gleason score did not correlate with ADC values.
Conclusions:
Differences in ADC parameters of normal and malignant tissue during EBRT appear attenuated by prior NA-HT. The use of changes in ADC as a predictive tool in this group may have limited utility.
Introduction
Dose escalation of external beam radiotherapy (EBRT) improves outcome for prostate cancer. 1 However, this comes at the cost of increased treatment-associated toxicity. 2 If patients with a poor response to radiotherapy could be identified early in treatment, an adaptive approach allowing targeted treatment intensification could be applied, minimizing unnecessary side effects. Local changes within the treatment field identified on functional imaging may provide a noninvasive method for this.
Variation in tissue functional characteristics during radiotherapy can be quantified using diffusion-weighted imaging (DWI) to provide information on the random motion of water molecules. This is affected by cellular density and thus provides quantitative data on variation in the tumour microenvironment. The apparent diffusion coefficient (ADC), derived from DWI, has been shown to vary during prostate radiotherapy but a correlation with clinical outcome has not been demonstrated. 3 It is known that neoadjuvant hormone therapy (NA-HT) induces significant changes in dynamic contrast enhancement and DWI parameters but it is unclear what subsequent effect this has on tissue characteristics during radiotherapy.4,5
We report ADC values measured before, during and after a course of radical EBRT following NA-HT.
Materials and methods
This prospective study received ethical approval (REC reference 14/WA/1074), with participants providing written informed consent. Eligible patients were required to have ⩾T2c biopsy-proven prostate cancer and with an intention to receive 3 months of NA-HT with definitive radiotherapy. Exclusion criteria were performance status (PS) >1, contraindication to magnetic resonance imaging (MRI) or any previous malignancy excluding skin cancer. Each patient underwent three ADC-MRI scans; in the week before EBRT commenced, in the third week of EBRT and 8 weeks after its completion.
EBRT was delivered using volumetric arc therapy (VMAT). 60 Gy at 3 Gy per fraction in 20 fractions over 4 weeks was prescribed to the mean planned target volume using a 10 MV linear accelerator. Target volumes followed the previously described CHHIP study protocol. 6 No EBRT was given to the pelvic nodes.
Patients were imaged at 1.5 T (Achieva, Philips Medical Systems, Best, The Netherlands) using a cardiac coil with a flat Perspex table top (made in house) to match the radiotherapy treatment position. The MRI examination began with high-resolution T2w imaging (TSE, TR/TE = 4800/120 ms, matrix 560 × 560 × 20), then DWI (EPI with TR/TE 8000/70 ms, matrix 176 × 176 × 20, SENSE factor 2 LR, b = 100, 400, 800 s/mm²). All subsequent images were acquired with matrix 176 × 176 × 20 (overcontiguous slices) and SENSE factor 2.5 in the PE (LR) direction. Inversion-recovery turbo field echo (IRTFE) was used to measure T1 (TR/TE/α = 2.38/0.77 ms/12°, shot interval 4 s, ETL = 51, TI = 64, 250, 1000, 2500, 3900 ms). ADC maps were processed offline (ADCmap ver. 1.6 for Osirix).
ADC maps were registered to the high-resolution T2w images using in-house software and regions of interest contoured. 7 If available, reference was made to multiparametric (MP)-MRI acquired at referring centres before ADT commencement. The tumour, peripheral zone (PZ) and central zone (CZ) were identified by a genitourinary radiologist (BT) with 6 years’ experience of reporting MP-MRI. Tumour contours were manually copied from preradiotherapy imaging to subsequent mid- and post-treatment datasets using local anatomical landmarks to aid accuracy. Prehormone MP-MRI imaging, when available, was used to inform tumour identification. The median ADC value was calculated in each region after isotropic erosion by one pixel to mitigate for target identification error.
Statistical analysis
Due to the presence of outliers and the fact that the underlying population distribution of prostate ADC is not known, nonparametric analyses were considered appropriate. Wilcoxon signed-ranks test was used to compare ADC values for each structure through treatment and the differences between regions at each time point. Mann Whitney U was used to compare the effects of Gleason score and tumour size. Correlation between tumour ADC and Gleason score or tumour volume was assessed with Cuzicks’s trend test and Spearman’s rank correlation coefficient. A significance criterion of <0.01 was used in view of the multiple tests performed.
Results
Between September and December 2014, 15 patients met inclusion criteria and were enrolled in the study (median age 68.3 years, range 57–78). Patient characteristics are shown in Table 1. Median Gleason score was 7 (6–9) and median PSA at diagnosis 14 (3–197) ng/ml.
Patient demographics and tumour characteristics.
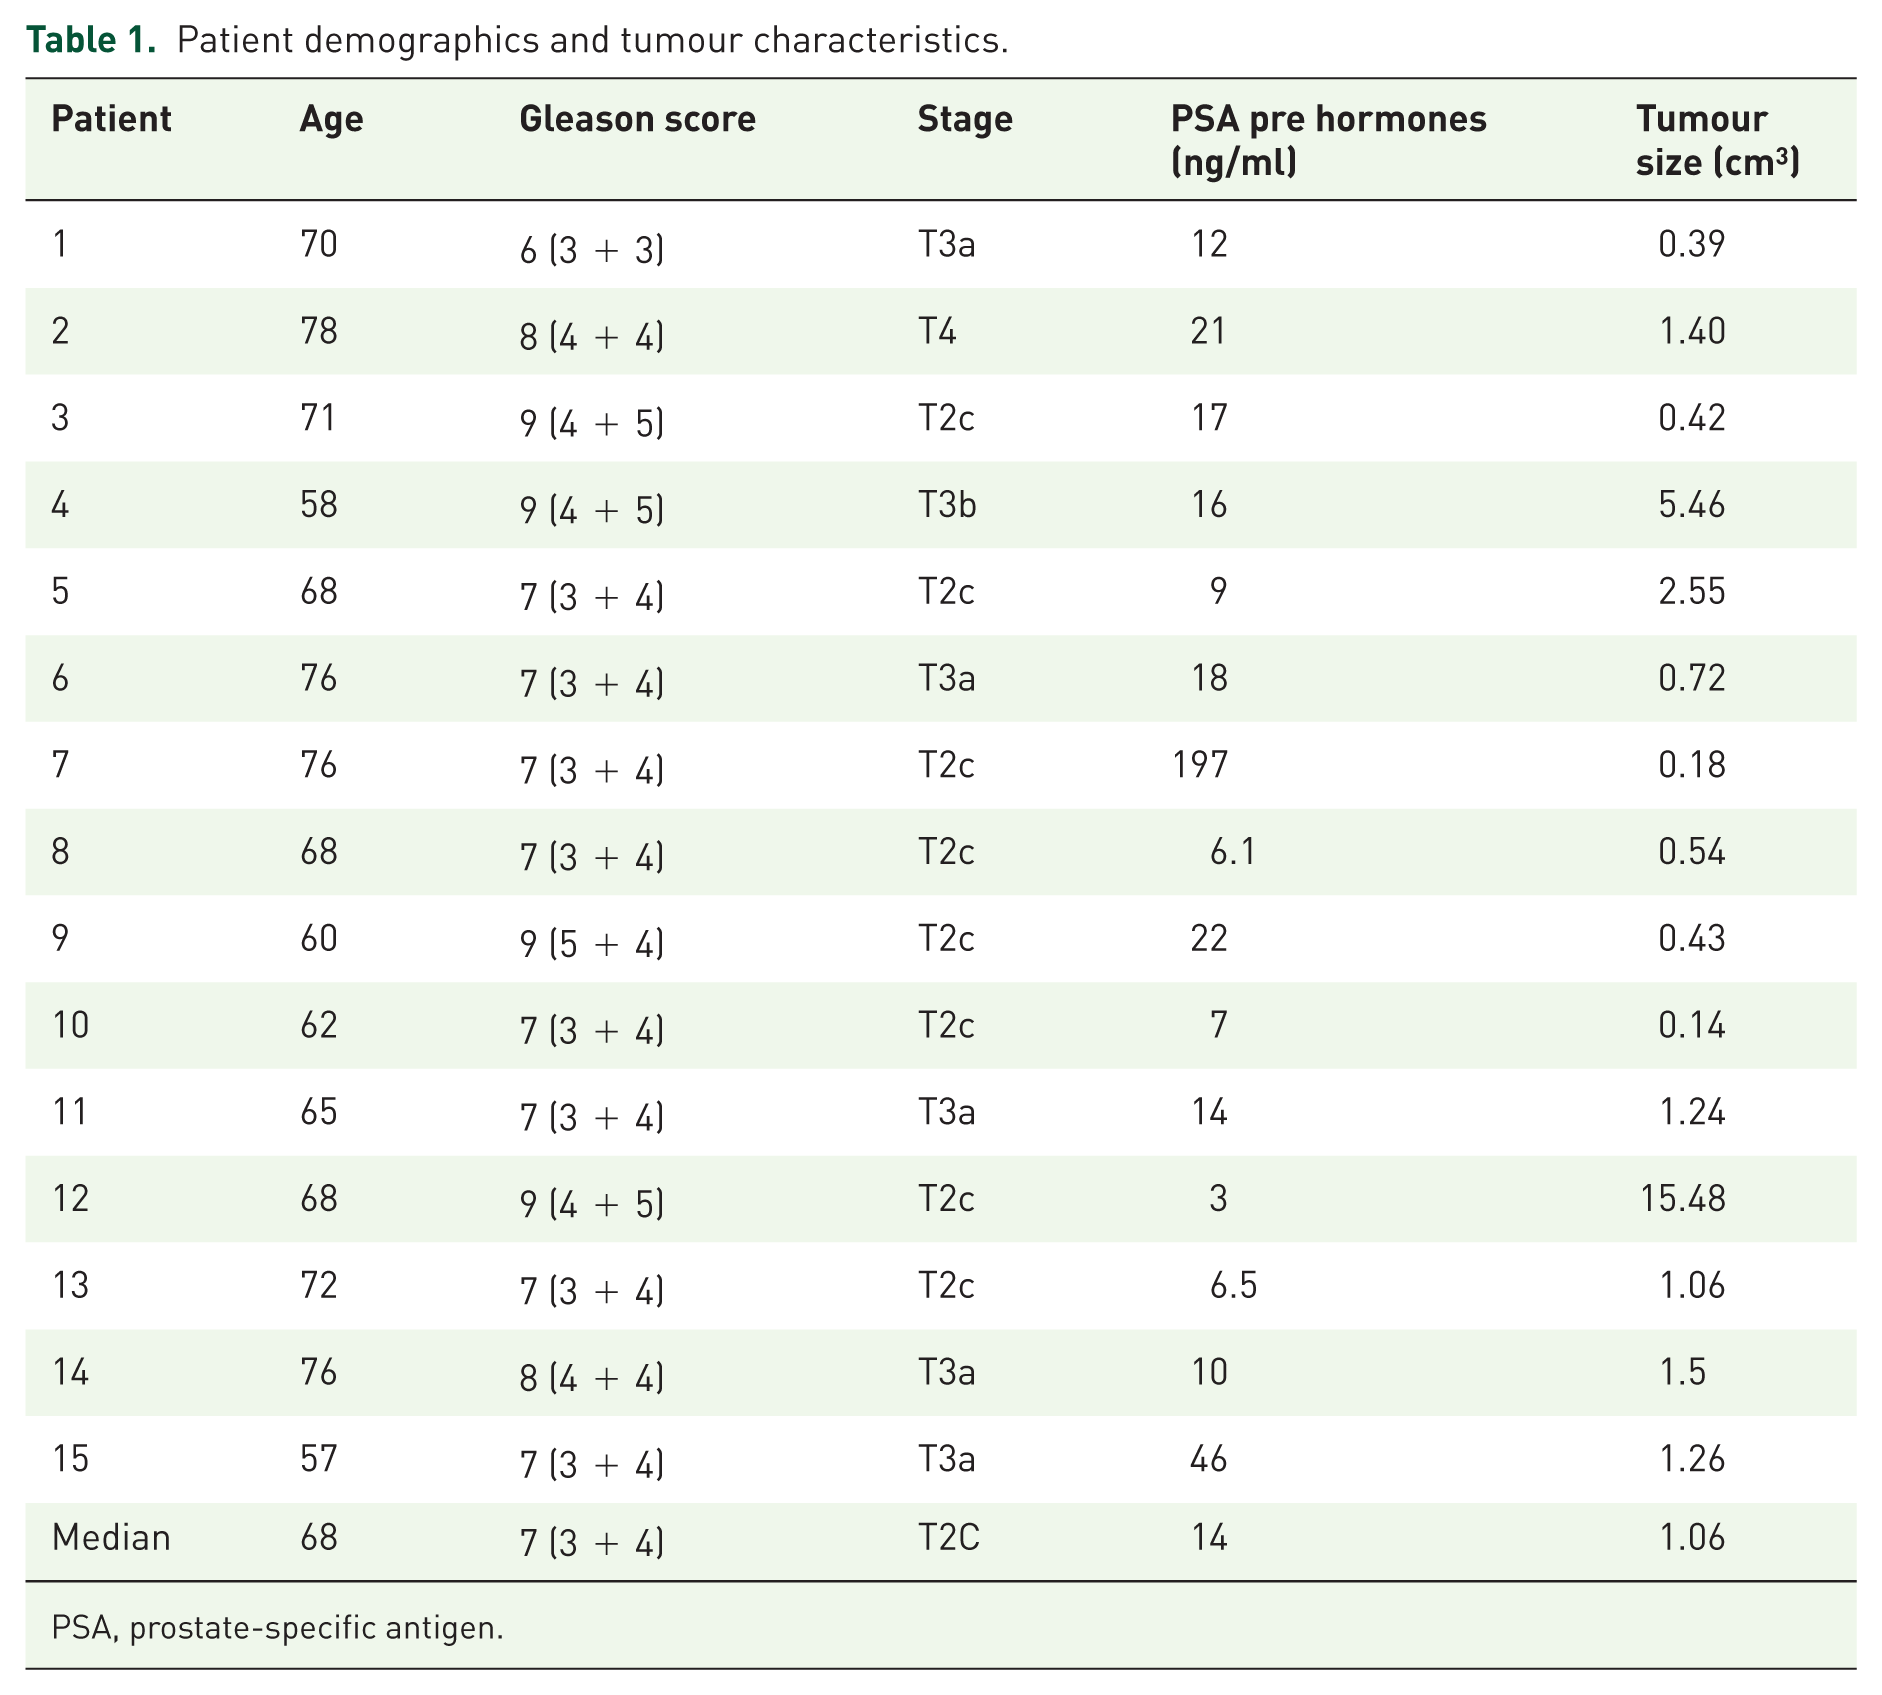
PSA, prostate-specific antigen.
Median interval from biopsy to first study ADC-MRI was 116 (91–449) days, with a median period of NA-HT prior to first study ADC-MRI of 96 (69–115) days.
Median follow up from the first day of EBRT was 25 months (range 7–34 months). Patient 14 died from metastatic lung cancer 8 months after completion of treatment, with undetectable PSA at last follow up, and patient 12 succumbed to metastatic prostate disease, clinically apparent 6 months after completion of EBRT. For the remaining 13 patients no biochemical failures occurred with a median PSA at last review of <0.1 ng/ml (range <0.1–0.3 ng/ml).
Pre-NA-HT MP-MRI was available for 12 patients to assist in tumour delineation with disease identified in all cases. For the remaining three patients the likely site of disease was identified using post-NA-HT imaging in combination with pathology reports. Thirteen patients completed all imaging as intended, with one patient withdrawing from the study after one scan and a second patient not attending their final imaging visit. One patient’s tumour burden was such that normal values from the PZ and CZ could not be calculated. All patients completed treatment as prescribed.
After NA-HT, during EBRT and post treatment the median tumour ADC was 1.24 × 10⁻³ mm2/s [interquartile range (IQR) 0.16 × 10⁻³ mm2/s], 1.31 (IQR 0.22 × 10⁻³ mm2/s) then 1.32 × 10⁻³ mm2/s (IQR 0.13 × 10⁻³ mm2/s) respectively (Figure 1). There was no significant variation in tumour ADC between any time point and no significant difference between median tumour and PZ or CZ ADC at any time point. Changes in ADC during and after EBRT for the 14 identified tumours with repeat imaging were variable (Figure 2). No significant association between Gleason score and tumour ADC (p = 0.81), or Gleason score and tumour volume (p = 0.15) was seen. A moderate statistically significant negative correlation was identified between tumour volume and ADC (r = −0.66, p = 0.007).

Median apparent diffusion coefficient (ADC) for regions of the prostate after 3 months of neoadjuvant hormone therapy but before radiotherapy, in the third week of radiotherapy and 8 weeks after completion of radiotherapy. CZ, central zone; PZ, peripheral zone.

Changes in prostate tumour apparent diffusion coefficient (ADC) after neoadjuvant hormone therapy but before radiotherapy, in the third week of radiotherapy and 8 weeks after completion of radiotherapy.
Discussion
This is the first report of prospective data on changes of ADC values in prostate tumour during and after EBRT following NA-HT. No significant difference between malignant and benign regions was seen at any time point. In addition, no significant change in ADC parameters for any region during and after treatment was identified.
Variation in ADC values are a result of altered diffusion restriction, thought to reflect cellular density and therefore of interest in assessing tumour response to therapy. ADC has been demonstrated to be lower in prostate cancer than normal tissue and has been shown to be associated with tumour grade and density.8,9 HT appears to have a differential effect on ADC values, causing an increase in tumour and a reduction in normal prostate tissue.4,5,10–12 The reduction in prostate volume and contrasting responses in ADC values between malignant and normal tissue during HT make tumour identification after its completion challenging.13,14 In the current study this issue was mitigated by having pre-NA-HT MP-MRI imaging available to aid tumour delineation in most cases.
The differing responses of tumour and normal tissue to HT provide some explanation for the smaller range of ADC values preradiotherapy presented here compared with previous work without NA-HT. In studies assessing ADC changes during EBRT without NA-HT the difference at baseline between normal gland and tumour has ranged from 29.5% to 51.3%, compared with 16.3% in the current cohort.3,15–17 This is consistent with previous work showing a reduction in variation of ADC from 41.2% to 28.6% following 3 months of HT. 5 That study reported a patient cohort with a higher grade of disease at diagnosis than the current group, which may have contributed to the larger variation in ADC.
Changes in tumour ADC during and after EBRT varied. Of 14 evaluable patients, 9 experienced an early decline in tumour ADC during EBRT, with the remainder rising. At 8 weeks post treatment six patients had a persistent reduction in ADC from pre-EBRT. A decline in prostate tumour ADC has been associated with poor outcome. One study found patients who did not experience a rise in tumour ADC after completion of radiotherapy subsequently experienced local failure. 18 It may be that the decline seen in some of the current cohort represents a similar poor response to treatment. Future long-term follow up may allow association of biochemical failure with ADC changes seen during therapy. Alternatively it may be that the suggested association of ADC decline and impaired outcome does not apply following NA-HT and that its use as a predictive tool in this setting is inappropriate.
A negative correlation was found between tumour size and ADC score, consistent with previous work. 19 It has been shown by others, with a trend towards significance in this current smaller study, that ADC also inversely correlates with Gleason score. 20 Larger lesions identified on MRI are associated with more aggressive disease, providing an explanation for the findings in the current study and suggesting that after NA-HT, lesion size does still correlate with tumour aggressiveness. 21 It should also be considered that larger tumour ADC values are less likely to be affected by a sampling error causing inclusion of a volume of surrounding normal tissue which might artificially raise the measured median ADC.
Our study has several limitations. First, the use of manual matching of tumour contours from initial imaging to subsequent scans introduces potential error in ADC measurement in tumour and normal tissue, although mutual anatomical landmarks were identified to inform contouring and mitigate this effect. Second, MRI at 1.5 T without an endorectal coil has a lower signal to noise ratio than 3.0 T imaging and delineation accuracy may be impaired by reduced image resolution. Third, our study assessed response during and after a 4-week course of hypofractionated radiotherapy and its findings may not be applicable to a longer course of conventional fractionation. Fourth, since patients did not undergo surgery, we were unable to obtain histopathological specimens to validate ADC findings. Fifth, relatively small patient numbers limit the study’s power to detect significant changes in ADC. Finally, we did not have a control group with repeat imaging to assess the repeatability of our method, although the general repeatability of DWI values has previously been confirmed.22,23
In summary, this work has demonstrated that differences in ADC parameters of normal and malignant tissue during EBRT appear attenuated by prior NA-HT. No significant variation was seen in tumour or prostate gland ADC during and after radiotherapy. The use of changes in ADC as a predictive tool in patients receiving EBRT after NA-HT may have limited utility.
Footnotes
Funding
Imaging was funded by a Manchester University Magnetic Resonance Imaging Facilities Grant. Contrast agent was provided from Christie Charitable Funds. This work was supported by Cancer Research UK via funding to the Cancer Research Manchester Centre (C147/A18083).
Conflict of interest statement
The authors declare that there is no conflict of interest.