
Abstract
Background:
Differentiating idiopathic Parkinson’s disease (IPD) from multiple system atrophy-parkinsonian type (MSA-P) is essential for optimizing patient care and prognosis, given the differences in disease progression and treatment response.
Objectives:
This study aimed to develop and evaluate a radiomics-based model using magnetic resonance imaging (MRI)-derived features to distinguish IPD from MSA-P.
Design:
A multicenter retrospective study.
Methods:
A multicenter retrospective study was conducted with 287 patients (186 IPD and 101 MSA-P) who underwent brain MRI. Radiomic features were extracted from T1-weighted imaging and T2-weighted imaging sequences, and various machine learning classifiers were applied, including logistic regression, support vector machine (SVM), ExtraTrees, extreme gradient boosting, and Light Gradient Boosting Machine. Model performance was assessed using area under the curve (AUC), accuracy, sensitivity, and specificity. A nomogram combining clinical and radiomic features was also evaluated.
Results:
The SVM model, selected as the base for the Rad-signature, achieved the best diagnostic performance, with AUCs of 0.885 and 0.900 in the training and testing cohorts, respectively. The Rad-signature significantly outperformed clinical-only models in distinguishing IPD from MSA-P. The nomogram incorporating radiomic and clinical features yielded the highest diagnostic accuracy (AUC = 0.973 and 0.963 for training and testing cohorts, respectively) and balanced sensitivity and specificity. Decision curve analysis confirmed the nomogram’s clinical utility.
Conclusion:
Radiomics-based MRI analysis offers a powerful tool for distinguishing IPD from MSA-P, enhancing diagnostic accuracy, and aiding personalized treatment planning. Integrating radiomic and clinical data may improve diagnostic workflows in clinical practice.
Keywords
Introduction
Idiopathic Parkinson’s disease (IPD) ranks as the world’s second most prevalent chronic, progressive neurodegenerative condition, 1 widely recognized for symptoms such as resting tremor, bradykinesia, rigidity, and postural instability. 2 The global burden of disease study forecasts that by 2030, the worldwide patient count will reach approximately 10 million,3,4 with China having the highest prevalence at over 1.7 million. 5
Multiple system atrophy (MSA) encompasses a collection of neurodegenerative disorders characterized by a combination of parkinsonism, cerebellar ataxia, autonomic dysfunction, and pyramidal signs. 7 MSA has two main variants: cerebellar (MSA-C) 8 and parkinsonian (MSA-P). 8 Nearly half of MSA patients exhibit symptoms similar to IPD. 9 With MSA-P often being challenging to differentiate from IPD, leading to misdiagnosis in about 20% of cases. 10
Compared to IPD, MSA-P progresses faster, responds poorly to treatment, and has a worse prognosis, often leading to severe disability within 5–6 years and death within a decade. 6 Therefore, accurate and timely diagnosis is crucial for efficient patient management, highlighting the importance of distinguishing between IPD from MSA-P for both clinical care and research purposes.
Globally, clinicians employ diverse brain imaging techniques to precisely diagnose and distinguish between IPD and MSA-P.11-17 These methods include magnetic resonance imaging (MRI), 12 susceptibility-weighted imaging, 15 diffusion tensor imaging, proton MR spectroscopy, magnetic resonance venography, single photon emission computed tomography, and positron emission tomography.18,19 However, early distinctions using standard imaging methods are not always feasible and specialized imaging has drawbacks like high cost, complexity, and high technical demands, limiting availability. Therefore, there is a need to develop a simple, cost-effective, efficient, and rapid imaging method to differentiate IPD from MSA-P.
Radiomic analysis, which involves extracting detailed quantitative features from images, provides deeper insights into the underlying pathophysiology going beyond conventional visual observation and enhancing diagnostic capabilities of imaging modalities like CT, MRI, and ultrasound. 19 Machine learning techniques can leverage large-scale imaging data to achieve precise diagnosis and prediction. 20 The emerging field of radiomics combined with machine learning in neurology shows promise in distinguishing IPD from MSA,4,21–23 with studies demonstrating high accuracy in differentiating IPD from MSA and other conditions using radiomic features from MRI images. The potential of integrating radiomics with clinical scores to enhance diagnostic efficacy is evident although further validation with larger sample sizes is necessary for specific differentiation between IPD and MSA-P.
This study aims to develop a predictive model utilizing radiomic features extracted from brain MR images through machine learning algorithms to differentiate between IPD and MSA-P. By leveraging standard brain MR images commonly obtained in clinical scans, this approach intends to support clinical decision-making and facilitate the customization of treatment plans for individual patients. The utilization of these models in routine clinical practice can streamline the differential diagnosis process between IPD and MSA-P, ultimately improving patient care outcomes.
Materials and methods
Study population
This retrospective study, approved by the Ethics Committee of Fujian Medical University Union Hospital, the Second Affiliated Hospital of Fujian Medical University, and Jinjiang Municipal Hospital, reviewed clinical and imaging data from patients diagnosed with IPD and probable MSA-P from January 2016 to April 2023 at Fujian Medical University Union Hospital, the Second Affiliated Hospital of Fujian Medical University, and Jinjiang Municipal Hospital. Diagnoses of IPD were based on the criteria from the Queen Square Brain Bank 24 and the Movement Disorder Society, 25 while the MSA-P diagnoses followed the second edition criteria by Gilman et al., 8 along with MDS standards. 26 If IPD and MSA-P patients do not meet both diagnostic criteria simultaneously, the diagnosis is determined by the latest diagnostic standards. Final diagnoses were confirmed by two neurologists with over 10 years of experience; if the diagnoses of the two neurologists are inconsistent, a third neurologist with over 20 years of diagnostic experience will discuss with them to reach a final diagnosis. The patient inclusion and exclusion process, along with the experimental procedure, is shown in Figure 1, the flowchart of the experimental process.

The flowchart of the experimental process.
Inclusion criteria
(1) Patients diagnosed with Parkinson’s disease (PD) and MSA-P.
(2) Participants had no contraindications to MRI and underwent brain MRI procedures that included T1-weighted imaging (T1WI), T2-weighted imaging (T2WI), and T2-weighted fluid-attenuated inversion recovery (T2-FLAIR).
(3) Disease duration not exceeding 5 years, with a follow-up period of more than 1 year.
Exclusion criteria
(1) History of cerebrovascular disease, neurological tumors, or cranial surgery.
(2) History of substance abuse or alcohol dependence.
(3) Presence of dementia or other neurodegenerative diseases.
(4) Psychiatric disorders.
(5) Incomplete MRI examination or images with artifacts.
(6) Participation in other research or receiving additional treatments.
Based on these criteria, a total of 287 patients were included, comprising 186 with IPD and 101 MSA-P. They were randomly assigned into training (201 patients, 70%) or testing cohorts (86 patients, 30%).
Clinical data collection
For patients with IPD and multiple system atrophy with predominant parkinsonism (MSA-P), we collected clinical data such as age, gender, years of education, disease duration, weight, smoking and drinking habits, and medical history including hypertension, diabetes, neurological tumors, cranial surgery, and psychiatric conditions. Additional information gathered included clinical assessment scales, uric acid levels, homocysteine, blood glucose, lipid profiles, complete blood counts, coagulation profiles, liver and kidney function tests, and C-reactive protein levels, motor symptoms (such as tremor at rest, rigidity, slowness of movements, postural instability), non-motor symptoms (such as orthostatic hypotension (OH), urinary frequency, urgency, incontinence, retention, emotional and cognitive functions), the Unified Parkinson Disease Rating Scale (UPDRS), the Non-Motor Symptoms Scale (NMSS), the Montreal Cognitive Assessment (MoCA), and the Mini-Mental State Examination (MMSE), the Hamilton Depression Scale-24, and the Hamilton Anxiety Scale (HAMA), etc. All scale assessments were performed by neurologists who had been specially trained and certified.
Active stand test should be performed on all patients with IPD and MSA-P 27 : After resting supine for 10 min, stand for 10 min while continuously recording systolic blood pressure, diastolic blood pressure, mean blood pressure, and heart rate. Measure baseline blood pressure and heart rate while supine, then stand up quickly and measure blood pressure and heart rate at 1, 3, and 5 min after standing. OH is defined as a sustained decrease in systolic blood pressure of at least 20 mmHg (1 mmHg = 0.133 kPa) or a sustained decrease in diastolic blood pressure of at least 10 mmHg within 3 min of the active stand test. 28
Urinary function in IPD and MSA-P patients is assessed using residual urine volume and urinary flow rate. Abnormality_Micturition includes symptoms such as frequency, urgency, incontinence, and urinary retention. Urinary retention is defined as post-void residual urine volume greater than 100 mL.29,30
Motor symptoms are evaluated using the UPDRS motor examination section, part III (UPDRS-III), to assess the motor symptoms of IPD and MSA-P patients, with higher scores indicating more severe motor symptoms. 31
Non-motor symptoms are assessed using the NMSS for IPD and MSA-P patients, which includes 9 dimensions and 30 items: cardiovascular (2 items), sleep, fatigue (4 items), mood/cognition (6 items), perception/hallucination (3 items), attention/memory (3 items), gastrointestinal (3 items), urinary (3 items), sexual function (2 items), and miscellaneous (4 items). Higher scores indicate more severe non-motor symptoms.32,33
Cognitive function is assessed using the MMSE and MoCA for IPD and MSA-P patients. The MoCA includes eight parts: visuospatial and executive function, naming, memory, attention, language, abstraction, delayed recall, and orientation. Higher scores on the MMSE and MoCA indicate better cognitive function.34,35
Depressive and anxiety symptoms are assessed using the Hamilton Depression Rating Scale-24 items 36 for IPD and MSA-P patients, with higher scores indicating more severe depressive symptoms. The HAMA 37 is used to assess anxiety symptoms in IPD and MSA-P patients, with higher scores indicating more severe anxiety symptoms.
MRI data acquisition
All participants underwent MRI scans on a Philips Achieva 3.0T system (Philips Healthcare, Best, The Netherlands), equipped with a 32-channel head coil. The scans included T1-weighted imaging (T1WI), T2-weighted imaging (T2WI), and T2-weighted fluid attenuated inversion recovery (T2-FLAIR) images aligned parallel to the anterior conmmisure-posterior commisure (AC-PC) line, employing 3D fast low angle shot (3D-FLASH) T2WI sequences with the following parameters: repetition time/echo time (TR/TE) = 4000/80 ms, field of view (FOV) = 180 × 180 mm, 2–4 excitations, an inter-slice gap of 2 mm, and a slice thickness of 3.0 mm. To minimize movement and noise, sponges and medical cotton were used during the scans.
Following MRI acquisition, we applied the N4 Bias Field Correction method to preprocess the images. This correction technique mitigates intensity inhomogeneity caused by MRI field non-uniformity, which can arise from differences in coil sensitivity or magnetic field distortions. By adjusting for these variations, the N4 Bias Field Correction enhances image uniformity, thereby improving tissue contrast and facilitating more reliable and consistent feature extraction across images. This preprocessing step is especially critical for ensuring the robustness of radiomic features, as it minimizes potential biases and artifacts that may otherwise impact analysis accuracy.
Based on previous research findings, we selected the caudate and putamen as regions of interest (ROIs) due to their known involvement in Parkinson’s disease (PD) and MSA pathology. Research conducted by Stoessl et al., 38 published in Lancet Neurology, has shown that the basal ganglia, substantia nigra (SN), and red nucleus are the primary areas affected in PD. In MSA, however, the basal ganglia, pons, and cerebellum are typically affected, as shown by Broski et al. 39 in Radiographics. ROI delineation was performed in ITK-SNAP software (version 3.6.0; www.itksnap.org), manually tracing the caudate and putamen on T1WI and T2WI, avoiding vascular areas. A radiologist (Reader A) with over 10 years of experience in cranial MRI independently segmented the lesions, blinded to final diagnoses. Consistency of segmentation was evaluated by repeating the process after 1 month and by another senior radiologist (Reader B) with 15 years of experience. Intra- and inter-observer consistencies were assessed using intraclass correlation coefficients (ICC), with ICC >0.90 indicating good consistency. The segmentation of the ROI areas is illustrated in Figure 2.
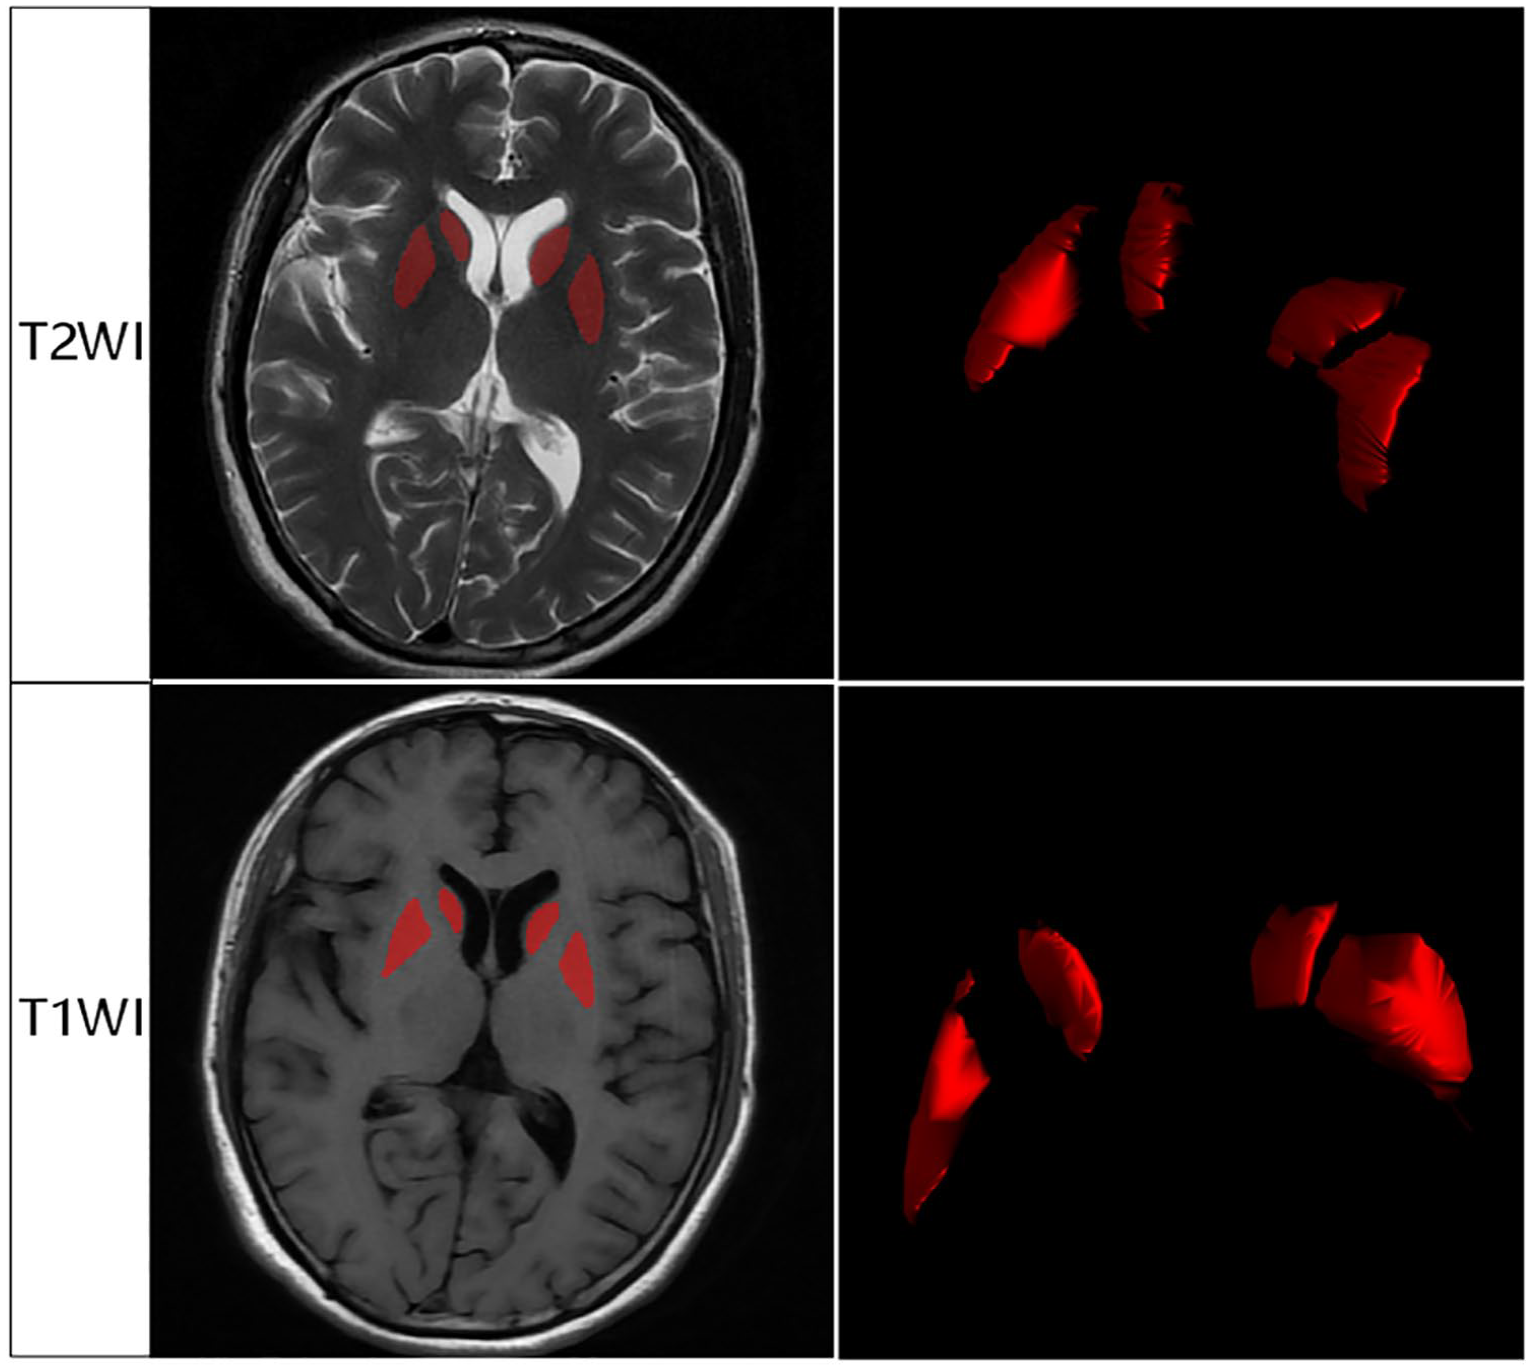
The segmentation of the ROI areas.
Radiomics feature extraction, selection, and modeling
Image data normalization was conducted as an initial preprocessing step to minimize bias stemming from variations in scanner settings, patient positioning, and acquisition parameters, thus ensuring consistency across all samples. After normalization, we extracted radiomic features from the defined ROIs in T1-weighted (T1WI) and T2-weighted (T2WI) images using the radiomics module in AK software (GE Healthcare). These features were categorized into several types, including first-order statistics (which quantify voxel intensity distributions), shape features (which describe the geometric properties of the ROIs), and texture features from matrices such as the Gray Level Co-occurrence Matrix, Gray Level Size Zone Matrix, Gray Level Run Length Matrix, and Gray Level Dependence Matrix. Each feature type was designed to capture specific spatial patterns, intensity distributions, and heterogeneity characteristics within the ROI volumes. The extracted features were then normalized and indexed, allowing for cross-sample comparability. To further optimize the dataset for model performance, we addressed feature correlation and redundancy. In the feature selection process for the training cohort, we employed the minimal Redundancy Maximal Relevance (mRMR) method to filter out redundant features while retaining those most relevant to the outcome of interest. This process prioritized feature independence and relevance to ensure a robust, non-redundant feature set. Following mRMR, we applied the Least Absolute Shrinkage and Selection Operator (LASSO) regression to refine the feature subset, enforcing sparsity and selecting features that demonstrated the strongest predictive relationships. Features with high ICC (ICC >0.90) were prioritized to ensure high reliability and repeatability in the selected feature set. By combining mRMR and LASSO, we obtained a final, optimized subset of features for robust modeling, as further detailed in the PyRadiomics documentation (http://pyradiomics.readthedocs.io).
To optimize feature selection, we performed multivariate ranking using the mRMR method combined with LASSO regression, employing 10-fold cross-validation to enhance model robustness and prevent overfitting. This process generated an optimized subset of features where texture features were weighted according to their regression coefficients, reflecting their contribution to model prediction. The final model was constructed using LASSO, which identified the most predictive radiomic features by enforcing sparsity and selecting only those features with the highest relevance. These selected features were incorporated into a logistic regression (LR) model to calculate a Rad-score, representing a cumulative radiomic signature for distinguishing between IPD and multiple system atrophy with parkinsonism (MSA-P). For further validation and comparison, we evaluated multiple machine learning classifiers, including LR, support vector machine (SVM), Extra Trees, extreme gradient boosting (XGBoost), and Light Gradient Boosting Machine (LightGBM). The classifiers’ performance was assessed based on metrics such as accuracy, area under the curve (AUC), sensitivity, and specificity to determine the optimal model. Following model selection, we developed a radiomic nomogram by integrating radiomic features with clinical data using the LR algorithm. This nomogram provides a visual tool for clinical application, facilitating the prediction of IPD and MSA-P by combining radiomic and clinical information, thus supporting more accurate and individualized patient diagnosis.
Statistical analysis
Statistical analysis was conducted using SPSS 24.0 (SPSS Inc, Chicago, Illinois, USA) and R software version 3.5.0 (R Development Core Team, Vienna, Austr). The normality of data distributions was verified using the Kolmogorov–Smirnov test. Data that followed a normal distribution were subjected to independent samples t-tests, presented as mean ± SD, whereas non-normally distributed data were evaluated using the Mann–Whitney U test, reported as median. Categorical data were analyzed using the Chi-squared test.
The diagnostic performance of T1WI and T2WI was assessed using the receiver operating characteristic (ROC) curve, with the Youden index being used to calculate the AUC as well as sensitivity, specificity, and accuracy. To compare the detection capabilities of the Rad-score, clinical data, and the combined nomogram models, the Delong test was employed. Relevant MRI morphological features were analyzed using univariate LR to identify the best radiomic features based on AUC performance and accuracy. A multivariate LR model of radiomic features was developed, with calibration curves and Hosmer–Lemeshow tests confirming model reliability.
The predictive performance differences among the Rad-score, clinical data, and nomogram models were analyzed using the Delong test. The diagnostic efficacy of the radiomic nomogram was validated in a test cohort, employing ROC curves to assess its performance. Calibration efficiency of the nomogram was evaluated using calibration curves and the Hosmer–Lemeshow test. Additionally, decision curve analysis (DCA) was utilized to determine the clinical utility of the predictive models, ensuring that they provide practical benefits in clinical settings.
Results
Clinical characteristics of patients
The clinical characteristics of the patients were compared using the T-test. Table 1 outlines the baseline clinical characteristics of the cohort. Compared with the IPD group, the MSA-P group exhibited significantly higher UPDRS-III scores, NMSS scores, triglyceride levels, uric acid levels, and incidences of slowness of movements, postural instability, OH, abnormal micturition, and tremor at rest (all p < 0.05). Additionally, the incidence of tremor was significantly lower in the MSA-P group than in the IPD group (p < 0.05). As shown in Table 2, we conducted a multivariate analysis of clinically significant features. The results indicated that, with the exception of UPDRS-III scores, features such as uric acid, triglyceride levels, NMSS scores, slowness of movements, OH, postural instability, and tremor at rest all had p-values less than 0.05, suggesting their significance in distinguishing IPD from MSA.
Clinical characteristics of patients in cohorts.

HAMA, Hamilton Anxiety Scale; HAMD-24, Hamilton Depression Scale-24; MoCA, Montreal Cognitive Assessment; MMSE, Mini-Mental State Examination; NMSS, Non-Motor Symptoms Scale; UPDRS, Unified Parkinson Disease Rating Scale.
Multifactor analysis results of potential clinical features.

CI, confidence interval; NMSS, Non-Motor Symptoms Scale; OR, odds ratio; UPDRS, Unified Parkinson Disease Rating Scale.
Radiomic feature extraction and selection
In this study, we extracted a total of 3668 handcrafted features across 6 categories. These included 720 first-order features, 28 shape features, and various texture features. All handcrafted features were derived using an in-house feature analysis program developed with Pyradiomics. Figure 3(a) illustrates the distribution overview of all features. The LR coefficients and mean standard error from the 10-fold validation are depicted in Figure 3(b). The Rad-score is presented in Figure 3(c), showing the coefficients of the final selected nonzero features. Among the selected clinical features, those with a p-value less than 0.05 were included, indicating their statistical significance in distinguishing IPD from MSA-P. These clinical indicators included uric acid levels, triglyceride levels, NMSS score, slowness of movements, OH, postural instability, and tremor at rest.

Distribution and selection of radiomic features in Rad-signature model. (a) Pie chart showing the distribution of radiomic feature categories. The chart displays the proportions of various feature types, including GLCM (24.0%), first-order features (19.6%), GLRLM (17.4%), GLSZM (17.4%), GLDM (15.3%), Neighborhood Gray-Tone Difference Matrix (NGTDM, 5.5%), and shape features (0.8%). (b) Coefficient path and cross-validation plot for feature selection using LASSO regression. The upper plot shows how coefficients of selected features vary with the regularization parameter (λ), while the lower plot displays the cross-validated MSE to identify the optimal λ value (dotted line). (c) Coefficient plot of selected radiomic features. The bar chart illustrates the coefficients of the selected features used in the Rad-signature model, highlighting the features that contribute most to the model.
Model training and validation
As summarized in Table 3 and illustrated in Figure 4, the SVM-based radiomics model demonstrated the strongest performance among all classifiers for differentiating IPD from MSA-P. In the training cohort, the SVM model achieved an AUC of 0.885, with an accuracy of 0.802, sensitivity of 0.912, and specificity of 0.743, indicating robust classification capability and balanced detection of MSA-P cases. In the testing cohort, the model maintained high performance, achieving an AUC of 0.900, accuracy of 0.828, sensitivity of 0.700, and specificity of 0.895, showing strong generalizability and reliability across datasets.
Performance parameters of different models for the Rad-signature in the train and test cohorts.

AUC, area under the curve; CI, confidence interval; LightGBM, Light Gradient Boosting Machine; LR, logistic regression; SVM, support vector machine; XGBoost, extreme gradient boosting.
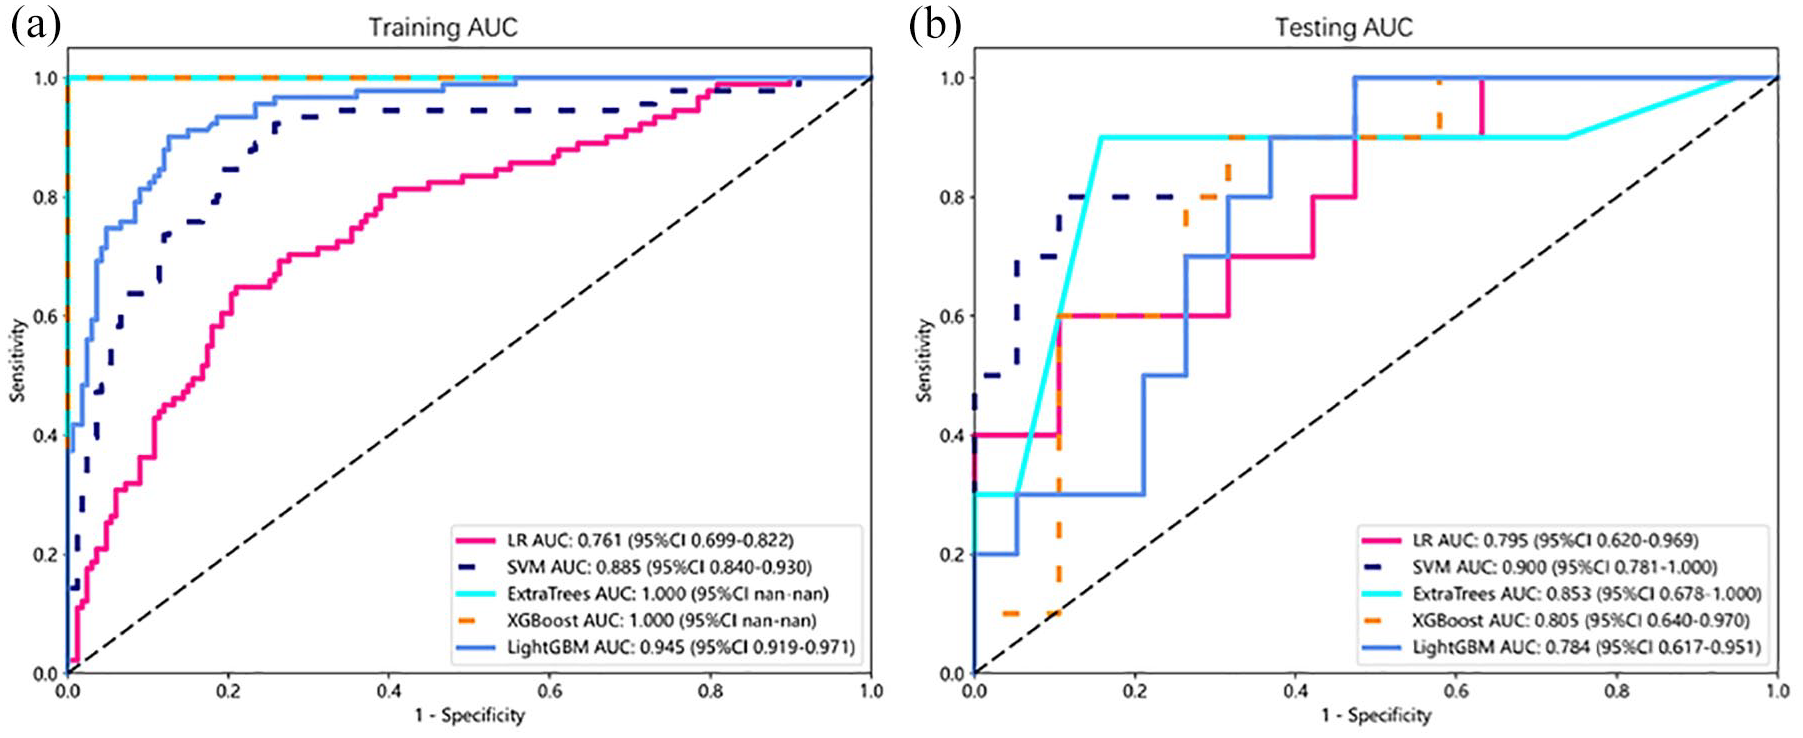
ROC analysis for different models of rad signature in the train (a) and test (b) cohorts.
When applied to clinical data, the SVM-based clinical signature model demonstrated moderate performance. In the training cohort, the model achieved an accuracy of 0.767, an AUC of 0.810 (95% CI: 0.753–0.866), a sensitivity of 0.659, and a specificity of 0.826. In the testing cohort, the clinical signature’s performance was similar, with an accuracy of 0.759, an AUC of 0.839 (95% CI: 0.689–0.990), a sensitivity of 0.800, and a specificity of 0.737. While the clinical model showed relatively high specificity, its sensitivity was limited, reducing its balanced detection capability for both conditions.
The integrated Nomogram model, combining radiomic and clinical features, outperformed both the standalone SVM radiomics and clinical models. In the training cohort, the Nomogram achieved an accuracy of 0.922, an AUC of 0.973 (95% CI: 0.954–0.991), a sensitivity of 0.901, and a specificity of 0.934, demonstrating a well-balanced and highly accurate classification performance. In the testing cohort, the Nomogram maintained strong results, with an accuracy of 0.897, an AUC of 0.963 (95% CI: 0.904–1.000), a sensitivity of 0.900, and a specificity of 0.895. These results indicate that the Nomogram model not only provides the highest predictive accuracy but also retains strong sensitivity and specificity, making it a reliable tool for clinical decision-making.
Overall, the SVM-based radiomics model proved highly effective, but the integrated Nomogram model, by combining radiomic and clinical data, offered the best diagnostic stability and predictive performance across both training and testing datasets (see Table 4).
Performance parameters of Nomogram in comparison with clinical-signature and Rad-signature in the train and test cohorts.

AUC, area under the curve; CI, confidence interval.
Performance comparison of models
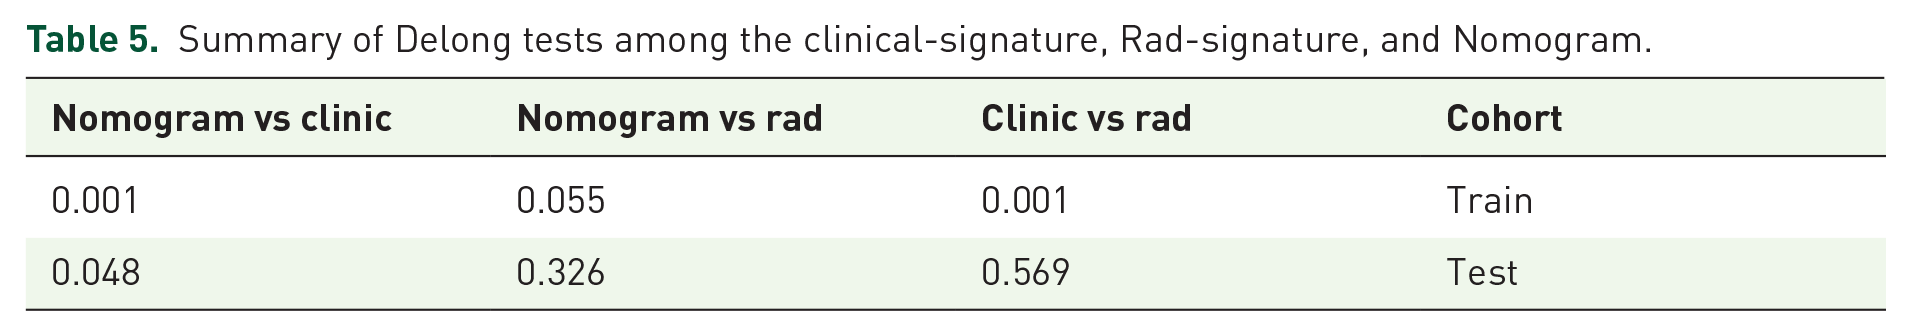
Table 5 presents the Delong test results, highlighting the significance of differences among models. In the training cohort, the Nomogram model significantly outperformed both the Clinical-signature (p = 0.001) and Rad-signature (p = 0.055) models. In the testing cohort, while the difference between the Nomogram and Rad-signature was not significant (p = 0.326), the Nomogram remained superior to the Clinical-signature (p = 0.048). These results underscore the Nomogram model’s high diagnostic stability and superior predictive performance across datasets. Figures 4 and 5 show the ROC curves for each model in the training (a) and testing (b) cohorts, where the Nomogram consistently achieved the highest AUC, confirming its effectiveness in differentiating IPD from MSA-P.
Summary of Delong tests among the clinical-signature, Rad-signature, and Nomogram.

ROC curves for the models based on the clinical signature, Rad signature, and nomogram in both train (a) and test cohorts (b).
Calibration and DCA of the Nomogram
Figure 6 displays the DCA, indicating that the Nomogram (see Figure 7) provides the highest net benefit for clinical decision-making, reinforcing its clinical value. This model supports more precise, personalized interventions, improving patient management compared to using the Rad-signature or Clinical-signature alone. Finally, Figure 8 presents the calibration plots for the Clinical-signature, Rad-signature, and Nomogram models. The Nomogram closely follows the ideal calibration line, indicating strong agreement between predicted probabilities and observed outcomes, with better calibration than the other models.

DCA results for the train (a) and test cohorts (b).

The nomogram.

The mean predicted probability of the train (a) and test cohorts (b).
Discussion
In recent years, imaging has become pivotal in the diagnosis, treatment, and prognosis of IPD and MSA-P. Accurate and timely diagnosis is crucial for effective patient management due to the significant differences in treatment options and prognoses between IPD and MSA. While previous studies have shown promising results in using brain MRI radiomics to differentiate between IPD and MSA,14,20–23 research specifically focusing on distinguishing IPD from MSA-P has been limited and often based on smaller case numbers.
Previous studies have reported that the primary affected areas in PD are the basal ganglia, SN, and red nucleus, 38 while MSA predominantly affects the basal ganglia, pons, and cerebellum. 39 Further research14,21,23 selected the caudate, putamen, and SN as ROIs from T1WI and T2WI MRI sequences to extract radiomic features, effectively differentiating IPD from MSA-P. Based on these findings, our study also selected the caudate and putamen on T1WI and T2WI MRI sequences as ROIs.
Our study found that the MSA-P group had a higher incidence of bradykinesia and postural instability than the IPD group, with a lower incidence of tremors. Previous studies40,41 have reported a higher incidence of resting tremor in IPD and a higher prevalence of bradykinesia and postural instability in MSA-P, consistent with our findings. Additionally, our study observed that the MSA-P group had higher NMSS scores and a higher incidence of autonomic dysfunction, such as OH and urinary abnormalities, aligning with previous studies.42–44
Both our study and previous research have shown that autonomic dysfunction occurs to varying degrees in MSA-P and IPD patients, with MSA-P patients experiencing more severe autonomic impairment. This disparity may be attributed to the faster disease progression in MSA-P compared to IPD. 42 Our study observed that triglyceride levels were lower in IPD patients compared to MSA-P patients, which aligns with previous findings.45,46 This difference may be attributed to the progression of neurodegenerative diseases affecting the autonomic nervous system and leading to reduced catecholamine and cortisol production, subsequently lowering triglyceride levels.47–51 Additionally, IPD patients treated with levodopa tend to have even lower triglyceride levels compared to MSA-P patients.52,53
Furthermore, our findings revealed lower uric acid levels in IPD patients compared to those with MSA-P, consistent with earlier studies.54,55 Uric acid, as the end product of purine metabolism, acts as an antioxidant that mitigates oxidative stress. The lower uric acid levels in IPD patients may indicate more severe dopaminergic neuron damage in this group. 54
Our study introduces a significant advancement in the diagnosis of IPD and MSA-P through the use of brain MRI-based radiomics. By utilizing high-dimensional quantitative imaging features, our research successfully differentiates between these conditions, surpassing the predictive performance of clinical models based on traditional biomarkers. The radiomic features identified in our model likely reflect critical neuropathological differences between IPD and MSA-P. Texture and intensity features from regions like the basal ganglia may capture subtle variations in tissue heterogeneity and structural degeneration specific to each disease. These features provide insights that go beyond traditional clinical observations, highlighting tissue patterns that may be associated with the unique progression of IPD and MSA-P. This finding underscores the complementary role of radiomic analysis, where advanced imaging features can enhance diagnostic precision and potentially reveal disease characteristics tied to underlying pathophysiology. Future studies with larger, diverse datasets, and additional brain regions could help further clarify the diagnostic and biological significance of these radiomic features.
While clinical predictive models are valuable for diagnosing neurodegenerative conditions, our study reveals the limitations of models based solely on clinical factors. In contrast, our radiomic-based model, which integrates advanced radiomic features and machine learning techniques, shows significant improvement in predictive accuracy and diagnostic efficiency. Notably, combining clinical and radiomic features in our newly developed classification model achieved even higher performance (AUC = 0.963), suggesting that clinical information and radiomic features may complement each other, enhancing classification accuracy. Our findings indicate that radiomic analysis based on basal nuclei in T1WI and T2WI MRI sequences has great potential for distinguishing between IPD and MSA-P. The radiomics model excels in capturing high-dimensional patterns in brain MRI data, enhancing its ability to distinguish between IPD and MSA-P with precision. This enhancement provides clinicians with a powerful tool for informed decision-making, enabling personalized treatment strategies tailored to each patient’s specific pathology.
Although we developed a clinical radiomics nomogram that integrates both radiomic features and clinical factors, it did not demonstrate a statistically significant improvement over the radiomics model alone. This underscores the effectiveness of the pure radiomics approach, particularly for complex neurodegenerative diseases where traditional clinical models often fall short. Statistical tests, including the DeLong test, confirm the robustness of our radiomics model, showing significantly higher AUC values than the clinical model in both training and testing cohorts. DCA also supports the clinical utility of the radiomics nomogram, highlighting the superior predictive power of radiomic features over conventional clinical models.
While our study offers valuable insights, it has limitations, including a relatively small sample size, not using high-resolution MRI to delineate ROIs, its retrospective nature, and the limited selection of brain regions for analysis. Like previous studies,14,20–23 we did not perform strict sample size calculations; however, given the data-intensive nature of machine learning and AI research, we have maximized the number of eligible cases included, and our sample size exceeds that of many prior studies. To further validate and expand upon our findings, future research should focus on large-scale, multicenter, prospective cohort studies, the use of high-resolution MRI sequences to enhance both image quality and precision, and the inclusion ofadditional brain regions for radiomic analysis to capture more comprehensive data.
Brain MRI-based radiomics holds significant potential for transforming the clinical management of IPD and MSA-P patients. By enhancing diagnostic accuracy and supporting treatment decision-making, this approach paves the way for more personalized therapeutic strategies, potentially improving patient outcomes.
Conclusion
This study underscores the potential of MRI-based radiomics for effectively distinguishing between IPD and MSA-P. While the combined clinical-radiomic model showed high performance, radiomic features alone demonstrated superior predictive accuracy and robustness over clinical models.