
Abstract
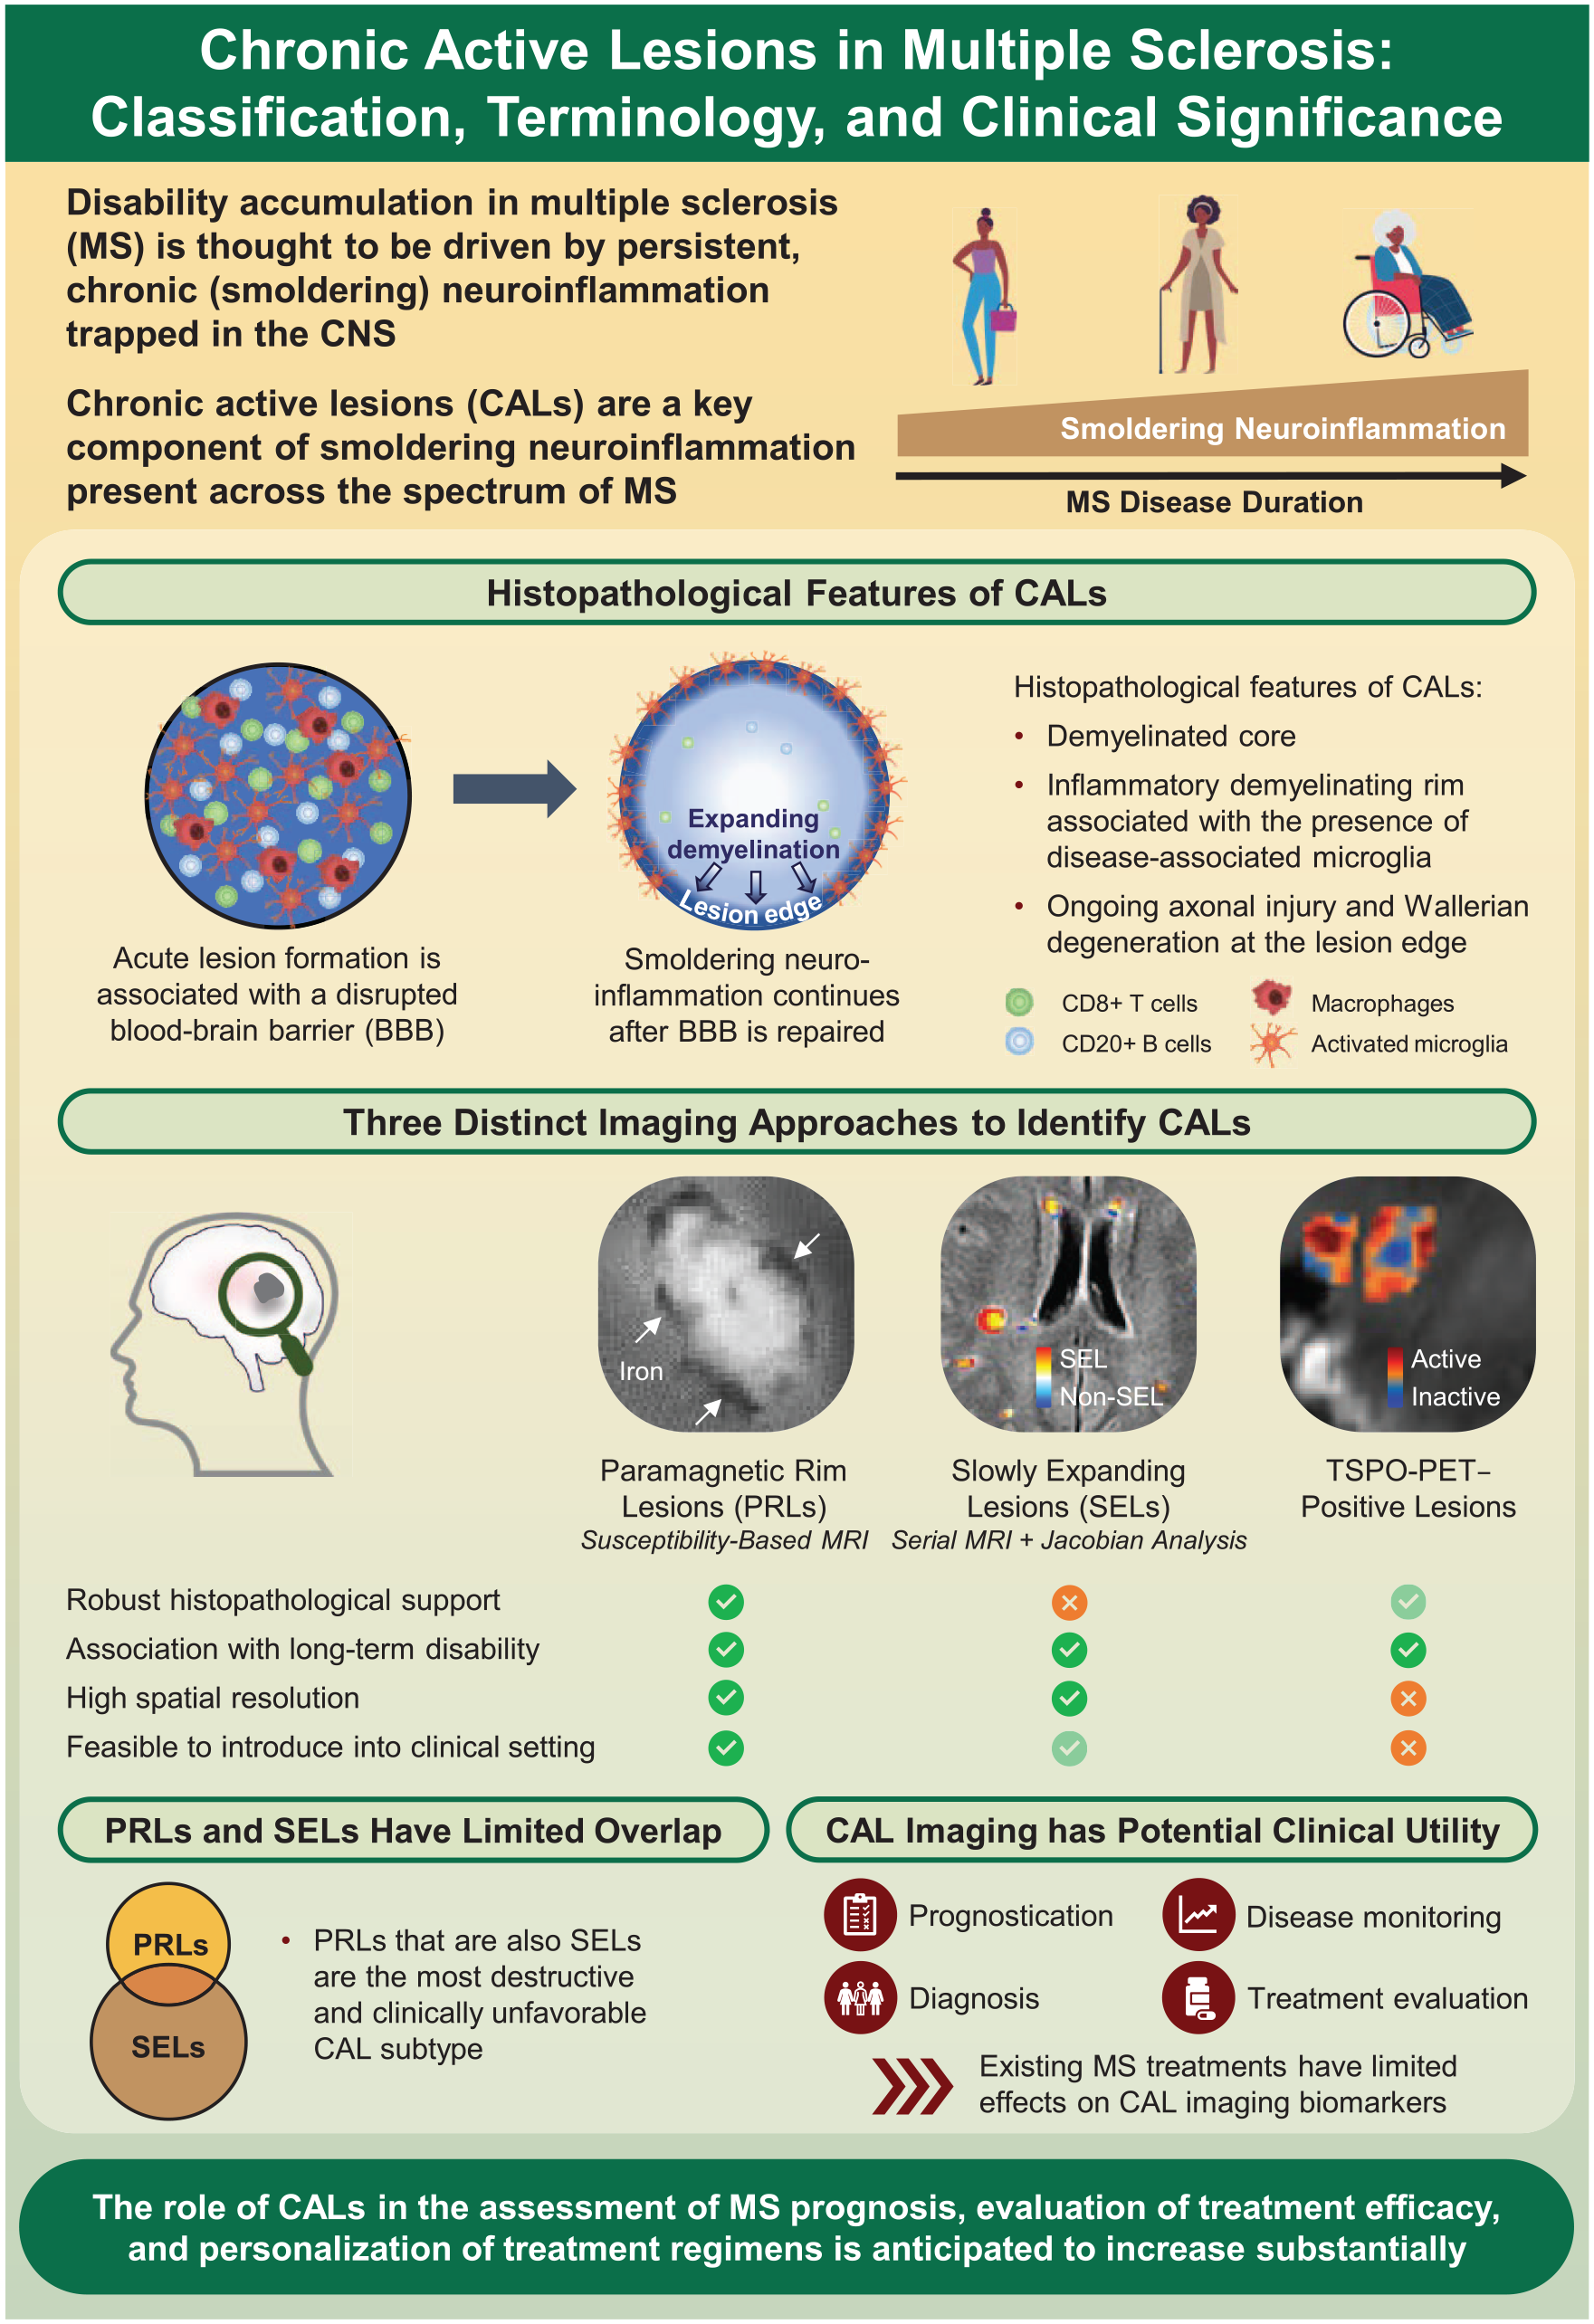
In multiple sclerosis (MS), increasing disability is considered to occur due to persistent, chronic inflammation trapped within the central nervous system (CNS). This condition, known as smoldering neuroinflammation, is present across the clinical spectrum of MS and is currently understood to be relatively resistant to treatment with existing disease-modifying therapies. Chronic active white matter lesions represent a key component of smoldering neuroinflammation. Initially characterized in autopsy specimens, multiple approaches to visualize chronic active lesions (CALs) in vivo using advanced neuroimaging techniques and postprocessing methods are rapidly emerging. Among these in vivo imaging correlates of CALs, paramagnetic rim lesions (PRLs) are defined by the presence of a perilesional rim formed by iron-laden microglia and macrophages, whereas slowly expanding lesions are identified based on linear, concentric lesion expansion over time. In recent years, several longitudinal studies have linked the occurrence of in vivo detected CALs to a more aggressive disease course. PRLs are highly specific to MS and therefore have recently been incorporated into the MS diagnostic criteria. They also have prognostic potential as biomarkers to identify patients at risk of early and severe disease progression. These developments could significantly affect MS care and the evaluation of new treatments. This review describes the latest knowledge on CAL biology and imaging and the relevance of CALs to the natural history of MS. In addition, we outline considerations for current and future in vivo biomarkers of CALs, emphasizing the need for validation, standardization, and automation in their assessment.
Keywords
Introduction
There is currently a paradigm shift in the way multiple sclerosis (MS) is viewed, evolving from a categorical group of clinically defined phenotypes to a continuum reflecting the disease’s underlying biology. This shift reflects evidence that many people with MS (pwMS) continue to show clinical worsening while being treated with high-efficacy disease-modifying therapies (DMTs), which effectively minimize clinical and imaging activity reflective of relapse disease biology.1,2 It is now evident that at least two principal pathological processes are concurrent, one originating from peripherally triggered inflammation combined with an open blood–brain barrier (BBB) and the other arising from persistent neuroinflammation confined behind the relatively intact BBB. 2
Progressive MS (PMS) biology is thought to be driven by smoldering neuroinflammation in the brain parenchyma and meninges3–5 as well as related processes, including chronic oxidative injury, age-related iron accumulation, and mitochondrial dysfunction. 1 Microglia and macrophages, main components of the innate immune system, are considered key mediators of smoldering neuroinflammation and are found not only in focal demyelinating lesions but also diffusively in the normal-appearing white and gray matter.6,7 A key manifestation of chronic neuroinflammation in MS is reflected through chronic active lesions (CALs). The occurrence of CALs is suggested to impede tissue repair mechanisms, resulting in substantial intralesional and perilesional tissue damage. 8 CAL-associated tissue damage also contributes to sustained neuroinflammation and is thought to be mediated by microglia and macrophages via the release of inflammatory mediators. 8
This review describes current knowledge surrounding CALs, explores the potential implications from preliminary studies regarding the clinical applicability of CAL imaging modalities, and identifies obstacles and opportunities in the routine clinical assessment of CALs.
Biological basis of CALs
In seminal autopsy studies, CALs were identified in 78% of postmortem specimens obtained from pwMS, accounting for about 30% of total lesions.9,10 While these initial autopsy studies noted a higher prevalence of CALs in people with PMS than with relapsing-remitting MS (RRMS),9,10 recent in vivo studies have demonstrated that CALs manifest across the entire MS disease continuum.11–16 CALs have been detected in supratentorial and infratentorial regions of the brain and in the spinal cord. 9
Histopathologically, CALs are characterized by a demyelinated core with axonal loss and an inflammatory demyelinating lesion edge (Figure 1).10,17 At the CAL edge, smoldering inflammation and centrifugal tissue injury are linked to the presence of microglia and macrophages (Supplemental Figure S1), which may contain myelin degradation products. 11 Aggregation of myeloid cells at the CAL edge was initially observed with staining for human leukocyte antigen or CD68, which does not discriminate between microglia and macrophage lineages.10,18 However, gene expression studies, including single-nucleus RNA-sequencing studies (Table 1), have confirmed that both microglia and macrophages are part of the detrimental inflammatory signature at the CAL edge, together with damaged oligodendrocytes, immune-like oligodendrocyte precursor cells, and activated/toxic astrocytes.19–21 Lymphocytes are sparsely present at the CAL edge, being predominantly located within the perivascular spaces and comprising mostly plasmablasts and T cells, including tissue-resident memory T cells. 22

Evolution of a focal white matter lesion and origin of a CAL. CALs evolve from newly formed lesions behind a closed blood–brain barrier. 8 Histopathologically, CALs feature a demyelinated core with axonal loss and an inflamed rim.10,11 Activated proinflammatory microglia and macrophages at the lesion rim may contain myelin degradation products, indicating ongoing demyelination. 11 The rim may also include damaged oligodendrocytes, activated astrocytes, and some lymphocytes.19–21
Gene expression studies of CAL rims.

C3, component 3; C3AR, component 3 receptor; CAL, chronic active lesion; MHC, major histocompatibility complex; MIMS, microglia inflamed in multiple sclerosis; MS, multiple sclerosis; PRL, paramagnetic rim lesion.
Microglia and macrophages in CALs acquire iron, which has made in vivo visualization of a subtype of CALs possible. The main sources of iron accumulation are considered to be erythrocytes leaking through a minimally impaired BBB and/or disintegrated oligodendrocytes and myelin.18,26 The formation and dissolution of iron rims is a dynamic process involving the arrangement of iron-laden, mainly pro-inflammatory microglia and macrophages at the lesion edge, which subsequently diminish and then gradually disappear over a decade.19,27 The CAL rim and peri-rim area demonstrate ongoing axonal injury (i.e., presence of axonal end-bulbs) and secondary retrograde axonal degeneration, known as “Wallerian degeneration.”8,27,28
Imaging biomarkers of CALs
There are currently three in vivo imaging biomarkers of CALs: paramagnetic rim lesions (PRLs), slowly expanding lesions (SELs), and 18 kDa translocator protein (TSPO)-positron emission tomography (PET) positive lesions.
Paramagnetic rim lesions
PRLs, recently described as in vivo markers of CALs,18,27 reflect a more destructive lesion pathology compared with non-PRLs.8,11,28–30 Lesion-level prevalence of PRLs is ~10%, and PRLs have been observed across the spectrum of MS, with a prevalence of ~50% or more in people with clinically isolated syndrome, radiologically isolated syndrome, RRMS, and PMS.8,11,14–17,31–41 PRLs are specific to MS and may have clinical utility in differentiating MS from other conditions that demonstrate white-matter lesions on MRI. 37
The paramagnetic rims of PRLs can be identified using susceptibility-based MRI techniques (see the proceeding section) and reflect the density of disease-associated iron-laden microglia and macrophages at the lesion edge.8,11,18,19,27 PRLs derive from a subset of acute lesions, which initially show T1 gadolinium-enhancement on MRI with a centripetal dynamic contrast pattern, reflecting the movement of contrast across a disrupted BBB at the lesion edge, which then fills the lesion center.8,33 The evolution of an acute lesion into a PRL takes approximately 3 months, during which time the lesion becomes non-gadolinium-enhancing, indicating reclosure of the BBB. 8 Prior to developing a paramagnetic rim, some PRLs initially show transient susceptibility in the lesion core, thought to reflect inflammatory activity and/or early repair mechanisms involving iron-containing oligodendrocytes. 15 PRLs may persist for up to a decade as long as the iron rim has not disappeared.18,19,27 A disappearing rim is interpreted as the lesion transitioning toward an inactive stage. The appearance and disappearance of PRLs is related to clinical outcomes, with a recent report finding that resolution of existing rims and absence of new PRLs were associated with reduced risk of clinical disability progression. 42
PRLs show more pronounced tissue damage compared with non-PRLs.18,27 This is shown by cross-sectional observations of reduced T1 intensity (Figure 2), magnetization transfer ratio (MTR), 30 and increased T1 relaxation time,27,43 metrics that are generally indicative of decreased axonal density, 44 demyelination, 44 and microstructural tissue damage,45,46 respectively. Marked demyelination within the PRL core is further supported by the finding of a slower R2* relaxation rate versus non-PRLs. 43

Longitudinal presentation of a PRL visualized using 7 T FLAIR-SWI. 7 T MRI scans are from a person with MS for 12 years and an MSSS of 3.94. The person is converted from RRMS to SPMS by the 7-year follow-up MRI. Panels a and b are 7 T FLAIR-SWI and panel c is 7 T MP2RAGE. The yellow arrows in panels a and b indicate the development of a PRL in the supratentorial white matter within 7 years enlarged in the respective bottom right corner. At baseline (a), the PRL presents as a hyperintense FLAIR lesion surrounded by an SWI-hypointense iron rim. At follow-up (b), the SWI-hypointense iron rim has diminished and is now surrounded by an evolved perilesional FLAIR hyperintensity, resulting from retrograde axonal damage (“Wallerian degeneration”). SWI-hypointense punctate or horizontal signals are also seen within this lesion, indicating veins and diffuse perivascular iron accumulation. Panel c shows marked MP2RAGE hypointensity of the PRL at 7-year follow-up, reflecting the pronounced tissue destruction of PRLs. 7 T MRI scans were performed at the High-Field MR Center of the Department of Biomedical Imaging and Image-Guided Therapy, Medical University of Vienna.
Slowly expanding lesions
SELs have also been proposed as in vivo correlates of CALs (Figure 3), 12 since their observed short-term (typically 1–2 years) expansion is associated with ongoing microstructural lesion damage with a centrifugal pattern.12,47–50 This damage is suggested to occur behind the closed BBB, as SELs do not exhibit gadolinium-contrast enhancement. 12 SELs have been detected in both PMS (99% had ⩾1 definite SEL) 51 and relapsing MS (86% and 99% had ⩾1 definite SEL and ⩾1 possible SEL, respectively). 52 Moreover, a larger SEL volume has been found to correspond with a higher total lesion burden. 51

Slowly expanding lesions. SELs can be visualized using Jacobian analysis of the nonlinear deformation field between baseline and follow-up scans. 29 In this example, deformation fields were calculated from reference and follow-up T1 scans, and the Jacobian map is superimposed on a FLAIR image. The Jacobian determinant is presented as a heatmap, where blue indicates local contraction and red indicates local expansion.
Compared with non-SELs, SELs show pronounced tissue damage, indicated by greater reductions in T1 intensity12,52 and a positive correlation with persisting black holes. 52 Greater decreases in MTR and increases in radial diffusivity measured with diffusion tensor imaging (DTI) are found within SELs, 47 supportive of significant myelin loss. 52 SELs also show heterogeneity in the rate of expansion and tissue damage, with tissue loss found to be inversely proportional to the distance of the lesion from the ventricles. 53
Overlap of PRLs and SELs
Recently published investigations reported limited overlap between SELs and PRLs in pwMS (Figure 4), where SELs outnumbered PRLs by approximately two- to eight-fold.29,30 Lesions showing only PRL characteristics had more profound tissue damage at baseline compared with those featuring only SEL characteristics. 30 Evidence suggests that co-localized PRLs and SELs are the most destructive 30 and clinically unfavorable 29 CAL subtype according to quantitative T1 MRI, DTI, and MTR.

In vivo MRI approaches to CAL imaging. PRLs and SELs represent different MRI means of visualizing CALs. 30 PRLs are identified using advanced MRI techniques to detect the presence of a paramagnetic rim, which reflects iron-laden microglia/macrophages.18,27 SELs are detected by conventional MRI showing lesion expansion over time.12,50 Lesions showing characteristics of both PRLs and SELs display the most severe pathology, although overall, little overlap is observed between PRLs and SELs. 30
The presence of a paramagnetic rim may not always be associated with lesion expansion. 18 Further, paramagnetic rims eventually disappear over time. 27 The factors that determine whether a CAL progressively expands and/or shows a paramagnetic rim are presently unclear. 54 It is currently unknown whether SELs and PRLs represent different CAL types or developmental phases. It might also be conceivable that some SELs without a paramagnetic rim may simply contain too few iron-containing microglial cells to be detected with susceptibility-based MRI. In addition, the limited overlap between PRLs and SELs may reflect nonlinearity in the enlargement of PRLs over time, with evidence that PRL volume tends to stabilize after several years. 27 Nonlinear expansion is incompatible with the criteria for SELs (see the proceeding section), 12 potentially inflating the rate of false-negative PRL+/SEL+ detections. For these reasons, in this review, PRLs and SELs are considered as distinct methods for visualizing a partially overlapping population of CALs whose biological processes are currently only incompletely understood.
TSPO-PET–positive lesions
CALs can be also identified with PET imaging using TSPO radioligands, which detect innate immune cells, such as microglia and macrophages that are fundamentally involved in chronic neuroinflammation (Figure 5), 50 and astrocytes. 55 While TSPO-PET signals have been reported to reflect general glial density, 55 a more recent neuropathological study found that 98% of TSPO-positive cells at the CAL edge were double positive for the microglia/macrophage markers IBA-1 and CD68, contrasting the TSPO-positive cells in inactive lesions (75%) and the center of CALs (25%) that were negative for microglia/macrophage markers and presumed to be astrocytes. 56 Furthermore, a reanalysis of three single-nucleus RNA-seq studies19,57,58 confirms upregulation of TSPO expression in critical microglial and astrocytic inflammatory cell clusters at the CAL rim. 13

PET-defined CALs. Demonstration of CALs on PET in a pwMS, as defined by uptake of [18F]-DPA-714, which is a second-generation radioligand for TSPO. 13 The TSPO-PET signal reflects microglia and macrophage density. 56 PET permits longitudinal immunological characterization of lesions, 59 and second-generation TSPO ligands differentiate MS lesions with a smoldering component from inactive lesions. 13 In this example, the white boxes in the two illustrative MRI coronal FLAIR slices indicate lesions of interest in the white matter. The center and rim of each lesion on the FLAIR slices were delineated, and a threshold of 20% (hot colors) on the corresponding [18F]-DPA-714 PET defined areas of inflammation. Among the CALs identified in this study were (1) “homogeneously active” lesions with active centers and (2) “rim active” lesions with inactive centers and active rims.
TSPO-PET studies have identified rim-active and uniformly active chronic lesions, revealing a high proportion (48%–53%) of uniformly/homogeneously active compared to rim-active (6%–13%) and inactive (38%–41%) lesions,13,60 as well as an over-representation of rim-active lesions in people with secondary progressive MS (SPMS) versus RRMS (19% vs 10%; p = 0.009). 60 Using the first-generation TSPO radioligand [ 11 C]PK11195, the proportion of rim-active lesions (12%–16%) was consistent with the frequency of CALs reported in seminal neuropathological studies.9,60,61 The correspondence between rim-active lesions detected with TSPO-PET and PRLs awaits comprehensive study. One study found that, on average, PRLs detected with susceptibility-based MRI showed greater [ 11 C]PK11195 uptake than MRI lesions without a paramagnetic rim, which was consistent with the overlapping distribution of iron and TSPO in paramagnetic rims in postmortem brain tissue. 32 However, a recent study observed variable co-localization of rim-active lesions detected with TSPO-PET and PRLs. 62
Technological approaches and considerations for visualizing CALs
MRI is well suited to assess MS pathology in vivo. 63 However, conventional MRI techniques lack pathological specificity.64,65 There is growing interest in using advanced imaging techniques to study CALs in vivo. These MRI- and PET-based techniques evaluate CALs considering their volumetric changes, or molecular or cellular composition (Table 2). Establishing pathological specificity of CAL imaging may require further postmortem correlation studies for validation against histology, the gold standard method for identifying CALs.18,63,66
Summary of CAL imaging techniques.

CAL, chronic active lesion; EPI, echo-planar imaging; GRE, gradient echo; PRL, paramagnetic rim lesion; QSM, quantitative susceptibility mapping; SEL, slowly expanding lesion; SWI, susceptibility-weighted imaging; TSPO, 18 kDa translocator protein.
Paramagnetic rim lesions
Susceptibility-based MRI techniques (T2* and R2*-weighted magnitude, phase images, susceptibility weighted imaging (SWI), and quantitative susceptibility mapping (QSM)) are remarkably sensitive to the magnetic properties of tissues and can evaluate both tissue microstructure and the distribution of paramagnetic substances, such as iron, and diamagnetic substances, such as myelin.17,81 PRLs are typically characterized as nonenhancing lesions with a distinct paramagnetic border, visible on susceptibility-based MRI, around a lesion core. 82 Several susceptibility-based brain MRI sequences and postprocessing techniques have been used to study PRLs (Table 2; Figure 6). 82 PRLs were first identified with 7-T MRI, 83 which has higher sensitivity for detecting tissue susceptibility effects than 3 T MRI. 75 Nevertheless, identification of PRLs at 3 and 1.5 T was found to be comparable (Supplemental Figure S2), supporting the feasibility of PRL detection for trials conducted in routine clinical settings given that 1.5 T is the current global standard for clinical imaging in nonacademic settings.27,37,39,75,84 Also, according to the North American Imaging in MS (NAIMS) Cooperative criteria (Table 3), MRI scanners with 1.5 T or higher magnetic field strength are recommended for reliable detection of PRLs.

Example of a PRL captured with various MRI sequences. MRI scans were acquired at 7 T MRI from a 33-year-old person with RRMS for 10 years and an MS Severity Score of 0.13. The PRL is located in the supratentorial white matter of the right hemisphere and magnified in the lower right corner of each panel. Panel (a) shows the hyperintense FLAIR lesion, which presents a paramagnetic rim on T2* (b) as a hypointense signal; on R2* (c) as a hyperintense signal; on magnitude (d) as a hypointense signal; on phase (e) as a hyperintense signal; on SWI (f) as a hypointense signal; and on QSM (g) as a hyperintense signal. In addition to the rim, the lesion shows an intralesional punctate feature indicative of a central vein, as well as horizontal veins in the perilesional region. Each sequence provides unique contrast characteristics that contribute to the delineation of PRLs in MS.
Guidance from the NAIMS Cooperative Consensus Statement for the radiological definition of white matter PRLs. 82 .

Confluent lesions are not exempted from PRL determination provided there is a reasonable effort to distinguish an embedded PRL surrounding a distinct core.
In the absence of post–Gd-based contrast agent MRI, a PRL designation should only be assigned if the corresponding lesion was detected on a T2-weighted scan acquired at least 3 (preferably 6) months earlier. If neither post–Gd-based contrast agent MRI scans nor such a prior scan are available, a PRL classification should be labeled as “possible,” and its chronicity should be confirmed with a scan obtained at least 3 (preferably 6) months later.
Items do not necessarily rule out the classification of a lesion as a PRL.
Gd, gadolinium; NAIMS, North American Imaging in MS; PRL, paramagnetic rim lesion.
A single-echo GRE (gradient echo) sequence was first used to visualize PRLs in 7 T phase images. 83 Subsequent studies observed PRLs in the magnitude images from single-echo and multiecho GRE scans, using maps of T2* relaxation time or its reciprocal R2* relaxivity rate,36,65,75,92,93 especially when iron content was higher, reflecting the lower sensitivity of T2* versus phase for tissue susceptibility effects. 17 However, conventional GRE sequences are suboptimal for PRL assessment in the clinical setting because they require long acquisition times (~15–30 min) to achieve whole-brain coverage at high isotropic resolution.33,75 Rapid (~5 min), high-resolution susceptibility imaging of the entire brain in three planes has been achieved with a 3D segmented echo-planar imaging (3D-EPI) sequence. 35 3D-EPI was optimized for the assessment of the central vein sign at 3 T MRI 35 but can also be applied to evaluate PRLs in the clinical setting, lowering the overall acquisition time. 75
Various postprocessing methods have been applied to facilitate PRL detection.34,40,94 SWI combines the complementary contrast from magnitude and phase images into one image, resulting in improved differentiation of tissues based on paramagnetic susceptibilities.72,76 SWI is commonly used clinically to detect brain hemorrhage 17 and has been applied for PRL detection. 94 Other postprocessing methods for PRL identification include homodyne-filtered phase images from SWI 34 as well as spatially unwrapped and filtered phase from standard 3D-GRE or 3D-EPI images. 33
QSM is another proposed postprocessing method that removes dipole artifacts by performing a deconvolution of phase data.95–97 Multiple methodologies have been proposed for QSM postprocessing,98–100 including recent deep learning-based techniques.101–104 When applied at 3 and 7 T, QSM has been shown to enable the quantification of MS brain lesions and their differentiation as PRL versus non-PRL based on their magnetic properties.32,40,74,77,105–110 While QSM provides a better representation of PRL geometry than phase contrast,40,74 use of QSM alone to quantify iron in MS lesions is hindered by the susceptibility effects of demyelination. 111 Methods to overcome this limitation have been proposed, including combining QSM with myelin-specific imaging markers 111 and biophysical modeling to separate susceptibility sources (χ-separation). 112
Given the time-consuming process of manually identifying PRLs, automatic detection methods on 3 T MRI images implementing artificial intelligence/machine learning methods have been recently proposed for both phase (i.e., RimNet, 113 and APRL114,115) and QSM images (i.e., QSMRim-Net 116 ). While more technical development and large-scale validation studies are still needed, these initial proof-of-concept methods open the path for future deployment of automated PRL detection in the clinical setting.
PRLs have predominantly been identified in the supratentorial brain, with lesser occurrence in the infratentorial regions, although this could be due to limited brain coverage on imaging or difficulties in identifying PRLs in areas of severe susceptibility-related image artifacts. Recent advances in the use of susceptibility sequences at 7 T have provided preliminary in vivo evidence suggesting that PRLs may occur in the cervical spine, 117 which has important translational implications given that spinal cord damage is clinically eloquent in MS and a predictor of future disability. 117
Slowly expanding lesions
SELs are identified by calculating deformation fields between reference and follow-up scans using conventional MRI. 12 This analysis defines SELs as foci of constant and concentric expansion within existing T2 lesions over 1–2 years. 12 Using the Jacobian algorithm, deformation fields have been derived from serial T2-weighted images 12 or a combination of T1- and T2-weighted images, 67 with the latter providing enhanced lesion contrast and potentially increased sensitivity in detecting small changes. 67 Other methods to detect lesion expansion in serial images without Jacobian analysis have been proposed, including analysis of 3D morphological features 118 and threshold-based detection of volume change in co-registered lesion masks. 119 However, these alternative methods are yet to be comprehensively evaluated.
Currently, no systematic MRI-pathological study has assessed whether SELs defined by the Jacobian algorithm are indeed CALs. Pathological descriptions indicate that the centers of CALs may contract over time, potentially offsetting expansion at the lesion edge without including the whole lesion perimeter, 9 which questions the hypothesized homogeneity of peripheral expansion. 50 It remains to be determined whether the morphology and dynamic features of SELs vary among anatomical regions and over longer follow-up periods. 12
TSPO-PET–positive lesions
In TSPO-PET, radiolabeled TSPO ligands are administered into the peripheral circulation, which then distribute according to the tracer’s pharmacokinetics and bind to TSPO in cells, including microglia and macrophages, enabling their visualization with PET. 80 With improvement in second- or third-generation TSPO ligands ([18F]DPA-714, [18F]PBR111, and [11C]PBR28) regarding greater brain penetrance, binding affinity, and target selectivity than [ 11 C]PK11195, 80 TSPO-PET is gaining attention as an advanced imaging technique for in vivo phenotyping of MS lesions as homogenously active, rim-active, or inactive, as well as for monitoring microglial-driven diffuse neuroinflammation behind the BBB.13,60,120 CAL activity detected with TSPO-PET shows promising correlations with clinical and MRI disease progression and cognitive function (see the proceeding section),13,60 and has potential for clinical application in the future. For instance, TSPO-PET may have utility in solving the “clinical-radiological paradox,” where lesion burden on MRI does not always directly correlate with clinical symptoms; specifically, for some pwMS, positive TSPO-PET findings may be able to bridge the gap between stable MRI activity and worsening of clinical symptoms.
Though PET offers greater molecular specificity and different insights than MRI, 82 several aspects of PET imaging continue to limit its clinical application to academic centers, including limited availability, high costs, technical challenges such as low intrinsic spatial resolution, 61 and the complexity of data analysis121,122 and interpretation. Despite these challenges, chronic neuroinflammation can be reliably assessed with TSPO-PET when well-validated postprocessing and image analysis methods are used.121,122
Novel PET ligands have been developed with affinity for P2X7 receptors,123,124 P2Y12 receptors, 123 folate, 125 and colony-stimulating factor 1 receptor, 126 among others. However, it still remains to be seen whether PET imaging for non-TSPO microglial targets meaningfully improves the in vivo delineation of MS lesions.
Association of CALs with clinical and MRI disease progression
Neuropathological studies have shown that the number of CALs relative to total lesions is associated with the rate of disability accumulation as well as high lesion load and low remyelination. 10 These findings suggest that CAL-mediated tissue injury worsens the clinical disease course. CAL imaging provides a means to investigate real-time relationships between CALs and the disease course, in vivo.
PwMS with PRLs more commonly present with MRI and clinical features that point to a more aggressive MS disease course than pwMS without PRLs,11,14,31,38,127,128 including long-term relapse rates.129,130 One potential caveat is that most of these studies did not control for the total MS lesion load, which is reportedly higher in the brain14,38,128 and spinal cord14,127 of pwMS with PRLs. However, studies have also reported correlations between the number of PRLs and several serum, cerebrospinal fluid (CSF), and ophthalmic biomarkers of neurodegeneration and gliosis,28,131–134 including levels of serum neurofilament light chain (sNfL), 28 plasma glial fibrillary acidic protein, 134 and CSF chitinase 3-like 1 133 independent of total lesion burden. An independent relationship between PRL load and sNfL levels is further supported by a study that observed this association in people with nonacute MS (no gadolinium-enhancing lesions or recent relapses), indicating ongoing axonal injury despite no evident relapse pathology. 28
Several studies have confirmed that the presence of PRLs is associated with increased disability cross-sectionally (as assessed by the Expanded Disability Status Scale (EDSS), MS Severity Score, Paced Auditory Serial Addition Test, pyramidal functional score, and Symbol Digit Modalities Test scores) and higher risk of conversion from clinically isolated syndrome to MS.11,14,15,31,127,135,136 Even in radiologically isolated syndrome, an association between PRLs and clinical disability is evident: among various MRI measures, number of PRLs was most strongly correlated with cognitive impairment, present in one-third of the cohort. 135 Importantly, prospective cohort studies have found that the number of PRLs at baseline is associated with higher EDSS scores at follow-up, independent of variables related to the clinical phenotype; therefore, linking increased burden of focal chronic inflammatory activity with disability accumulation.11,15 In a separate prospective study, PRL volume was among the most important MRI variables predicting EDSS score worsening in a random forest analysis. 38 However, since these studies included participants with relapsing MS,11,15,38 the EDSS score changes predicted by PRL burden might have reflected both relapse-associated worsening and progression independent of relapse activity (PIRA). More recently, the presence of PRLs has been shown to specifically predict PIRA,22,137,138 with large multicenter studies finding that the occurrence of PIRA was independently associated with the baseline number of PRLs over 4 years of follow-up 137 and with the presence of >4 PRLs even already over 2 years of follow-up. 138 Recent studies have indicated that SEL volume is associated with disability accumulation.48,52,139 Another study found that both the proportion of SELs among white matter lesions and the MTR of SELs were independent predictors of future EDSS score worsening and that the MTR of SELs predicted RRMS to SPMS conversion. 67
The link between PRLs and more severe disease course may reflect a synergistic effect via co-localization with SELs.29,30 Total lesion load has been suggested to drive co-localization of SELs and PRLs. 29 Correlation of SELs and PRLs has been found to predict disability accumulation, 29 consistent with the pronounced tissue damage associated with SEL+/PRL+ lesions. 30 This suggests an additive effect of SELs and PRLs on chronic neuroinflammation and decreased remyelination. 29
Data are beginning to emerge on TSPO-PET–visualized CALs and their impact on disability accumulation and disease mechanisms. In a cross-sectional analysis of participants with rim-positive lesions observed using [ 11 C]PK11195, the number of active voxels at the rim and the volume of rim-active lesions were associated with higher EDSS score, with the former measure also higher among SPMS compared with RRMS participants. 60 In addition, the number and volume of rim-active lesions detected with [ 11 C]PK11195 were found to be positively correlated with sNfL levels, 140 consistent with findings on PRLs and sNfL levels. 28 Longitudinal proof-of-concept studies support the usability and clinical relevance of TSPO-PET–detected CALs in predicting clinical progression.13,61 In one longitudinal study that used [ 11 C]PK11195, pwMS with a high proportion of rim-active lesions and a low proportion of inactive lesions were much more likely to experience EDSS progression during a 5-year follow-up than other pwMS. 61 In another longitudinal study, the number of homogeneously active CALs (i.e., those with an active center), detected with [ 18 F]-DPA-714, was found to be the strongest predictor of subsequent brain atrophy and EDSS score worsening. 13 This growing body of evidence for CALs as drivers of neuronal damage highlights their value as potential predictors of MS disease progression and disability accumulation.
Effects of DMTs on imaging biomarkers of CALs
The application of imaging to study the effects of DMTs on the formation and structure of CALs has the potential to provide a unique perspective of treatment effects on smoldering neuroinflammation, which may be challenging to detect using conventional neurological examination. 1
Paramagnetic rim lesions
In a cross-sectional analysis, many pwMS had ⩾1 PRL despite receiving DMTs such as dimethyl fumarate, natalizumab, fingolimod, and ocrelizumab, 11 indicating inadequate control of smoldering neuroinflammation with current treatments. This view is consistent with the results of several longitudinal studies,22,141,142 although larger cohorts and longer follow-ups are required to elucidate the long-term therapeutic effect on CALs. In one 2-year study, there was no significant treatment effect of B-cell–depleting therapy on PRL rim persistence, volume, susceptibility, or T1 times. 22 In another study, dimethyl fumarate, fingolimod, and ocrelizumab showed less decrease in the T1:T2 ratio in PRLs after 2 years compared to no treatment, suggesting that DMTs may have a beneficial effect on the developing tissue damage in PRLs, 141 which is consistent with a study showing reduced susceptibility in PRLs with dimethyl fumarate. 143 In contrast, a recent study found that the number and volume of PRLs was stable after teriflunomide treatment for 24 months or longer. 142
Novel small-molecule DMTs designed to cross the BBB to potentially target microglia may have more direct effects on CALs. Several inhibitors of the enzyme Bruton’s tyrosine kinase (BTK), which differ in their potency and ability to cross the BBB, are currently being investigated in late-stage clinical trials as potential MS treatments. 144 BTK is an attractive target given its important role in signaling pathways that control the activation, maturation, and survival of B cells and myeloid cells including microglia. 144 The potential for a brain-penetrant BTK inhibitor to affect CALs was highlighted in a recent study of autopsy tissue, which reported upregulated expression of the Btk gene in CALs, compared with control white matter. 145
Changes in the number of PRLs, as well as number and volume of SELs, are being assessed for the BTK inhibitor tolebrutinib in exploratory analyses of phase III trials (NCT04410978; NCT04410991; NCT04411641; NCT04458051) and an open-label extension (NCT03996291) of a phase IIb trial. 146
PRLs are being assessed as a primary end point in the phase II BRaKe MS trial (NCT04742400), in which pwMS with ⩾1 baseline PRL switched to treatment with tolebrutinib 60 mg after at least 6 months of ocrelizumab treatment. 147 A recent analysis of trial data using single-cell transcriptomics identified a myeloid cell cluster in the CSF that increased, as a proportion of all myeloid cells, at 48 weeks after the switch from ocrelizumab to tolebrutinib. 147 Ontology analysis of genes downregulated in this cluster revealed enrichment for terms including ribosome, antigen processing and presentation, major histocompatibility complex (MHC) class II protein, extracellular exosome, phagosome, regulation of T-cell activation, and cytokine production. 147 Many of these genes (e.g., MHC class II genes, APOE, and the iron-related FTL and FTH1 genes) that were downregulated after tolebrutinib treatment 147 were previously found to be upregulated in CAL rims 19 (Table 1). Consistent with gene expression findings, BraKe MS participants showed an altered abundance of proteins in the spinal fluid after tolebrutinib treatment, with the levels of 30 disease-associated proteins reduced after 48 weeks of tolebrutinib treatment, including NfL and the chemokine ligands CXCL10, CCL3, and CCL4. 148 These data are consistent with transcriptomic and proteomic changes in the CSF upon BTK inhibition, suggesting a less inflammatory and neurodegenerative profile in tolebrutinib-treated pwMS with ⩾1 baseline PRL who switched from ocrelizumab.
Slowly expanding lesions
Recent attempts to study the effects of DMTs on the formation and structure of CALs have focused on the reanalysis of clinical trial data assessing SELs.48,49,139 An exploratory analysis of the phase III ORATORIO trial reported significant reductions in T1 signal intensity and T1 volume accumulation within the SELs with ocrelizumab but no effect on overall SEL prevalence. 48 Studies of natalizumab treatment on SELs have also provided mixed findings. In an exploratory analysis of the phase III ASCEND trial, natalizumab treatment was associated with a reduced prevalence of SELs and reduced T1 volume increase in SELs and non-SELs versus placebo. 139 An observational study of natalizumab and fingolimod reported modest effects for both agents on SEL-related endpoints. 49
Interpreting the effect of DMTs on SEL dynamics is challenging because the biological basis of SELs and the histopathological correlates are not fully understood. Available data indicate that current DMTs either do not have meaningful effects on SELs or have relatively modest impact, which would likely reflect predominantly indirect effects of strong peripheral anti-inflammatory action.48,49 Studies with longer follow-up are needed to test the hypothesis that SELs correlate with poor outcomes on disability measures. A limitation of SEL detection is that it omits CALs that may not show lesion expansion as assessed by T1- or T2-weighted MRI. 139
In the phase II trial of the BTK inhibitor evobrutinib, SEL volume after 48 weeks/end of treatment was reduced with evobrutinib 75 mg twice daily (comparator was 24 weeks of placebo followed by 24 weeks of evobrutinib 25 mg once daily), although statistical significance was not reached when only completers at 48 weeks were assessed. 149 Of note, two phase III clinical trials comparing evobrutinib with teriflunomide in RMS (evolutionRMS 1 and 2) failed to meet their primary end points of reducing annualized relapse rates. Additional results are expected to be reported in the near future.
TSPO-PET–positive lesions
Analyses of rim lesions, either as PRLs or with TSPO-PET, can detect local immune cell responses as these imaging modalities have a distinct cellular correlate. The potential value of combining these approaches was demonstrated in a recent observational study of teriflunomide-treated pwMS, which reported a correlation between QSM-MRI positivity and glial density as assessed by visual inspection of TSPO-PET data. 62 Preliminary results indicate that TSPO-PET can track changes in CALs, with studies showing a small reduction in TSPO-PET positivity in CAL rims after 1 year of natalizumab treatment.150,151 Future research should assess if treatment effects in CALs differ over time for TSPO-PET-positive lesions and PRLs.
Guidance from imaging groups
A recent consensus statement from the NAIMS Cooperative summarized current knowledge on imaging CALs, offering guidance for defining and implementing the three CAL imaging biomarkers. 82 PRLs were considered the CAL biomarker with the most robust histopathological support. Accordingly, the consensus established a radiological definition of PRL to enhance standardization and facilitate future reporting of this biomarker in clinical settings (Table 3). 82 There was agreement that SELs require a minimum of three scans, ideally over 1–2 years, and that optimization of current SEL quantification methods may result in improved markers of CAL activity. The consensus statement noted that while TSPO-PET enables improved molecular specificity to detect a wider population of CALs, the clinical feasibility of this technique is currently limited.
Clinical application of CAL biomarkers: steps and barriers
Establishment of a CAL imaging biomarker that accurately predicts disability accumulation would provide a much needed tool to evaluate subclinical smoldering neuroinflammation in clinical settings for the purposes of prognostication, disease monitoring, patient stratification, and treatment response prediction.28,50 Additionally, dynamic biomarkers of CALs that correlate with disability accumulation are promising outcome measures in clinical trials of potential DMTs targeting smoldering neuroinflammation.
There are several obstacles to the translation of CAL imaging into clinical practice. The recently published NAIMS consensus statement has provided definitions of CALs based on in vivo imaging 82 ; however, these definitions are likely to evolve with new data. One example is the recent discovery of homogeneously active lesions by TSPO-PET, which, without neuropathological validation, have been hypothesized to represent a transition stage between late active lesions and histopathologically defined CALs. 13 Another example is the description of juxtacortical paramagnetic rims not surrounding white matter lesions, which are associated with iron-laden microglia and cortical demyelination. 152 Future studies using novel imaging techniques and postprocessing methods will likely provide alternative CAL visualization methods beyond volumetric changes and composition of iron and innate immune cells.153–155 Preliminary work has shown initial value in differentiating CALs from other lesion types based on their higher sodium concentration, 153 rim-to-core differences in DTI-detectable tissue damage, 154 and textural features in T1-weighted 3D magnetization-prepared rapid acquisition gradient-echo images. 155
Accessibility and standardization are key requirements for the clinical use of imaging biomarkers. Acquisition protocols must be widely available on commercial scanners, while postacquisition processing should be built into imaging systems, not be overly cumbersome, and enable extraction of quantitative outputs that can be referenced against established clinically relevant or actionable cutoff values. 156 Standardized MRI protocols are key for PRL detection, since artifacts and signal variability can make their classification ambiguous.39,157 The impact of different sequences and field strengths on the accuracy and reliability of PRL detection has not been comprehensively examined, 17 and QSM algorithms are not currently available on commercial scanners. 156 Several manufacturers offer SWI 39 ; however, current international guidelines do not include SWI in the standard MS MRI protocol. 158 Issues currently limiting the implementation of SELs as a CAL biomarker include the availability of Jacobian analysis, nonstandardized detection algorithms, and a lack of consensus regarding the metrics for evaluating SEL expansion (i.e., thresholds defining meaningful lesion expansion, total SEL volume, or volume change within SELs). 54 Automated image analysis methods are necessary to assess CALs on a large scale. Manual identification of paramagnetic rims is time-consuming and subject to inter- and intrarater variability. 157 Several reliable machine learning methods can identify PRLs from QSM 116 and 3D-EPI T2*-weighted and phase images,113,114 with QSM outperforming other methods in lesion-wise sensitivity and specificity. 116 It is yet to be determined whether the accuracy of machine learning methods for detecting PRLs could be improved by including other PRL-specific imaging measures, such as the presence of deeply hypointense voxels on 3D T1-weighted turbo field echo. 159 Machine learning approaches could consider rim presence as a continuous rather than binary parameter, with intermediate values signifying ambiguity in lesion classification, but also potentially different stages of PRL evolution, reflecting the density of innate immune cells at the lesion edge. 114
The question of which PRL detection methods are best suited for clinical practice and trials needs to consider the global availability of the method in routine clinical settings. Considering all pros and cons, phase/magnitude and SWI stand out as the most commonly available, practical, and currently most effective methods for PRL detection, striking a balance between image quality and accessibility. This recommendation ensures that availability, diagnostic utility, and cost efficiency are well aligned to meet the qualitative requirements of both routine clinical practice and global clinical trials. Although QSM is more sensitive in detecting subtle differences in magnetic susceptibility, it requires specialized software and hardware, as well as more complex postprocessing techniques, which are generally unavailable outside of universities and advanced research centers. QSM is therefore a less feasible option than phase/magnitude and SWI for PRL detection in standard clinical practice and is also not aligned with the aspiration of increasing global clinical trial participation, including from low-income countries.
Finally, appropriate training is warranted for neurologists and radiologists on the use of CAL biomarkers. Multidisciplinary partnerships between neuroradiologists and neurologists are important for accurate reading and interpretation of CAL imaging scans and translating these findings into optimum MS care. A recent systematic review concluded that there is a need for completeness in reporting factors relevant to the reliability of PRL assessment, including rater level of training and extent of experience. 77 The use of semiautomated software has been shown to enhance the accuracy of new MS lesion detection by non-neuroradiologists, 160 thus reinforcing the potential value of assistive software for CAL image analysis.
Conclusions
In recent years, we have seen great progress in the in vivo visualization of CALs. PRLs, SELs, and TSPO-PET–positive lesions have been proposed as three distinct imaging approaches to identify CALs in vivo since they are thought to represent certain histopathological features of CALs and are associated with disability accumulation in pwMS. Each method has particular advantages and disadvantages. Compared with SELs and TSPO-PET–positive lesions, PRLs have more robust histopathological support, enable time-saving, cross-sectional imaging, and can be visualized with widely available MRI sequences. PRLs have recently been incorporated in the 2024 revision of the McDonald Criteria 161 ; therefore, representing the first CAL imaging biomarker to be integrated into routine clinical practice. Efforts to optimize imaging and postprocessing techniques as well as the application of machine learning for improved CAL detection are ongoing. With the current impetus to identify DMTs that cross the BBB and target smoldering neuroinflammation, the role of CALs in the assessment of MS prognosis, evaluation of DMT efficacy, and personalization of treatment regimens is anticipated to increase substantially. The impact of DMTs on decreasing CAL burden and the resulting effect on MS disease progression has the potential to change the MS treatment landscape. Given the focus on broad global applicability, MRI-based PRL detection remains the most feasible option for widespread clinical use to detect CALs. It is evident that there is an urgent need for susceptibility sequences, such as SWI, to be acquired as part of clinical routine to enable PRL reporting. This will require collaboration between radiologists and neurologists to ensure optimal interpretation, especially with implementation of PRLs in the 2024 McDonald criteria.
Supplemental Material
sj-docx-1-tan-10.1177_17562864241306684 – Supplemental material for Chronic active lesions in multiple sclerosis: classification, terminology, and clinical significance
Supplemental material, sj-docx-1-tan-10.1177_17562864241306684 for Chronic active lesions in multiple sclerosis: classification, terminology, and clinical significance by Assunta Dal-Bianco, Jiwon Oh, Pascal Sati and Martina Absinta in Therapeutic Advances in Neurological Disorders
Footnotes
Acknowledgements
We thank Jelena Stojanovic-Radic, PhD, and Svend S. Geertsen, PhD, of Sanofi, for contributions to the planning, review, and coordination of the manuscript. Medical writing assistance was provided by Richard J. Hogan, PhD, and Conor F. Underwood, PhD, of Envision Pharma Group, and was funded by Sanofi.
Correction (January 2025):
Since the original online publication, graphical abstract has been added to the article.
Declarations
Supplemental material
Supplemental material for this article is available online.
References
Supplementary Material
Please find the following supplemental material available below.
For Open Access articles published under a Creative Commons License, all supplemental material carries the same license as the article it is associated with.
For non-Open Access articles published, all supplemental material carries a non-exclusive license, and permission requests for re-use of supplemental material or any part of supplemental material shall be sent directly to the copyright owner as specified in the copyright notice associated with the article.