
Abstract
Background:
Insulin resistance (IR) may play a crucial role in irritable bowel syndrome (IBS) pathogenesis. However, it remains unclear whether triglyceride-glucose (TyG)-related indices, useful biomarkers for assessing IR, are associated with IBS development.
Objectives:
To investigated the link between baseline TyG-related indices and incident IBS.
Design:
A prospective, population-based cohort study.
Methods:
Participants free of IBS with available TyG-related indices (TyG-waist circumference (TyG-WC), TyG-waist-to-height ratio (TyG-WHtR), and TyG-body mass index (TyG-BMI)) at enrollment were included (N = 356,904). Primary endpoint was incident IBS. Cox regression was used to evaluate the association between TyG-related indices and IBS.
Results:
During a median 14.6 years of follow-up (5,023,899 person-years), 7381 (2.1%) participants developed IBS. The mean (standard deviation) level of baseline TyG index was 8.7(0.6), with 8.0 (0.2), 8.5 (0.1), 8.9 (0.1), and 9.5 (0.3) in quartile 1–4. Compared with the lowest quartile, the highest quartile of all TyG-related indices was significantly associated with greater risk of incident IBS (TyG hazard ratio (HR) = 1.24, 95% confidence interval (CI): 1.16–1.33, <0.001; TyG-WC HR = 1.25, 95% CI: 1.16–1.34, <0.001; TyG-WHtR HR = 1.24, 95% CI: 1.16–1.33, <0.001; TyG-BMI HR = 1.15, 95% CI: 1.07–1.23, <0.001). Meanwhile, per standardized deviation increment of TyG-related indices were also associated with 6%–9% greater risk of IBS (TyG HR = 1.09, 95% CI: 1.07–1.12; TyG-WC HR = 1.09, 95% CI: 1.07–1.12; TyG-WHtR HR = 1.09, 95% CI: 1.06–1.11; TyG-BMI HR = 1.06, 95% CI: 1.03–1.08). Similar results were observed in various sensitivity analyses and subgroup analysis.
Conclusion:
Higher TyG-related indices are linked to higher risk of incident IBS, highlighting the importance of IR in IBS pathogenesis.
Introduction
Irritable bowel syndrome (IBS) is one of the most prevalent disorders of gut–brain interaction, with a prevalence rate varying geographically from 1.1% to 45%. 1 IBS is characterized by recent abdominal pain, bloating, and stool irregularity without organic lesions. 2 As a chronic disease, it not only has a negative influence on patients’ quality of life but also causes a great burden on social finance. 1 Therefore, there is an urgent need to identify critical factors that contribute to IBS development and propose effective preventive strategies.
Prior evidence has demonstrated the close link between type 2 diabetes mellitus (T2DM), nonalcoholic fatty liver disease (NAFLD), and incident IBS, highlighting the critical role of metabolic components, particularly insulin resistance (IR), in the pathogenesis of IBS.3,4 Typically, IR refers to a decrease in sensitivity or responsiveness to insulin, leading to impaired glucose homeostasis along with hyperglycemia and further driving disrupted gut microbiota, change of intestinal barrier permeability, and impaired intestinal motility.5–7 Hence, all these potential mechanisms may contribute to the increased risk of IBS development. However, to date, there is lack of epidemiological studies to investigate the relationship between IR and IBS incidence.
The triglyceride-glucose (TyG) index, which is the logarithm of fasting triglycerides (TG) and glucose, has been shown to be a reliable surrogate of IR. 8 Alternatively, novel indices derived from the integration of TyG index with adiposity indicators, particularly TyG-body mass index (TyG-BMI), TyG-waist circumference (TyG-WC), and TyG-waist-to-height ratio (TyG-WHtR), have been proposed and considered as better indicators to reflect IR level.9,10 Recently, several studies verified the increased risk of all-cause and cardiovascular mortality, as well as cardiovascular events and NAFLD, associated with these TyG-related indices.9,11,12 However, few studies have assessed the relationship between TyG-related indices and incident IBS risk.3,4
To address this knowledge gap, we aimed to investigate the association between baseline TyG-related indices and risk of IBS incidence in a prospective, large-scale population-based cohort with long-term follow-up.
Methods
The reporting of this study conforms to the Strengthening the Reporting of Observational Studies in Epidemiology (STROBE) statement. 13
Study population
Data were derived from the UK Biobank (UKB) database. This was a prospective, population-based cohort, approved by the UK North West Multicenter Research Ethics Committee (21/NW/0157). During 2006–2010, over 500,000 adults (37–73 years old) from 22 assessment centers across England, Scotland, and Wales were recruited. Participants completed nurse-led electronic questionnaires, physical examination, and biological samples collections. 14 All participants gave written informed consent prior data collection.
Participants free of IBS with available TyG-related indices data at enrollment were included. After excluding participants with prevalent cancer diagnosis, prevalent inflammatory bowel disease (IBD) diagnosis, prevalent coeliac disease, missing baseline TG, fasting plasma glucose (FPG), BMI, WC, and hip circumstance (HC), and withdrawal inform content, a total of 356,904 participants were included in final analyses (Figure 1).

Flowchart of the study population.
Assessment of TyG-related indices
TG, FPG, BMI, WC, and HC at baseline were used to calculate all TyG-related indices. Briefly, the TyG index was calculated as ln[TG (mg/dL) × FPG (mg/dL)/2]. 15 Specifically, the indices of TyG-WC, TyG-WHtR, and TyG-BMI were calculated based on the following equations: (1) TyG-WC = ln[TG (mg/dL) × FPG (mg/dL)/2] × WC (cm) 16 ; (2) TyG-WHtR = ln[TG (mg/dL) × FPG (mg/dL)/2] × WC (cm)/height (cm) 17 ; (3) TyG-BMI = ln[TG (mg/dL) × FPG (mg/dL)/2] × BMI (kg/m²). 9 All participants were divided into four groups by the quartiles of TyG index, TyG-WC index, TyG-WHtR index, TyG-BMI index, with the lowest quartile in each index as reference group and the rest three quartiles as exposure group. Meanwhile, we calculated the standardized deviation (SD) of each TyG-related index, in order to evaluate IBS risk associated with per SD increment of each TyG-related index.
Outcome ascertainment
Primary outcome was incident IBS, which was determined via ICD-10 code (K58) with a censoring date of September 30, 2023. The outcome was ascertained through at least one of the following linked data sources: self-reported, primary care, or hospital admission data. Moreover, Rome III criteria via the digestive healthcare questionnaire (DHQ) during 2017–2018 was also used to ascertain incident IBS in sensitivity analysis (detail in “Sensitivity analysis” section and Figure S1).
Covariates
Based on previous epidemiological evidence and data availability,4,18 covariates selected as potential confounders were as follows: age (continuous), sex (male, female), education level (university, nonuniversity), ethnicity (White, non-White), socioeconomic status (Townsend deprivation index (TDI) quartiles), physical activity, alcohol drinking status (never, previous, current), smoking status (never, previous, current), T2DM (yes, no). Physical activity was divided into three levels (low, moderate, and high) and assessed by international physical activity questionnaire (IPAQ). Additionally, weekly alcohol intake (in grams) was also estimated by multiplying average number of alcoholic beverages consumed per week by average grams of alcohol in each type of drink, and adjusted in sensitivity analysis.
Statistical analysis
Baseline characteristics among different groups were described as frequencies and percentage for categories variable, and means ± SD for continuous variates with normal distribution. Chi-square test was used in comparison of categorical variables, whereas continuous variables were compared by one-way ANOVA since data were in normal distribution.
Cox proportional hazard regression was used to estimate the hazard ratios (HR) and 95% confidence interval (CI). Follow-up period started from baseline to date of first IBS diagnosis, or censored at the end of study (September 30, 2023), date of death, or lost to follow-up. Considering a very small percentage of missing values, missing indicators were used. For per SD change and quartiles of each TyG-related index, three adjustment models were conducted. Model 1 was adjusted for age and sex. Model 2 was adjusted for age, sex, ethnicity, education level, socioeconomic status, drinking status, smoking status, and physical activity. Model 3 was additionally adjusted for type 2 diabetes. Meanwhile, restricted cubic splines (RCS) analysis (with knots placed at 5th, 35th, 65th, 95th percentiles) was applied to examine the potential nonlinear association between TyG-related indices and IBS risk. Additionally, p for trend was performed by using the median value of each quartile of TyG-related indices.
Furthermore, subgroup analysis was performed to investigate whether association between TyG-related indices and IBS risk varied by sex (male, female), age (<60, ⩾60 years old), smoking status (never, previous/current), alcohol drinking status (never/previous, current), IPAQ (low/moderate, high), TDI (⩽−2.14, >−2.14). Meanwhile, effect modification was tested by adding cross-product interaction items of each stratified variable (age, sex, smoking status, alcohol drinking status, IPAQ, and TDI) and TyG-related index or quartiles in Cox regression.
Besides, sensitivity analyses were performed to test the robustness of our findings. First, participants who had IBS diagnosis within 1 or 2 years after recruitment were excluded to reduce reverse causation. Second, participants who died without IBS occurrence during follow-up period were excluded. Third, competing risk model by considering lost in follow-up and death as competing events was conducted, since these participants may develop IBS thereafter. Fourthly, considering the influence of age on IBS risk, age-scaled Cox regression stratified by 5-years birth cohort was further conducted. Fifth, depression and anxiety were additionally adjusted. Sixth, weekly alcohol intake (in grams) instead of alcohol drinking status were additionally adjusted to further reduce confounding bias. Seventh, considering potential underdiagnosis of IBS, we also additionally considered those who fulfilled Rome III criteria via DHQ without ever self-reported IBS diagnosis as incident IBS. Eighth, to further rule out the possible misclassification bias for IBS diagnosis, those who fulfilled Rome III criteria via DHQ without incident ICD-10 diagnosis were further excluded. Ninth, considering the potential confounding influence of cardiovascular disease (CVDs), baseline CVDs were additionally adjusted. Finally, considering the potential influence of type 2 diabetes on IR, patients with type 2 diabetes were removed.
All these statistical analyses were calculated by R statistical software (version 4.2.2, R Foundation for Statistical Computing, Vienna, Austria) and SAS software (version 9.4, SAS Institute Inc., Cary, NC, USA), with a two-sided p value <0.05 as statistically significance.
Results
Baseline characteristics
The median (SD) age of study population was 56.2 (8.1) years, of which, 184,790 (51.8%) were female. The mean baseline TyG index level was 8.7 (0.6), with 8.02 (0.2), 8.5 (0.1), 8.9 (0.1), and 9.5 (0.3) in quartile 1–4 of TyG index. As shown in Table 1, participants in the highest quartile of TyG index were older, more male, current smokers, had a lower level of education, physical activity, and TDI, a higher proportion of prevalent diabetes, depression, and anxiety, and a higher value of BMI, WC, HC, FPG, and TG. Similar trend was shown in TyG-WC, TyG-WHtR, and TyG-BMI quartiles (Tables S1–S3).
Baseline characteristics according to TyG quartiles.
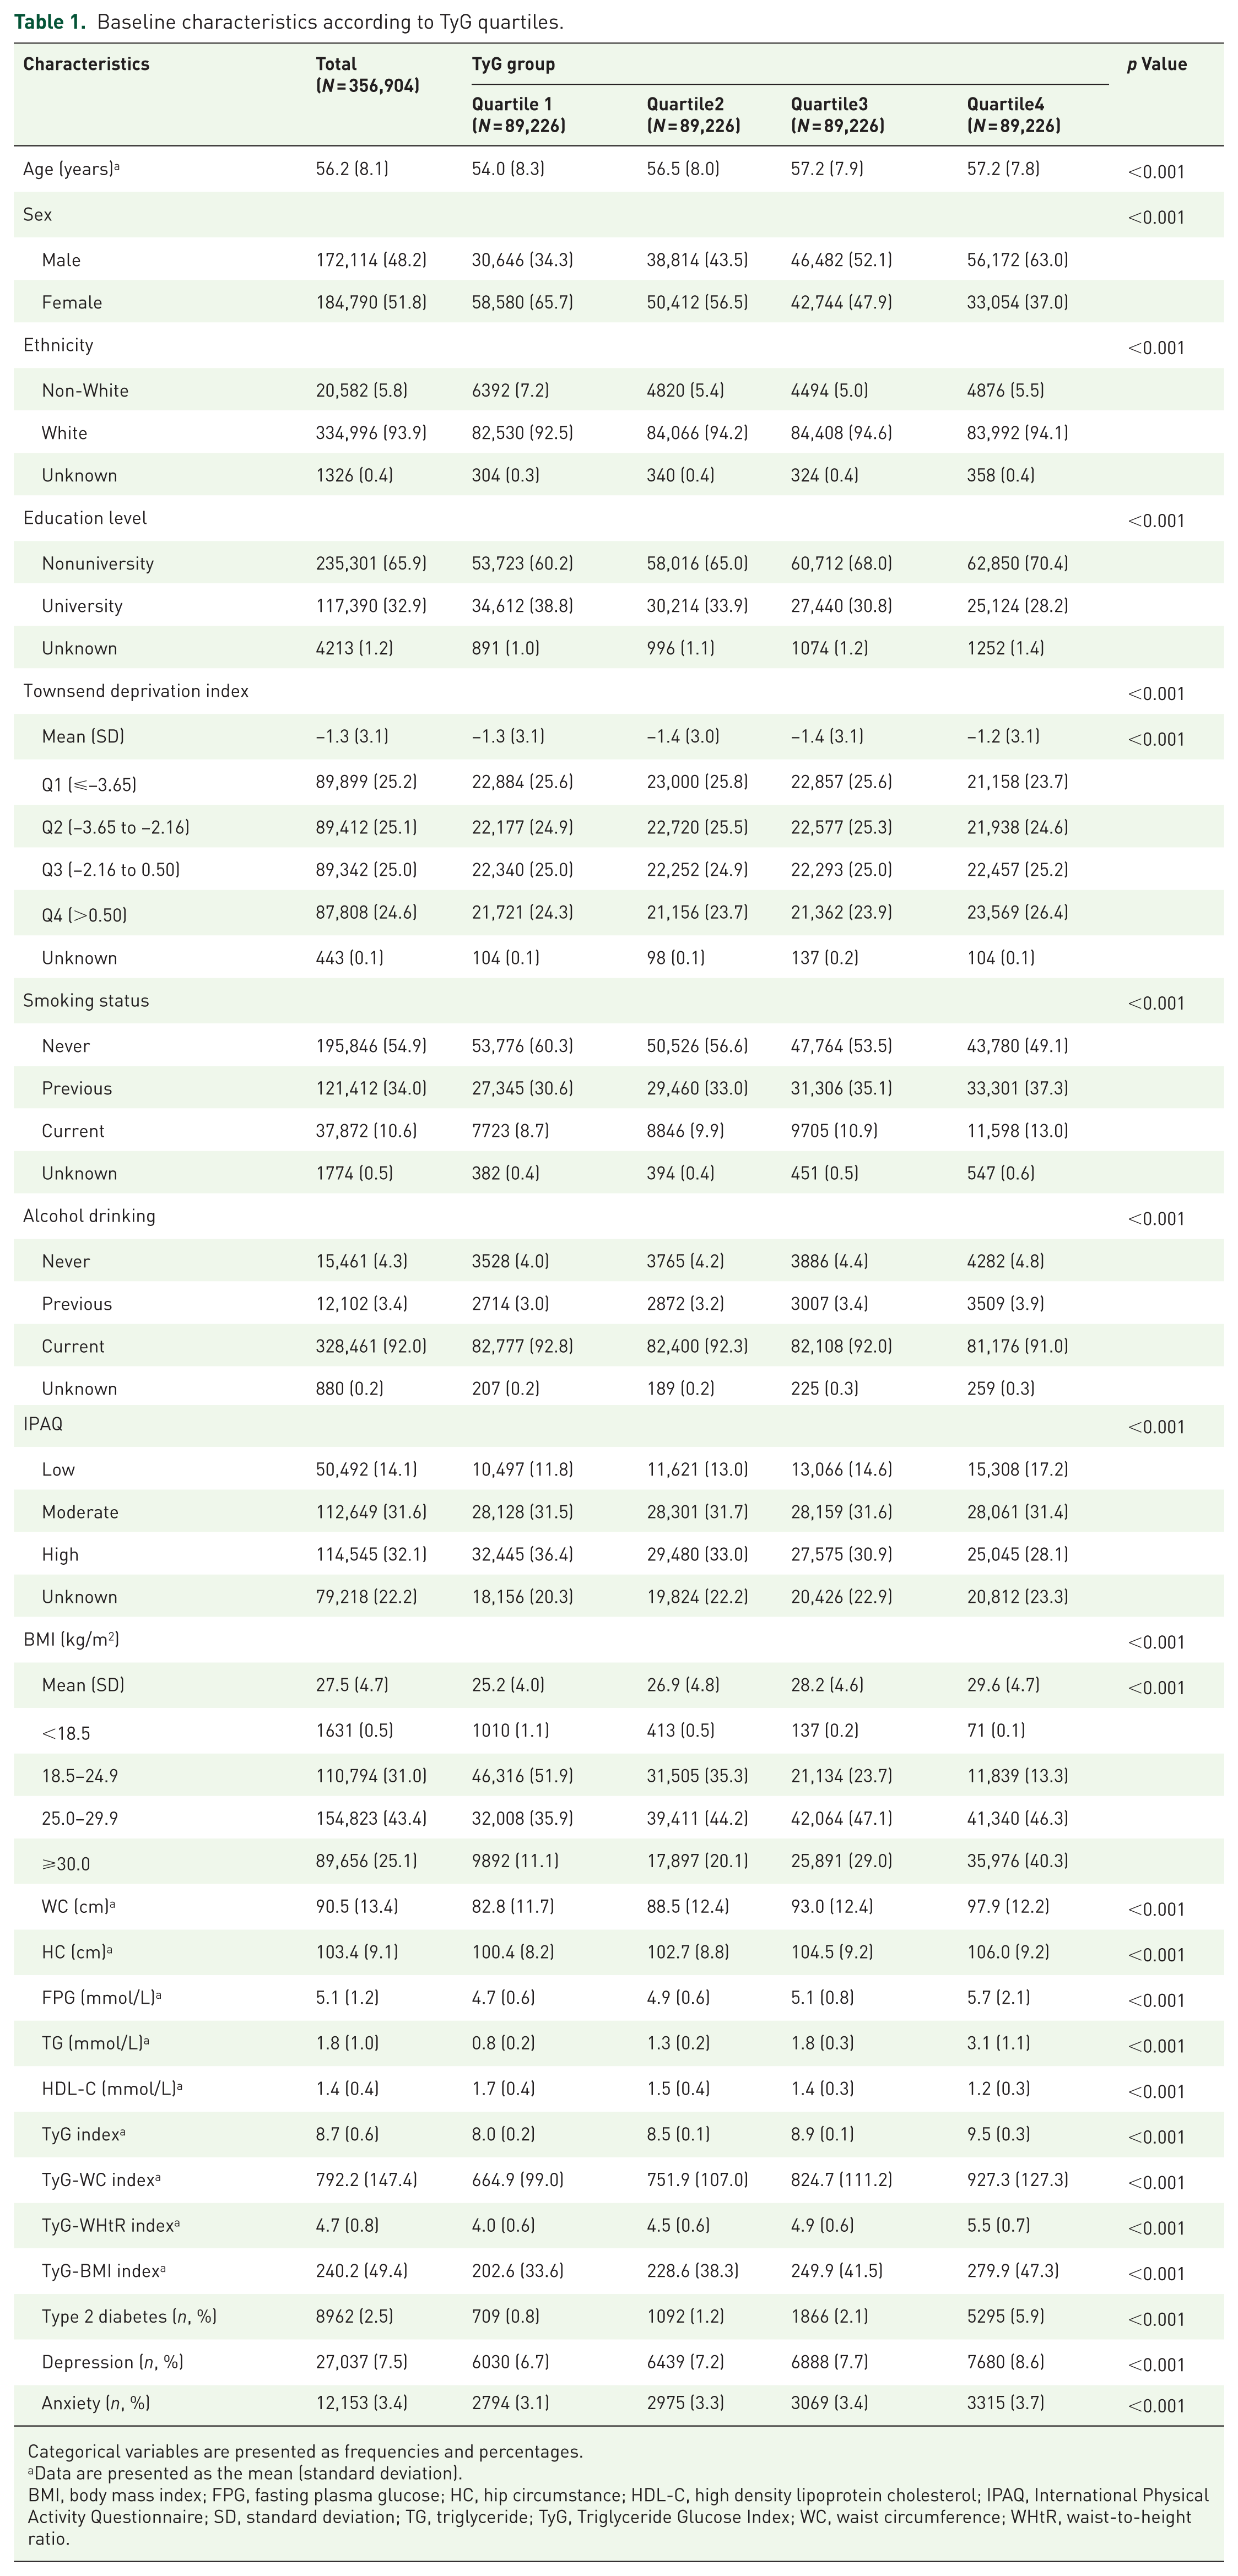
Categorical variables are presented as frequencies and percentages.
Data are presented as the mean (standard deviation).
BMI, body mass index; FPG, fasting plasma glucose; HC, hip circumstance; HDL-C, high density lipoprotein cholesterol; IPAQ, International Physical Activity Questionnaire; SD, standard deviation; TG, triglyceride; TyG, Triglyceride Glucose Index; WC, waist circumference; WHtR, waist-to-height ratio.
Association of TyG index with incident IBS
During a median 14.6 years of follow-up (5,023,899 person-years), 7381 (2.1%) participants developed IBS. Specifically, 1824 (2.0%), 1814 (2.0%), 1840 (2.1%), and 1903 (2.1%) participants developed IBS in quartile 1–4 of TyG index. Cox regression with RCS indicated baseline TyG index was linearly associated with risk of IBS (Pnonlinear = 0.178, Figure 2(a)). Compared with the lowest quartile, participants in the highest quartile had a 24% excess risk (HR = 1.24, 95% CI: 1.16–1.33, <0.001) of incident IBS (Table 2). Meanwhile, a 9% (HR = 1.09, 95% CI: 1.07–1.12) increased risk was associated with per SD increment of TyG index, with significant dose–response relationship (Ptrend < 0.001).
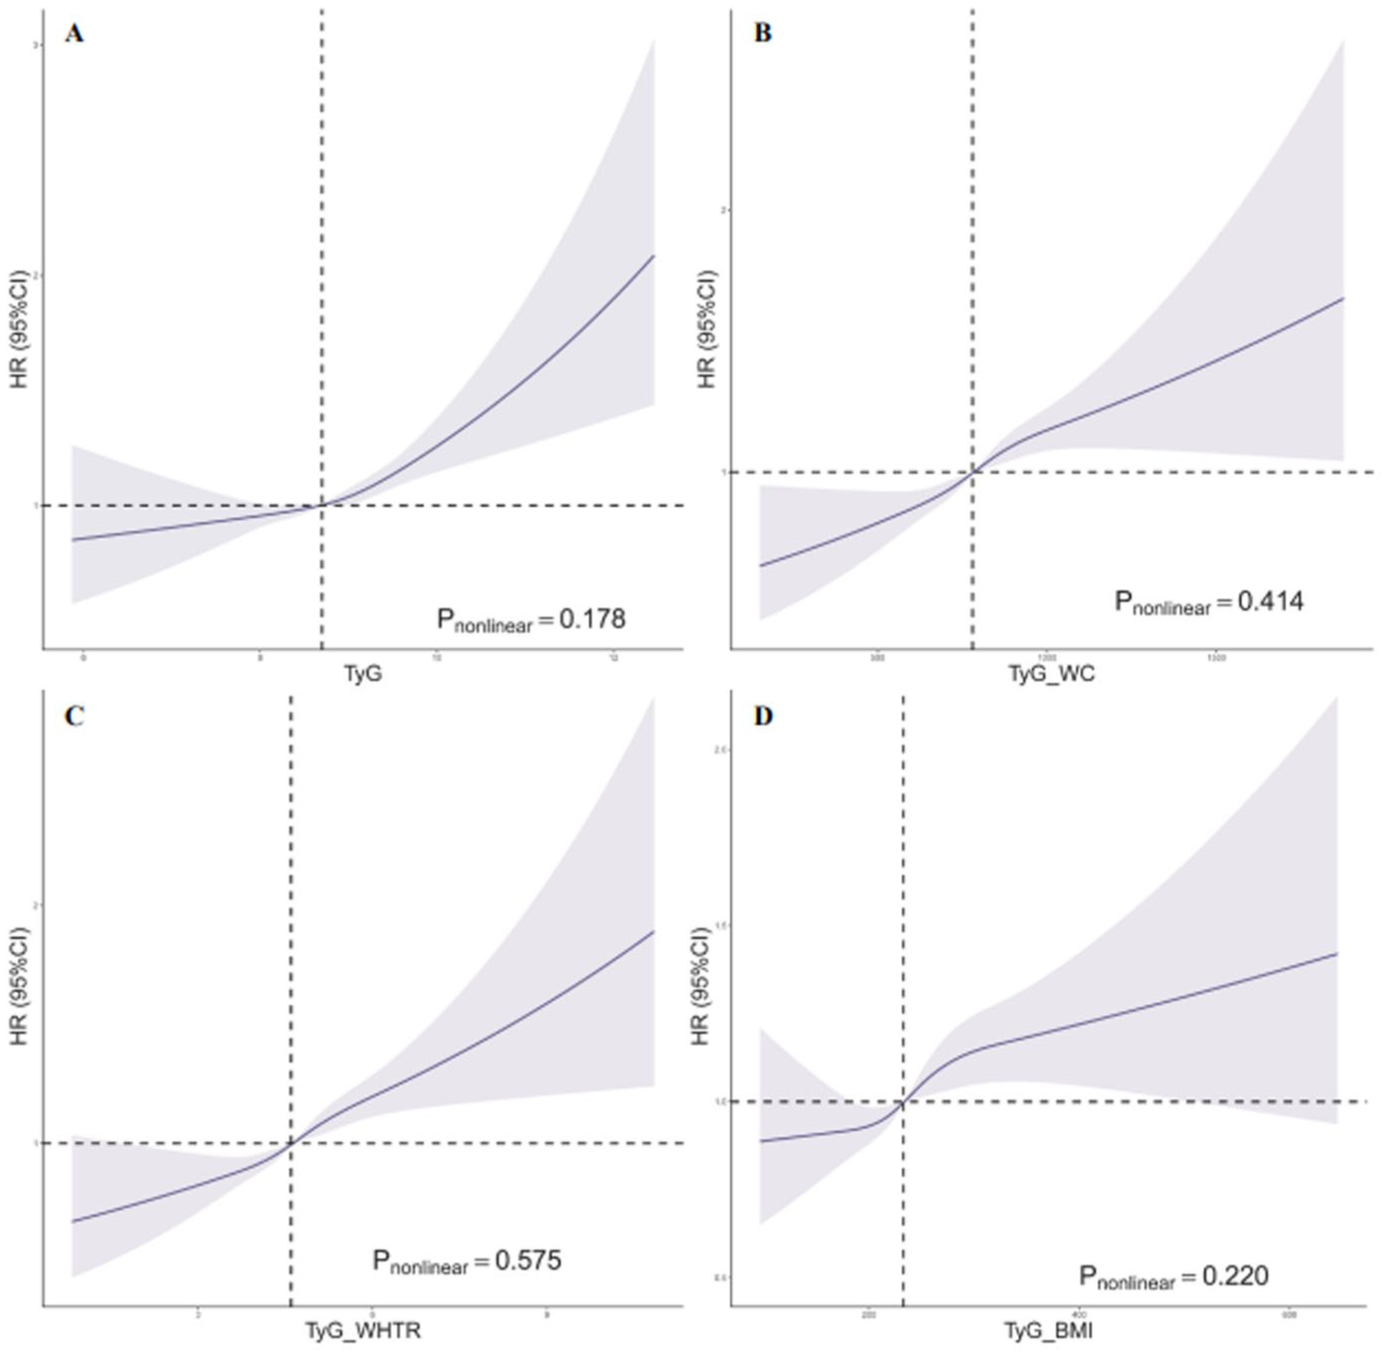
Restricted cubic spline for the association of TyG, TyG_WC, TyG_WTtR, and TyG_BMI with incident IBS. (a) TyG. (b) TyG_WC. (c) TyG_WHtR. (d) TyG_BMI.
Association between quartiles of TyG, TyG-WC, TyG-WHtR, TyG-BMI, and risk of incident IBS.

Adjusted model 1: Age and sex were adjusted. Adjusted model 2: Townsend deprivation index, education level, ethnicity, IPAQ, smoking status, and alcohol drinking status were additionally adjusted. Adjusted model 3: Type 2 diabetes was additionally adjusted.
BMI, body mass index; CI, confidence interval; IBS, irritable bowel syndrome; IPAQ, International Physical Activity Questionnaire; IQR, inter-quartile range; SD, standard deviation; TyG, Triglyceride Glucose Index; WC, waist circumference; WHtR, waist-to-height ratio.
Similarly, consistent findings were observed in subgroup analyses by age, sex, smoking, alcohol drinking, education level, ethnicity, IPAQ, TDI, and T2DM, either for quartiles or per SD increment of TyG index. No significant modification effect was detected across those subgroups (all Pinteraction > 0.05) except for age subgroups (Pinteraction = 0.001 for quartiles and <0.001 for per SD) and sex (Pinteraction = 0.018 for quartiles and 0.005 for per SD), with evidently higher IBS risk in those with age <60 years and females (Figure 3, Tables S4–S9).

Subgroup analysis for the association of TyG, TyG_WC, TyG_WTtR, and TyG_BMI with incident IBS. (a) Quartiles of TyG indices. (b) Per SD increment of TyG indices.
Association of TyG-WC index with incident IBS
Cox regression analysis with RCS indicated a linear association between baseline TyG-WC index and IBS risk (Pnonlinear = 0.414, Figure 2(b)). Compared to the lowest quartile, individuals in the highest quartile exhibited a 25% increased risk of developing IBS (HR = 1.25, 95% CI: 1.16–1.34, <0.001). Additionally, for each SD increase in the TyG-WC index, the risk of IBS rose by 9% (HR = 1.09, 95% CI: 1.07–1.12), demonstrating a significant dose–response relationship (Ptrend < 0.001).
Similar trends were observed across subgroup analyses stratified by age, sex, smoking status, alcohol drinking, education level, ethnicity, IPAQ, TDI, and T2DM, either for quartiles or per SD increment of TyG-WC index. No significant interaction effects were detected across most subgroups (all Pinteraction > 0.05), except for age (Pinteraction < 0.001 for both quartiles and per SD) and sex (Pinteraction = 0.013 for per SD) and TDI (Pinteraction = 0.017 for quartiles and 0.034 for per SD). Notably, individuals younger than 60 years, females, and those with a TDI >−2.14 exhibited a particularly higher risk of IBS (Figure 3, Tables S4–S9).
Association of TyG-WHtR index with incident IBS
Overall, incidence of IBS was 2.1%, 2.0%, 2.0%, and 2.2% across the first to fourth quartiles of TyG-WHtR index. Cox regression with RCS confirmed baseline TyG-WHtR index was linearly associated with risk of IBS (Pnonlinear = 0.575, Figure 2(c)). Compared with the lowest quartile, those in the highest quartile had a 24% greater risk of IBS (HR = 1.24, 95% CI: 1.16–1.33, p < 0.001, Table 2). Meanwhile, a 9% (HR = 1.09, 95% CI: 1.06–1.11) increased risk was associated with per SD increment of TyG-WHtR index, showing a significant dose-response relationship (Ptrend < 0.001).
Subgroup analyses stratified by age, sex, smoking status, alcohol drinking, education level, ethnicity, IPAQ, TDI, and T2DM revealed consistent results for both quartile-based and per SD assessments of TyG-WHtR index. While no significant interaction effects were found in most subgroups (all Pinteraction > 0.05), age (Pinteraction < 0.001 for quartiles and per SD), TDI (Pinteraction < 0.001 for quartiles; Pinteraction = 0.003 for per SD), and sex (Pinteraction = 0.026 for per SD) exhibited notable modifications. IBS risk was significantly higher among individuals younger than 60 years, females, and those with a TDI >−2.14 (Figure 3, Tables S4–S9).
Association of TyG-BMI index with incident IBS
Cox regression with RCS identified a linear relationship between baseline TyG-BMI index and IBS risk (Pnonlinear = 0.220, Figure 2(d)). Participants in the highest quartile had a 15% greater likelihood of developing IBS compared to those in the lowest quartile (HR = 1.15, 95% CI: 1.07–1.23, p < 0.001, Table 2). Additionally, for every SD increase of TyG-BMI index, IBS risk rose by 6% (HR = 1.06, 95% CI: 1.03–1.08), showing a significant dose–response trend (Ptrend < 0.001).
Subgroup analyses by age, sex, smoking status, alcohol consumption, education level, ethnicity, IPAQ, TDI, and T2DM observed consistent findings for both quartiles and per SD evaluations of TyG-BMI index. Most subgroups showed no significant interaction effects (all Pinteraction > 0.05); however, notable effect modifications were observed for age (Pinteraction < 0.001 for quartiles and per SD), sex (Pinteraction < 0.001 for quartiles; Pinteraction = 0.004 for per SD), and TDI (Pinteraction < 0.001 for quartiles; Pinteraction = 0.002 for per SD). IBS risk was markedly higher among individuals younger than 60 years, females, and those with a TDI >−2.14 (Figure 3, Tables S4–S9).
Sensitivity analysis
The relationship between TyG-related index, either quartiles or per SD increase, were all consistent to principal findings (Table 3).
Sensitivity analysis regarding risk of incident IBS associated with TyG, TyG-WC, TyG-WHtR, and TyG-BMI.

All HRs were calculated by adjusting the following covariates: Age, sex, Townsend deprivation index, education level, ethnicity, smoking status, alcohol drinking status, IPAQ, and type2 diabetes.
27,277 participants were excluded due to death without IBS diagnosis.
BMI, body mass index; CI, confidence interval; CVDs, cardiovascular diseases; DHQ, dietary history questionnaire; HR, hazard ratio; IBS, irritable bowel syndrome; ICD, international classification of diseases; IPAQ, International Physical Activity Questionnaire; SD, standard deviation; TyG, Triglyceride Glucose Index; WC, waist circumference; WHtR, waist-to-height ratio.
Discussion
In this large prospective cohort study with nearly 0.4 million participants, we found individuals with the highest quartile of TyG, TyG-WC, TyG-WHtR, and TyG-BMI indices had a 24%, 25.0%, 24.0%, and 15% greater risk of developing IBS versus those with the lowest quartile, respectively. Meanwhile, per SD increment of TyG-related indices were also associated with 6%–9% greater risk of IBS. Particularly, individuals younger than 60 years, females, and those with lower socioeconomic status exhibited even higher IBS risk. These findings demonstrated the critical role of IR in IBS pathogenesis.
Although lack of epidemiological study investigated the relationship between IR and IBS, emerging evidence indicated the positive association between obesity, T2DM, as well as higher level of TG and IBS, all of which were closely related to IR. A long-term prospective cohort study demonstrated a 39% increased risk of incident IBS in T2DM patients versus non-T2DM.3,4 A population-based study found that obesity (BMI > or =30) was associated with increased odds of incident IBS (odds ratio (OR) = 1.58) compared to nonobesity (BMI < 30). 19 A Mendelian randomization study demonstrated a positive causal relationship between triglycerides and IBS, with the inverse-variance weighted method revealing an OR of 1.12. 20 Meanwhile, it has been confirmed that IR, represented by high TyG index, was associated with higher risk of these metabolic diseases, including obesity, T2DM, dyslipidemia, and fatty liver.4,11,21,22 Hence, IR may indirectly facilitate IBS development through increasing risk of these metabolic disorders, owing to the shared common pathophysiology between metabolic syndrome and IBS.
Several potential mechanisms may explain the positive association between TyG related indices and IBS. First, IR may contribute to IBS development by leading to gut dysbiosis. Patients with T2D had altered gut microbiota, with decreased beneficial bacterial (i.e., Lactobacilli, Bifidobacteria) and increased harmful bacterial (i.e., Clostridium, Fusobacterium). 23 Similarly, patients with IBS also demonstrate a distinct dysbiosis profile, with diminished levels of beneficial bacteria, including Bifidobacterium and Lactobacillus, and elevated levels of potentially deleterious bacteria, such as Bacteroides and Enterobacteriaceae. 24 Hence, the disorder of the gut microbiota may weaken the production of short-chain fatty acids and further lead to damaged intestinal barrier and increased intestinal permeability, thereby contributing to the development of IBS. 23 Second, various animal experiments have demonstrated the anti-inflammatory effects of insulin in addition to the glucose homeostasis. Thus, in the circumstance of IR, anti-inflammatory effect of insulin could be highly impeded, resulting in systematic low-grade inflammation, including increased expressions of TNF-α, IL-6, IL-8, and IL-1β. 25 These proinflammatory cytokines have been reported to play important roles via Toll-like receptors in IBS pathogenesis, involving the effect on nervous systems to induce visceral hypersensitivity (TNF-α), disrupted tight junction (TNF-α, IL-6), and maintenance of gut homeostasis (IL-1β, IL-6, IL-10). 26 Third, IR-induced hyperglycemia itself may stimulate a primarily defensive inflammatory response, with subsequent release of numerous inflammatory cytokines. Consequently, the proinflammatory environment could lead to the generation of reactive oxygen species and further cause visceral hypersensitivity through the regulation of dorsal root ganglion neurons, which may also facilitate IBS occurrence.27,28
Our subgroup analysis revealed a significant association only in individuals under 60 years of age rather than in those over 60. This discrepancy may be attributed to the lower prevalence in older adults. Additionally, our findings revealed an even higher risk of IBS associated with all TyG-related indices in female instead of male, highlighting the pivotal role of sex in IBS pathogenesis. Numerous studies also demonstrated the significant sex disparity in IBS prevalence with approximately 2:1 in female versus male. 1 Although the exact mechanism is yet unclear, increasing evidence suggested the potential role of ovarian hormone fluctuations. Owing to the inhibited effect of smooth muscle contraction and modulation of the colonic 5-HT system, fluctuations of oestrogen and progesterone may contribute to IBS via regulation of intestinal motility and visceral hypersensitivity.29–31 Another possible explanation might be the sex-specific impact on composition of gut microbiota, with more abundant of Clostridiales and Synergistaceae in female than male.29–31 Since gut dysbiosis plays a contributory role in the integrity of intestinal mucosal barrier, this modification may also aggravate IBS risk in female. Nevertheless, more investigation is warranted to further clarify related underlying mechanisms.
Considering the potential adverse effects of higher TyG-related indices on IBS occurrence, screening for IR may have significant implications for the detection and diagnosis of IBS. Moreover, given that the TyG-related indices are derived from routine clinical test, it offers high feasibility and reliability for early identification of high-risk individuals, particularly middle-aged adults and females in the highest quartile of TyG-related indices. Herein, those high-risk individuals may benefit from targeted IBS screening and early lifestyle interventions, such as personalized dietary and exercise guidance, aimed at reducing the future risk of developing IBS. Further prospective studies are warranted to establish clinically meaningful cut-offs and to determine whether modulating TyG-related indices can effectively lower IBS incidence.
The main novelty of this study is to first shed the light on the association between IR and IBS risk, with the well-designed prospective cohort of a median follow up of 14.6 years after adjusting multiple important lifestyle and psychological confounders, which provide a robust temporal framework and reduce the risk of bias. The large sample size allowed various subgroup analyses available with sufficient statistical power, and the results were all consistent. Furthermore, all TyG-related indices (TyG, TyG-WC, TyG-WHtR, and TyG-BMI), either in quartiles or per SD change, were thoroughly examined, with similar findings.
Nevertheless, several limitations existed. First, since some IBS patients may not seek medical consultation, potential underdiagnosis may occur based on the ICD-10 codes. However, ICD-10 codes were consistently employed to diagnose IBS during baseline and follow-up period. Meanwhile, we also incorporated the Rome III criteria from DHQ data to further conduct several sensitivity analyses, and the results remained consistent. Second, TyG-related indices were measured only at baseline, which prevented us from further investigating the dynamic changes of TyG indices with IBS risks. Third, despite our measurement of many potential confounders, residual confounding may still exist owing to the nature of observational design. Fourth, the association between TyG-related indices and the development of different IBS subtypes could not be further investigated due to the unavailability of such data. Finally, due to the predominant White ethnicity and relatively older populations in our study, generalizability of our findings to other ethnicities with different age should be with caution. Future prospective cohort studies in populations with diverse ethnicities and age groups are warranted to confirm our findings. Moreover, the role of gut microbiota dysbiosis in mediating the association between the TyG index and IBS remains to be elucidated, requiring well-designed animal models and further population-based studies.
Conclusion
In conclusion, in this large-scale, population-based prospective cohort study, we found that higher levels of TyG-related indices (TyG, TyG-BMI, TyG-WC, and TyG-WHtR) were associated with an increased risk of incident IBS. Although causality cannot be inferred owing to the observational nature, these findings prioritize the importance of reducing IR in the prevention and management of IBS. Further well-designed epidemiological and experimental studies are warranted to validate our findings and elucidate underlying mechanisms.
Supplemental Material
sj-docx-1-tag-10.1177_17562848251383796 – Supplemental material for Long-term risk of irritable bowel syndrome associated with triglyceride-glucose related indices: a large-scale prospective cohort study
Supplemental material, sj-docx-1-tag-10.1177_17562848251383796 for Long-term risk of irritable bowel syndrome associated with triglyceride-glucose related indices: a large-scale prospective cohort study by Haorui Liu, Si Liu, Qian Zhang, Shutian Zhang, Shengtao Zhu and Shanshan Wu in Therapeutic Advances in Gastroenterology
Footnotes
References
Supplementary Material
Please find the following supplemental material available below.
For Open Access articles published under a Creative Commons License, all supplemental material carries the same license as the article it is associated with.
For non-Open Access articles published, all supplemental material carries a non-exclusive license, and permission requests for re-use of supplemental material or any part of supplemental material shall be sent directly to the copyright owner as specified in the copyright notice associated with the article.