
Abstract
Background:
Chronic viral hepatitis is a major risk factor for hepatocellular carcinoma (HCC). Though diabetes is another risk of HCC, it remains indeterminant as to whether glycemic burden in individuals with type 2 diabetes (T2D) should be differentially managed according to the presence of chronic hepatitis B virus (HBV) or hepatitis C virus (HCV).
Objectives:
To evaluate the association between glycemic burden and HCC risk in individuals with T2D, stratified by viral hepatitis status, including HBV and HCV.
Design:
Retrospective cohort study.
Methods:
This study analyzed 30,055 individuals with T2D from the Chang Gung Research Database (2009–2016), stratified into non-HBV/non-HCV, HBV, and HCV groups. Glycemic burden was assessed using baseline glycated hemoglobin (HbA1c), high HbA1c variability, and optimal glycemic control, defined as maintaining HbA1c <7% for more than 80% of the follow-up period. Cox proportional hazard models were used to identify HCC risk factors.
Results:
Over a mean follow-up of 6.4 years, 644 individuals (2.14%) developed HCC. Viral hepatitis was the predominant independent risk factor, followed by elevated fibrosis-4 (FIB-4) scores, male sex, older age, low albumin, and low platelet count. Neither baseline HbA1c nor high HbA1c variability was associated with HCC risk in the overall T2D population or stratified groups. However, optimal glycemic control was significantly associated with reduced HCC risk in individuals with HBV (adjusted hazard ratio (HR) = 0.671, 95% confidence interval (CI) = 0.465–0.969, p = 0.033) and demonstrated a potentially beneficial role in non-HBV/non-HCV patients with presumed metabolic dysfunction-associated fatty liver disease (presumed MAFLD; adjusted HR = 0.574, 95% CI: 0.309–1.065, p = 0.079).
Conclusion:
Optimal glycemic control may reduce HCC risk in individuals with T2D and HBV and potentially benefits those with presumed MAFLD, although its role in HCV-related HCC appears limited. These findings highlight the need for tailored glycemic management strategies based on viral hepatitis type.
Plain language summary
Liver cancer, specifically hepatocellular carcinoma (HCC), is a leading cause of cancer-related deaths worldwide. People with type 2 diabetes have a higher risk of developing HCC. This study explored how blood sugar control (glycemic control) affects HCC risk in people with type 2 diabetes and chronic hepatitis B or C infections.
Introduction
Hepatocellular carcinoma (HCC), the most common type of primary liver cancer,1,2 is a major global health concern, ranking sixth in cancer prevalence and third in cancer-related deaths worldwide. 3 Chronic viral hepatitis, particularly hepatitis B virus (HBV) or hepatitis C virus (HCV), accounts for 60%–80% of HCC cases globally.1,2,4,5 In Asia, where HBV infection is highly prevalent, approximately 72.5% of global HCC cases occur.6,7 In contrast, in Western regions, HCV is the primary etiologic factor, accounting for over 60% of HCC cases.8,9
Type 2 diabetes (T2D) has been recognized as an independent risk factor for several malignancies, including HCC. 10 Epidemiologic studies have reported a 2- to 3-fold increased risk of HCC in individuals with T2D.5,7,11,12 Hyperglycemia, a hallmark of diabetes, has been strongly linked to cancer development,13–15 potentially through mechanisms such as oxidative stress, chronic inflammation, hyperinsulinemia, and insulin resistance, which can activate oncogenic pathways. 16
Given the growing global prevalence of T2D, proper glycemic control might represent a modifiable factor in reducing HCC risk among these population, although the association between glycemic burden and HCC risk remains inconclusive. Some studies have reported a positive correlation between baseline glycated hemoglobin (HbA1c) levels and HCC risk,17,18 while others have found no significant association. 19 HbA1c variability has been linked to cancer risk,20,21 but few studies have evaluated its effect on HCC specifically. Previous studies showing the relationship between median or mean HbA1c and HCC risk might follow a U-shaped pattern.12,22
Importantly, the risk of HCC conferred by chronic viral hepatitis is substantially higher than that from diabetes, with a 24-fold increase in risk observed in HBV or HCV carriers compared to a 3-fold increase in individuals with T2D alone. 23 Nevertheless, few studies have systematically examined how glycemic burden impacts HCC risk across different viral hepatitis subtypes within the T2D population.
To address this gap, we conducted a large-scale population-based study to investigate the associations between glycemic burden—including baseline HbA1c, HbA1c variability, and optimal glycemic control—and HCC risk in individuals with T2D, stratified by chronic HBV or HCV infection. Our findings could help inform individualized glycemic management strategies in high-risk populations, especially in regions endemic to chronic viral hepatitis.
Methods
Subjects and data source
This multi-institutional cohort study utilized data from the Chang Gung Research Database, which encompasses records from Chang Gung Memorial Hospital’s three major teaching hospitals located in different regions. The database, established in 2000, includes comprehensive information on inpatient and outpatient records, laboratory results, imaging studies, and pharmacy records. In 2016, the coding system transitioned from the International Classification of Diseases, 9th Revision, Clinical Modification codes (ICD-9-CM) to 10th Revision (ICD-10-CM). The reliability and accuracy of the database coding have been validated in prior studies, ensuring robust data integrity.24–26 To protect patient privacy, hospital identification numbers were encrypted while continuous monitoring was implemented to maintain consistent data encryption. The study received approval from the Institutional Review Board of Linkou Chang Gung Memorial Hospital (approval number: 201700028B0). Informed consent was waived due to the retrospective design and use of de-identified data. The study was conducted and reported in accordance with the Strengthening the Reporting of Observational Studies in Epidemiology (STROBE) guidelines.
Study design
Patients with T2D were identified based on at least two records of diagnosis of T2D diagnosis (ICD-9-CM 250. XX) within 1 year, a method validated with 91.6% sensitivity and 97.2% specificity. 27 The study initially included 125,233 individuals diagnosed with diabetes between January 1, 2009, and December 31, 2013, with follow-up data until HCC diagnosis or December 31, 2016, then, the study population was consecutively selected with the following exclusion criteria applied: subjects younger than 18 years (n = 922), those with type 1 diabetes (n = 596), those with a history of cancer before enrollment (n = 24,203), and those who developed HCC or were lost to follow-up within 1 year of enrollment (n = 307). After exclusions, 99,205 patients with T2D, each with a minimum of 1-year follow-up and at least three HbA1c measurements, were included. Among these, 30,055 individuals with both hepatitis B surface antigen (HBsAg) and hepatitis C virus antibody (HCVAb) test results were categorized into four groups: negative for both HBV and HCV (non-HBV/non-HCV), positive for HBV alone, positive for HCV alone, and positive for both HBV and HCV (HBV/HCV; Figure 1).

Study flow diagram.
In individuals in the non-HBV/non-HCV group, we further defined a subgroup as presumed metabolic dysfunction-associated fatty liver disease (presumed MAFLD) as elevated alanine aminotransferase (ALT) levels (⩾40 IU/mL in men, >31 IU/mL in women) in individuals with T2D and without HBV or HCV infection. 28 While aligned with current MAFLD criteria emphasizing metabolic dysfunction, this definition lacked imaging confirmation and did not exclude alcohol-related or rare liver diseases due to data limitations.
The primary outcome was the incidence of HCC, identified using ICD-9 code 155.0 or ICD-10 code C22.0. Cases of intrahepatic bile duct carcinoma (ICD-9 code 155.1, ICD-10 code C22.1) were explicitly excluded.
Baseline measurement and covariates
Baseline covariates and risk factors included hypertension (ICD-9-codes 401–402 or use of antihypertensive drugs), hyperlipidemia (ICD-9 code 272 or use of statins), chronic kidney disease (ICD-9 code 580–589 or an estimated glomerular filtration rate (eGFR) <60 mL/min/1.73 m2), myocardial infarction (ICD-9-codes 410 and 412), ischemic stroke (ICD-9 codes 433–434, 436, and 852–853), and hemorrhagic stroke (ICD-9 codes 430–432).
Laboratory data included serum creatinine, HbA1c, ALT, aspartate aminotransferase (AST), total bilirubin, albumin, and hemoglobin and platelet counts. The eGFR was calculated using the modification of diet in renal disease study equation: 175 × serum creatinine (exp(1.154)) × age (exp(0.203)) × (0.742 if female), 29 while liver fibrosis was assessed using the Fibrosis-4 (FIB-4) score, calculated as: (age (years) × AST (U/L))/(platelet (109/L) × (ALT (U/L))1/2). 30
In Taiwan, patients with chronic HBV or HCV who meet specific treatment criteria such as high serum HBV viral titers and elevated ALT levels are eligible for National Health Insurance Administration reimbursement for nucleotide analog therapies for HBV and interferon-based therapy with or without ribavirin for HCV.31,32 These therapies are reimbursable for high-risk patients with viral hepatitis, as they face an elevated risk of developing HCC.
Measurements of HbA1c levels during follow-up
All HbA1c values from enrollment until HCC diagnosis or study end data (December 31, 2016) were collected, with each participant having at least three HbA1c measurements. Glycemic variability was assessed using the coefficient of variation (CV) of HbA1c, calculated as the ratio of the standard deviation (SD) to the mean HbA1c, 33 while a threshold CV of HbA1c >11.5% was used to define high variability for dichotomized comparisons that corresponded to the mean CV of HbA1c observed in our study population. Optimal glycemic control criterion was defined as maintaining HbA1c <7% for over 80% of the follow-up period, 34 thereby comprehensively evaluating long-term glycemic control. This definition aligned with that of the American Diabetes Associations. 35
Statistical analyses
Categorical variables were summarized as percentages, continuous variables with normal distribution were presented as means with SD, while those with skewed distributions were expressed as medians with interquartile ranges (IQR) to better reflect their central tendency and dispersion. Baseline characteristics across groups were compared using the Kruskal–Wallis test for continuous variables, followed by Bonferroni post hoc multiple comparisons, or the χ2 test for categorical variables. To assess HCC risk, Cox proportional hazard regression analyses were performed. Variables significantly associated with HCC risk (p < 0.05) in the univariate models were selected for inclusion in the multivariate analysis. To comprehensively evaluate the independent contributions of different glycemic measures, we separately examined baseline HbA1c, HbA1c variability, and optimal glycemic control in relation to HCC risk. By comparing hazard ratios (HRs) across unadjusted, minimally adjusted, and fully adjusted models, we assessed the robustness of associations and explored potential confounding effects. Collinearity among covariates was assessed using the variable inflation factor (VIF), with variables showing VIF ⩾2.5 excluded from final models to ensure model stability. Statistical significance was established at a two-sided p-value of 0.05. All analyses were conducted using IBM SPSS Statistics for Mac version 29 (IBM Corp., Armonk, NY, USA).
Results
Baseline characteristics of the participants
A total of 30,055 individuals with T2D were included in this study, of whom 72.2% were categorized as non-HBV/non-HCV, 14.0% as HBV, 12.2% as HCV, and 1.6% having both HBV and HCV. During a mean follow-up of 6.44 years (SD: ±1.69), 644 (2.14%) subjects were newly diagnosed with HCC, resulting in an incidence rate of 3.2 per 1000 person-years. HCC incidence was 0.9% in non-HBV/non-HCV, 4.5% in HBV, 4.5% in HCV, and 6.7% in HBV/HCV groups, respectively (Figure 1).
Among the participants, 58.6% were male with a mean age of 60.56 years (SD: ±12.39). The mean baseline HbA1c level was 7.30% (IQR: 6.40; 8.80). Over the follow-up period, participants had an average of 17.38 HbA1c measurements (SD: ±10.86; range: 3–106). The median of serial HbA1c level was 7.21% (IQR: 6.56; 8.08), with a median CV of 9.95% (IQR: 6.26; 14.91). Optimal glycemic control was achieved by 9099 patients (30.3%).
The median of FIB-4 score was 1.49 (IQR: 1.00; 2.36), with more than half of the patients (51.2%) having an FIB-4 score ⩾1.45, and 14.3% having an FIB-4 score ⩾3.25, suggesting a high likelihood of advanced fibrosis at baseline. Additionally, presumed MAFLD was identified in 6812 participants (31.4%).
Stratified analysis revealed varying characteristics among the different groups. The non-HBV/non-HCV group exhibited lower ALT levels, total bilirubin levels, FIB-4 score, and HbA1c variability, but higher platelet counts (Table 1). In the HBV group, the patients were younger and predominantly male and had lower chronic kidney disease prevalence and higher hemoglobin and bilirubin levels. Conversely, the HCV group comprised older patients, with a lower proportion of male patients, lower hyperlipidemia rates, higher prevalence of hypertension and chronic kidney disease, and the highest proportion achieving optimal glycemic control. They also exhibited higher HbA1c variability, lower hemoglobin, albumin and ALT levels, and platelet counts, and the highest FIB-4 score.
Baseline characteristics of study subjects stratified by hepatitis B or C infection status.

Definition: Optimal glycemic control: HbA1c values were <7% for >80% of the time during the year. The Kruskal-Wallis test was used for continuous variables, followed by Bonferroni post hoc multiple comparisons.
p < 0.05 versus non-B non-C. **p < 0.05 versus HBV. ***p < 0.05 versus HCV.
ALT, alanine aminotransferase; CV, coefficient of variation; eGFR, estimated glomerular filtration rate; FIB-4, fibrosis-4 score; HbA1c, hemoglobin A1c; HBV, hepatitis B virus; HCV, hepatitis C virus.
Risk factors for HCC in the overall T2D population
Supplemental Table 1 presents the factors associated with HCC risk in the overall T2D population based on univariate analysis. These factors were subsequently included in multivariable models, with the adjusted results illustrated in Figure 2. The significant risk factors included increasing age (adjusted hazard ratio (aHR) = 1.020, 95% confidence interval (CI) = 1.012–1.028, p < 0.001) and male sex (aHR = 1.351; 95% CI, 1.134–1.610, p = 0.001). A higher FIB-4 score (⩾1.45) was also associated with a markedly increased risk of HCC (aHR = 2.020, 95% CI = 1.544–2.642, p < 0.001). In contrast, lower serum levels of albumin (aHR = 0.782, 95% CI = 0.698–0.876, p < 0.001) and platelet counts (aHR = 0.993, 95% CI = 0.992–0.995, p < 0.001) were associated with HCC risk.

Risk factors of hepatocellular carcinoma in study population using adjusted Cox proportional hazard model.
Viral hepatitis was also a significant determinant of HCC risk, with patients with HBV showing a 2.7-fold increased risk (aHR = 2.736, 95% CI = 2.129–3.517, p < 0.001), and those with HCV displaying a 3.6-fold increased risk (HR = 3.658, 95% CI = 2.948–4.538, p < 0.001). In contrast, serum levels of ALT and hemoglobin were not found to be significantly associated with HCC risk in this study.
Individuals receiving antiviral therapy for HBV (aHR = 2.720, 95% CI = 2.087–3.544, p < 0.001) or interferon and/or ribavirin for HCV (aHR = 1.833, 95% CI = 1.410–2.383, p < 0.001) were found to have a higher risk of HCC compared to those not receiving such treatment.
Despite the strong association between viral hepatitis and HCC, glycemic burden was not significantly associated with HCC risk in the overall T2D population. Neither baseline HbA1c levels (aHR = 0.982, 95% CI = 0.939–1.028), high glycemic variability (aHR = 0.840, 95% CI = 0.701–1.007) nor achieving optimal glycemic control (aHR = 0.901, 95% CI = 0.745–1.090) showed significant associations. Additional Cox regression including a quadratic term (baseline HbA1c²), showing a marginally non-significant trend (p = 0.067) suggested potential nonlinearity (data not shown).
Impact of glycemic burden on HCC risk in viral hepatitis groups
Supplemental Table 2 presents unadjusted and four progressively adjusted Cox regression models—from minimal to full adjustment—evaluating the association between glycemic burden and HCC risk, stratified by viral hepatitis groups. The fully adjusted results are illustrated in Figure 3, highlighting group-specific associations between glycemic burden and HCC risk. Consistent with findings in the overall T2D population, no significant associations were observed across all glycemic burden variables in the non-HBV/non-HCV group (aHR = 0.772, 95% CI: 0.539–1.105, p = 0.157). Notably, optimal glycemic control was significantly associated with reduced HCC risk in the HBV group (aHR = 0.671, 95% CI = 0.465–0.969, p = 0.033), whereas no significant association was seen in the HCV group (aHR = 1.150, 95% CI = 0.845–1.564, p = 0.374). Figure 4(a)–(d) illustrates the cumulative incidence of HCC in subjects with T2D, comparing those with optimal glycemic control to those with suboptimal control across various viral hepatitis groups. The plots show that while glycemic control had a limited effect in non-HBV/non-HCV and HCV patients, it was significantly beneficial in patients with chronic HBV infection.
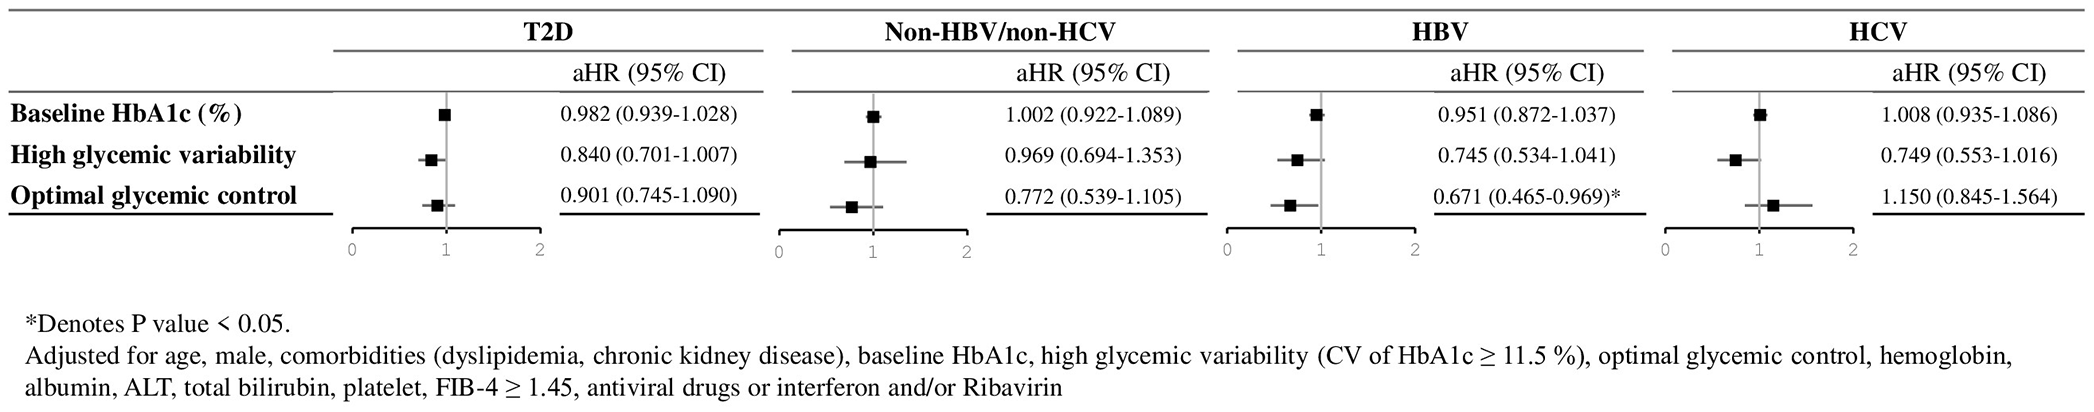
Fully adjusted hazard ratios for hepatocellular carcinoma risk associated with glycemic burden parameters in individuals with type 2 diabetes, stratified by viral hepatitis status (non-HBV/non-HCV, HBV, HCV, and HBV/HCV).

Cumulative incidence of hepatocellular carcinoma in individuals with and without optimal glycemic control. (a) Individuals with type 2 diabetes mellitus. (b) Individuals without HBV or HCV infection (non-HBV/non-HCV). (c) Individuals with chronic HBV infection. (d) Individuals with chronic HCV infection.
Resumed MAFLD subgroup analysis
We further explored the non-HBV/non-HCV group by stratifying individuals according to the presence of resumed MAFLD (Figure 5). Among those with resumed MAFLD, optimal glycemic control was associated with a 43% reduction in HCC risk (aHR = 0.574, 95% CI = 0.309–1.065, p = 0.079), although this result was not statistically significant. In contrast, this protective effect was not observed in patients without resumed MAFLD (aHR = 0.943, 95% CI = 0.597–1.490, p = 0.802; data not shown).

Cumulative incidence of hepatocellular carcinoma in individuals with presumed MAFLD, comparing those with and without optimal glycemic control.
Discussion
To the best of our knowledge, this is the first large-scale population study to analyze the association between glycemic burden and HCC risk in individuals with T2D, with stratification by chronic HBV and HCV status. These findings highlight the dominant influence of viral hepatitis—either HBV or HCV—on HCC development and reveal important differential associations between glycemic control and HCC risk depending on viral serostatus. Optimal glycemic control, defined as HbA1c <7% for >80% of the follow-up period, was significantly associated with a reduced HCC risk in individuals with HBV infection and showed a borderline trend toward benefit in the non-HBV/non-HCV group. In contrast, baseline HbA1c levels and high HbA1c variability were not associated with HCC risk in any groups. Of note, optimal glycemic control did not demonstrate any benefit in subjects with HCV.
The risk factors for HCC identified in this study including age, male sex, lower albumin levels, lower platelet counts, and a FIB-4 score ⩾1.45 are consistent with a previous study. 36 Among all predictors, viral hepatitis emerged as the most significant risk factor, outweighing all other variables. Similar observations have been documented in earlier studies1,23 emphasizing the critical importance of stratifying individuals by HBV and HCV serostatus when evaluating risk factors for HCC, particularly in regions where viral hepatitis is endemic.
The strong effect of HBV on HCC risk aligns with the current literature. In our cohort, HBV infection conferred a 2.7-fold increased risk of HCC, independent of glycemic burden and liver fibrosis. HBV is DNA virus capable of integrating into the host genome and driving carcinogenesis via multiple mechanisms, including inflammation, fibrosis, and metabolic reprogramming,1,37 notably, HBV-associated HCC can occur even in the absence of cirrhosis, accounting for a significant proportion of HCC cases in regions with high prevalence of HBV. 5 Even after HBsAg seroclearance, individuals with T2D and higher average HbA1c levels remain at an elevated risk for HCC. 38 Our findings provide real-world evidence supporting glycemic control as a potentially modifiable factor to HBV-related HCC risk individuals with T2D.
In contrast, optimal glycemic control did not appear to reduce HCC risk in individuals with HCV. This finding differs from the Japanese study by Arase et al., 39 which demonstrated reduced HCC risk among HCV-infected patients with well-controlled diabetes following interferon therapy, although differences in study populations and treatment exposure likely contribute to these discrepancies. HCV, an RNA virus, increases HCC risk mainly through the development of cirrhosis or chronic liver damage rather than genomic integration 1 ; moreover, it disrupts hepatic metabolism, leading to inflammation, steatosis, and fibrosis, as well as alterations in glucose and lipid metabolism. These virus-induced metabolic changes contribute to insulin resistance, diabetes, hepatic steatosis, and hypolipidemia.40–44 Such metabolic disturbances—partially mediated by the direct interaction of HCV proteins with the hepatocyte insulin signal cascade—may attenuate the benefits of glycemic control. 45 Collectively, these findings suggest that individuals with diabetes and HCV infection represent a distinct metabolic group requiring tailored management strategies.
The inconsistent findings in previous studies partly reflect the lack of stratification by viral hepatitis status when examining the impact of glycemic control on HCC risk. Although diabetes increases HCC risk, we did not observe consistent associations between glycemic burden and HCC risk in the overall T2D population, suggesting that glycemic metrics alone might be insufficient for risk prediction without considering underlying viral status.
In contrast, among individuals without viral hepatitis, we observed a trend of reduced HCC risk especially in those with presumed MAFLD who achieved optimal glycemic control, and although this finding did not reach statistical significance, this trend is consistent with prior studies linking high glycemic burden to HCC development in patients with nonalcoholic fatty liver disease. 34 Our results emphasize the relevance of glycemic optimization in subgroups with underlying metabolic liver disease. A recent study also identified diabetes as a key predictor of HCC in individuals without viral hepatitis or cirrhosis, 46 supporting glycemic control as a modifiable factor in this high-risk group.
This study has several limitations. Firstly, as a retrospective observational study, its causal inference cannot be established. Secondly, access to viral load data (HBV DNA and HCV RNA) was lacking, limiting our ability to assess disease activity. Thirdly, we did not evaluate the impact of diabetes medications, although some studies have reported that metformin might reduce cancer risk, while insulin or sulfonylurea may have controversial effects.34,47 Fourthly, body mass index was unavailable, which might have affected our assessment of liver disease severity and metabolic confounding; and finally, presumed MAFLD was defined biochemically without imaging or histological confirmation while alcohol-related liver disease could not be excluded, introducing potential misclassification.
Despite these limitations, the study’s strengths include its large sample size, long follow-up duration, and comprehensive stratification by viral hepatitis serostatus. These features provide valuable real-world insights into the relationship between long-term glycemic control and HCC risk in diverse populations.
Conclusion
This study suggests that the association between glycemic burden and HCC risk among individuals with T2D might vary according to underlying viral hepatitis status. Optimal glycemic control was significantly associated with a lower risk of HCC in individuals with HBV infection, with potential benefit in those without viral hepatitis, particularly in the presence of metabolic liver disease. These findings support the hypothesis that tailoring glycemic management strategies to the underlying etiology of liver disease might help inform risk reduction efforts. Enhanced risk stratification and surveillance could be considered for T2D patients with suboptimal glycemic control, especially those with chronic HBV infection or presumed MAFLD.
Supplemental Material
sj-docx-1-tag-10.1177_17562848251356198 – Supplemental material for Association between glycemic control and hepatocellular carcinoma risk in people with type 2 diabetes, stratified by chronic hepatitis B or C infection
Supplemental material, sj-docx-1-tag-10.1177_17562848251356198 for Association between glycemic control and hepatocellular carcinoma risk in people with type 2 diabetes, stratified by chronic hepatitis B or C infection by I-Wen Chen, Chung-Huei Huang, Pi-Hua Liu, Cheng-Wei Lin, Shih-Yuan Hung and Yu-Yao Huang in Therapeutic Advances in Gastroenterology
Supplemental Material
sj-docx-2-tag-10.1177_17562848251356198 – Supplemental material for Association between glycemic control and hepatocellular carcinoma risk in people with type 2 diabetes, stratified by chronic hepatitis B or C infection
Supplemental material, sj-docx-2-tag-10.1177_17562848251356198 for Association between glycemic control and hepatocellular carcinoma risk in people with type 2 diabetes, stratified by chronic hepatitis B or C infection by I-Wen Chen, Chung-Huei Huang, Pi-Hua Liu, Cheng-Wei Lin, Shih-Yuan Hung and Yu-Yao Huang in Therapeutic Advances in Gastroenterology
Supplemental Material
sj-docx-3-tag-10.1177_17562848251356198 – Supplemental material for Association between glycemic control and hepatocellular carcinoma risk in people with type 2 diabetes, stratified by chronic hepatitis B or C infection
Supplemental material, sj-docx-3-tag-10.1177_17562848251356198 for Association between glycemic control and hepatocellular carcinoma risk in people with type 2 diabetes, stratified by chronic hepatitis B or C infection by I-Wen Chen, Chung-Huei Huang, Pi-Hua Liu, Cheng-Wei Lin, Shih-Yuan Hung and Yu-Yao Huang in Therapeutic Advances in Gastroenterology
Footnotes
Appendix
Acknowledgements
The authors would like to express their gratitude to Professor Yun-Fan Liaw, Professor Miau-ju Huang, and Professor Ming-Ling Chang for their invaluable input and scientific advice. Their contributions have greatly enhanced this work.
Declarations
Supplemental material
Supplemental material for this article is available online.
References
Supplementary Material
Please find the following supplemental material available below.
For Open Access articles published under a Creative Commons License, all supplemental material carries the same license as the article it is associated with.
For non-Open Access articles published, all supplemental material carries a non-exclusive license, and permission requests for re-use of supplemental material or any part of supplemental material shall be sent directly to the copyright owner as specified in the copyright notice associated with the article.