
Abstract
Background:
The significance of Kirsten rat sarcoma viral oncogene (KRAS) mutation in colorectal cancer (CRC) is well established; yet, its association with KRAS expression and prognosis warrants further investigation. While high KRAS expression is commonly linked with poorer prognosis in other cancers, its role in CRC remains relatively understudied.
Objective:
To explore the correlation between KRAS expression, KRAS status, prognosis, and tumor-infiltrating T lymphocyte density in CRC.
Design:
Single-center retrospective study.
Methods:
Conducted between 2010 and 2020, this study utilized tumor samples to assess KRAS expression and quantify CD3+/CD8+ T lymphocytes. The Cox proportional hazards model and linear regression analysis were employed to examine the relationship between KRAS expression, prognosis, and tumor-infiltrating T lymphocytes.
Results:
This study included 265 CRC patients who underwent radical surgery. No significant association was observed between KRAS expression and KRAS status (p > 0.05). High KRAS expression was associated with poorer overall survival and disease-free survival (p < 0.05). Subgroup analysis revealed that high KRAS expression remained indicative of a worse prognosis in the group with mismatch repair-deficient (dMMR) and KRAS mutant type (p < 0.05). Multivariate analysis confirmed KRAS expression as an unfavorable prognostic factor (p < 0.05). However, the significance of KRAS expression was lost in the dMMR and KRAS mutant-type group regarding overall survival (p > 0.05). Notably, KRAS expression showed a negative correlation with the density of CD8+ T lymphocytes in tumor tissue (p < 0.05), a finding also observed in the dMMR group (p < 0.05).
Conclusion:
No association was found between KRAS expression and KRAS mutation status in CRC. Higher KRAS expression was indicative of poorer prognosis for CRC patients, except for those with proficient mismatch repair and KRAS wild type. In addition, in patients with dMMR, KRAS expression was associated with a lower density of CD8+ T lymphocytes in tumor tissue.
Plain language summary
1. KRAS gene: A gene that, when mutated, can lead to the development and growth of colorectal cancer. The KRAS gene is part of a family of genes that help control cell growth and death.
2. T lymphocytes: A type of immune cell that plays a crucial role in the body's defense against infections and cancer. They can identify and kill cancer cells.
3. The study found that the level of activity of the KRAS gene in colorectal cancer patients did not change based on whether the KRAS gene was mutated or what type of mutation it had.
4. For patients with a specific type of colorectal cancer (dMMR) and those with mutations in the KRAS gene, high levels of KRAS gene activity were linked to a poorer outlook. Essentially, these patients had a harder time fighting the disease, and KRAS gene activity served as a warning sign for more challenging outcomes.
5. In patients with dMMR colorectal cancer, higher KRAS gene activity was associated with fewer CD8+ T lymphocytes in the tumor. CD8+ T lymphocytes are crucial immune cells that help fight cancer by attacking cancer cells. This means that in these patients, the body's natural defense against the tumor was weaker.
Introduction
Colorectal cancer (CRC), the most prevalent malignancy affecting the gastrointestinal tract, remains a significant contributor to cancer-related mortality. 1 It holds the fourth position in terms of incidence and the second in terms of mortality rate among all cancer types. 2 Although the TNM staging system is widely utilized as the conventional method for predicting prognosis in patients with malignant tumors, the considerable heterogeneity inherent to CRC frequently leads to divergent outcomes, even among individuals with the same stage. Thus, identifying novel therapeutic targets is crucial to enhancing the outcomes of patients with CRC.3,4
In recent years, significant research efforts have focused on the oncogene Kirsten rat sarcoma viral oncogene (KRAS), given its pivotal role in CRC development.5–7 Moreover, the well-established adverse impact of KRAS mutations on patient outcomes highlights that individuals with CRC harboring such mutations often face a less favorable prognosis. 8 High KRAS expression has been consistently associated with poorer prognoses in non-small-cell lung cancer, breast cancer, and oral squamous cancer.9–11 Similarly, in CRC, KRAS expression is frequently regarded as an indicator of an unfavorable prognosis. 12 However, while in non-small-cell lung cancer, KRAS expression correlates with KRAS mutation and copy number, leading to higher expression levels in KRAS mutant patients and an associated inferior prognosis, the relationship between KRAS expression and KRAS status in CRC remains uncertain.13,14
KRAS mutations have been observed to influence the tumor immune microenvironment through various mechanisms, including the stimulation of inflammatory factor secretion (e.g. Interleukin-10 (IL-10) and Transforming growth factor-β (TGF-β), the induction of the conversion of CD4+ T cells into Tregs, and the promotion of tumor growth.15,16 Furthermore, KRAS mutations have been implicated in affecting the infiltration of CD3+ and CD8+ T lymphocytes, both crucial for prognosis evaluation as part of the immunoscore. 17 However, there remains limited understanding regarding the correlation between KRAS expression and the presence of tumor-infiltrating T lymphocytes in CRC. Studies in breast cancer and non-small-cell lung cancer have suggested that higher KRAS expression is associated with a lower density of antitumor cells, such as CD8+ T lymphocytes, and a higher density of pro-tumor cells, such as Tregs and TH17 cells. 9
Hence, the main aim of this investigation is to elucidate the correlation between KRAS expression, KRAS status, prognosis, and the density of tumor-infiltrating T lymphocytes in CRC, utilizing tumor specimens sourced from the Sixth Affiliated Hospital, Sun Yat-sen University in Guangzhou, China.
Methods
Patients and tissue samples
Patients diagnosed with CRC and who received treatment at the Sixth Affiliated Hospital, Sun Yat-sen University in Guangzhou, China, between 2010 and 2020 were enrolled in this study. Only patients who underwent surgery for CRC were included. Patient data were retrieved from the database of the Sixth Affiliated Hospital, Sun Yat-sen University. Exclusion criteria included patients who underwent palliative surgery for CRC at the aforementioned hospital, those diagnosed with stage IV cancer, and individuals with unknown KRAS status and mismatch-repair (MMR) status (Figure 1). All procedures conducted in this study were in accordance with the Declaration of Helsinki and were approved by the Institutional Review Board of the Sixth Affiliated Hospital, Sun Yat-sen University.

Flow chart of study design.
The determination of KRAS mutants and MMR status
KRAS status was assessed using Sanger sequencing. Pathologists determined patients’ MMR status as either mismatch repair-deficient (dMMR) or mismatch repair-proficient (pMMR) through immunohistochemistry (IHC) staining for four DNA MMR proteins (MLH1, MSH2, MSH6, and PMS2).
IHC staining
The tissue samples utilized in this study were obtained from patients who underwent curative surgery at the Sixth Affiliated Hospital, Sun Yat-sen University. The pathology department of the hospital prepared slides from formalin-fixed paraffin-embedded tumor tissues. Experienced pathologists sliced the tumor tissues into 5 mm sections and mounted them on glass slides for IHC staining. We employed the Mouse/Rabbit Polymer Test System Universal kit (ZS-bio), Beijing in China following the manufacturer’s instructions, for the IHC experiments. After baking the glass slides with tumor samples at 60°C for 4 h, the slides were dewaxed using xylene and then hydrated using graded alcohol. Subsequently, antigen retrieval was performed by immersing the slides in ethylenediaminetetraacetic acid. The tumor samples were incubated overnight at 4°C with primary antibodies specific to KRAS, CD3, and CD8. Following this, the slides were treated with an enzyme-labeled anti-goat IgG polymer for 20 min at room temperature. IHC staining was conducted using diaminobenzidine to evaluate the expression of KRAS as well as the number of CD3+/CD8+ T cells.
IHC scoring and CD3+/CD8+ T lymphocyte density
To assess the expression level of KRAS, microscopy was utilized to observe and capture images of the stained slides. The software Image Viewer was employed to accurately determine the expression of KRAS in the tumor region. For a more precise evaluation of KRAS expression, the staining score was determined based on the proportion of positively staining cancer cells and the staining intensity.
The proportion of positively staining cancer cells was categorized into five groups: 0–5% (grade 0), 5–25% (grade 1), 25–50% (grade 2), 50–75% (grade 3), and >75% (grade 4). These groups represented the score corresponding to the proportion of positively staining cancer cells. Meanwhile, the staining intensity was divided into four groups: no positive staining (0), low positive staining (1), medium positive staining (2), and high positive staining (3). The final score for KRAS was calculated as the sum of the products of each staining intensity and its corresponding proportions (Figure 2). Regarding the density of CD3+/CD8+ T cells, evaluation was conducted in both the tumor invasive margin (IM) and tumor parenchyma regions. The density in these regions was determined by counting the number of positively staining cells per tumor sample 18 (Figure 3).

The staining intensity of KRAS expression in the tumor area.

The immunostaining of CD3+/CD8+ T lymphocytes in tumor tissue and invasive margin.
Statistical analysis
Data analysis was carried out using IBM SPSS Statistics version 25.0, IBM, America and GraphPad Prism version 9, GraphPad Software, America. Due to the positively skewed distribution of KRAS expression, the Mann–Whitney U test was utilized to assess the correlation between KRAS expression and KRAS status. Chi-square analysis was employed to investigate the relationship between KRAS expression and clinical data. Survival analysis was conducted using Kaplan–Meier estimation and Cox regression modeling. Statistical significance was set at a predetermined p value of less than 0.05.
The reporting of this study adheres to the Strengthening the Reporting of Observational Studies in Epidemiology statement. 19
Results
Characteristics of patients and expression of KRAS
This study comprised 265 patients who underwent radical resection at the Sixth Affiliated Hospital, Sun Yat-sen University in Guangzhou, China. All patients had clear KRAS status. Collected information encompassed age, gender, carcinoembryonic antigen (CEA) levels, pathological T and N stage, number of harvested lymph nodes, differentiation, venous invasion, perineural invasion, histological type, status of adjuvant therapy, and KRAS status. It is noteworthy that all patients underwent R0 resection.
Correlation between KRAS expression and KRAS status
IHC was utilized to assess KRAS expression in the 265 included patients, with KRAS expression ranging from 0 to 14 (Figure 4). While prior studies have suggested that higher KRAS expression in other cancers is associated with KRAS mutations, our findings indicate no significant correlation between KRAS expression and KRAS status in CRC (p = 0.452). To delve deeper into the potential influence of different KRAS mutation subtypes on expression, patients were categorized into four groups based on their specific KRAS mutation (G12D, G12V, G13D, and Others). However, our data revealed no association between KRAS expression and different mutant subtypes (p = 0.353). These results suggest that KRAS expression does not correlate with KRAS status in CRC.

The relationship between KRAS expression and KRAS status.
Higher KRAS expression indicates an inferior prognosis in CRC patients
To assess the prognostic implications of KRAS expression, patients were stratified into low and high KRAS expression groups based on the IHC staining scores. This categorization was determined using X-tile software analysis, which considered 5-year disease-free survival (Figure 5). The highest cutoff point identified was 6, resulting in 79 (29.8%) patients classified as the low KRAS expression group and 186 (70.2%) patients as the high KRAS expression group.

The cutoff point of KRAS expression.
Subsequently, clinical information was compared between these two groups (Table 1). The age of the 265 patients ranged from 17 to 88, with a median age of 57.54 ± 14.34. Among these patients, 160 were females, while 105 were males. The median follow-up time was 55.46 [95% confidence interval (CI): 54.40–56.52] months, during which 55 patients died. Our analysis revealed that high KRAS expression is significantly correlated with higher rates of detected positive lymph nodes (p = 0.003) and venous invasion (p = 0.025), as well as higher levels of CEA (p = 0.006).
The clinical information of KRAS low expression group and KRAS high group.

CEA, carcinoembryonic antigen; KRAS, Kirsten rat sarcoma viral oncogene; LNs, lymph nodes; MT, mutant type; WT, wild type.
Furthermore, our survival analysis demonstrated that KRAS protein expression was significantly associated with the prognosis of CRC patients (Figure 6). High KRAS expression was linked to an inferior prognosis in terms of both 5-year overall survival (p = 0.0023; 74.2% versus 91.1%) and 5-year disease-free survival (p = 0.0005; 84.8% versus 62.9%). To further validate the prognostic value of KRAS expression, Cox proportional hazards models were employed. Univariate analysis revealed that KRAS expression was significantly associated with prognosis for both 5-year overall survival (p < 0.05, 95% CI: 1.454–7.104) and 5-year disease-free survival (p < 0.05, 95% CI: 1.535–5.236). In the multivariate analysis, high KRAS expression was identified as a risk factor for 5-year overall survival (p < 0.05, 95% CI: 1.023–5.196), independent of lymph node metastasis (Table 2). Similarly, high KRAS expression was found to be an independent risk factor for 5-year disease-free survival (p < 0.05, 95% CI: 1.209–4.256), independent of positive lymph node status (Table 3).

The influence of KRAS expression on overall survival and disease-free survival.
The Cox proportional hazard model of OS for all cases.

CEA, carcinoembryonic antigen; CI, confidence interval; HR, hazard ratio; KRAS, Kirsten rat sarcoma viral oncogene; LNs, lymph nodes; MT, mutant type; OS, overall survival; WT, wild type.
The Cox proportional hazard model of DFS for all cases.

CEA, carcinoembryonic antigen; CI, confidence interval; DFS, disease-free survival; HR, hazard ratio; KRAS, Kirsten rat sarcoma viral oncogene; LNs, lymph nodes; MT, mutant type; WT, wild type.
Recent meta-analysis findings suggested that KRAS mutant patients exhibited poorer survival specifically in the context of Microsatellite Stable (MSS) status. 8 Consequently, we divided patients into dMMR and pMMR groups. In the dMMR group, high KRAS expression was associated with poor prognosis in both 5-year overall survival (p = 0.0062; 73.5% versus 92.5%) and 5-year disease-free survival (p = 0.0026; 60.2% versus 84.9%) (Figure 6). In univariate analysis, high KRAS expression was identified as a risk factor for 5-year overall survival (p = 0.011, 95% CI: 1.326–10.984) and 5-year disease-free survival (p = 0.004, 95% CI: 1.416–6.378). However, in multivariate analysis, KRAS expression lost its significance for 5-year overall survival (p = 0.096, 95% CI: 0.851–7.378) (Table 4), but it remained a risk factor for 5-year disease-free survival (p = 0.034, 95% CI: 1.066–4.895) (Table 5). By contrast, in the pMMR group, high KRAS expression was not associated with a worse outcome for both 5-year overall survival (p > 0.05) and 5-year disease-free survival (p > 0.05) (Supplemental Figure S1).
The Cox proportional hazard model of OS for dMMR cases.
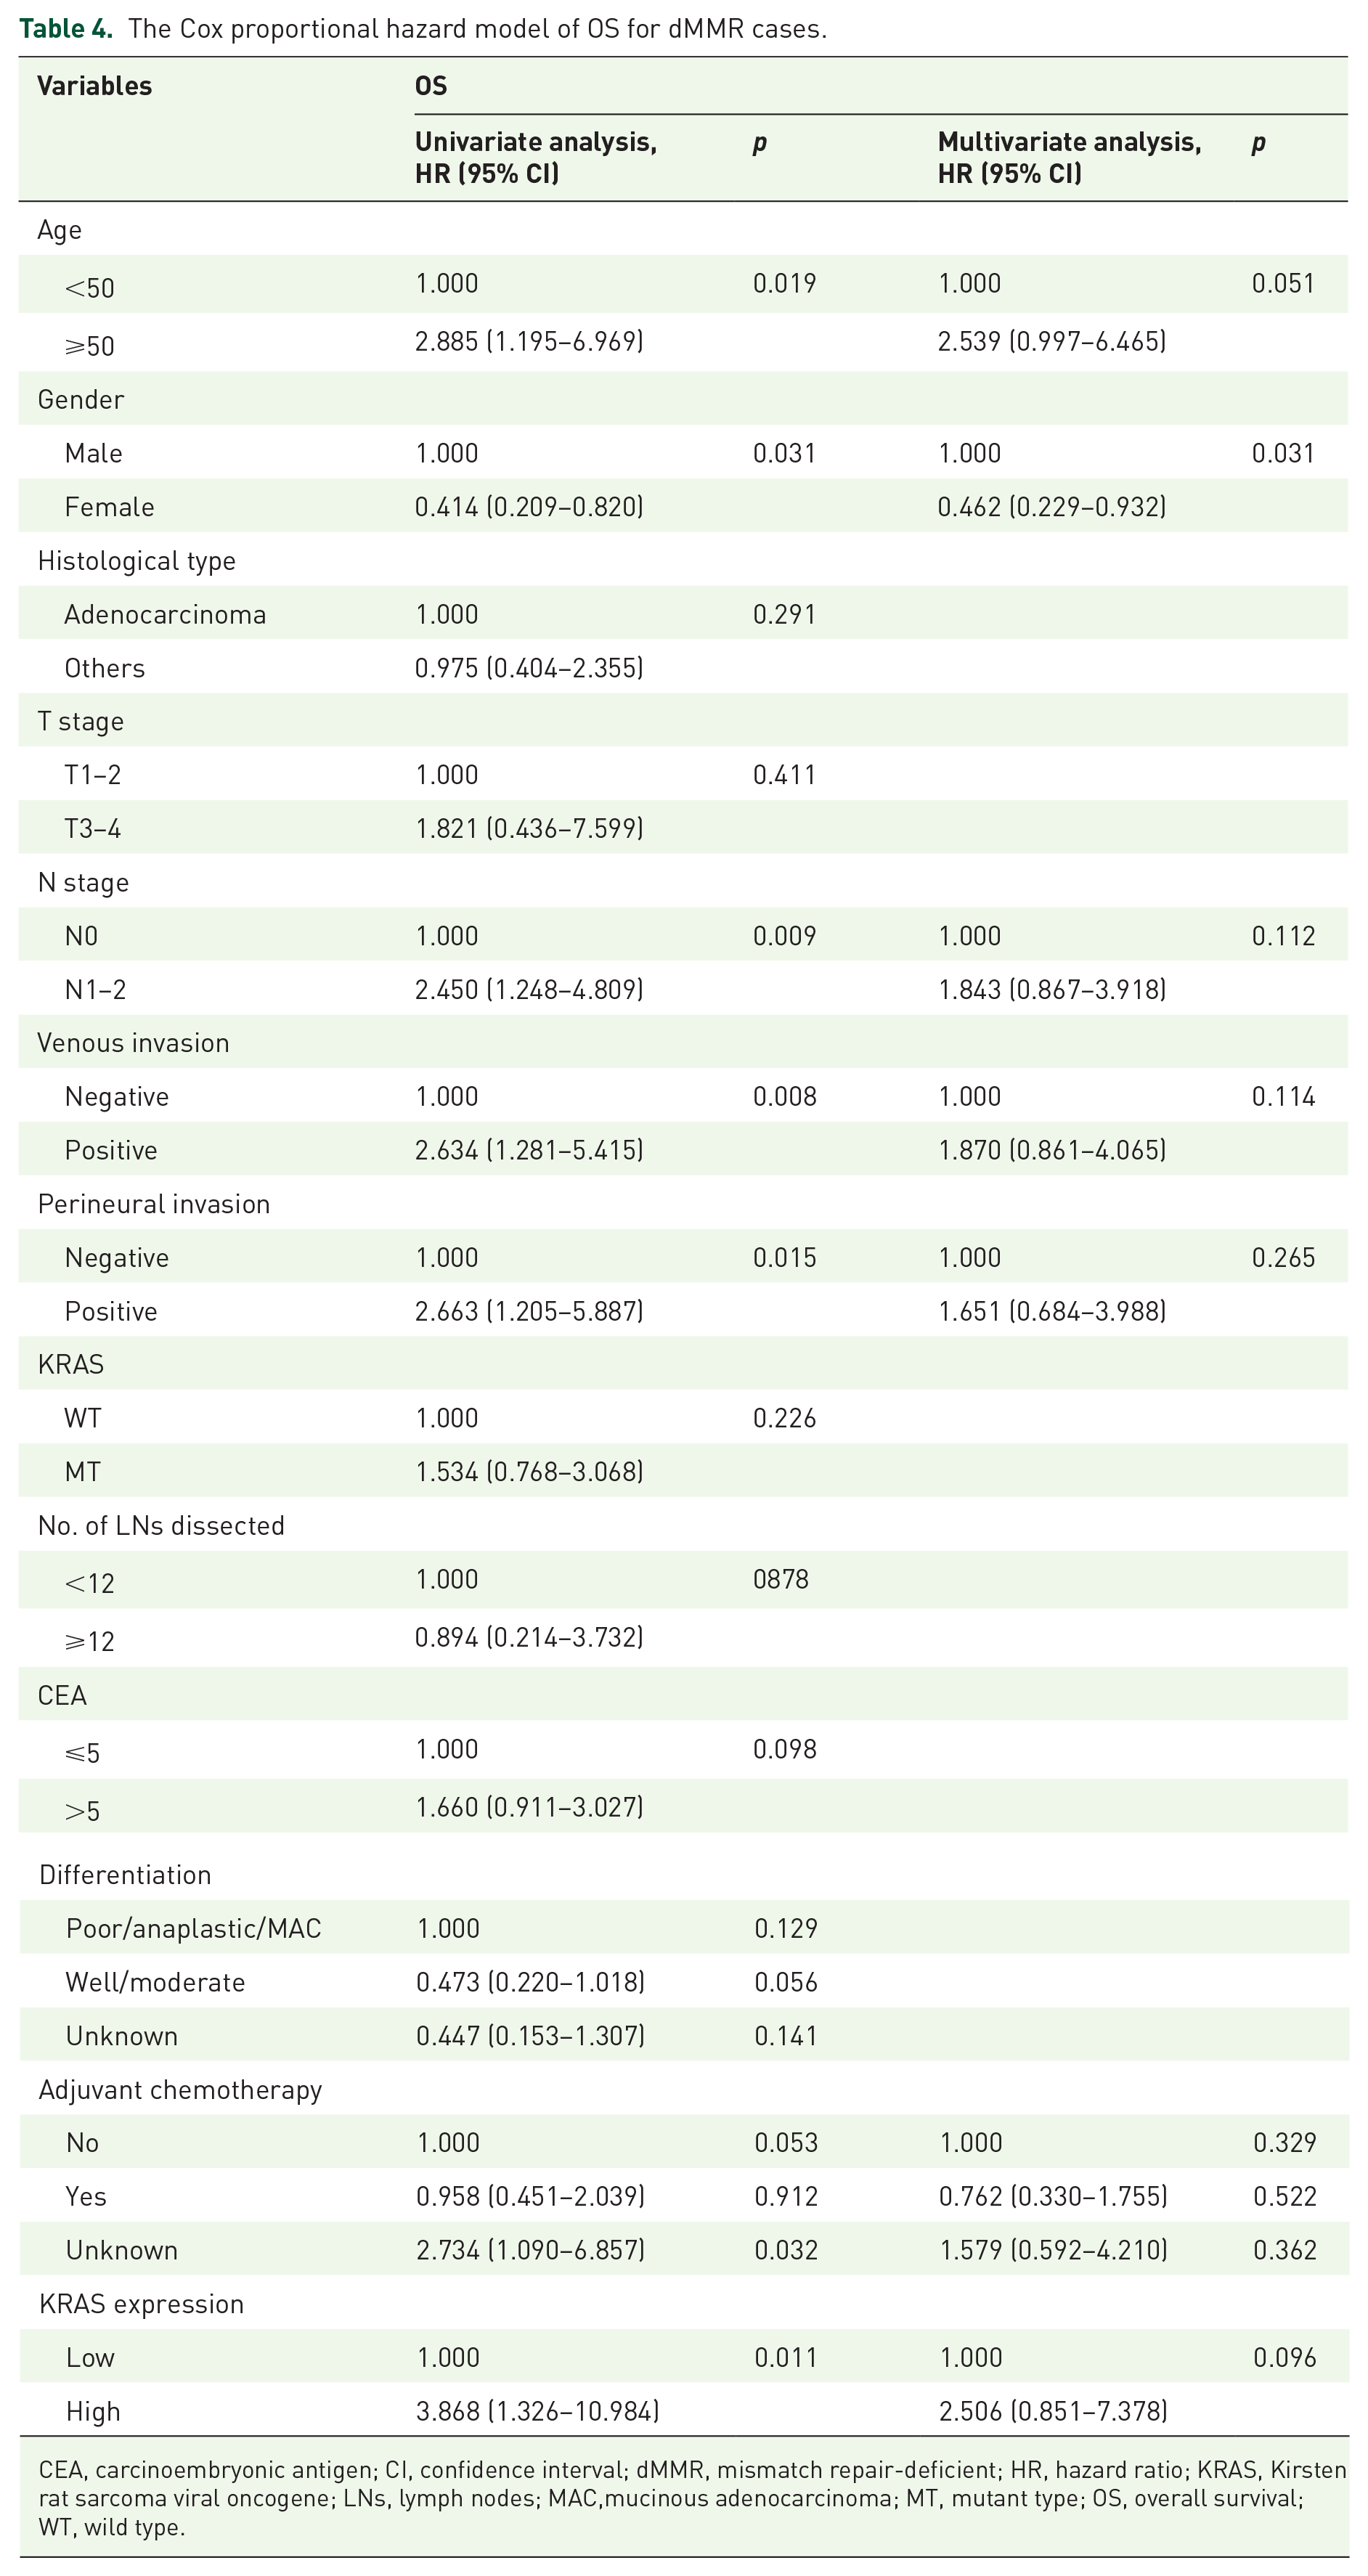
CEA, carcinoembryonic antigen; CI, confidence interval; dMMR, mismatch repair-deficient; HR, hazard ratio; KRAS, Kirsten rat sarcoma viral oncogene; LNs, lymph nodes; MAC,mucinous adenocarcinoma; MT, mutant type; OS, overall survival; WT, wild type.
The Cox proportional hazard model of DFS for dMMR cases.

CEA, carcinoembryonic antigen; CI, confidence interval; DFS, disease-free survival; dMMR, mismatch repair-deficient; HR, hazard ratio; KRAS, Kirsten rat sarcoma viral oncogene; LNs, lymph nodes; MT, mutant type; WT, wild type.
To further explore whether the relationship between KRAS expression and outcome varies across different KRAS statuses, we categorized the cases into wild-type and mutant-type groups. Based on our analysis, in KRAS mutant cases, KRAS expression was associated with a poorer outcome for both 5-year overall survival (p = 0.0150; 73.8% versus 96.4%) and 5-year disease-free survival (p = 0.0134; 59.5% versus 85.7%) (Figure 6). In univariate analysis, KRAS expression was identified as a risk factor for both 5-year overall survival (p = 0.041, 95% CI: 1.087–59.823) and 5-year disease-free survival (p = 0.020, 95% CI: 1.213–9.636) (Table 6). However, in multivariate analysis, KRAS expression was found to be an independent hazard factor only for 5-year disease-free survival (p = 0.025, 95% CI: 1.158–9.319) (Table 7). Although in KRAS wild-type patients, high KRAS expression was associated with a worse outcome, in multivariate analysis, high KRAS expression was not identified as an independent high-risk factor for 5-year overall survival (p > 0.05) (Supplemental Table S1) or 5-year disease-free survival (p > 0.05) (Supplemental Table S2). These results suggest that high expression may predict a worse outcome for patients, especially for those with dMMR and KRAS mutant status.
The Cox proportional hazard model of OS for KRAS mutant cases.

CEA, carcinoembryonic antigen; CI, confidence interval; HR, hazard ratio; KRAS, Kirsten rat sarcoma viral oncogene; LNs, lymph nodes; OS, overall survival.
The Cox proportional hazard model of DFS for KRAS mutant cases.

CEA, carcinoembryonic antigen; CI, confidence interval; DFS, disease-free survival; HR, hazard ratio; KRAS, Kirsten rat sarcoma viral oncogene; LNs, lymph nodes.
KRAS expression was negatively correlated with the number of infiltrating CD8+ T lymphocytes in the tumor area
The relationship between KRAS expression and tumor-infiltrating T lymphocytes in CRC remains ambiguous according to previous studies.20–22 To further investigate this correlation, we assessed the protein expression of KRAS and quantified the number of CD3+ and CD8+ T cells within the tumor tissue and its IM (Figure 3). Linear regression analysis was conducted to evaluate the association between KRAS expression and tumor-infiltrating T lymphocytes. Our findings revealed a negative correlation between KRAS expression and the density of CD8+ T lymphocytes in the tumor tissue. Notably, a statistically significant decrease in the amount of CD8+ T lymphocytes was observed in the tumor area as KRAS expression increased (p = 0.048). However, no statistically significant difference was observed for the density of CD3+ T lymphocytes in the tumor tissue or CD3+/CD8+ T lymphocytes in the tumor IM (Figure 7). We further explored this correlation in two subgroups and found similar conclusions in dMMR patients (refer to Figure 7). In dMMR patients, KRAS expression was also negatively associated with the density of CD8+ T lymphocytes in the tumor tissue (p = 0.017). However, we did not observe this phenomenon in KRAS mutant-type patients (Supplemental Figure S2).

The correlation between KRAS expression and tumor-infiltrating CD3+/CD8+ T lymphocytes.
These results suggest that in dMMR patients, high KRAS expression is negatively correlated with CD8+ T lymphocytes in the tumor area, and this correlation is not associated with KRAS status.
Discussion
The KRAS gene plays a pivotal role in the development of CRC and is frequently associated with poor prognosis and resistance to EGFR inhibitors.8,23–25 Specifically, mutations in KRAS at codons 12 and 13, such as G12D, G12V, and G13D, have been linked to different prognostic outcomes. As a small GTPase, the KRAS protein can switch between an inactive state when bound to GDP and an activated state when bound to GTP.6,26–30 Amino acid mutations, including those found in KRAS, result in sustained activation of downstream signaling pathways, thereby contributing to tumor progression.7,31–37 While KRAS inhibitors have shown promise in treating KRAS mutant patients, the role of KRAS expression in CRC has not been extensively studied previously.
Indeed, the prognostic role of KRAS mutational status in non-metastatic CRC has been contradictory. Some studies have suggested that KRAS mutation serves as a prognostic factor in non-metastatic CRC,38,39 while many others have shown that KRAS mutation has no impact on survival outcomes for CRC.40–42 However, the reasons underlying this phenomenon have not been clear. Previous studies did not consider KRAS expression as a factor for patients with KRAS mutation. Our study may help to explain the conflicting results observed in this research. In our study, among KRAS mutational patients, high KRAS expression was associated with a worse outcome, whereas KRAS mutational patients with low KRAS expression did not exhibit this association.
In fact, high KRAS expression is commonly considered a marker indicating poorer survival in various cancers, including CRC.9,12 In our study, we observed that high KRAS expression is associated with an inferior prognosis in CRC patients, consistent with previous reports. Cox proportional hazards regression analysis further supported KRAS expression as a marker indicating a worse prognosis. Importantly, high KRAS expression correlated with decreased survival rates. These findings underscore the significance of KRAS expression as a potential prognostic marker in CRC. Furthermore, our results suggest that KRAS inhibitors could be beneficial in improving disease control rates for KRAS mutant patients. This highlights the potential clinical implications of targeting KRAS expression in the management of CRC.
In CRC, KRAS mutation is frequently linked with a suppressed immune microenvironment.15,20,43 However, there is a notable lack of research on the relationship between KRAS expression and the immune microenvironment. The density of T cells, which serves as a crucial indicator for assessing immune status and predicting prognosis and immune therapy efficacy in CRC, has not been extensively studied in relation to KRAS expression.17,44,45 Our study revealed a negative correlation between KRAS expression and the density of CD8+ T cells in the tumor area. This suggests that irrespective of KRAS mutation status, decreased levels of CD8+ T lymphocytes, and inferior immune therapy outcomes may be directly associated with KRAS expression and contribute to a worse prognosis.
However, our study has some limitations. First, it was a retrospective study, which may be considered less reliable than prospective studies and randomized controlled trials. Second, the number of dMMR patients in our cohort may not be very enough. In dMMR patients, KRAS expression lost its value in predicting prognosis for overall survival. Third, some data on adjuvant chemotherapy were missing, potentially affecting the significance of the unknown group in univariate and multivariate analyses. Therefore, further experiments are warranted to validate this finding.
The identification of this association underscores the urgent need for exploration of KRAS inhibitors and the potential combination of KRAS inhibitors with immune checkpoint inhibitors, which may offer promising therapeutic strategies for CRC patients.
Supplemental Material
sj-docx-1-tag-10.1177_17562848241249387 – Supplemental material for The relationship of KRAS expression with KRAS status, prognosis, and tumor-infiltrated T lymphocytes in colorectal cancer
Supplemental material, sj-docx-1-tag-10.1177_17562848241249387 for The relationship of KRAS expression with KRAS status, prognosis, and tumor-infiltrated T lymphocytes in colorectal cancer by Yebohao Zhou, Ziwei Zeng, Ze Li, Lei Ruan, Hao Xie, Fujin Ye, Liang Huang, Huashan Liu and Liang Kang in Therapeutic Advances in Gastroenterology
Footnotes
References
Supplementary Material
Please find the following supplemental material available below.
For Open Access articles published under a Creative Commons License, all supplemental material carries the same license as the article it is associated with.
For non-Open Access articles published, all supplemental material carries a non-exclusive license, and permission requests for re-use of supplemental material or any part of supplemental material shall be sent directly to the copyright owner as specified in the copyright notice associated with the article.