
Abstract
Background:
Gastric cancer (GC) is one of the common and fatal cancers. Even though the Tumor, Node, Metastasis (TNM) staging system is the most classical staging system recognized worldwide, it has been controversial because there are various factors affecting the prognosis of GC patients.
Objectives:
The study aims to evaluate the relationship between interleukin-6 (IL-6) and several clinical indicators and construct a prognostic model to better predict the prognosis of GC.
Design:
A retrospective study.
Methods:
Data of 249 patients with GC diagnosed in GC center of West China Hospital were collected. Clinicopathological characteristics were analyzed to determine whether there were differences between IL-6 HIGH group and IL-6 LOW group. Besides, the association between the two groups and tumor marker levels was clarified. The K-M curves of 3- and 5-year were plotted with log-rank test. Afterward, we conducted univariate and multivariate analysis and a predicting nomogram. Significantly, C-index, and calibration were used to evaluate the value of nomogram in predicting prognosis.
Results:
The overall survival of GC in the IL-6 HIGH and IL-6 LOW groups were 47.8 months (95% CI: 42.1–53.4) and 57.9 months (95% CI: 54.1–61.7), respectively, with significant differences (p = 0.0046). Average tumor size of GC (p = 0.000) and nerve invasion (p = 0.018) were statistically significant between two groups. Multivariate analysis revealed that the factors affecting prognosis were IL-6 (<5.51 and ⩾5.51 pg/ml) (Hazard Ratio(HR): 1.665, 95% CI: 1.026–2.703, p = 0.039), N stage (HR: 1.336, 95% CI: 1.106–1.615, p = 0.003), and T stage (HR: 1.268, 95% CI: 0.998–1.611, p = 0.052), which were included in the nomogram with a C-index of 0.71. The current data calculated TNM staging C-index was 0.68, and the p-value for the difference between the two models was 0.08. Internal validation revealed that the predicted overall survival did not differ significantly from the actual observed patient survival.
Conclusion:
The differential expression of IL-6 has a tendency to differentiate the prognosis of GC patients. IL-6, N stage, and T stage are independent prognostic factors, and the new survival prognostic model consisting of the above three indicators is better than the classical TNM staging system.
Trial registration:
This study is a retrospective study, which does not require clinical registration.
Introduction
Background
Gastric cancer (GC) is one of the common and fatal cancers. With the continuous improvement of screening technology, more and more patients with early GC are detected in time. 1 Compared to early GC patients, the prognosis of advanced GC is poor. 2 GC has become a serious global health economic burden. 3 The TNM staging system is commonly used to assess the prognosis of patients with GC, which is the most classic staging system recognized worldwide. However, the determination of TNM staging relies on the experience of pathologists, and the retrieving of lymph nodes is also influenced by the sorting level of physicians; in addition, the distant metastases of some patients are difficult to be determined by imaging. 4 All these have limited the clinical use of TNM staging. The inclusion of clinical indicators that can provide more accurate prognostic information of GC on the basis of TNM staging has been longed for by the academic community. Serum indicators are easier to quantify and assess than tumor lymph node or distant metastasis. Therefore, a prognostic model of GC with the participation of serum indicators may be more convenient for clinical use.
Interleukin-6 (IL-6), a 21–28 kDa 4-helix bundle glycoprotein consisting of 184 amino acids, is a cytokine produced by a variety of normal cells such as monocytes, macrophages, and epithelial cells and plays an extremely important role in normal physiological activities such as inflammation, immunity, reproduction, metabolism, and angiogenesis.5–8 Tumor cells can either produce IL-6 or interact with IL-6 in the microenvironment by expressing IL-6 complex receptors, 9 thus contributing to tumor cell occurrence, migration and invasion, cell cycle arrest, evasion of apoptosis, and cell death. 9
Current studies on IL-6 have focused on colorectal cancer, breast cancer, myeloma, and so on. Eldesoky et al. 10 found that IL-6 were closely associated with stage and metastasis in patients with colorectal carcinomatosis. Shinriki et al. 11 found that IL-6 promotes lymph node metastasis in oral mucosal squamous cell carcinoma.
In GC, it has been demonstrated that sustained high level of IL-6 expression is associated with the maintenance of a state of chronic inflammation of the digestive tract, gastritis associated with Helicobacter pylori infection and gastric carcinogenesis.12–15 Su et al. 16 found that IL-6 may activate and enrich macrophages and promote proliferation and invasion of GC.17,18 Meanwhile, IL-6 secreted by tumor-associated fibroblasts may activate the Janus kinase 2/signal transducer and activator of transcription 3 (JAK2/STAT3) pathway or activate the Phosphoinositide 3-kinase/protein kinase B (PI3K/AKT) signaling pathway by inducing Phosphatidylinositol-4,5-bisphosphate 3-kinase catalytic subunit gamma isoform (PIK3-R3) expression after downregulating miR-152, thus promoting proliferation, migration, invasion, Epithelial-Mesenchymal Transition (EMT) transformation, and metastasis of GC.19,20 Ham et al. 21 found that GC resistance to chemotherapeutic agents was also associated with high levels of IL-6 by cancer-associated fibroblasts. Laurino et al. 22 found that high levels of IL-6 are closely associated with the development of cisplatin resistance. IL-6 can promote the survival, proliferation, and invasive capabilities of GC cells by activating the STAT3 signaling pathway. The IL-6/STAT3 axis affects the sensitivity of GC cells to cisplatin through molecular mechanisms such as suppressing the expression of apoptosis-regulating factors, promoting the expression of DNA repair-related genes, altering the expression of cell cycle-related genes, and regulating changes in stem cell markers.
Objectives
Although experiments have confirmed the possible role of IL-6 in gastric carcinogenesis and development, the value of IL-6 in predicting patient prognosis remains unclear, because no studies have included IL-6 into the clinical prognostic model of GC. The clinical application potential of IL-6 has not been fully evaluated and exploited. We aimed to construct a prognostic model with high calibration and better distinction than classical TNM staging. First, clinicopathological characteristics recorded in the database were analyzed to determine whether there were differences between IL-6 HIGH group and IL-6 LOW group. Then, the association between the two groups and tumor marker levels was clarified, and the K-M curves of 3- and 5-year were plotted with log-rank test. Afterward, we conducted univariate and multivariate analysis and a predicting nomogram. Significantly, C-index and calibration were used to evaluate the value of nomogram in predicting prognosis of GC patients.
Methods
Study design and data selection
The reporting of this study conforms to the transparent reporting of a multivariable prediction model for individual prognosis or diagnosis (TRIPOD): The TRIPOD statement. 23 Patients with GC who were admitted and treated at the Department of Gastrointestinal Surgery, West China Hospital of Sichuan University from 1 January 2013 to 31 December 2017, were included in this study. Data included in this study are kept in the registration database of the Center of Gastrointestinal Surgery.
Inclusion and exclusion criteria
Patients with GC who were admitted and treated at the Department of Gastrointestinal Surgery, West China Hospital of Sichuan University from 1 January 2013 to 31 December 2017, were included in this study. Inclusion criteria: (1) 18 years ⩽ age ⩽ 80 years; (2) ECOG 0–2 points; (3) no neoadjuvant treatment before operation; (4) postoperative pathology confirmed as GC or adenocarcinoma of the esophagogastric junction; (5) radical laparoscopic or open surgery; (6) distal, proximal or total gastroresection; and (7) the relevant data were complete and followed up.
Exclusion criteria: complicated with (1) other malignant tumors; (2) chronic inflammatory diseases; (3) infectious diseases; (4) autoimmune diseases; (5) receiving hormone or immunosuppressive therapy in the near future; and (6) incomplete survival data.
Data collection and outcomes
The indicators included sex, age, differentiation, Lauren’s classification, TNM stage, tumor maximum diameter, Her2 expression, tumor deposits, vascular invasion, nerve invasion, lymphatic invasion, and IL-6 levels.
Determination of inflammatory factors and tumor markers in serum: Fasting blood (3 ml) was collected at 7:00 on the second day after admission. Serum samples were prepared by differential centrifugation, and the levels of CA724, CA125, CA199, CA153, carcinoembryonic antigen (CEA), Alpha-fetoprotein (AFP), and IL-6 in serum samples were measured by electrochemiluminescence immunoassay. This was measured by the Department of Laboratory, West China Hospital, Sichuan University.
The pathological features (differentiation, Lauren’s classification, TNM stage, tumor maximum diameter, Her2 expression, tumor deposits, vascular invasion, nerve invasion, and lymphatic invasion) were determined according to the postoperative pathological report. This was determined by the Department of Pathology, West China Hospital, Sichuan University, in accordance with the 15th edition of the Japanese Gastric Cancer Management Protocol.
The follow-up information of the patients was collected by the gastroenterologist and volunteers of Sichuan University in a variety of ways twice a year.
Statistical analysis
This is a retrospective study to investigate the correlation between IL-6 and other clinicopathological data and to assess whether IL-6 can be used as an independent prognostic factor for patients with GC. The next was to construct a new clinical prognostic evaluation model for guiding the clinical diagnosis and treatment of GC.
First, we analyzed the correlation between IL-6 and tumor markers. The cutoff values of IL-6 were determined by the maximum selected rank statistic to divide patients into two groups with high and low IL-6 expression, and then, the 3- and 5-year survival rates were calculated and K-M curves were plotted for the two groups. SPSS software developed by IBM Corporation was used to analyze the relationship between the expression of serum IL-6 and other related clinicopathological data in patients with GC. The included clinicopathological data were subjected to univariate analysis, and then, the statistically significant clinical indicators were subjected to multivariate analysis. Nomographs of the 3- and 5-year survival of patients with GC were drawn, and the internal verification of the model was carried out by the bootstrap self-sampling method. Finally, the C-index of the new prognostic model was calculated using R to determine the differentiation of the model and to compare with the TNM staging system to evaluate the clinical predictive value of the new prediction model.
For the quantitative data, if it conformed to a normal distribution, the mean ± standard deviation was used for description and the Pearson test was used for correlation analysis; otherwise, the median (interquartile range) and the Spearman test was used. The Chi-square test was used for the comparison. For count data, the t test was used for intergroup comparisons conforming to a normal distribution; otherwise, the nonparametric test (independent samples Mann–Whitney U test) was used. Differences were considered statistically significant if the two-sided p value was less than 0.05.
The statistical process is completed by SPSS Statistics 21 developed by IBM Corporation or R 4.0.3 statistical software which is an open-source statistical software, in which the description of baseline information is completed by SPSS, and the cutoff value of continuous data is determined by the surv_cutpoint function in the survminer package, which determines the cutoff value according to the maximum selection rank statistics. The survival analysis of the Cox proportional risk model adopted the coxph function. Nomograph and the calibration diagram were drawn using the rms package. The model was compared using the survcomp package.
Results
The relationship between the IL-6 and tumor markers
The serum levels of CA724, CA125, CA199, CA153, CEA, AFP, and IL-6 in all patients were tested for normality. The above data were not in accordance with a normal distribution. Therefore, the Spearman correlation coefficient between IL-6 and other tumor markers was calculated. It was found that only the level of CEA in serum was positively correlated with the level of IL-6 (Spearman correlation coefficient = 0.132, p = 0.037). Serum IL-6 levels were not correlated with CA724 (Spearman correlation coefficient = 0.057, p = 0.370), CA125 (Spearman correlation coefficient = −0.043, p = 0.501), CA199 (Spearman correlation coefficient = −0.016, p = 0.796), CA153 (Spearman correlation coefficient = 0.093, p = 0.142), or AFP (Spearman correlation coefficient = 0.014, p = 0.820) (Table 1).
Analysis of the correlation between IL-6 and other tumor markers.

CEA, carcinoembryonic antigen; IL-6, interleukin-6.
The p value less than 0.05 indicates the difference is statistically significant and should be marked in bold.
The cutoff value of serum IL-6
Using the surv_cutpoint function, the cutoff value of the serum IL-6 level was 5.51 pg/ml (Figure 1 for details).

Cutoff value of IL-6 in 249 GC patients.
The relationship between IL-6 and other pathological data
The average tumor size of GC was 4.00 (2.00–5.00 cm) in the IL-6 low expression group and 5.00 (4.00–6.00 cm) in the IL-6 high expression group (p = 0.000). There was no difference in the distribution of other continuous variables between the two groups of low and high expression of IL-6 (Table 2).
Differences in continuous variables between patients in the IL-6 high group and IL-6 low group.

IL-6, interleukin-6.
The p value less than 0.05 indicates the difference is statistically significant and should be marked in bold.
Among the categorical variables, only average tumor size of GC (p = 0.000) and nerve invasion (p = 0.018) were statistically significant. In the IL-6 low expression group, 93 cases were nerve invasion positive and 72 cases were negative. In the IL-6 high expression group, 34 cases were positive and 50 cases were negative (Table 3).
Differences in categorical variables between patients in the IL-6 high group and IL-6 low group.

The p value less than 0.05 indicates the difference is statistically significant and should be marked in bold.
Survival prognosis of patients with high IL-6 expression and low IL-6 expression
5.51 pg/ml was used to divide the patients into an IL-6 high group and an IL-6 low group. The mean survival time was 54.9 months (95% CI: 51.7–58.2 months), 84 patients in the IL-6 high expression group had an average survival time of 47.8 months (95% CI: 42.1–53.4 months), and 165 patients in the IL-6 low expression group had an average survival time of 57.9 months (95% CI: 54.1–61.7 months). The 3- and 5-year survival rates of patients with low expression of IL-6 were 85.4% and 84.0%, respectively. The 3- and 5-year survival rates of patients with high expression of IL-6 were 65.4% and 55.2%, respectively. The survival prognosis of the two groups was calculated by a K-M curve (p = 0.0046) (Figure 2).
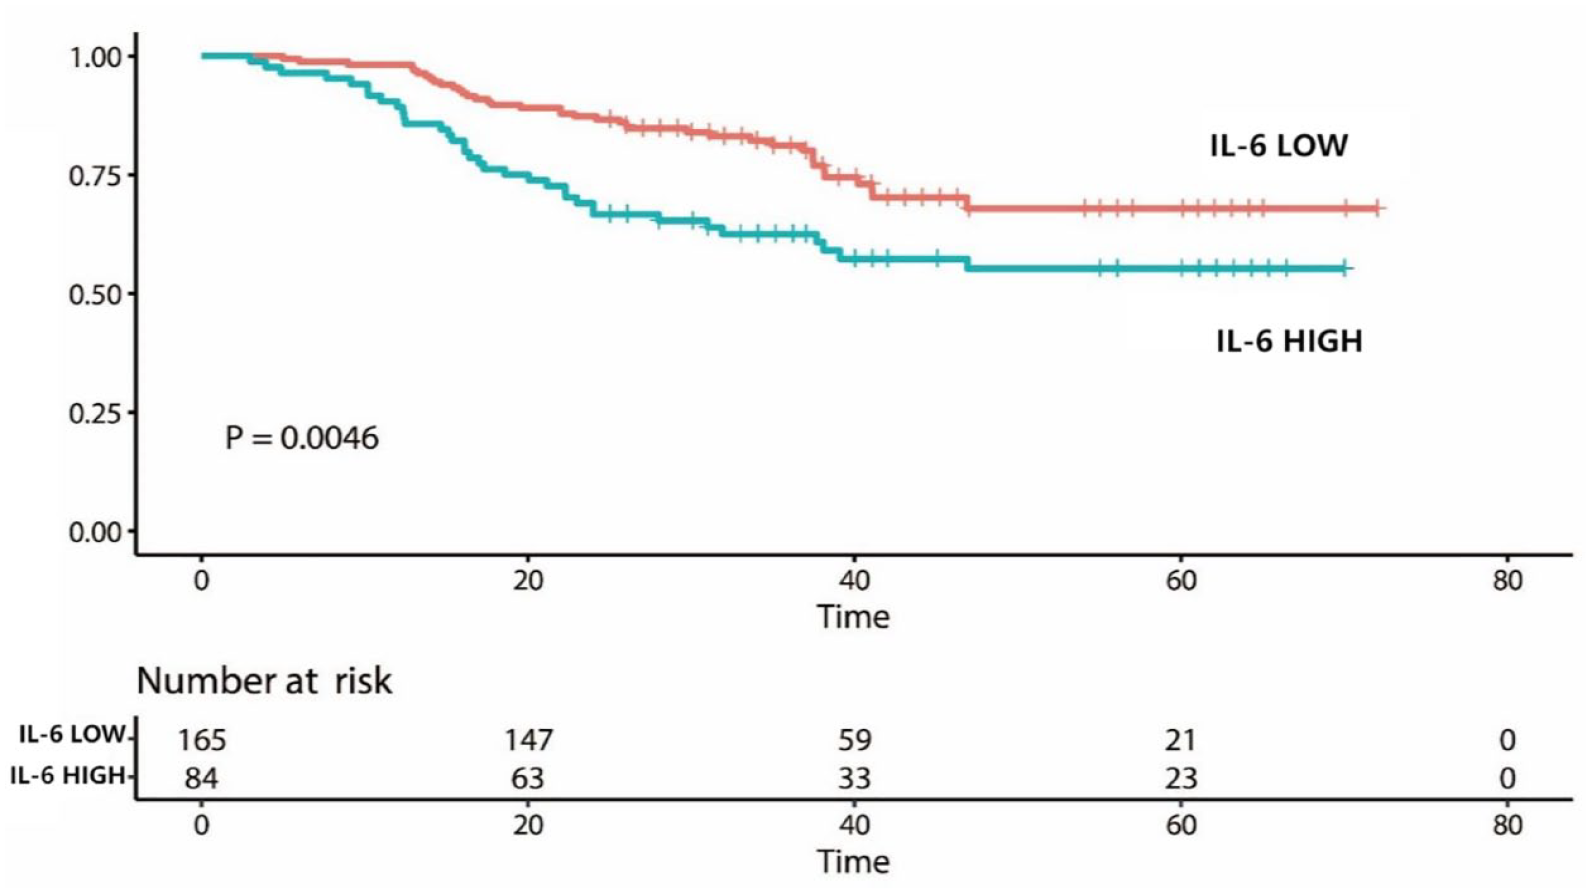
Prognosis in the IL-6 high group and IL-6 low group.
Univariate analysis and multivariate analysis
Univariate analysis showed that IL-6 (<5.51 and ⩾5.51 pg/ml, p = 0.005), maximum diameter of GC (<5 and ⩾5 cm, p = 0.006), T stage (p = 0.000), N stage (p = 0.000), M stage (p = 0.015), TNM stage (p = 0.000), and GC nodules (p ⩽ 0.014) were correlated with survival (Table 4).
Univariate and multivariate analysis of clinicopathological data in patients with GC.
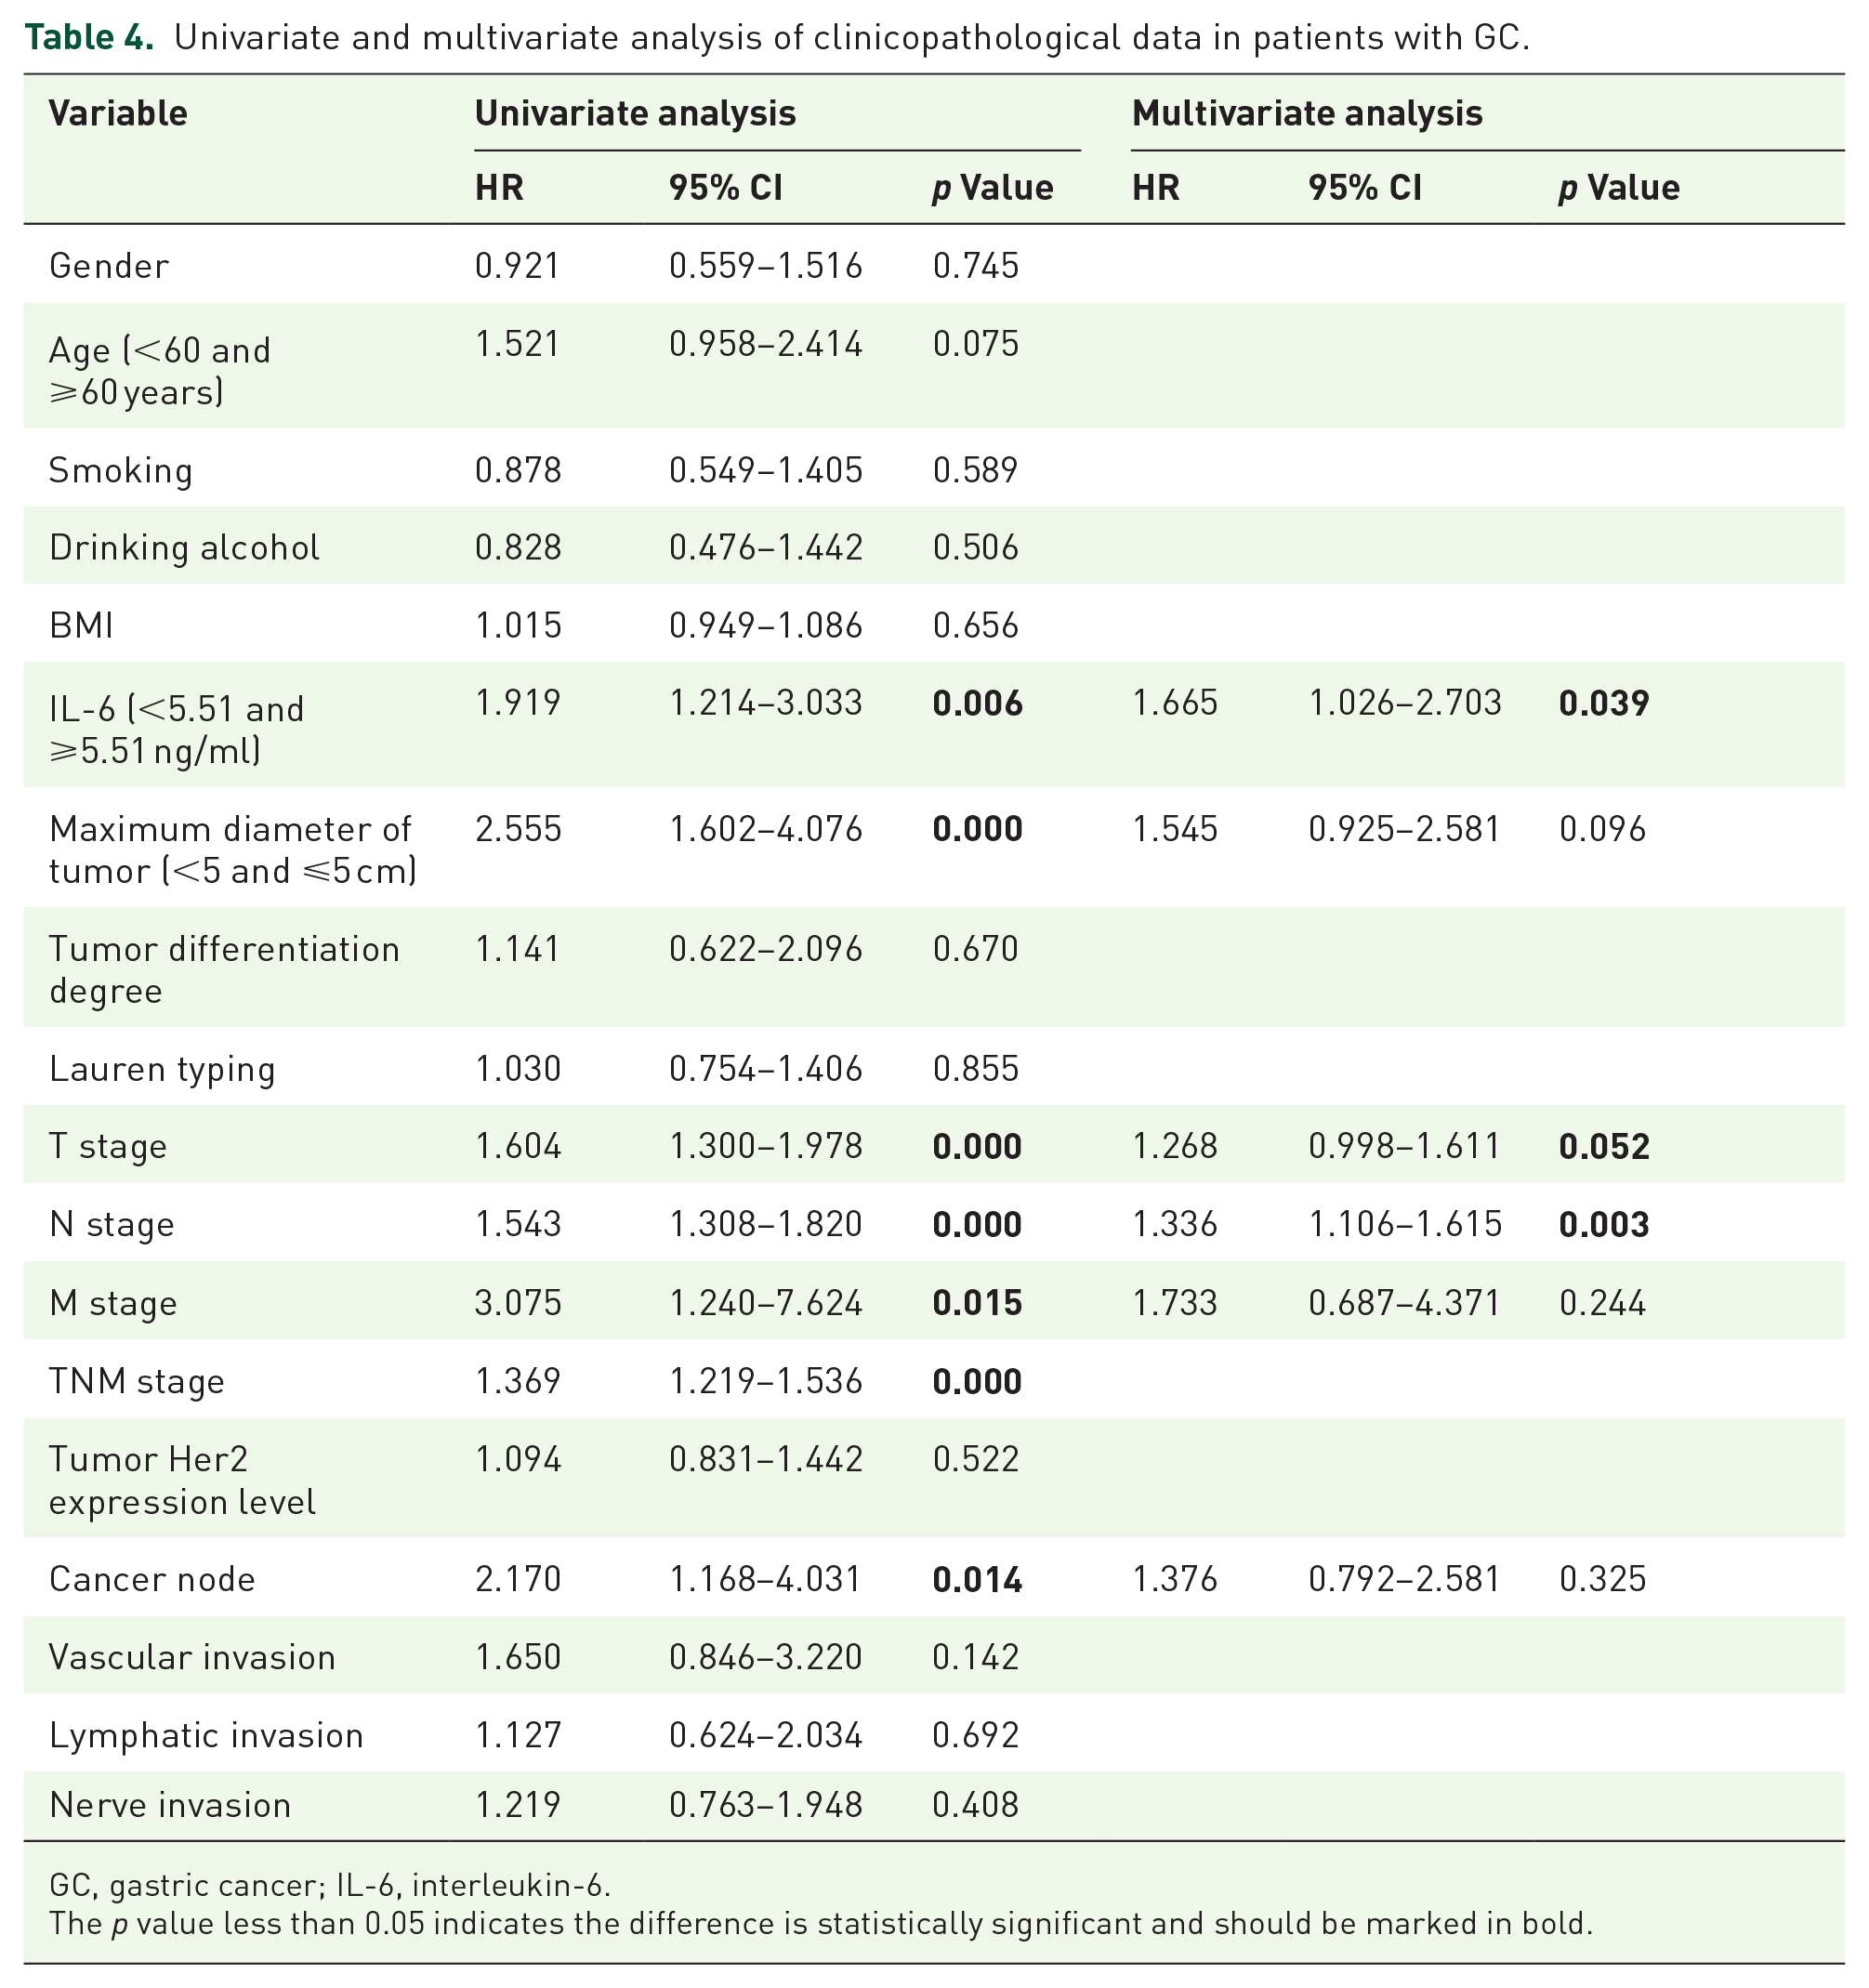
GC, gastric cancer; IL-6, interleukin-6.
The p value less than 0.05 indicates the difference is statistically significant and should be marked in bold.
The statistically significant variables in univariate analysis were included in the multivariate analysis. Although there was a statistical correlation between TNM stage and T stage, N stage, and M stage single substages and prognosis of patients with GC, because of the repetition of the information they covered, we only included T stage, N stage, and M stage single substages in the multivariate analysis. The differences in IL-6 (<5.51 and =5.51 pg/ml) (HR: 1.665, 95% CI: 1.026–2.703, p = 0.039), N stage (HR: 1.336, 95% CI: 1.106–1.615, p = 0.003), and T stage (HR: 1.268, 95% CI: 0.998–1.611, p = 0.052) were statistically significant (Table 4).
Evaluation of model differentiation and drawing of line diagram
According to the results of multivariate analysis, clinical model diagrams of IL-6, T stage, and N stage were drawn. The total score of the line chart was 220 points. Compared with the low-level expression of IL-6, the IL-6 score of high level expression was higher (Figure 3).

Nomograph of the model composed of T stage, N stage, and IL-6.
The C-index of clinical models of IL-6, T stage and N stage was calculated by the coxph function in R language survival, which was equal to 0.71.
Drawing of model calibration diagram
To evaluate the internal validity of the new line diagram, the bootstrap method is used to complete the internal verification. The calibration diagram is drawn by 1000 repeated bootstrap sample corrections in the dataset. The transverse coordinates represent the 3- and 5-year survival probabilities predicted by 1000 resampled bootstrap samples, and the vertical coordinates represent the actual 3- and 5-year survival rates of the patients obtained by Cox proportional risk analysis. The ideal reference line, that is, the perfect match between the prediction probability and the observation probability, is represented by the diagonal line of the dotted line. These six points represent the predicted and observed survival probabilities, and each of the six groups is internally verified. Because the intersection line and the dotted line reference line basically coincide, this study can draw the conclusion that the predicted overall survival rate is not significantly different from that of the observed patients, and the IL-6, T stage, and N stage models evaluate the survival performance of the patients for 3 and 5 years (Figures 4 and 5).

Calibration for predicting the 3-year survival rate of patients with GC by a newly constructed model.

Calibration for predicting the 5-year survival rate of patients with GC by a newly constructed model.
Comparison between new model and classical TNM staging
In this study, T staging, N staging, and M staging were used for multivariate analysis, and the C-index of classical TNM staging was calculated. It was found that the C-index of TNM staging was equal to 0.68. The difference between the new model and the classical TNM staging was compared by using survcomp in R. The results showed that the p value of the two models was equal to 0.08.
Discussion
IL-6 is a kind of multieffect cytokine that is not only indispensable in many important normal physiological activities but is also considered to be closely related to the occurrence and development of inflammation and cancer. IL-6 mainly plays a role through the IL-6/STAT3 signaling pathway, activating the signaling pathway to trigger cascade reactions at multiple downstream targets.
CEA is a classical tumor marker. The preoperative CEA in patients with GC can better predict the prognosis of patients. 24 In addition, a recently published large cohort study confirmed that elevated CEA levels are independent prognostic factors for the recurrence of GC. 25 In their study, it was found that IL-6 and CEA in the serum of patients with GC increased synchronously. For the relationship between IL-6 and CEA, this has not been confirmed in GC patients, but similar results have now been obtained in the colorectal cancer population. Nakagoe et al. 26 published a study stating that there was a significant correlation between the high level of serum IL-6 and the high expression of serum CEA in patients with colorectal cancer before surgery. In addition, Belluco et al. 27 confirmed that the expression of IL-6 and CEA in serum was related to the stage of colorectal cancer, and the high expression of IL-6 and CEA levels indicated that the stage was late. Although the possible molecular mechanism between CEA and IL-6 is unknown, considering that CEA is a recognized classical tumor marker of digestive tract tumors, the findings of this study may confirm the role of IL-6 in GC, and IL-6 may become an important index to evaluate the prognosis of patients with GC.
This study did not serve as the cutoff of serum IL-6 in GC patients according to the laboratory-recommended standard, as there is still controversy about the truncation of IL-6 levels in patients with GC. A study published in 2005 reported that the cutoff value of IL-6 in the serum of patients with GC was 1.97 pg/ml, where sensitivity is 81.8% and specificity is 66.7%. Another study from South Korea whose sensitivity is 85.7% reported that the best diagnostic threshold of serum IL-6 in patients with GC was 6.77 pg/ml. 28 In this study, the cutoff value of IL-6 was calculated as 5.51 pg/ml, and all GC patients were divided into an IL-6 high expression group and an IL-6 low expression group. The K-M curve showed that there was almost no overlap between two groups, and the survival difference between the two groups was significant (p < 0.05). Because the prognosis of patients with different stages of GC is quite different, to evaluate more accurately whether IL-6 can play a good role in distinguishing prognosis for patients with GC of each stage, the data of patients with GC of each stage are distinguished. The study found that IL-6 levels may correspond to prognosis for the two groups of patients, and the prognosis of patients with high IL-6 expression levels was poor. For IIIA and IIIB patients, although there was no significant difference in the prognosis of patients with different IL-6 expression levels after drawing the K-M curves, the two curves had no obvious intersection in the early and middle phases of the study and showed that the survival of patients in the low IL-6 group was better than that in the high IL-6 group. The survival of the two groups did not show a significant difference, which may be due to the small sample size. For stage IIIC GC, the prognosis of patients with high levels of IL-6 was significantly worse than patients with low levels of IL-6 expression. As the study continues and more cases are included, the prognostic value of IL-6 may be more accurately assessed. In univariate analysis, it was found that the prognosis of patients was related to IL-6 level, maximum diameter of tumor, T stage, N stage, M stage, TNM stage, and so on. Further multivariate analysis showed that only T stage, N stage, and IL-6 level were related to the survival of patients with GC, indicating that these three indexes are independent prognostic factors in patients with GC and have an important impact on the survival and prognosis of patients with GC. Existing basic studies have proven that a high level of IL-6 expression is closely related to the poor prognosis of patients with GC. Although there are few studies on IL-6 and GC, it is not difficult to see that IL-6 is closely related to the occurrence, proliferation, and migration of GC from the perspective of both basic experiments and clinical practice.
In this study, T stage, N stage, and serum IL-6 level, which were statistically significant in multivariate analysis, were used to evaluate the prognosis of patients with GC. After internal verification, it was found that the C-index of the model was 0.71, indicating that the model had good discrimination in the current data set. Next, the study continued to use the bootstrap resampling method to draw calibration maps and found that the predicted value of the model was basically consistent with the actual survival value of the patients, indicating that the new model could truly reflect the true prognosis of patients with GC, regardless of whether the 3-year survival rate or the 5-year survival rate was predicted.
In this study, M stage, referring to distant metastasis of GC cells, was not an independent prognostic factor in patients with GC. In TNM stage, M stage is the most important factor affecting the prognosis of patients with GC. Once distant metastasis of GC is found, the clinical stage directly rises to stage IV regardless of the level of T stage and N stage. The reason why M stage was excluded after multivariate Cox survival analysis may be due to the small number of distant metastases of GC in all patients. It is believed that with the expansion of the study sample, the status of M staging in evaluating the prognosis of GC patients will be reflected.
It is sometimes very difficult to determine whether patients have distant metastasis in the clinical diagnose. For early abdominal metastasis or liver metastasis, it is often difficult to find in simple imaging. Some patients need surgical exploration to determine the staging of GC. More easily quantitative serum IL-6 level can be included in the prognosis model of GC, which reduces the difficulty of staging GC and may make patients free from exploratory surgery. Through calculation, it is found that the C-index of the new model constructed with the IL-6 index is 0.71, while that of the classical TNM stage C-index is 0.68. Then, using survcomp in R to compare the discrimination degree between the new model and the classical TNM stage, it is found that the p value of the two models is equal to 0.08. Although there is no significant difference, the division degree of the new model has shown a trend better than that of the classical TNM stage. There was no significant difference in the p value, which may be due to the small sample size. More patients will be included in the follow-up study to further evaluate the prognostic effectiveness of the serum IL-6 level.
This study has some limitations. First, the study was a retrospective study, which is easily affected by many confounding factors. Second, the number of cases included in the study was too small. Finally, the IL-6 included in the study was preoperative measured and postoperative dynamic measurement data were missing for analysis.
Conclusion
Collectively, our study found that there was a positive correlation between IL-6 and serum CEA levels. Further, N stage, M stage, and IL-6 were identified as independent factors affecting the overall survival of patients with GC. Based on these factors, we built a nomogram that can be used to assess the prognosis of individual patients with GC at different sites. Our model has better predictive efficacy than the classical TNM staging system and can help medical workers to individualize the care of patients with GC.