
Abstract
Objective:
i-Scan is a digital image enhancement technology, reported to improve diagnostic performance during endoscopy. Previous studies have investigated the accuracy of i-scan for distinguishing between neoplastic and non-neoplastic colonic polyps and suggested diagnostic accuracy close to that required for use in routine clinical practice. The aim of this study was to perform a meta-analysis of the available literature investigating diagnostic accuracy for i-scan optical diagnosis when made in real time for colorectal polyps <10 mm in size.
Data sources:
The databases of Medline, Embase and the Cochrane Library were searched for relevant studies.
Methods:
A bivariate random effects model was used to produce pooled sensitivity and specificity values, and univariable meta-regression was applied for subgroup analysis.
Results:
The meta-analysis included 15 studies, and diagnosis of 2817 polyps. The area under the hierarchical summary receiver-operating characteristic curve was 0.96. The pooled sensitivity of i-scan optical diagnosis was 0.92 (95% confidence interval 0.85–0.95). The specificity was 0.90 (95% confidence interval 0.83–0.94).
Conclusions:
This meta-analysis updates and summarizes the available evidence concerning the diagnostic performance of i-scan for small colorectal polyps. An acceptable degree of accuracy was found, showing potential to support a ‘resect and discard’ strategy for colonic polyps. There was not found to be a significant difference in diagnostic performance between different clinical settings (i.e. teaching hospitals or general hospitals).
Introduction
Despite progressive advances in detection and treatment, colorectal cancer remains a leading cause of morbidity and mortality in western populations. The majority of colorectal cancers arise from sporadic colonic adenomas, a premalignant and usually asymptomatic condition. Screening colonoscopy therefore offers an opportunity to prevent the development of colorectal cancer, by resection of any polyps which may harbour malignant potential. 1
Current endoscopic practice includes the resection and histological assessment of all detected polyps. However, a high proportion (90%) of detected polyps will be small or diminutive, 2 and many will be hyperplastic rather than adenomatous, so will present minimal risk of developing to malignancy. 3 It is therefore proposed that alternative strategies may be explored, such as ‘resect and discard’ for proximal lesions or ‘diagnose and leave’ in the rectosigmoid, when managing low-risk polyps. 4 The benefits of this approach may include a reduced risk of adverse events, and reduced financial costs associated with colonoscopy, such as histopathology. 5 These alternative strategies require real-time assessment and prediction of polyp histology, and rely on the endoscopist being able to make a confident recognition of low-risk polyps.
The current generation of modern endoscopes and processors produce high-resolution images of the mucosa, allowing detailed examination of lesions. However, white-light endoscopy (WLE) is unable to reliably distinguish between subtle mucosal abnormalities, and consequently chromoendoscopic techniques have been developed to highlight mucosal irregularities; these include traditional dye-spray chromoendoscopy, 6 as well as the modern techniques of autofluorescence imaging 7 and image-enhanced endoscopy (IEE). IEE techniques use either optical filters, (such as narrow-band imaging; NBI) 8 or digital image processing techniques, such as i-scan. 9
It has been suggested that IEE can increase the polyp detection rate, but it is uncertain if it can improve diagnostic classification of a detected polyp, when compared with standard WLE. 10 Previous studies have demonstrated the potential for IEE techniques to allow expert users to follow a ‘resect and discard’ strategy with low-risk colorectal polyps, but when introduced in nonexpert practice, the sensitivity achieved has not supported use in routine practice.11,12 A number of classification systems have been proposed, with the aim of improving diagnostic accuracy. These include the Kudo pit pattern or the NBI international colorectal endoscopic (NICE) classification.13,14
Recent years have seen growing interest in the use of i-scan for real-time prediction of colorectal polyp histology. Previous meta-analyses have suggested that i-scan optical biopsy can achieve a negative predictive value of 96% for diminutive polyps (<5 mm) when applied by experts, compared with 72% for novice endoscopists. 3 In 2013 and 2015, two meta-analyses found that for polyps up to 10 mm, i-scan optical biopsy could achieve sensitivity of 89.3% for adenomatous versus benign histology.15,16 The 2013 analysis did however include studies performed using post-procedure image analysis. We propose to investigate the diagnostic performance of i-scan technology, for polyps <10 mm in size, when applied in real time by all levels of endoscopist.
Methods
Search strategy and study selection
This meta-analysis was conducted in accordance with the Preferred Reporting Items for Systematic Reviews and Meta-Analyses (PRISMA) guidelines. 17 The databases of Medline, Embase, and the Cochrane Library were systematically searched for articles associated with i-scan and colonic polyps, from their dates of inception until June 2018. Studies in Medline were identified with search terms for ‘i-scan’ and ‘digital chromoendoscopy’, as well as the MeSH headings for ‘colonoscopy’, ‘colorectal tumour’, ‘adenomatous polyp’ and ‘polyp’. Studies in Embase were identified using the same search terms and the subject headings for ‘colonoscopy’, ‘colorectal neoplasms’, ‘adenomatous polyps’, and ‘polyps’. Studies in Medline were identified with the terms ‘i-scan’, ‘I scan’, ‘colon polyps’, and ‘colon neoplasms’. The Cochrane Library was searched for any systematic review relevant to our analysis, using the terms ‘i-scan’ and ‘polyp’ (Appendix 1).
Following the initial search, unsuitable articles were excluded based on the title, then the abstract, followed by a detailed textual analysis. The reference lists of review articles and included papers were checked and cross referenced, to avoid missing related studies. Finally, the included studies were reviewed against the inclusion and exclusion criteria.
Inclusion and exclusion criteria
The inclusion criteria were as follows:
Studies that used i-scan to predict a histological diagnosis (neoplastic versus non-neoplastic) for polyps detected during diagnostic colonoscopy.
Studies using histology as the reference standard.
Studies with data available to construct a 2 × 2 contingency table with true positive, true negative, false positive and false negative results.
Studies published or translated into English.
The exclusion criteria were as follows:
Studies designed as a review or meta-analysis.
Studies without complete data for constructing a contingency table.
Studies that included patients with inflammatory bowel disease.
Studies with overlapping data from those already included.
Studies where the diagnostic decision was made after the colonoscopy or from previously-recorded images of polyps, rather than in real time.
Data extraction
The reviewers extracted data from the papers using a standard spreadsheet checklist. The primary data obtained were the diagnostic accuracy, sensitivity and specificity, true positive (TP), false positive (FP), false negative (FN), and true negative (TN) for neoplasia, using histopathology as the reference standard.
Secondary data extracted included, if available; the author, country, and year of publication; the diagnostic criteria used to assess polyps, the study setting (academic or community centre), the number of endoscopists taking part in the study and the mean size of polyps diagnosed.
Where possible, the number of TPs, FPs, FNs and TNs were calculated from the raw data. Accuracy figures were calculated to two decimal points. Lesions that were larger than 10 mm or endoscopically assessed as invasive cancer were excluded from the analysis.
Study quality assessment
The included studies were assessed using the revised quality assessment of diagnostic accuracy studies (QUADAS-2) tool, 18 to produce a structured assessment of the risk of bias for each study, and the applicability of the diagnostic study. All seven domains were deemed relevant for inclusion.
To consider the patient selection as ‘unbiased’, we preferred the prospective recruitment of patients presenting for diagnostic colonoscopy, without prior selection (such as faecal occult blood [FOB] testing). To consider the quality of the index test as ‘adequate’, we used real-time prediction of polyp histology performed by the operator during the procedure. We did not include studies in which the images were interpreted post-procedure, from photos or videos. The reference standard was required to be histopathological assessment performed by a blinded expert pathologist. We deemed a ‘bias’ in patient flow and timing to have occurred when the number of patients selected for inclusion did not correspond to the number of patients in the final analysis, without this being adequately accounted for.
Meta-analysis
A bivariate model for diagnostic meta-analysis was used to calculate pooled sensitivity and specificity data. The relationship between sensitivity and specificity was assessed using a summary receiver-operating characteristic (SROC) model. A prediction region within the prediction curve was produced and represents the probability of including the true sensitivity and specificity of a future study.
Heterogeneity was assessed using I2 (0–30% was considered a low level of heterogeneity, 31–60% was considered moderate heterogeneity, and >60% was considered a high degree of heterogeneity).
Trapezoidal integration was used to calculate the pooled area under the curve (AUC) where a value of 1.0 indicates a ‘perfect’ test that gives a 100% correct diagnosis, and 0.5 suggests a test is equally likely to diagnose a positive result as either positive or negative. Tests will have a variable pooled AUC and trend toward 1.0 as diagnostic accuracy improves. We used Stata version 15 (StataCorp, College Station, TX, USA) for all statistical meta-analyses.
Meta-regression analysis was performed incorporating the clinical setting (academic or community), the proportion of adenomatous polyps versus hyperplastic, and the criteria used for optical biopsy.
The meta-analysis calculated the diagnostic odds ratio (OR) of i-scan optical diagnosis, for adenomatous histology. This is a measure of the efficacy of a binary diagnostic test that evaluates the odds of test positivity in the presence of disease relative to the odds of test positivity in the absence of disease. Cook’s distance was calculated to assess for influential studies and Deeks’ test was calculated to assess for publication bias. 19
Results
Eligible studies
Following the initial database searches and removal of duplicate records, 1925 citations were identified as potentially eligible for inclusion. Following screening of the titles, a high proportion of studies were not relevant or were concerned with other endoscopic imaging modalities, and on this basis 1783 citations were excluded. A further 64 studies were excluded on abstract review. A total of 78 studies were therefore subject to full text review, of which 15 satisfied the inclusion and exclusion criteria, and were included in the final analysis. A flow diagram of the eligibility process is shown in Figure 1.

PRISMA flow diagram.
Study characteristics
The main characteristics of the included studies are listed in Table 1. A total of 15 studies were included; all contained percentage sensitivity and specificity data or contained data sufficient to calculate sensitivity and specificity.20–34 All histological predictions were made at the time of colonoscopy (studies using post-procedure analysis of video or still images were excluded). All studies used high-definition equipment, and two studies allowed the use of electronic magnification, at the discretion of the endoscopist.20,22 A total of 13 studies recruited patients prospectively. In two studies, the patients were included after retrospective recruitment of cases.31,33 The publication dates for the included studies spanned from 2009 to 2015. One study reported data for small and diminutive polyps separately; these data sets were therefore entered into the meta-analysis separately. 34 A total of 2817 polyps were included in the analysis.
Study characteristics.
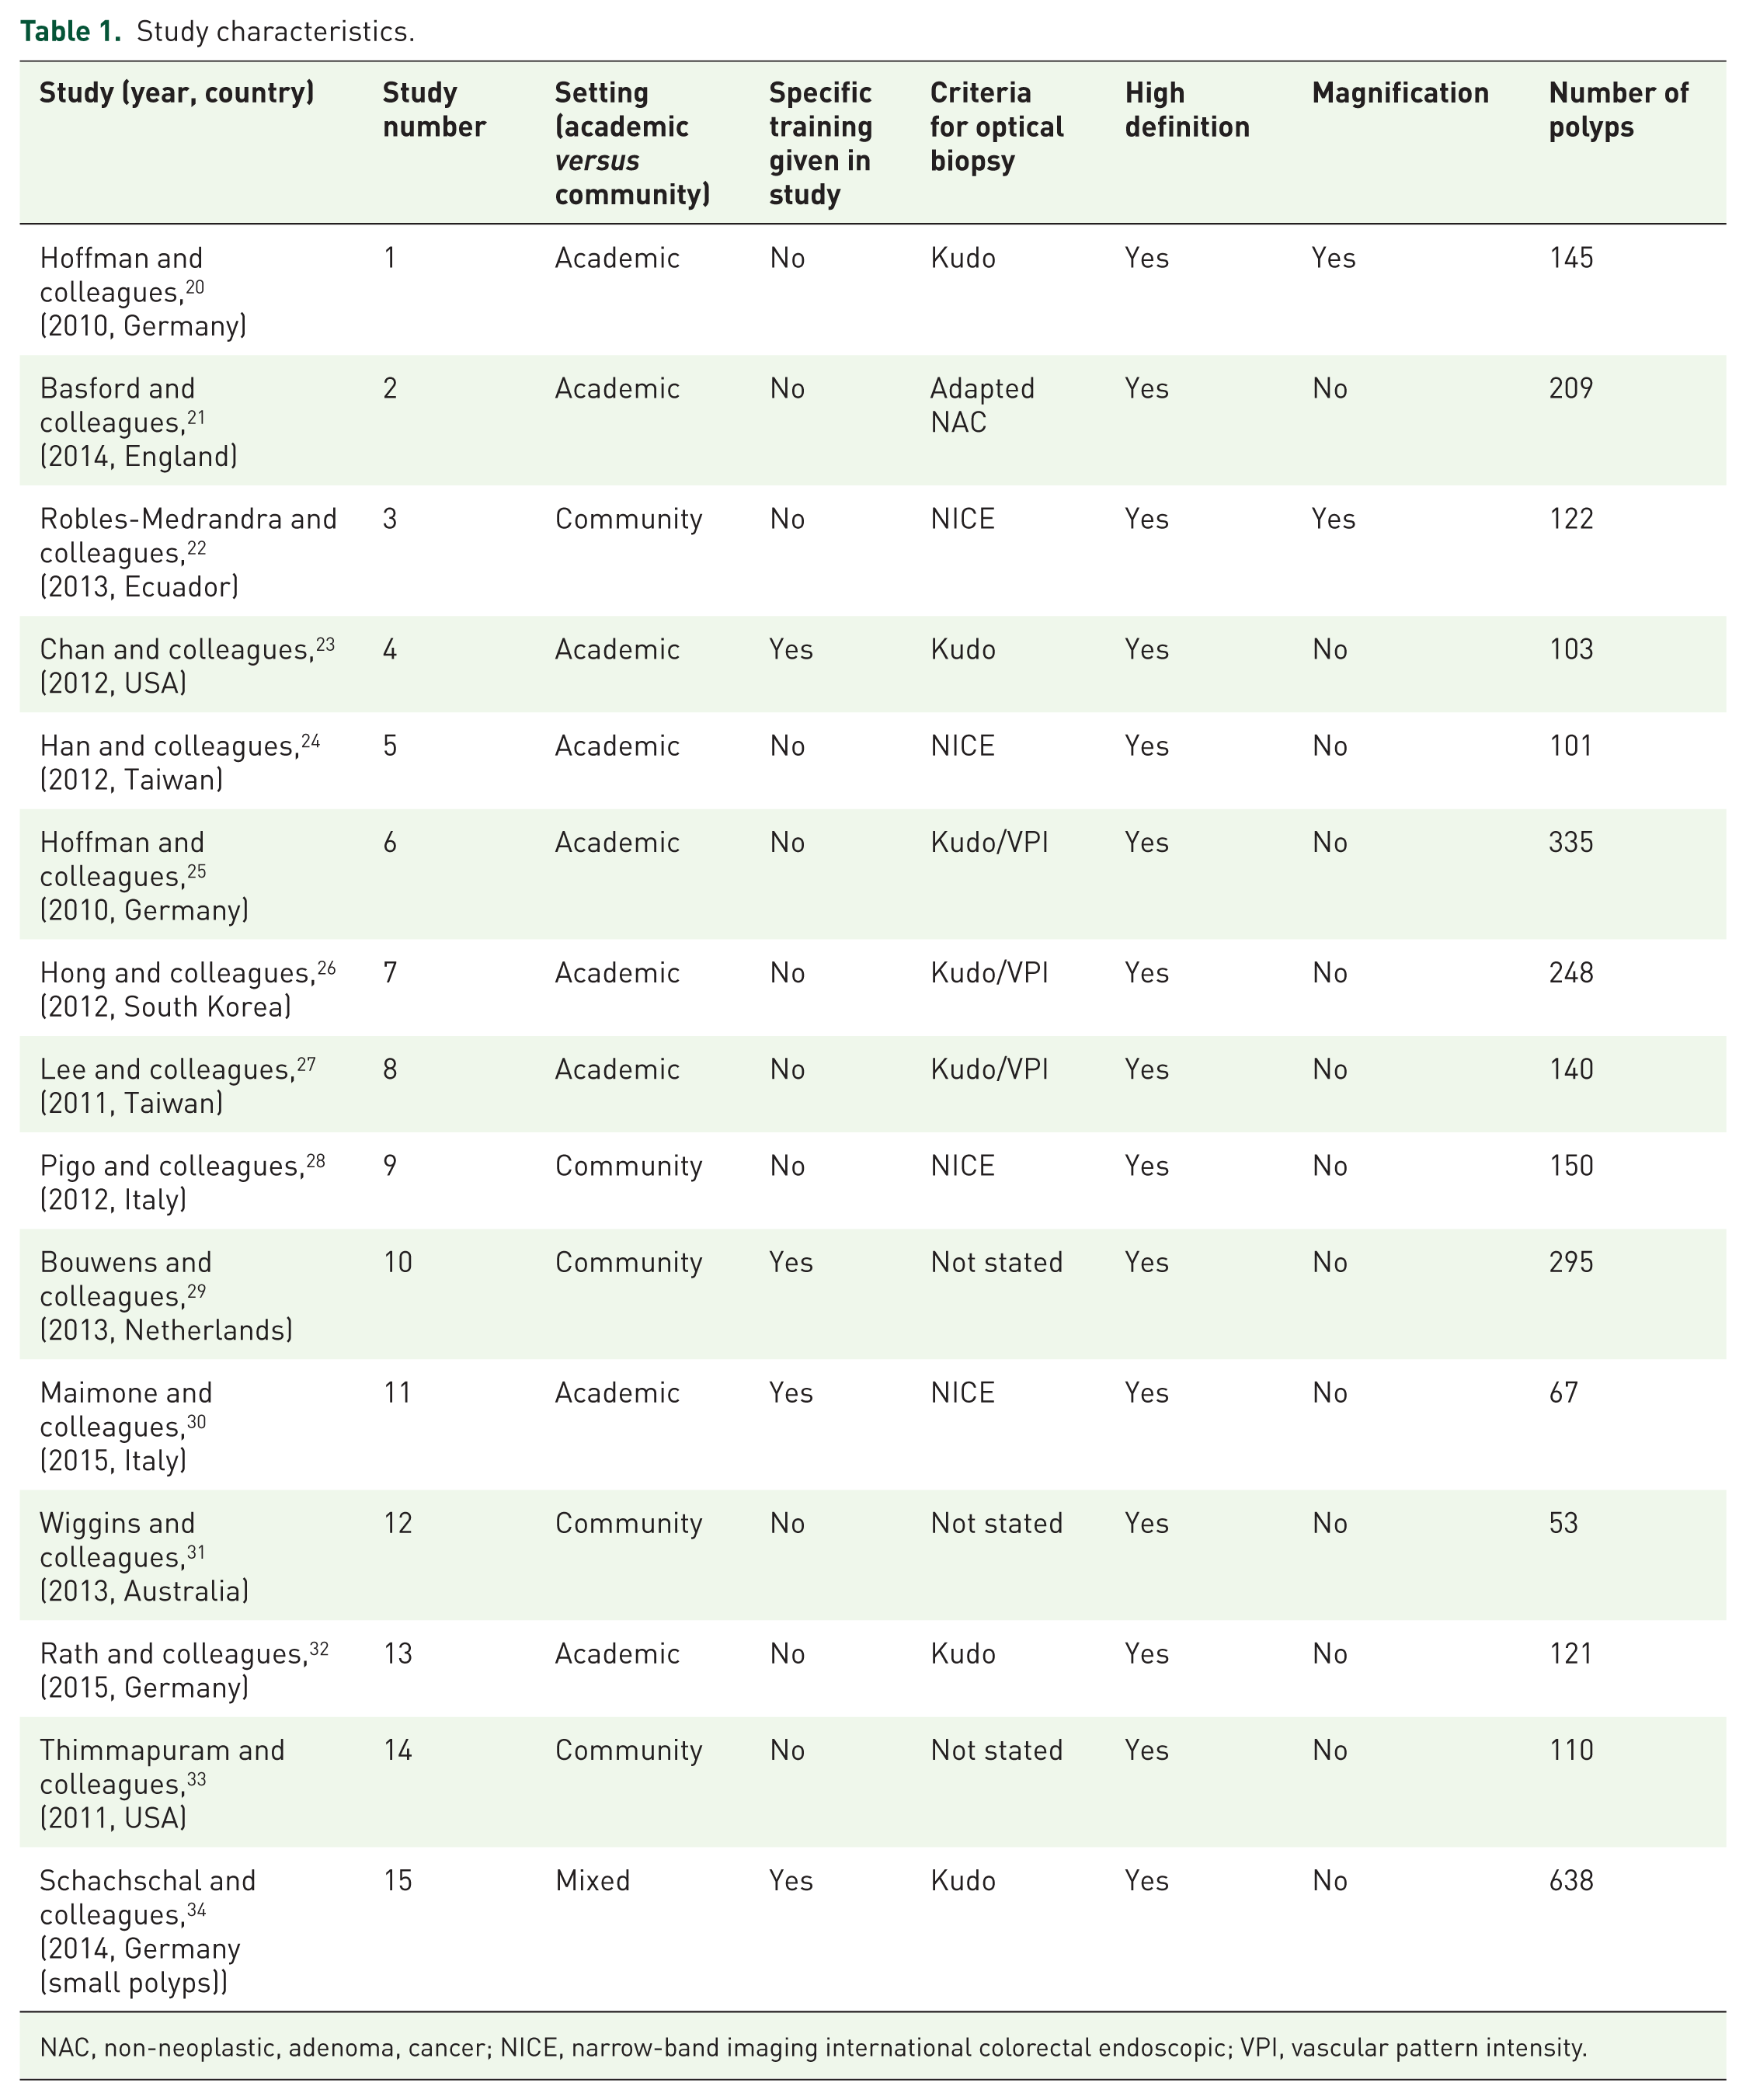
NAC, non-neoplastic, adenoma, cancer; NICE, narrow-band imaging international colorectal endoscopic; VPI, vascular pattern intensity.
Quality assessment
The quality of the included studies was assessed according to the QUADAS-2 tool. The results are displayed in Appendix 2 and represented graphically in Appendix 3. There were two studies in which patients were recruited retrospectively after their colonoscopy.31,33 One study used user-defined i-scan settings rather than standard settings. 22 One study contained both retrospective and prospective assessments of histology. Only the prospective data were included in this analysis. 24 There was one study which only included patients who had a positive faecal occult blood test, which could limit the applicability of the results. 21 One study analyzed polyps from the distal colon only. 20 Overall, the studies met most of the quality criteria.
Tests of diagnostic accuracy
A bivariate model was applied to the 15 studies. The pooled sensitivity of i-scan to predict polyp histology was 0.92 [95% confidence interval (CI) 0.85–0.95]. The pooled specificity was 0.90 (95% CI 0.83–0.94). The diagnostic OR was 96 (95% CI 33–279). The pooled, weighted AUC was 0.96 (95% CI 0.94–0.98), indicating that optical diagnosis by i-scan is highly accurate. Figure 2 illustrates the bivariate SROC graph, including the 95% confidence region and the 95% prediction region. Hierarchical summary receiver-operating characteristics (HSROCs) were modelled, and also demonstrated an AUC of 0.96. This is plotted in Figure 3.
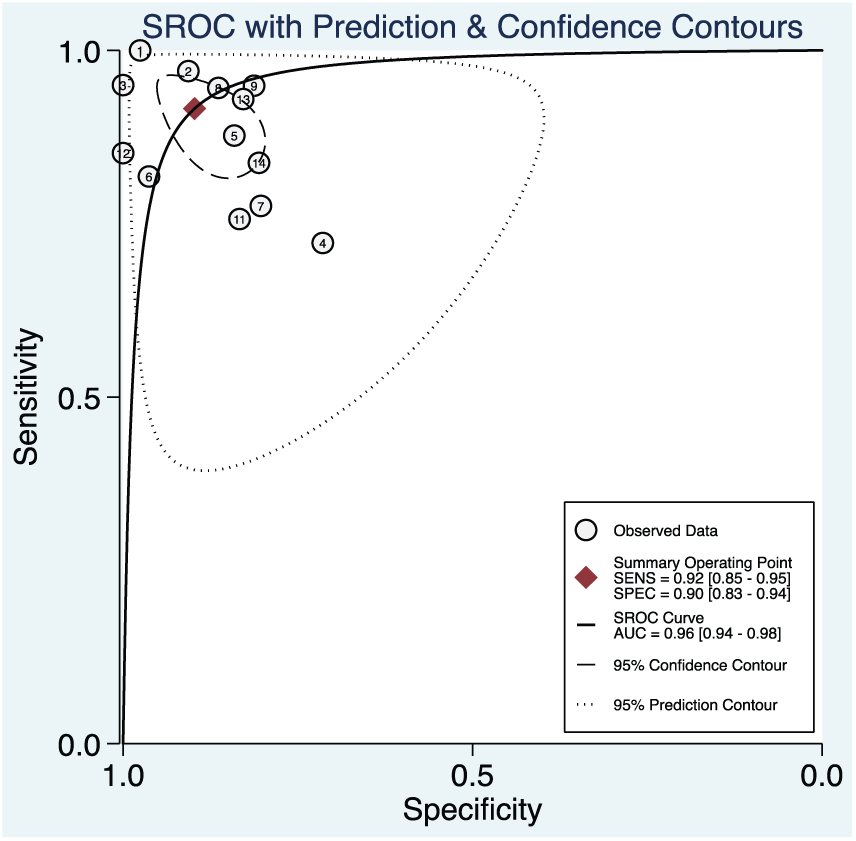
Bivariate analysis SROC curve.

HSROC curve.
Subgroup analysis was performed using univariable meta-regression for the diagnostic criteria used in the studies [Kudo, vascular pattern intensity (VPI), NICE, or novel classification systems]. This did not find significant differences in the subgroups. Meta-regression of the study setting (academic versus community) also did not find significant differences between the subgroups.
Heterogeneity
The heterogeneity of the studies was defined with an I2 of 0, indicating a low degree of heterogeneity within the studies.
Publication bias estimate
We used Deeks’ funnel plot to assess the potential publication bias within the meta-analysis. 35 Figure 4 demonstrates a symmetrical funnel plot, suggesting that publication bias is absent (p = 0.86).

Deeks’ funnel plot asymmetry test.
Discussion
This meta-analysis aims to update the current evidence for the diagnostic accuracy of i-scan technology, for prediction of histology of small colorectal polyps. Previous meta-analyses have demonstrated a high level of diagnostic accuracy but have included some studies performed using post-procedure analysis of static images or of videos, rather than real-time diagnosis. Post-procedure analysis may be associated with photographic selection bias, and may not represent the real-life lesion prevalence, with subsequent effects on the diagnostic accuracy calculations. This meta-analysis has excluded those studies, so reports data with greater clinical relevance and avoidance of bias15,16
The results of this analysis suggest that i-scan has accurate diagnostic performance, with an AUC of 0.96 when modelled with bivariate analysis and an area under HSROC of 0.97. This outcome is very similar to previous modelling which suggested area under HSROC of 0.97. 15 The sensitivity and specificity reported in this analysis (0.92 and 0.90) are slightly higher than 89.3% and 88.2% respectively, reported in other meta-analyses. 16 It is of interest that the studies performed in teaching hospitals and general hospitals did not show significantly different outcomes. Previous studies in IEE have demonstrated good diagnostic accuracy in expert hands, which has not been reproduced in a generalist setting.12,36 The adoption of objective classification systems and increased familiarity with IEE may be contributing factors to an overall improved diagnostic accuracy. The use of magnifying endoscopy was not associated with an improved diagnostic accuracy, neither was any classification system.
There were inadequate data to provide updated meta-analysis of predicted surveillance intervals, as no additional data were available since the most resent large analysis in 2013. 16 The studies analyzed here have varying approaches to categorizing the location of polyps, and therefore this analysis refers to small and diminutive polyps throughout the colon. Diagnostic accuracy for diminutive rectal polyps alone has not been assessed. Therefore, although the overall diagnostic accuracy appears high, further data would be required to definitively reach the accuracy thresholds specified in the American Society for Gastrointestinal Endoscopy (ASGE) preservation and incorporation of valuable endoscopic innovations (PIVI) criteria and support a resect and discard approach using i-scan technology. 3
The field of IEE continues to progress rapidly. A recent development is the introduction of i-scan with optical enhancement (OE). 37 This technology applies the digital image processing algorithms, with the addition of an optical filter, with the aim of providing peak luminescence at the peaks of the haemoglobin absorption spectrum, and further enhancing mucosal and vascular pattern visualization. The introduction of i-scan OE may further improve diagnostic accuracy, and the results from early prospective studies are encouraging, demonstrating diagnostic accuracy of 93% and agreement with surveillance intervals >90%. 38 Trial design for studies of i-scan OE technology should make reference to the ASGE PIVI standards, particularly for negative predictive values for diminutive polyps in the rectosigmoid, and for agreement with surveillance intervals in the proximal colon. In addition, standardized classification systems should be applied. In particular the new simplified identification method for polyp labeling during endoscopy (SIMPLE) classification has been validated for use with i-scan OE. 39
Conclusion
This meta-analysis has examined the evidence for real-time diagnostic accuracy of i-scan. Our results show a sensitivity of 0.92 and specificity of 0.90, for diagnosing adenomatous histology. A similar accuracy is achieved in both teaching and district general hospitals. These results suggest that optical diagnosis of colorectal polyps <10 mm using i-scan is clinically feasible, and applicable by the nonexpert endoscopist. This may have significant benefits for patients and for healthcare systems, by reducing the financial and medical burden of unnecessary polypectomy.
The accepted requirements for diagnostic accuracy of a new technology are set out in the PIVI criteria. This meta-analysis provides evidence in support of i-scan as a tool for real-time diagnosis of small polyp histology but falls short of meeting the PIVI criteria in full. This is due in part to the lack of new evidence regarding surveillance interval concordance, and in part to the lack of evidence specifically referring to rectosigmoid polyps. Future areas of study should aim to characterize the negative predictive value of i-scan for rectosigmoid polyps, and to determine the agreement with colonoscopic surveillance intervals predicted by i-scan versus those determined by histology.
Footnotes
Appendix
Quality scoring and outcomes.

| Author | Study no. | QUADAS-2: risk of bias | QUADAS-2: applicability concerns | |||||
|---|---|---|---|---|---|---|---|---|
| Patient selection | Index test | Reference standard | Flow and timing | Patient selection | Index test | Reference standard | ||
| Hoffman 20 | 1 | Low | Low | Low | Low | Low | Low | Low |
| Basford 21 | 2 | Low | Low | Low | Low | Unclear | Low | Low |
| Robles-Medranda 22 | 3 | Low | High | Low | Unclear | Low | High | Low |
| Chan 23 | 4 | Low | Low | Low | Low | Low | Low | Low |
| Han 24 | 5 | Low | High | Low | Low | Low | High | Low |
| Hoffmann 25 | 6 | Low | Low | Low | Low | Low | Unclear | Low |
| Hong 26 | 7 | Low | Low | Low | Low | Low | Low | Low |
| Lee 27 | 8 | Low | Low | Low | Low | Low | Low | Low |
| Pigo 28 | 9 | Low | Low | Low | Low | Low | Low | Low |
| Bouwens 29 | 10 | Low | Low | Low | Low | Low | Low | Low |
| Maimone 30 | 11 | Low | Low | Low | Low | Low | Low | Low |
| Wiggins 31 | 12 | Unclear | Unclear | Low | Low | Unclear | Low | Low |
| Rath 32 | 13 | Low | Low | Low | Low | Low | Low | Low |
| Thimmapuram 33 | 14 | Unclear | High | Low | Low | Low | Low | Low |
| Schachschal 34 | 15 | Low | Low | Low | Low | Low | Low | Low |
QUADAS, quality assessment of diagnostic accuracy studies.
Funding
This research received no specific grant from any funding agency in the public, commercial, or not-for-profit sectors.
Conflict of interest statement
The authors declare that there is no conflict of interest.